





Abstract
Generally, the machining vibration frequency spectrum is dominated by the tooth cutting frequency and its harmonics, the part structure and its natural frequency, and the spindle-tool subsystem natural frequency, exhibiting full-oscillatory behaviour. In order to identify the machining status, especially for those thin-walled workpiece machining, the on-machine detected monitoring signals with noise should be decomposed precisely. Actually, the signals’ inherent characteristics, such as the Q-factor, could be employed. In this article, decomposition of the full-oscillatory components from noisy machining vibration signals by minimizing the Q-factor variation is presented. The Q-factor will be calculated using quadratic interpolation of linear prediction coefficients. On this basis, the measured signals can be decomposed into high-, low- and residual-oscillatory signal components using the sparsity-enabled signal analysis. Furthermore, the signal decomposition process is repeated iteratively until the minimization of the Q-factor variation. Finally, the simulation and the thin-walled machining experiments were designed. From comparison of the signal decomposition results with the wavelet packet transform (WPT), it was shown that the signal decomposition accuracy and reliability using the proposed strategy has been improved significantly.
Introduction
High-performance parts with thin-walled structures to be machined have been widely employed in aerospace fields. Unfortunately, machining vibration is always inevitable due to its significant low rigidity (Quintana and Ciurana, 2011), which imposes a negative effect on the productivity including poor surface quality and low dimensional accuracy. Furthermore, it generates excessive noise and aggravates cutting-tool wear. To maintain a high level of machining efficiency and reliability, it is necessary to identify and predict the machining status using the on-machine detected monitoring signals. Generally, the vibration frequency spectrum is dominated by the tooth cutting frequency and its harmonics, the part structure and its natural frequency, and the spindle-tool subsystem natural frequency (Davies and Balachandran, 2000; Kolluru and Axinte, 2013). In fact, the measured machining vibration signals mainly contain three main components: chatter-related signals characterized by low oscillation, periodic cutting excitation signals characterized by high oscillation and noise signals (i.e. other extraneous signals with stochastic oscillation). Thus, it essentially exhibits full-oscillatory behaviours. Generally, the original frequency and/or time domain signals without decomposition are directly used to estimate and predict the current machining status. However, only the rough machining status can be obtained. The reliability for confirming the machining vibration diagnosis is very poor and sometimes leads to error results. Decomposing the detected signals and finding the status-sensitive components can supply an efficient solution. However, it is difficult to decompose the full-oscillatory signals into different components and extract the periodic transient components related to machining chatter.
As the key point of machining stability monitoring, the chatter feature extraction from vibration signals has been studied in the last decades. In a traditional way, frequency-based analysis and filtering have been widely employed as a fundamental tool in signal processing. Furthermore, some advanced signal process techniques have been developed for the fault feature extraction in different fault diagnosis areas, such as short-time Fourier transformation (STFT) (Klein et al., 2001), wavelet transformation (WT) (Peng and Chu, 2004), ensemble empirical mode decomposition (EEMD) (Cao et al., 2015; Lei et al., 2013), blind source separation (BSS) (Guo et al., 2014) and tunable Q-factor wavelet transform (TQWT) (Selesnick, 2011a). Moreover, the aforementioned methods have also been combined together systematically (Bin et al., 2012; Han et al., 2015; Peng et al., 2005; Shao et al., 2011) or improved (Hoell and Omenzetter, 2016) to make full use of advantages and avoid the disadvantages. In these methods, the TQWT performs excellent signal analysis especially for signals with different oscillatory behaviours by adjusting the Q-factor, and redundancy to match the oscillatory behaviour of the wavelet basis with that of the signal of interest. For the signal that is a mixture of multiple signal components with different oscillatory properties, Selesnick (2011b) proposed a new sparsity-enabled signal analysis method with two distinct Q-factor transforms simultaneously. Cai et al. (2013) proposed a new fault feature extraction technique for gearboxes using sparsity-enabled signal analysis method and investigated the effect of two parameters pertinent to morphological component analysis (MCA) and split augmented Lagrangian shrinkage algorithm (SALSA), the Lagrange multiplier and the penalty parameter. A novel method for the original signal of a rolling bearing’s early weak fault was decomposed by EEMD first and the intrinsic mode function (IMF) with the biggest kurtosis index value selected and handled by the TQWT subsequently is proposed (Wang et al., 2014). Lastly, the envelope demodulation method was applied on the low Q-factor transient impact component and a satisfactory extraction result was obtained. He et al. (2013) proposed a denoising method based on the tunable Q-factor using neighbouring coefficients. Zhang et al. (2014) proposed an application of wavelet transform with a tunable Q-factor to analysis of non-stationary harmonics.
However, the determination of the Q-factor lacks quantitative criteria, which has increased the instability of the decomposition result and limited the TQWT application. In the research mentioned above, the determination of the Q-factor is based on two strategies. One, counting the oscillation number of the periodic transient signals becomes a way of determining the Q-factor. In a sense, the Q-factor determines the oscillation times of the wavelet waveform (the wavelet with Q-factor of Q sustained about 2Q times oscillations; Selesnick, 2011b). However, in engineering, the waveform of the chatter components is unknown and the Q-factor is rarely determined in advance. As an alternative, for calculating convenience, the Q-factor has been determined as a compromise between calculating efficiency and frequency resolution in a high-frequency band. The value of the Q-factor reflects the frequency resolution and the high-oscillatory components need a higher frequency resolution than the low-oscillatory components. For the low-frequency band, the frequency resolution can be preserved regardless of the value the Q-factor and redundancy, but for the high-frequency band, higher frequency resolution can be achieved by increasing Q-factor and redundancy. As a result, more decomposition levels are needed to cover a wide frequency range, which will in turn reduce the calculating efficiency inevitably. The trade-off between frequency resolution and computational efficiency limits the performance of the TQWT. Luo et al. (2013) proposed a kurtosis-guided adaptive demodulation technique for bearing fault detection based on TQWT. From two steps of merging of the band-pass filters of the TQWT, the optimal filter for the Hilbert demodulation analysis is obtained. However, only the maximum allowable decompositions for a given (Q, R) combination have been used in this method and the Q-factor was given by experience.
Aiming at this problem, a comprehensive strategy by combining the sparsity-enabled signal analysis method and precise calculation of Q-factor is developed to decompose full-oscillatory components from noisy machining vibration signals. Based on the resonance peak calculating method, centre frequency and band width, which determines the value of the Q-factor, can be precisely determined utilizing quadratic interpolation of linear prediction coefficients (LPC). Then, the sparsity-enabled signal analysis method is used iteratively to decompose full-oscillatory components from noisy machining chatter signals into periodic cutting components and transient components, until the minimization of the Q-factor variation.
The paper is organized as follows. The next section describes the principle of TQWT, and the two main aspects of the sparsity-enabled signal analysis, MCA and SALSA is introduced. An iterative algorithm is designed, and simulation study and machining experiments are conducted.
Principle of the TQWT
The TQWT can be realized through a series of band-pass filters. The analysis and synthesis filter banks with J-stage wavelet transform are illustrated in Figure 1 (Cai et al., 2013). TQWT can be implemented by applying inverse over-sampling filter banks with real-value sampling parameters. As shown in Figure 1, the transform consists of a sequence of two-channel filter banks, with the low-pass output of each filter bank being the input of the successive filter bank. By applying two channel filter banks iteratively on the low-pass channel iteratively followed by the low-pass scaling parameter
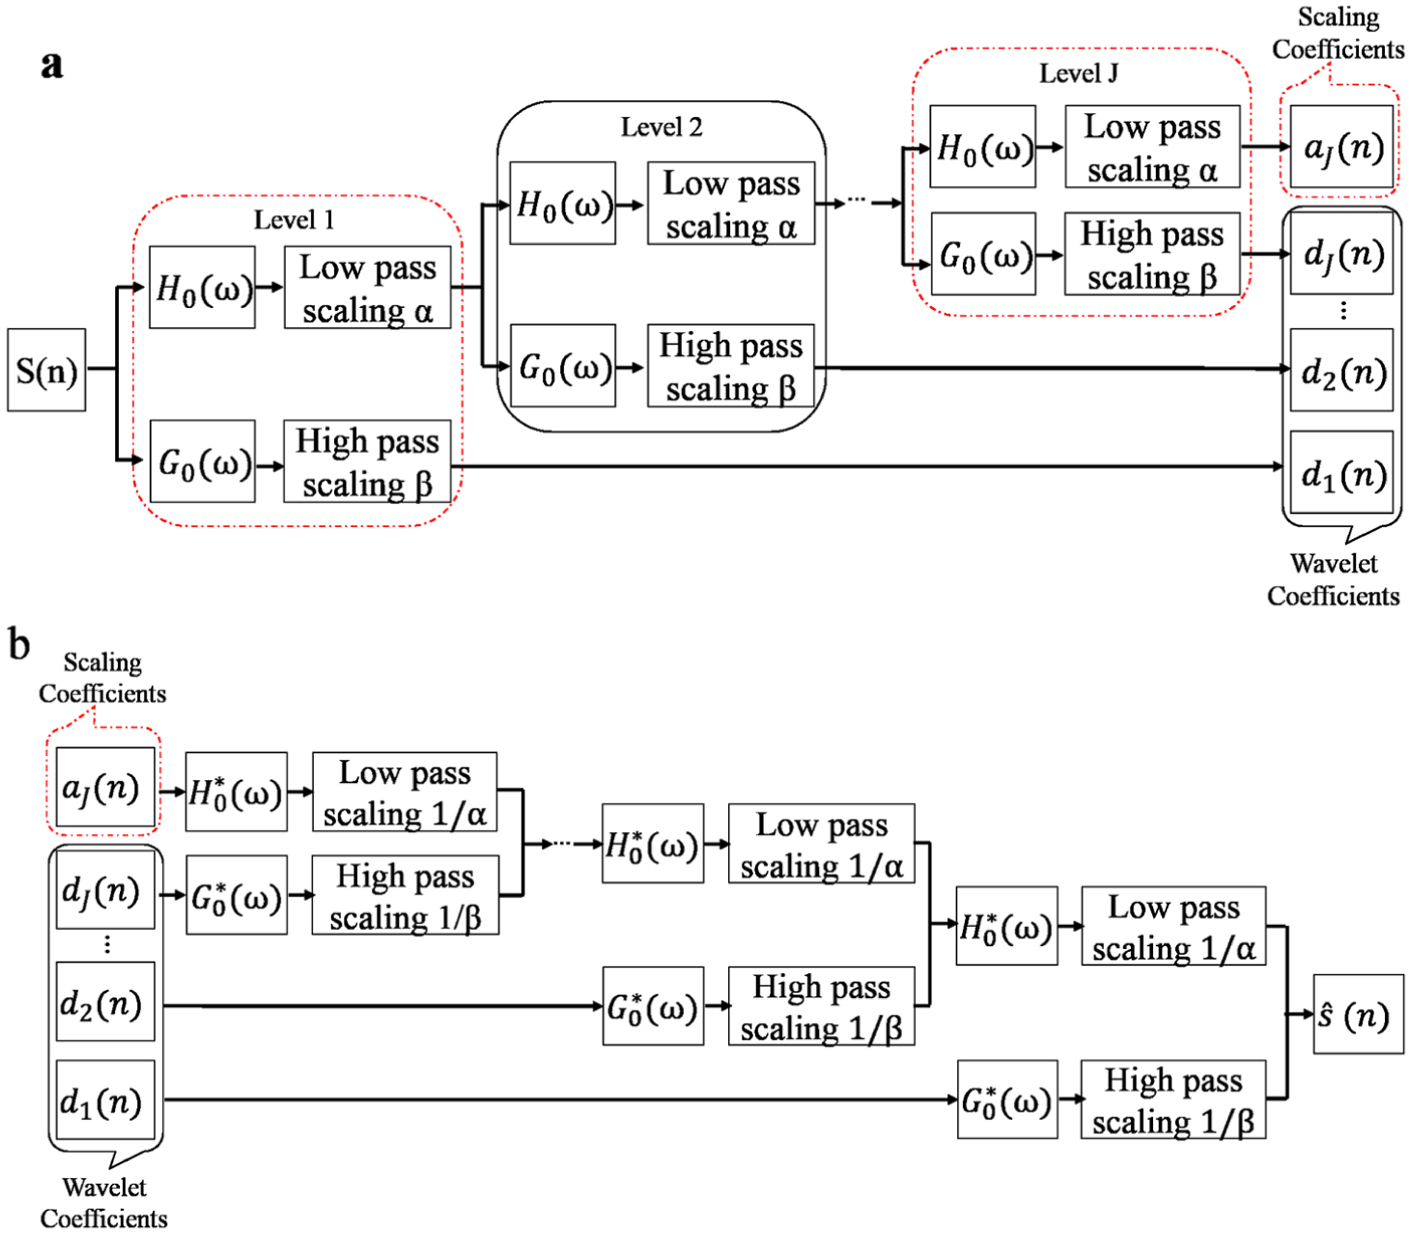
Two-channel filter banks for tunable Q-factor wavelet transform (TQWT): (a) decomposition filters, (b) synthesized filters.
The frequency responses
where
The first two formulas ensure that the wavelet transform will not be overly redundant and the last one ensures the strictly oversampled for perfect signal reconstruction and filter banks accurate response.
The TQWT can be implemented with the Radix-2 Fast Fourier Transforms. With the defined linear matrix
Sparsity-enabled signal analysis method
The sparsity-enabled signal analysis method is based on signal resonance, rather than on frequency or scale. In this method, MCA is used to construct the objective function and decompose the signal non-linearly, and a SALSA is used to minimize the objective function of MCA. Finally, the signal components with different oscillatory properties can be obtained.
Morphological component analysis (MCA)
For the full-oscillatory signal s, which is the sum of multiple oscillatory components and noise component,
where n is the error component that cannot be expressed with inverse TQWT (
where
where the Lagrange multipliers
Split augmented Lagrangian shrinkage algorithm
For the mathematical optimization problem of the form in Equation (8), the SALSA proved to be an effective way to solve the optimization problem. The SALSA contains two aspects: variable splitting and an augmented Lagrangian algorithm. Variable splitting mainly solves the optimization problem of the sum of two or more functions. By variable splitting, one of the multiple variables can be substituted and the unconstrained optimization problem, which is hard to solve, can be transformed into a constrained optimization problem, which is easy to solve. The optimization of the objective function in Equation (8) can be written in the following form:
where
With the alternating Lagrangian algorithm (ALM), more particularly, the alternating direction method of multipliers (ADMM), the constrained optimization problem in Equation (9) can be iteratively solved, as shown in Table 1.
Alternating direction method of multipliers.
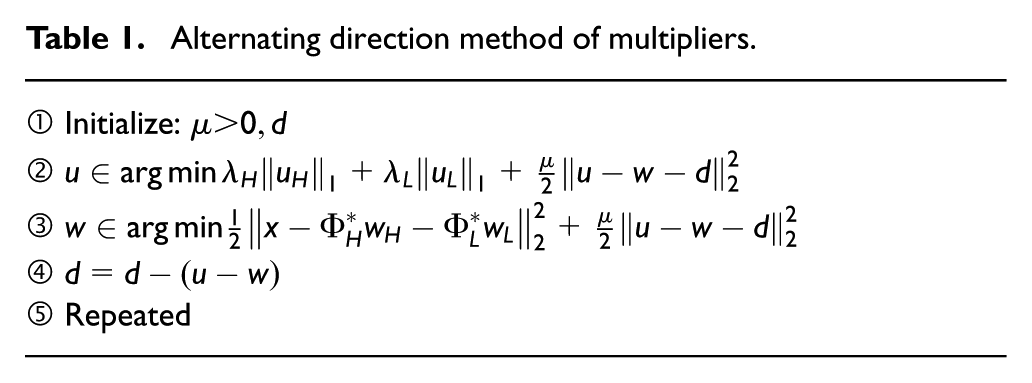
Absolutely, the solution to the minimization problem for ② in Table 1 can be regarded as an
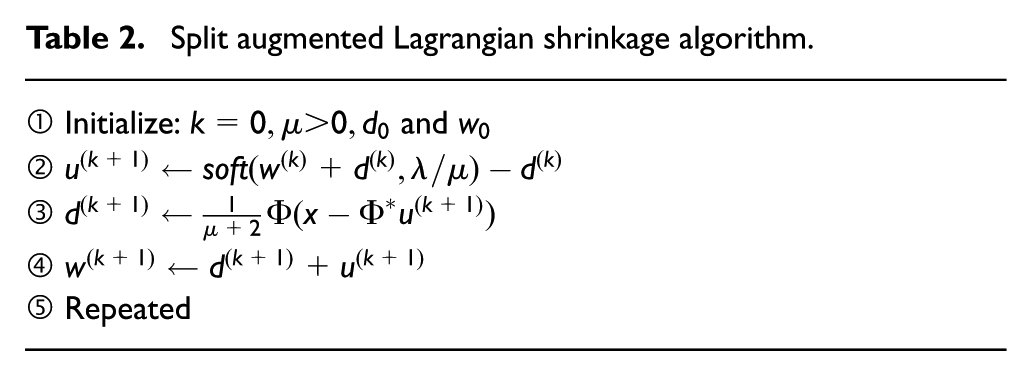
The minimization problem for ③ in Table 1 can be considered a constrained least squares problem to which the solution can be expressed explicitly in matrix form. According to the analysis above, the algorithm can be expressed as shown in Table 2 by simplifying the computational redundancy and slightly rearranging the equations.
Split augmented Lagrangian shrinkage algorithm.
Iterative algorithm
Q-factor precise calculation
The basic principle of the linear prediction analysis is that the current sampling value of the signal can be approximated with a linear combination of some original sampling points. By minimizing the quadratic sum of the difference between the actual sampling value and the predicted value, the only set of prediction coefficients can be determined. Except for the linear prediction function, the LPC can also offer an excellent signal model. The properties of the signal model, including centre frequencies and frequency bandwidth, can be described by the LPC.
According to the principle of the linear predictive analysis, the signal can be represented as the output of a signal model with the input
The transfer function of the model can be represented as the following:
where p and q are the orders of the model, and
For the AR model, the signal can be represented with the difference equation as follows:
Equation (12) indicates that the current output signal derives from the current input signal and linear combination of some original output signals. Then the transfer function of all-pole model can be formulated as follows:
The basic problem of the linear prediction is the determination of the predictor coefficients
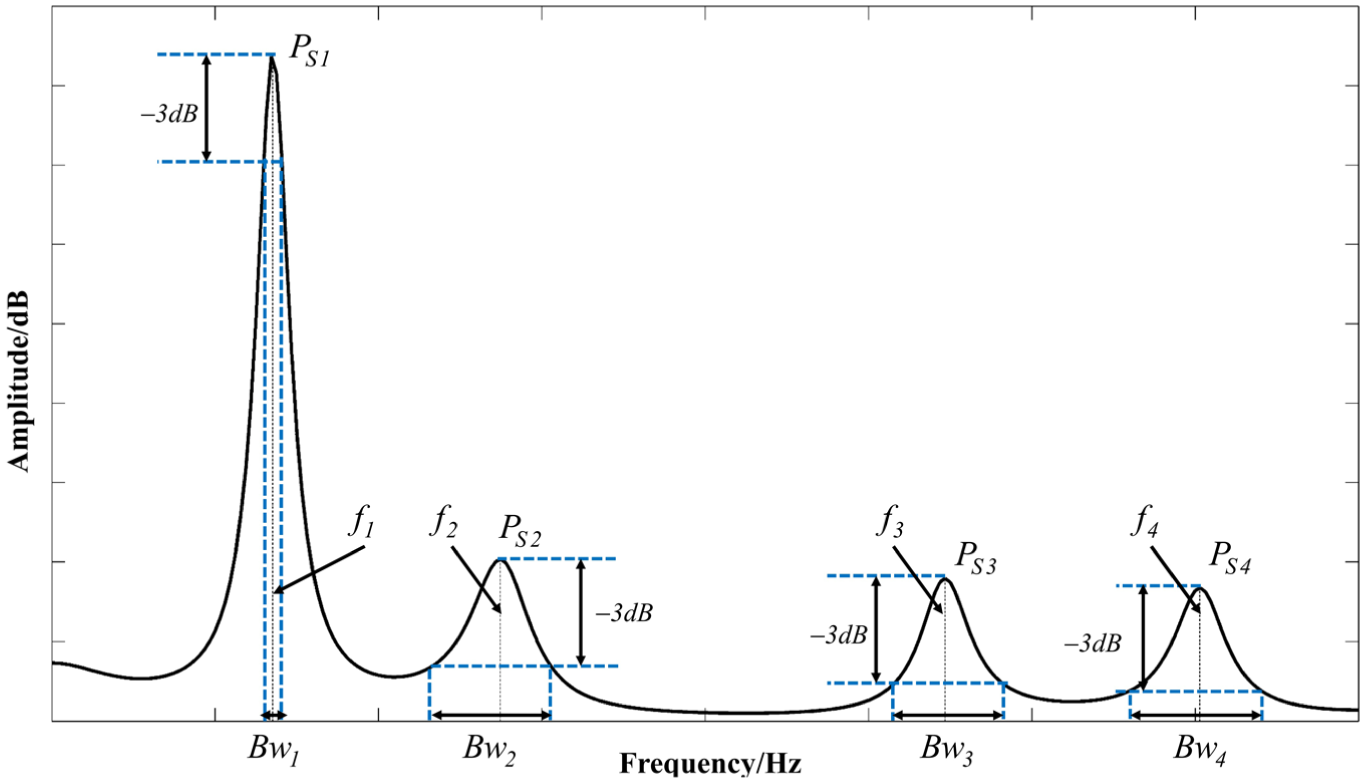
For every peak in the power spectrum response curve shown in Figure 2, the centre frequency and corresponding bandwidth can be calculated with the parabolic interpolation method. Supposing the frequency of a certain local peak to be
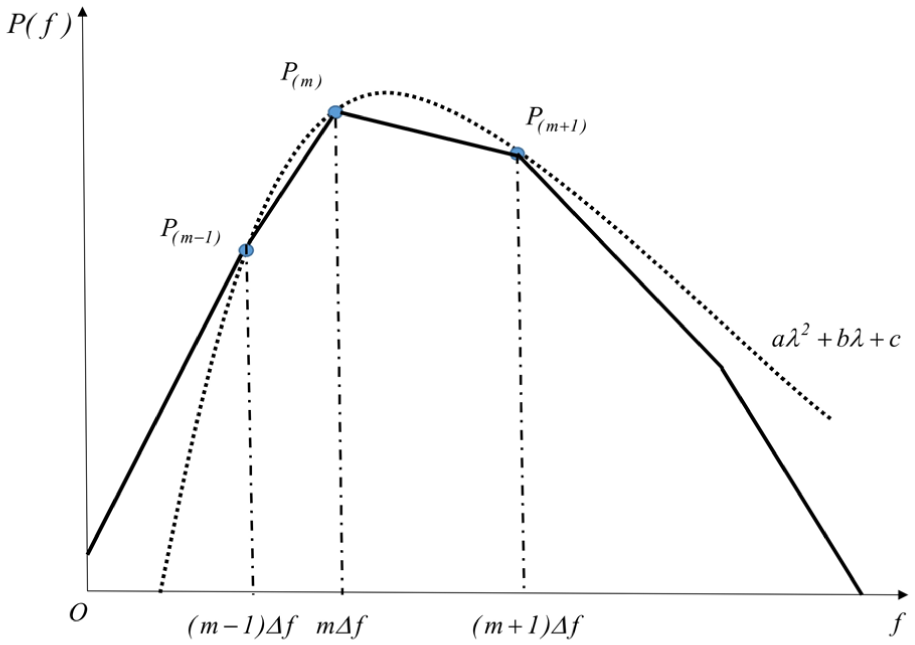
Power spectrum response curve.
For calculating convenience, the original point of the frequency axis is moved to m and the local peak frequency
The coefficients of
where
The responding power spectrum value
The bandwidth
Power spectrum curve after quadratic interpolation.
The power spectrum curve after quadratic interpolation of LPC is shown in Figure 3. As shown in Figure 3, there are four centre frequencies,
Algorithm design
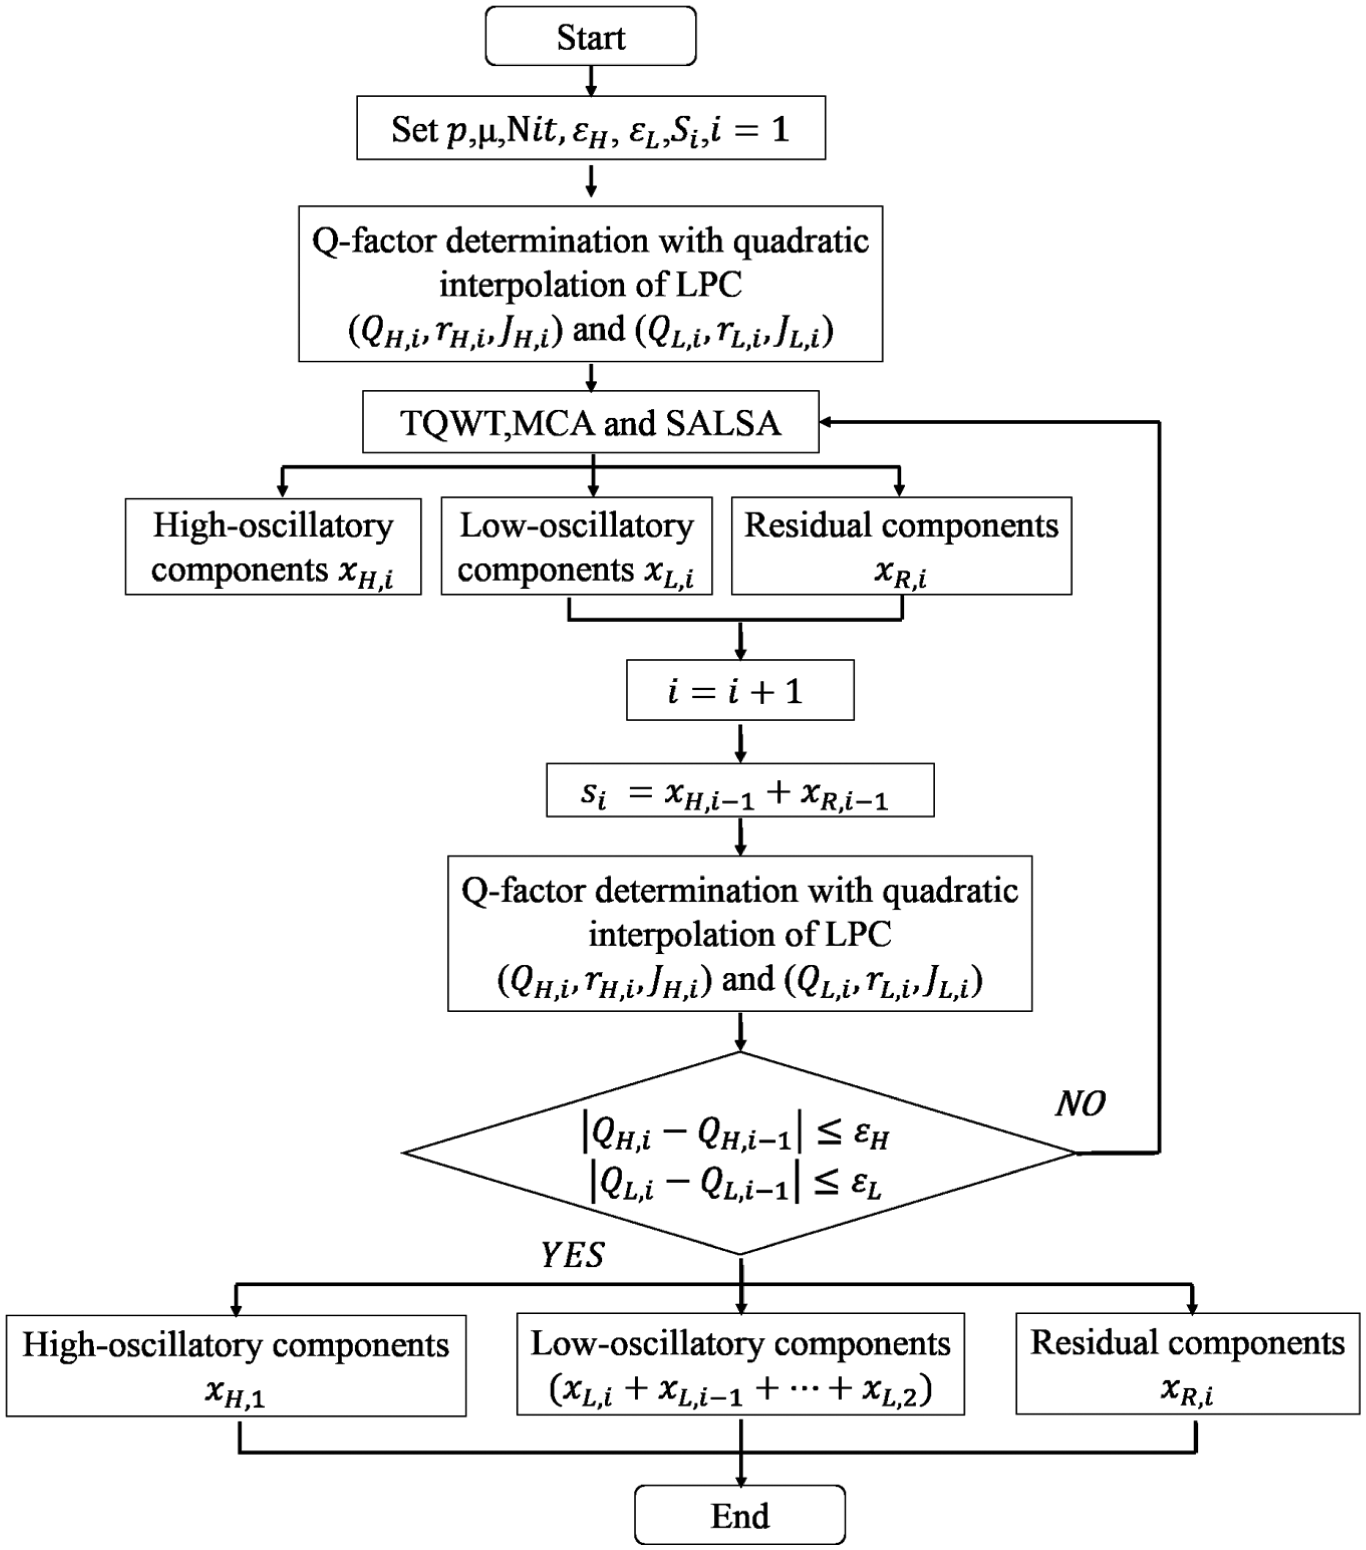
In this paper, a novel signal decomposition method based on joint application of the sparsity-enabled signal analysis method and precise calculation of Q-factor is employed to extract chatter components from the noisy measurement signals. The value of the Q-factor can be updated with quadratic interpolation of LPC, which is obtained from the signal model founded by the measured signal.
The flow chart of the proposed feature extraction technique is illustrated in Figure 4.
Step 1: With the obtained vibration signal
Step 2: Substituting the obtained Q-factors into TQWT and with MCA and SALSA, the original vibration signal are separated into high-oscillatory, low-oscillatory and the residual components.
Step 3: Summing the low-oscillatory and the residual components as the input signal of the new iterative operation, the new signal model is constructed and the new Q-factors are updated.
Step 4: The iterative operation will continue until the difference between the newly updated Q-factors and the previous one is limited within a certain degree. Then the final high- and low-oscillatory components can be obtained.
Flow chart of the iterative algorithm.
Validations
Simulation study
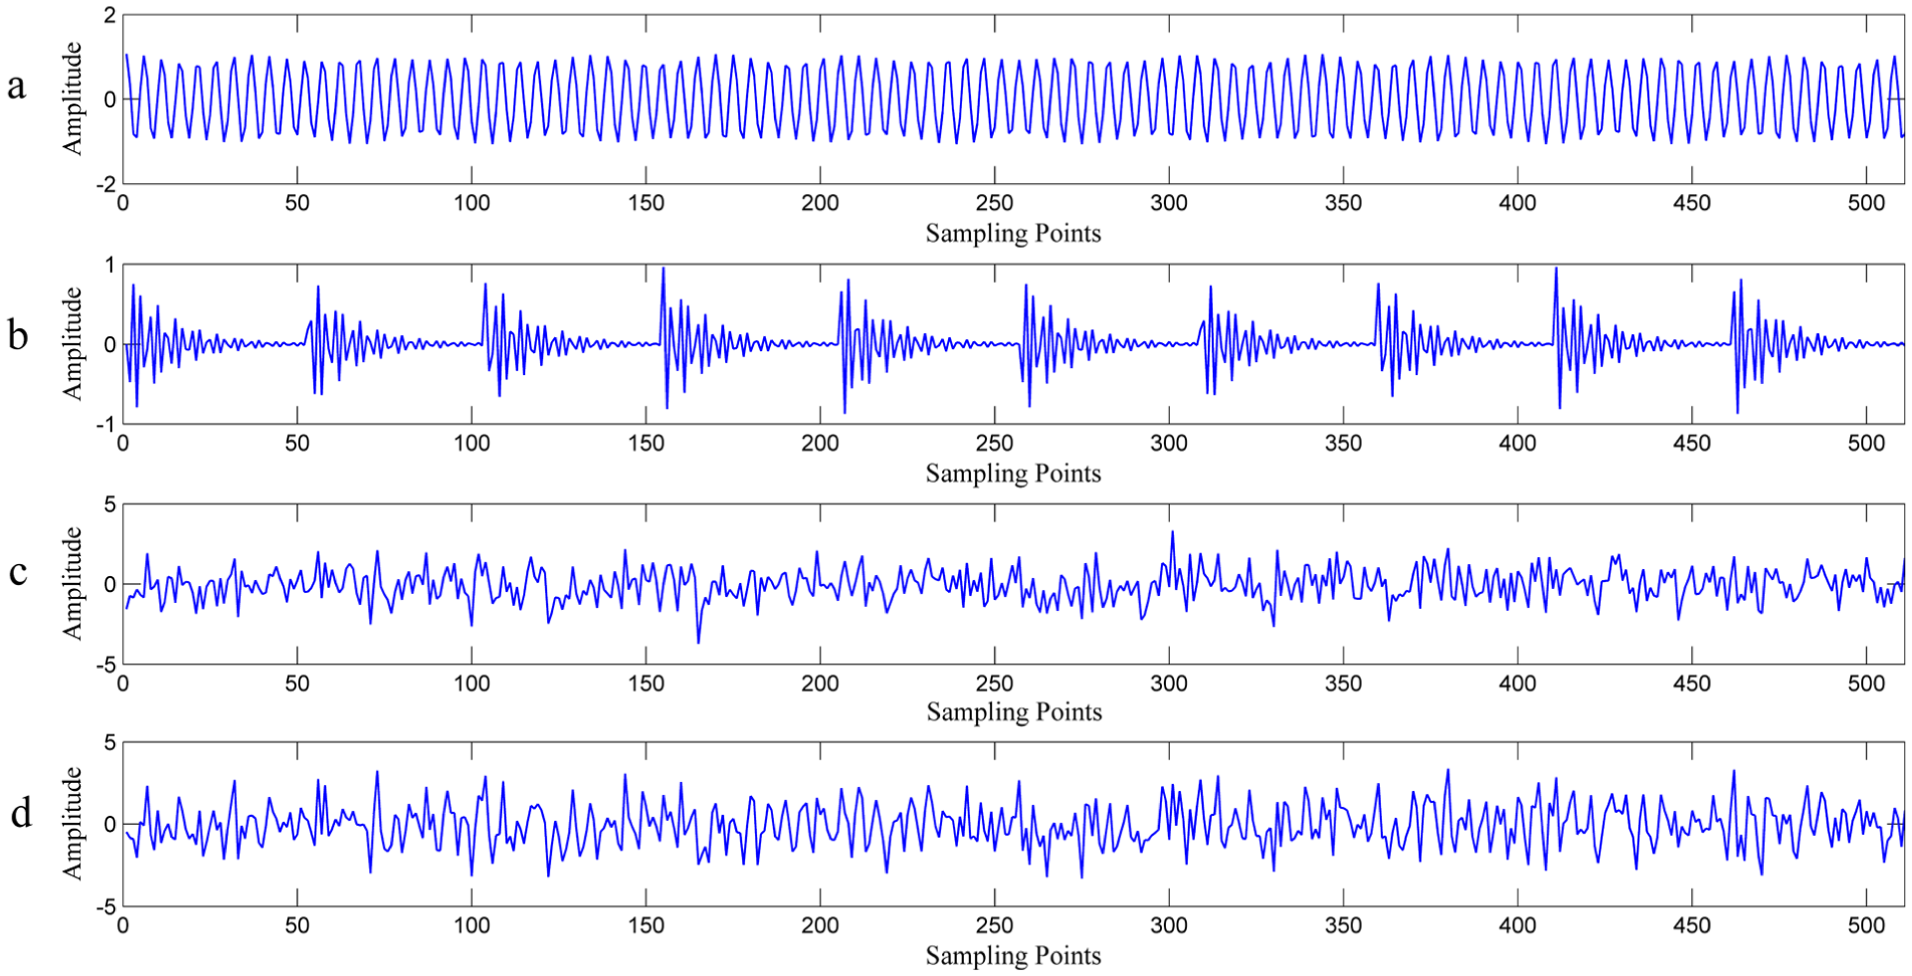
In this section, a simulation signal is constructed to illustrate the effectiveness of the proposed method for signal decomposition, which consists of amplitude-modulated signal as the high-oscillatory components and periodic single-sided transient signal as the low-oscillatory components. Furthermore, the noise is added into the signal to simulate the noisy environment. To illustrate further the effectiveness of the proposed method, the correlation coefficients between the simulation signal and decomposed signal have been calculated.
Considering the characteristics of the signals measured in the thin-walled machining process, the simulation signal
where the first part of the simulation signal
The simulation signal: (a) the amplitude-modulated component
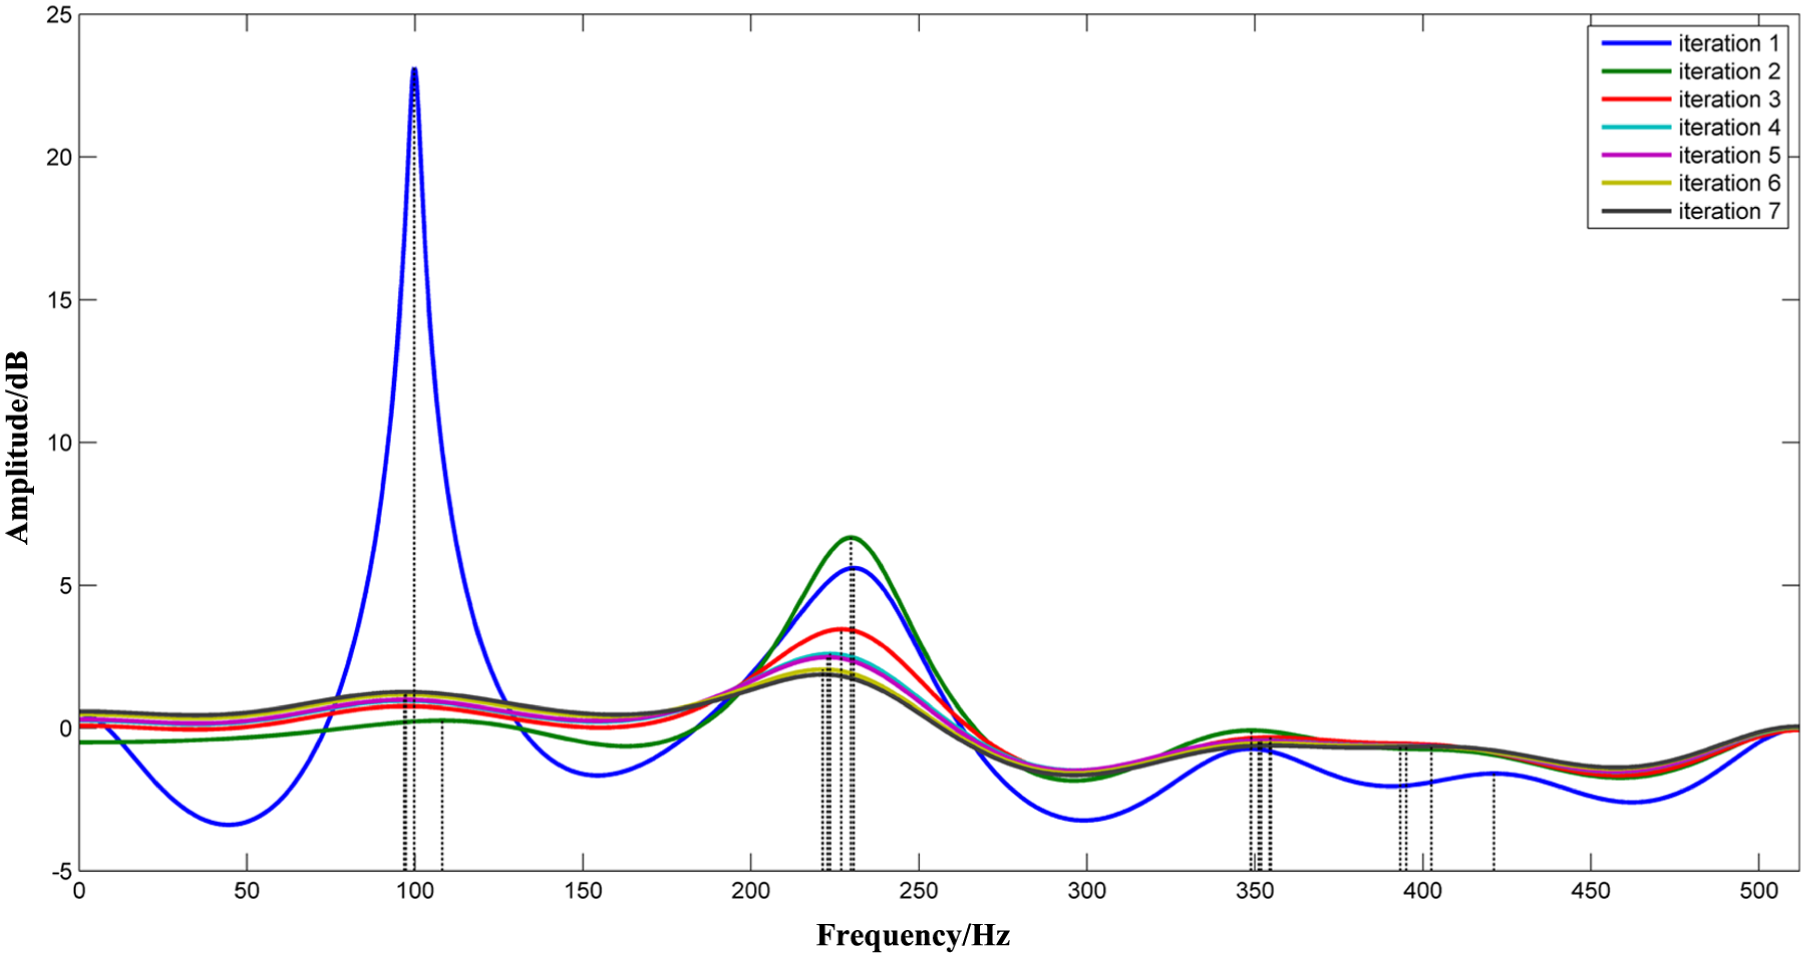
The proposed method is applied to decompose the simulation signals s(t) into the amplitude-modulated component and periodic transient component. In order to guarantee the model of the signal to be all-pole model, the order of the linear prediction coefficient p is set to be 12, and the penalty parameter
Power spectrum response curve after quadratic interpolation.
As shown in Figure 6, there are four main centre frequencies and corresponding band widths. The Q-factors corresponding to the centre frequencies of 100 and 230 Hz reflect the main oscillatory behaviours of the simulation signal and are chosen as the Q-factors of the TQWT. Furthermore, in order to increase the overlap between adjacent subbands and preserve the localization of the certain characteristic of the signal, the redundancies of the TQWT in every iteration are all set to be
Parameters of six iterations.
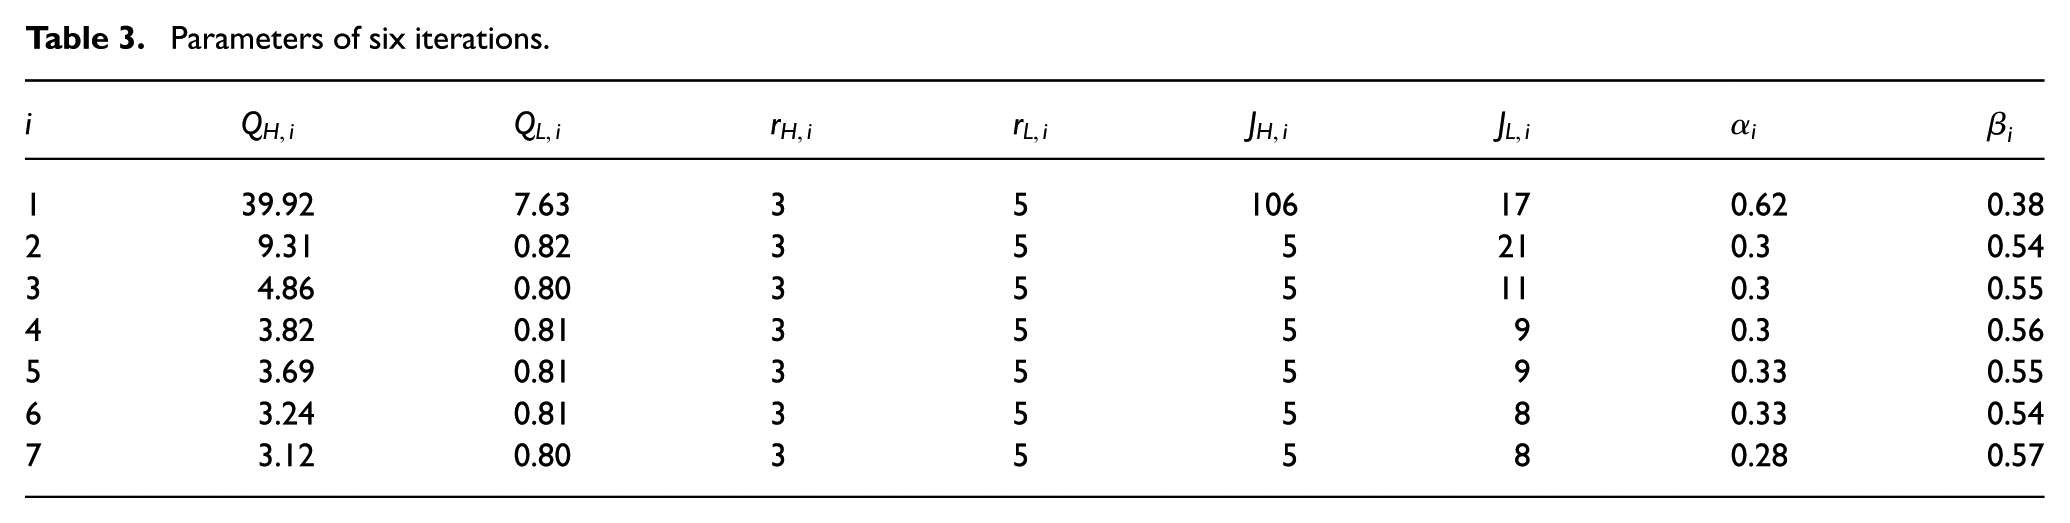
As shown in Table 3, the value of
The correlative coefficients of periodic transient signal between the simulated and decomposed shown in Figure 7 validate the effectiveness of the proposed signal separation method. With the increase of iteration, the correlative coefficients increase continuously and change a little at the sixth and seventh iterations. Figure 7 shows the final decomposed waveform and frequency response of the simulated signal, which show that the periodic transient components have been separated effectively.
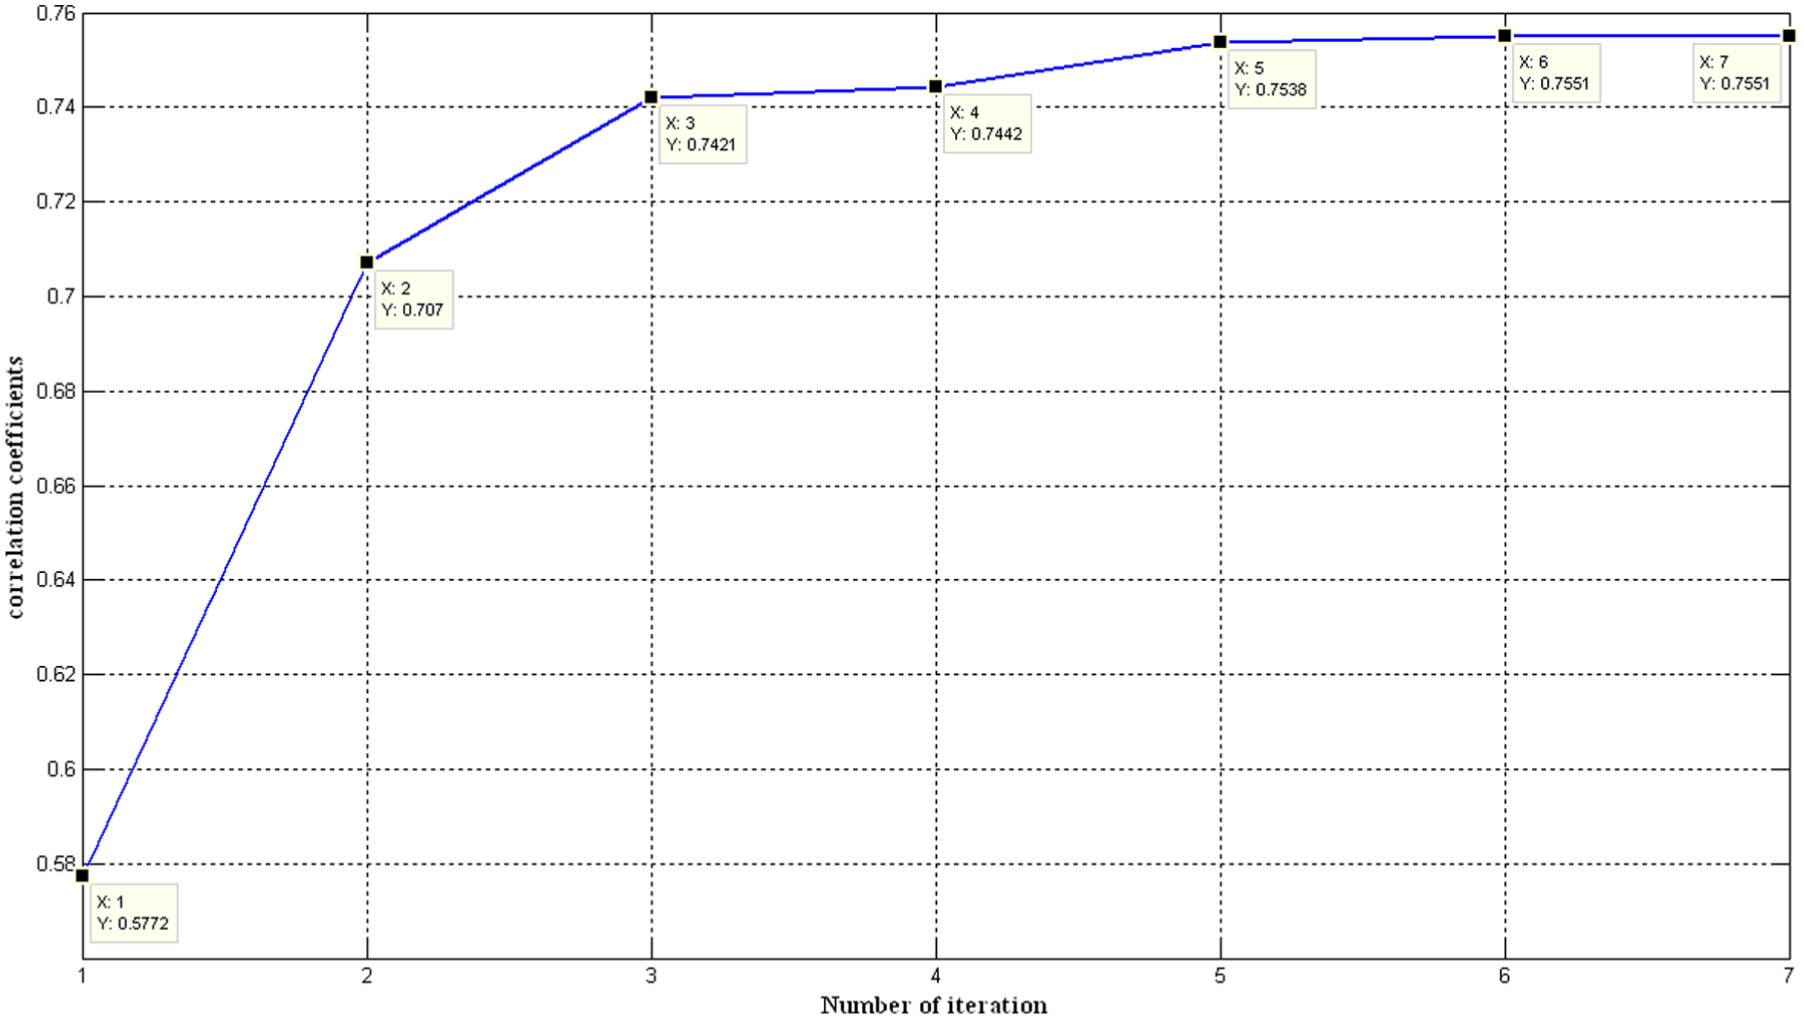
Correlation coefficients of periodic transient signals between the simulated and the decomposed.
However, significant difference has been found between the decomposition results of the simulated signal and the given signal with the proposed method, e.g. the amplitude of decomposed periodic transient component is half of the simulated signal (Figure 8). The main reasons for the difference are that the Daubechies wavelet basis function is symmetrical and double-sided regardless of the value of the chosen Q-factor, but the given signal is single-sided. The linear combination of the double-sided wavelet basis function chosen based on the Q-factor has limited ability to express the single-sided signal. Through the proposed method, the given single-sided signal is redistributed and becomes double-sided. Therefore, the amplitude of the decomposed signal becomes half of the simulated signal.
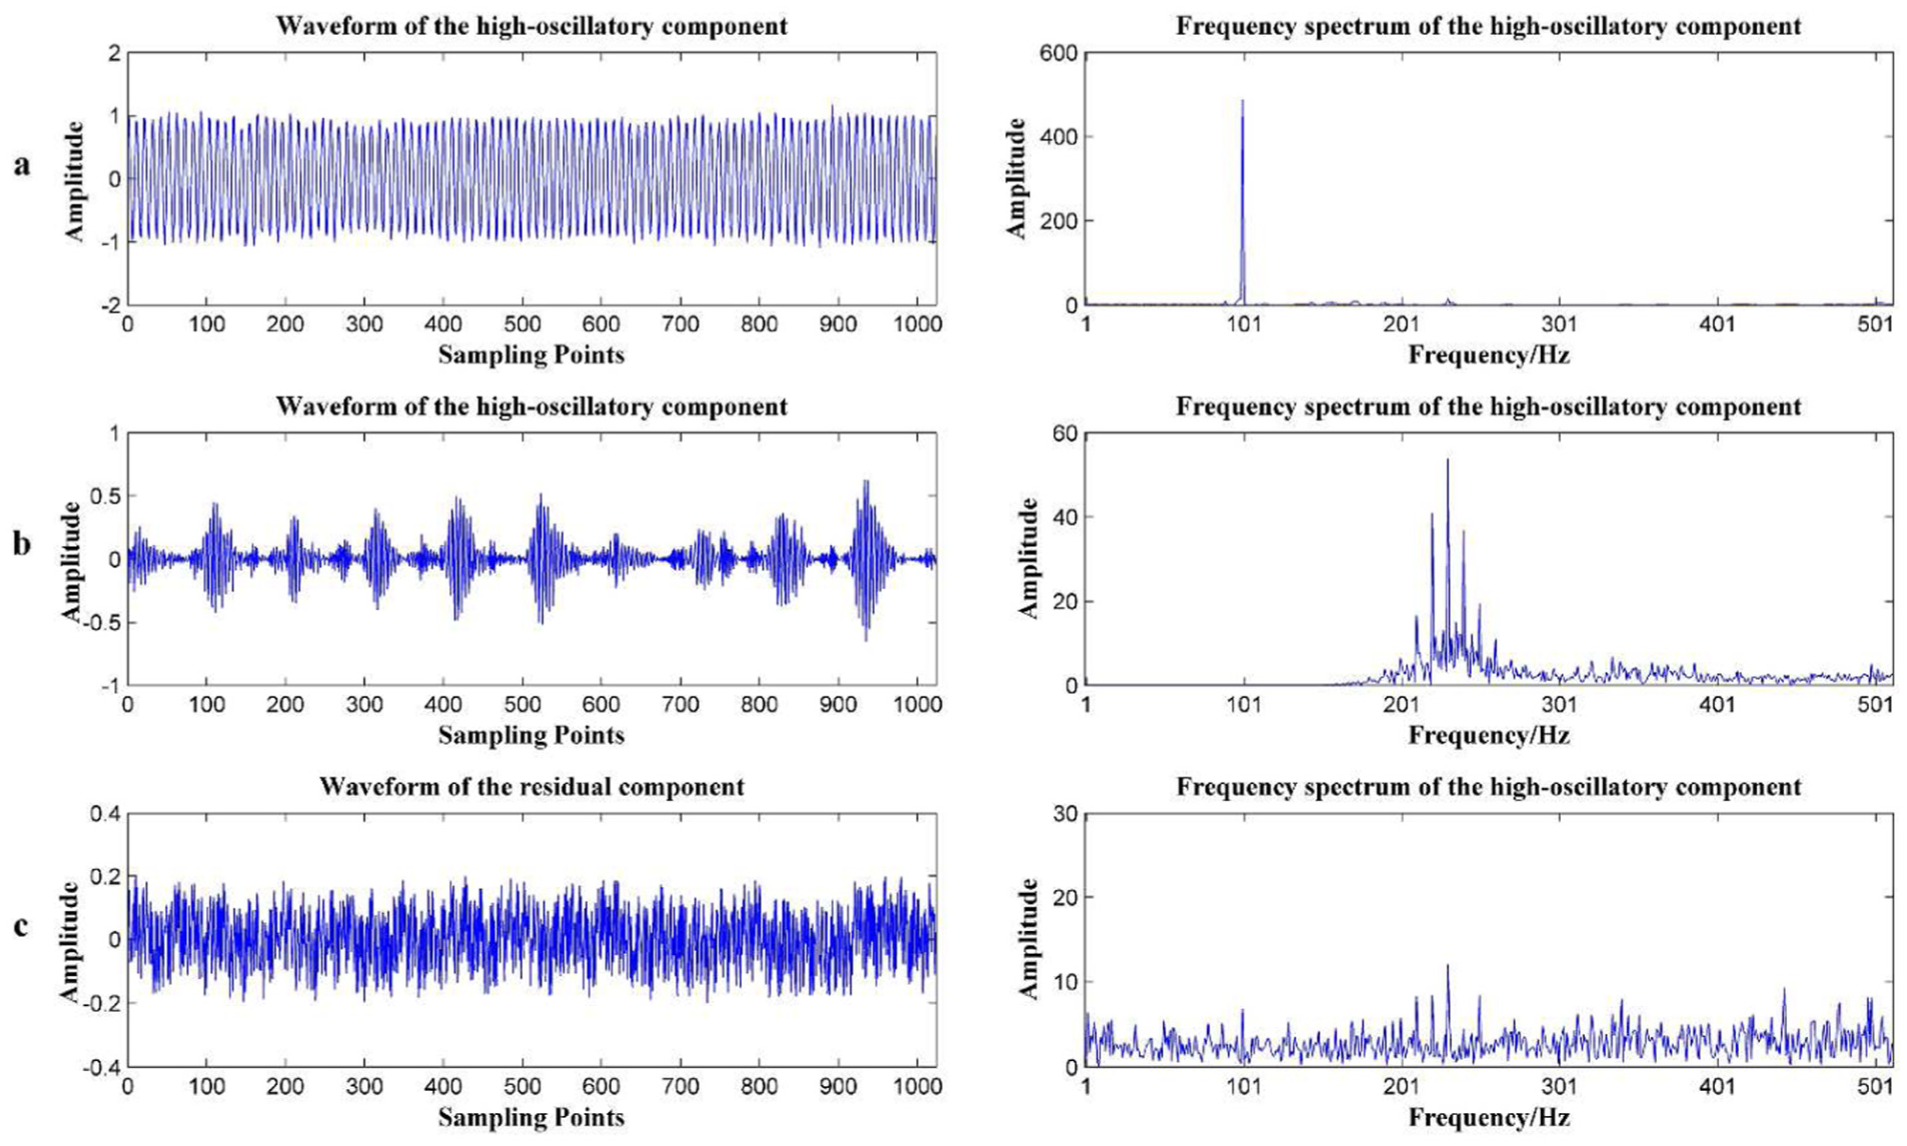
The decomposition results of the simulated signal with the proposed method: (a) amplitude-modulated signal components; (b) periodic transient signal components; (c) residual components.
Thin-walled parts machining experiments
The proposed method was adopted for machining chatter feature extraction of thin-walled parts machining. Furthermore, the decomposition results and transient feature extraction ability of the proposed method is compared with that of the wavelet packer transform (WPT) to demonstrate further the effectiveness of the proposed method.
The experiment concerns with the machining chatter of thin-walled parts. The machining process was carried on a thin wall open geometry of a cantilever of a 6-mm thick aluminium workpiece overhanging for a length of 41 mm using a Φ10-mm, four-flute milling cutter, as shown in Figure 9, on a Mikron HSM 500 vertical machining centre with a 4.2-kW, 42000 rpm spindle. Experimental trials have been carried out with axial (ap=0.5 mm) and radial (ae=5 mm) depth of cut while maintaining a constant cutting speed (n=4000 rpm) and feed rate of 400 mm/min. The bottom middle side of the workpiece was mounted on a jaw vice and the jaw vice is mounted on a dynamometer (Kistler 9253B23) so that the cutting force is aligned along the X-direction of the dynamometer. Furthermore, mounting an eddy current displacement sensor (Keyence EX-V10) on the exactly opposite side of the thin-walled parts with a magnetic base enables the displacement signal and cutting force signal to be compared and studied simultaneously. The synchronous acquisition of the displacement and force signal proceeds through signal conditioner and the data acquisition system, a National Instruments PCI-MIO-16E at 3000 Hz sampling rate with in-house software DEWESoft 6.
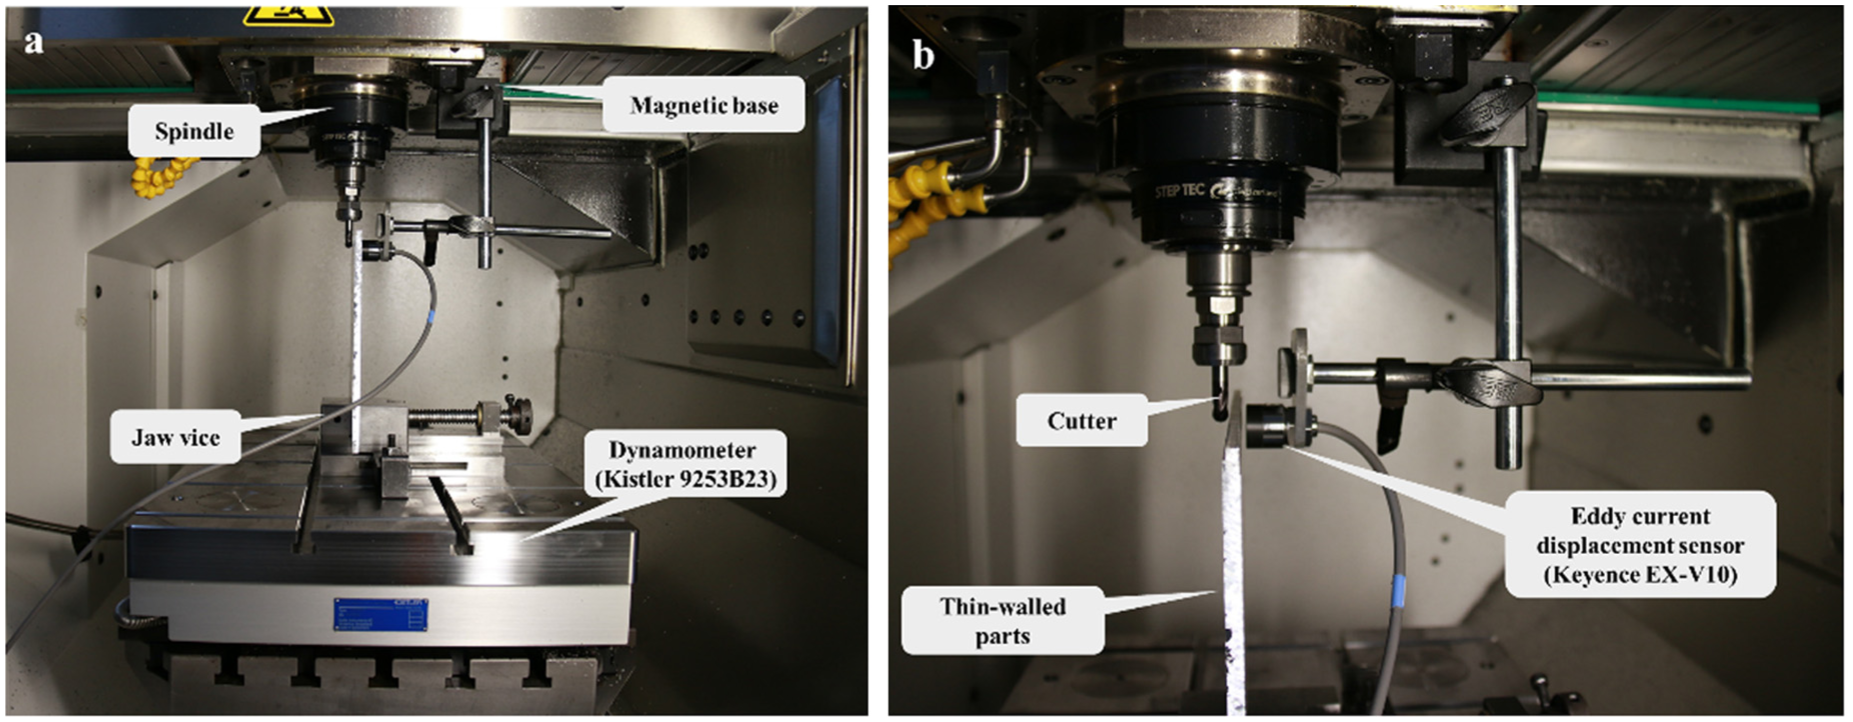
Set-up of the thin-walled parts machining: (a) overall view; (b) local relations.
The measured displacement signal and cutting force signal with length of 500 000 are shown in Figure 10 and divided into three parts based on the cutting location. As shown in Figure 10, chatter happens at the beginning and end of the machining process. Undergoing a process from a stable state to a chattering state, the displacement signal of III becomes large and exhibits more oscillatory behaviours compared with the signal in II. The cutting force signal is reduced at the end of the machining process due to the deformation of the workpiece and becomes more oscillatory because of the chatter. Figure 11 shows the part displacement and force signal corresponding to II and III in Figure 10, which indicates that the chatter signal in III includes more pulses and exhibit more oscillatory behaviours than the signal in II. The signal spectrums of the part displacement and force signal are shown in Figure 12. In spite of the obvious difference of the waveform between the stable signal and chatter signal, it is difficult to demonstrate specific characteristic features from the time domain waveform of the displacement and force signals. Moreover, the frequency spectrums of displacement and force signal take in the same dominant frequencies between the stable signals and chatter signals. Both in the time waveform and frequency spectrum, there is no direct and completely useful information about the machining chatter.
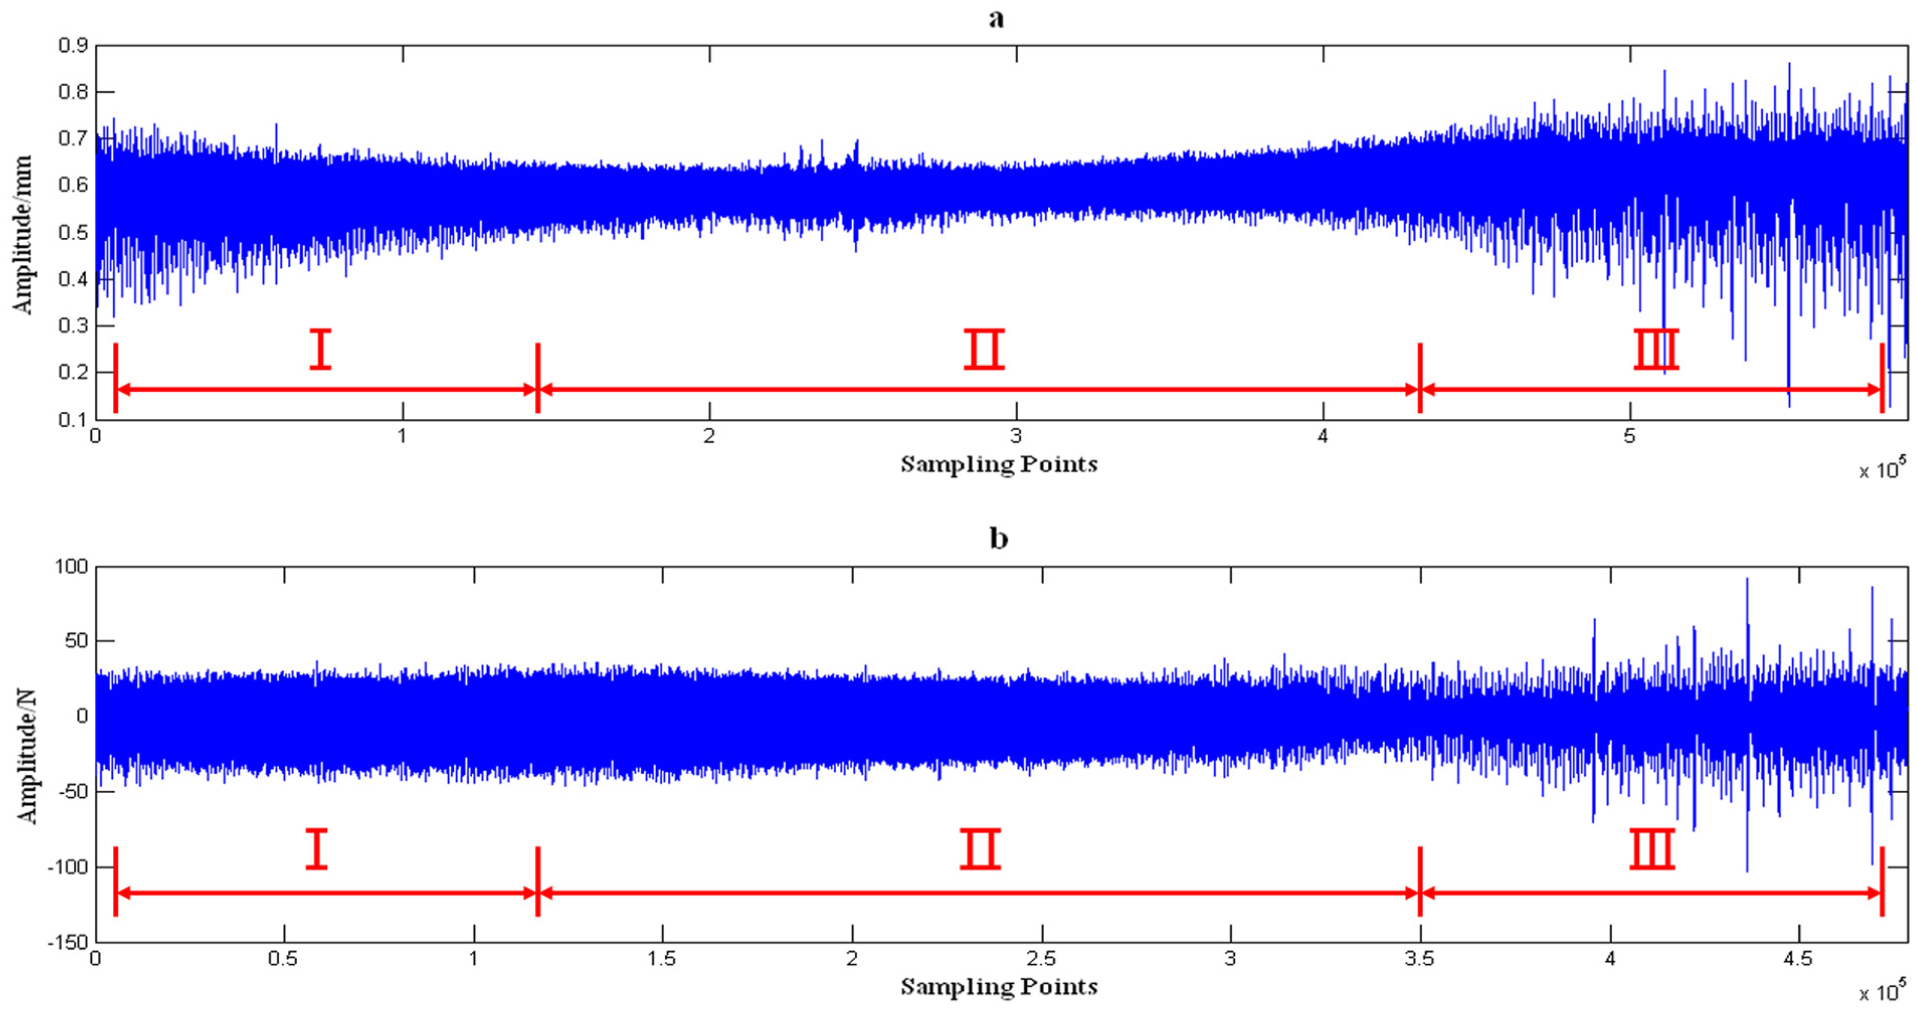
The measured signal: (a) displacement signal; (b) cutting force signal.
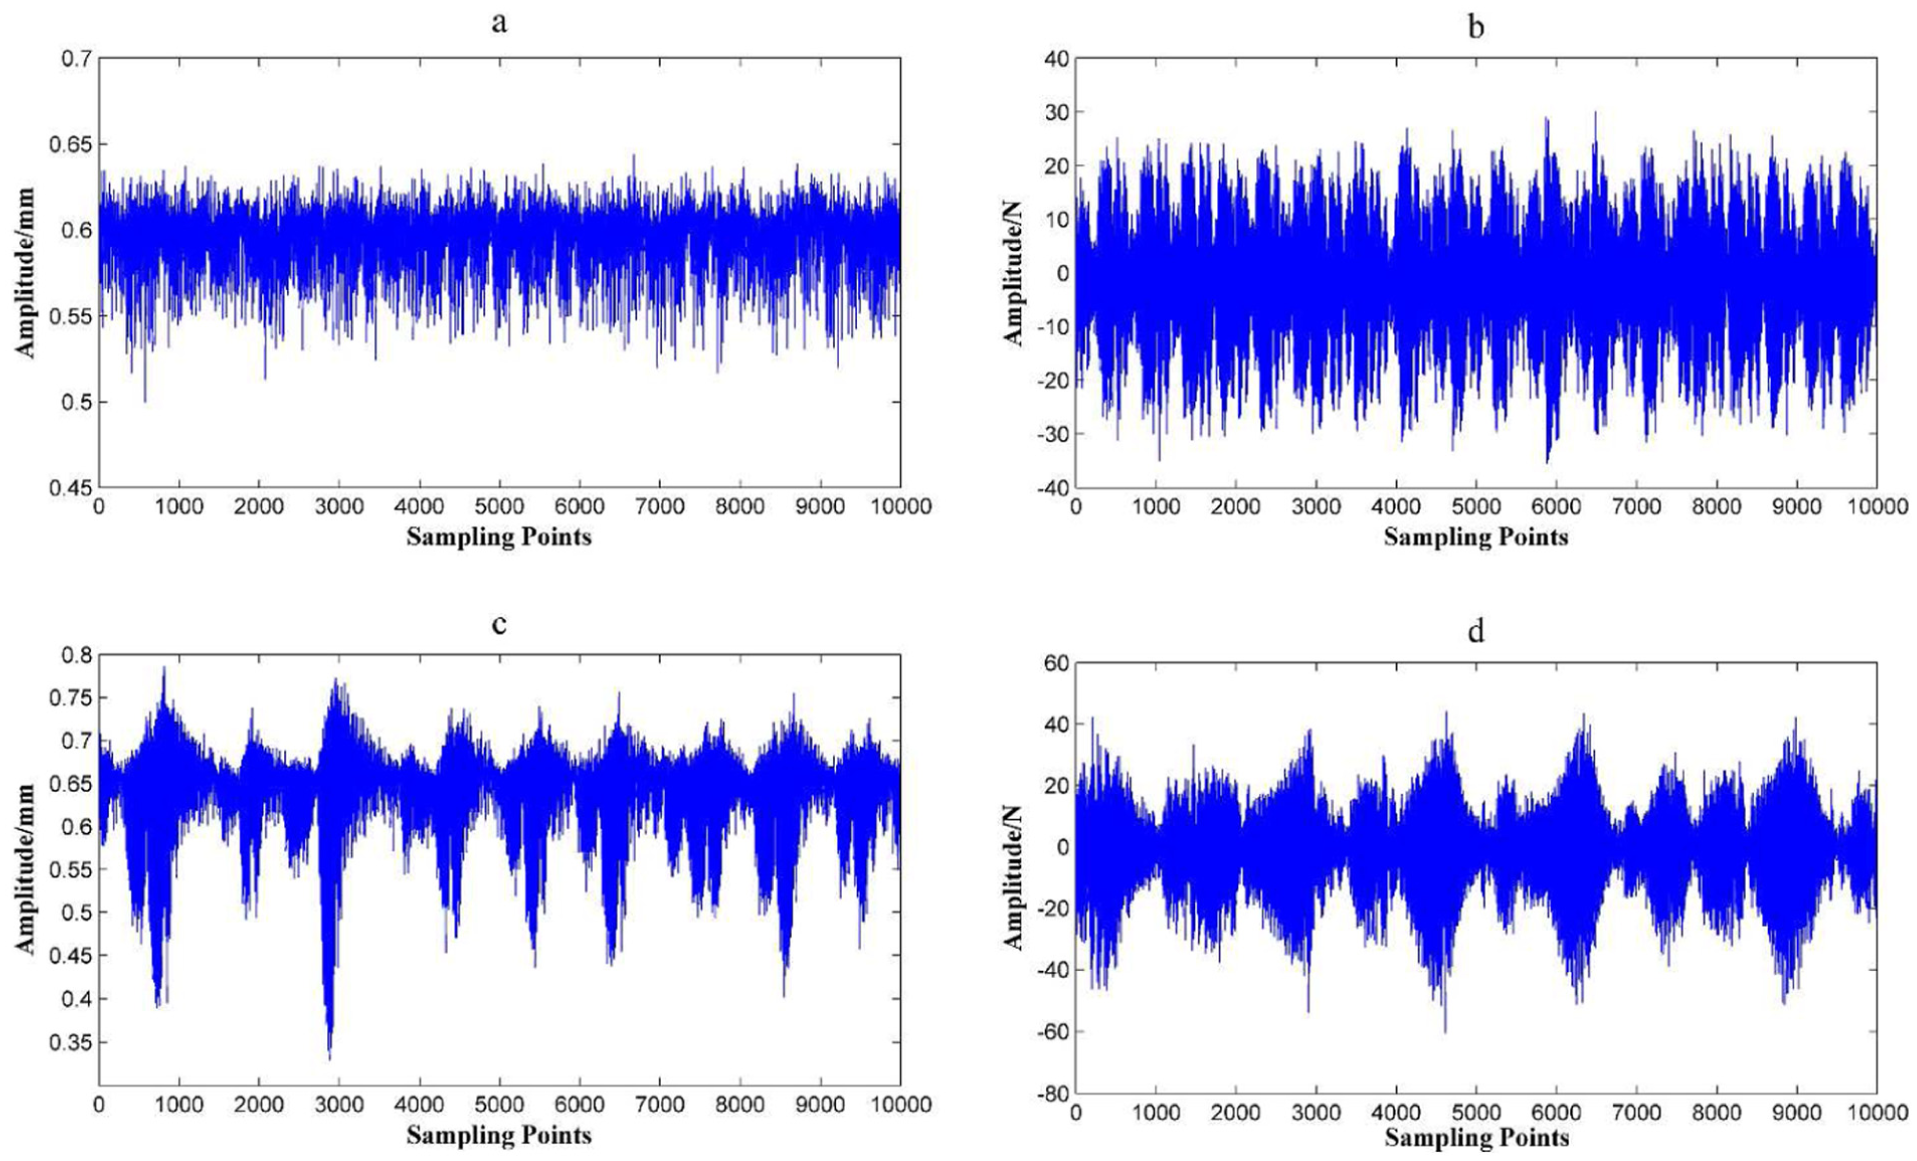
Part information of the measured signal: (a) displacement signal at the middle part machining process; (b) displacement signal at the end part machining process; (c) force signal at the middle part machining process; (d) force signal at the end part machining process.
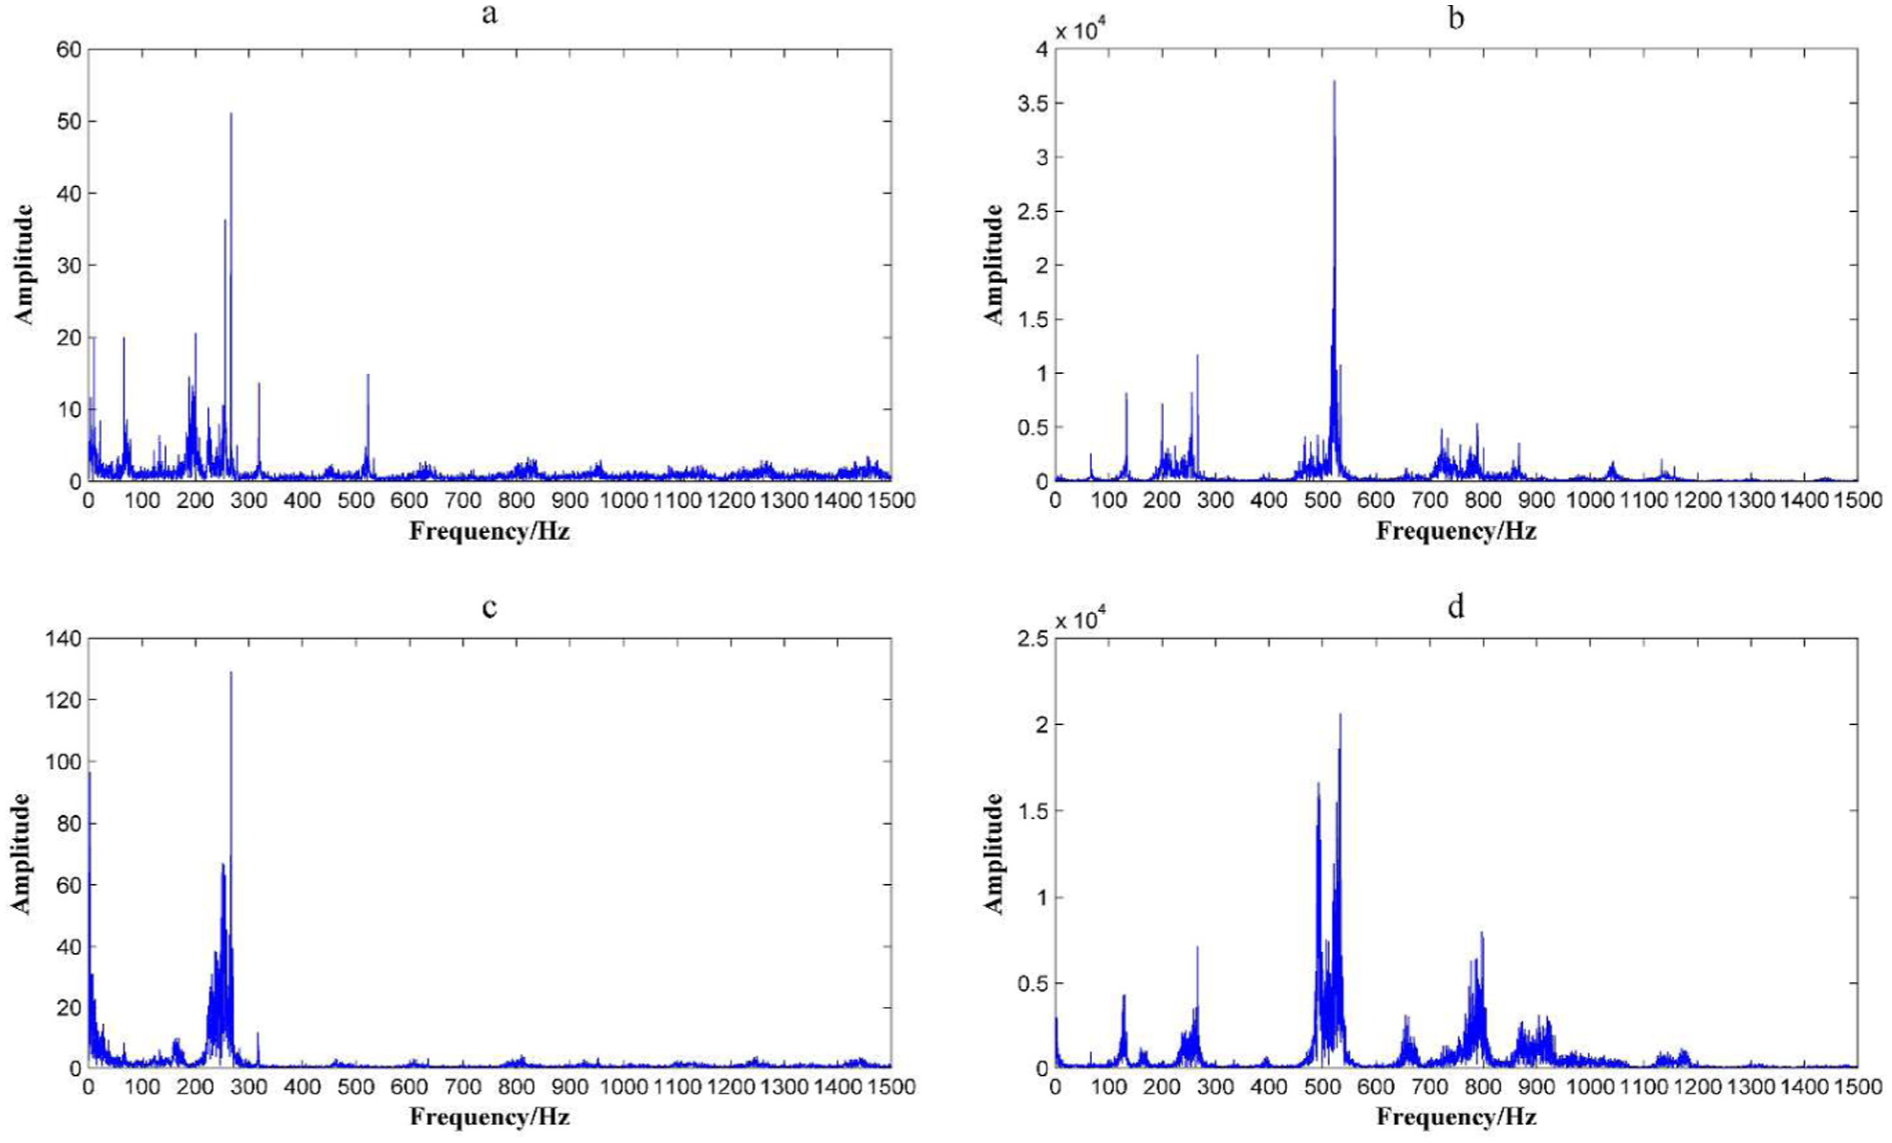
Signal spectrum: (a) displacement signal at the middle part machining process; (b) force signal at the middle part machining process; (c) displacement signal at the middle part machining process; (d) force signal at the end part machining process.
The change in the spectrum for signal in the stable state and chattering state gives an insight of the chatter characteristics separation. The spectrum in Figures 12(a) and (b) show that the stable signal are distributed over a wide frequency range with a relative low amplitude, but the spectrum of chatter signal in Figures 12(c) and (d) demonstrate narrow frequency band characteristics and the signal energy ranges mainly around the cutting tool frequency (266 Hz for displacement signal) or the frequency doubled of the cutting tool frequency (532 Hz for force signal). Furthermore, the appearance of component corresponding to frequency of 254 Hz becomes the significant difference between the stable state and chattering state. This change in the spectrum results from the change in the oscillatory properties of the signal and can be quantified with Q-factor. Considering the more oscillatory behaviours of the chatter signals, the proposed method for signal separation can be used to analyse the measured signal and extract chatter characteristics.
The measured vibration signals in Figure 11(c) are used to evaluate the effectiveness of the proposed signal separation method. Similarly, for the simulation signal, the order of the signal model p is set to be 200 to ensure the established model of signal be an all-pole model. The parameter of
Parameters of four iterations.

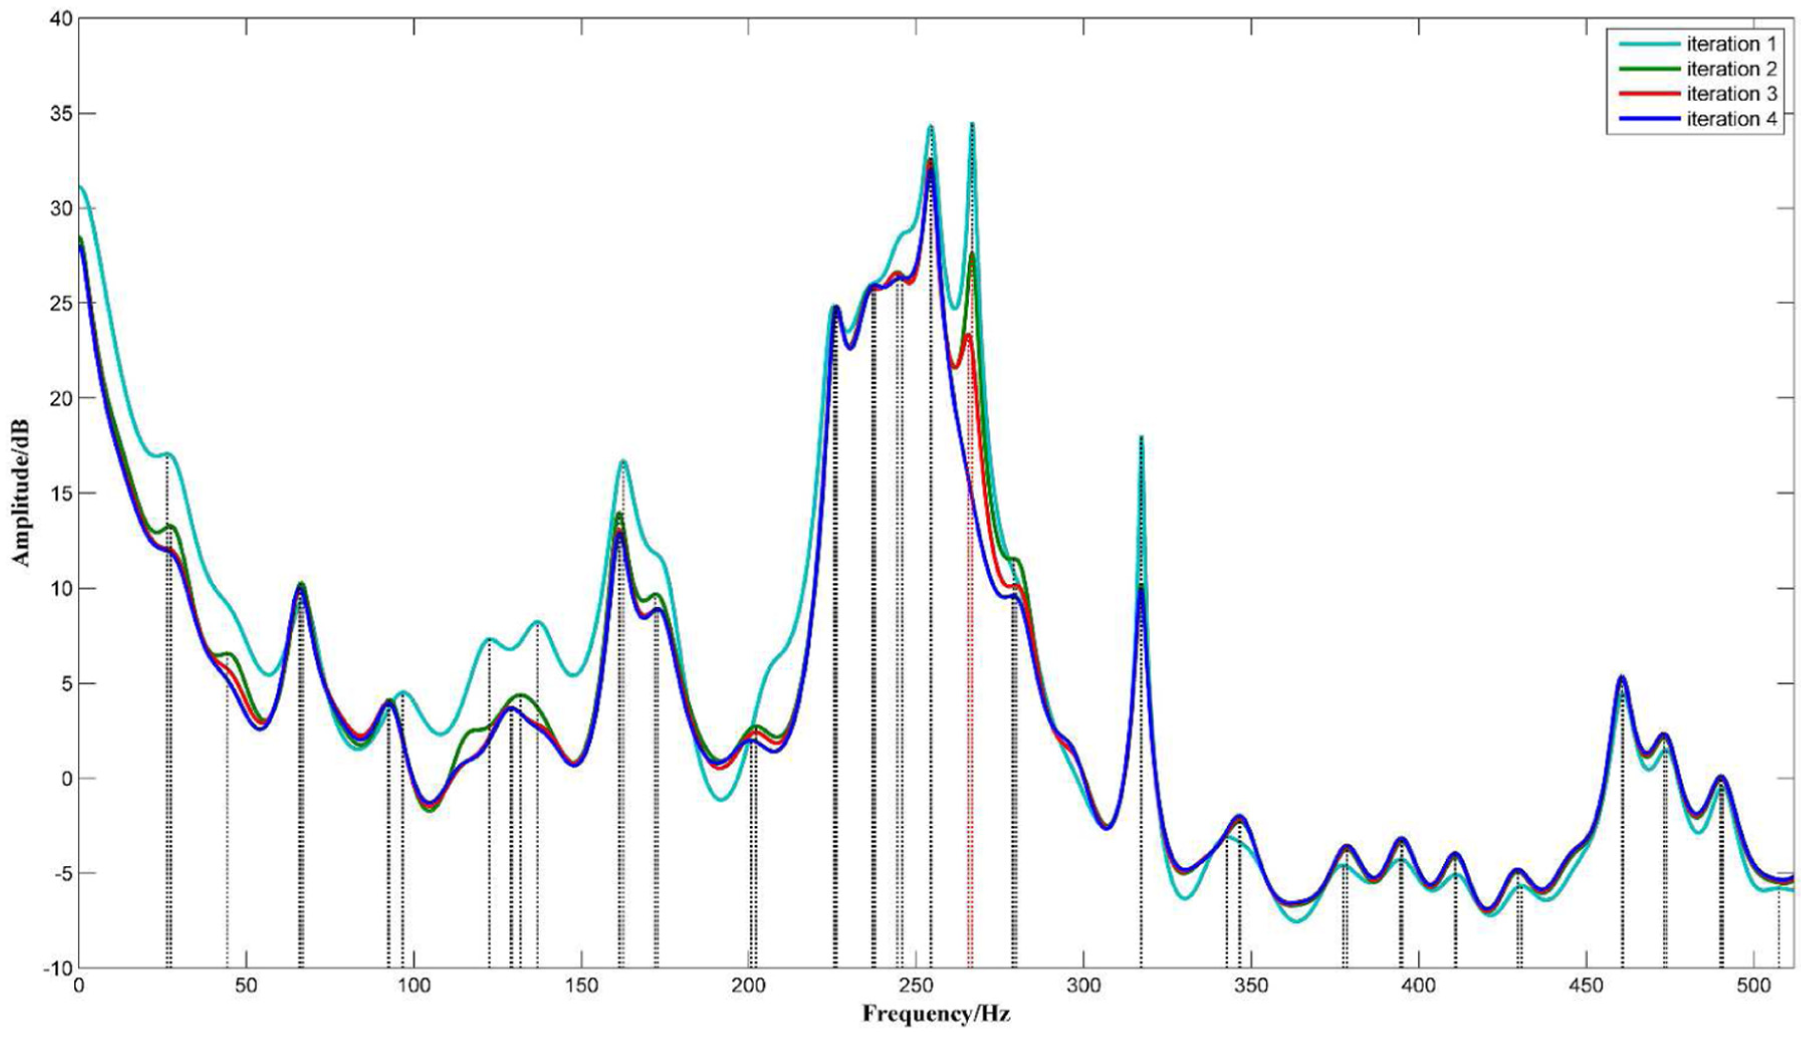
Power spectrum response curve after quadratic interpolation.
As shown in Figure 13, the Q-factors corresponding to the centre frequencies of 266 and 254 Hz can reflect the main oscillatory behaviours and are chosen as the Q-factors of the TQWT. A group of
The final decomposition results, including machining chatter component, cutter rotation component and residual component, are shown from Figures 14(a)–(c) and the corresponding frequency spectrums are shown in Figures 15(a)–(c). The decomposition results show that the cutting component and the chatter component have been separated effectively.
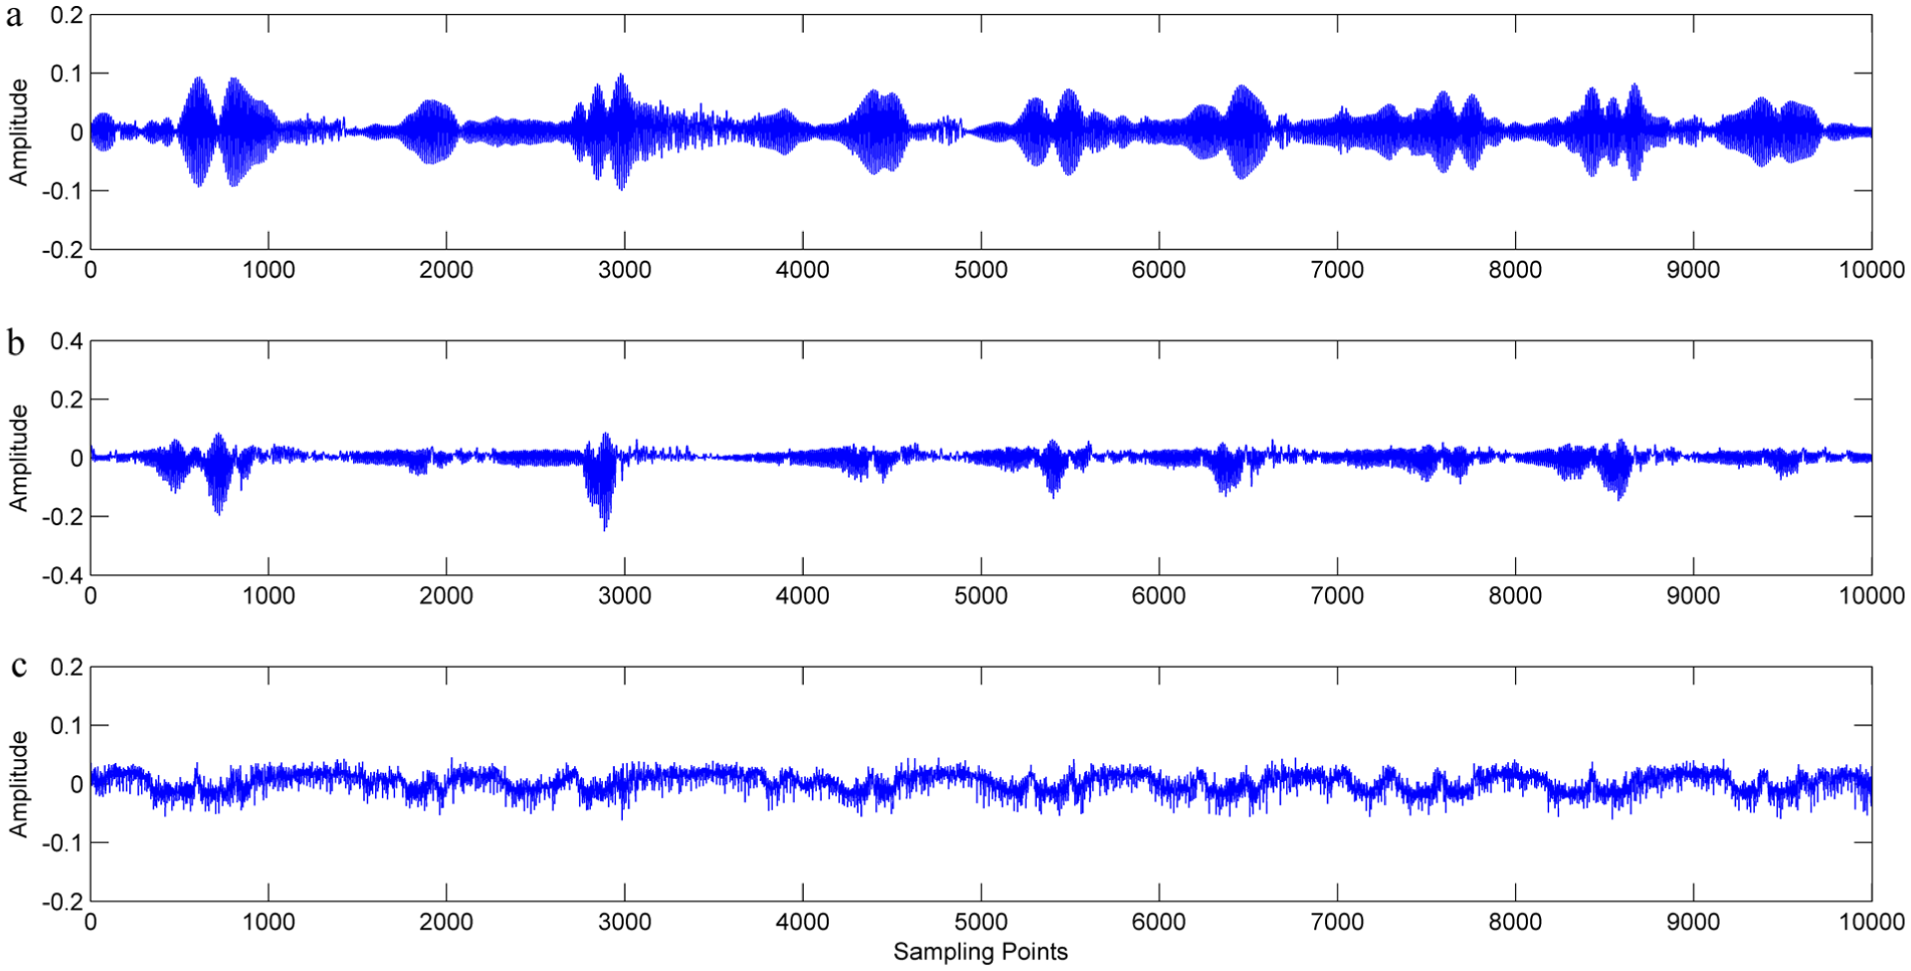
The decomposition result of the displacement signal using the proposed method: (a) the machining chatter (low-oscillatory) component; (b) the cutter rotation (high-oscillatory) component; (c) the residual component.
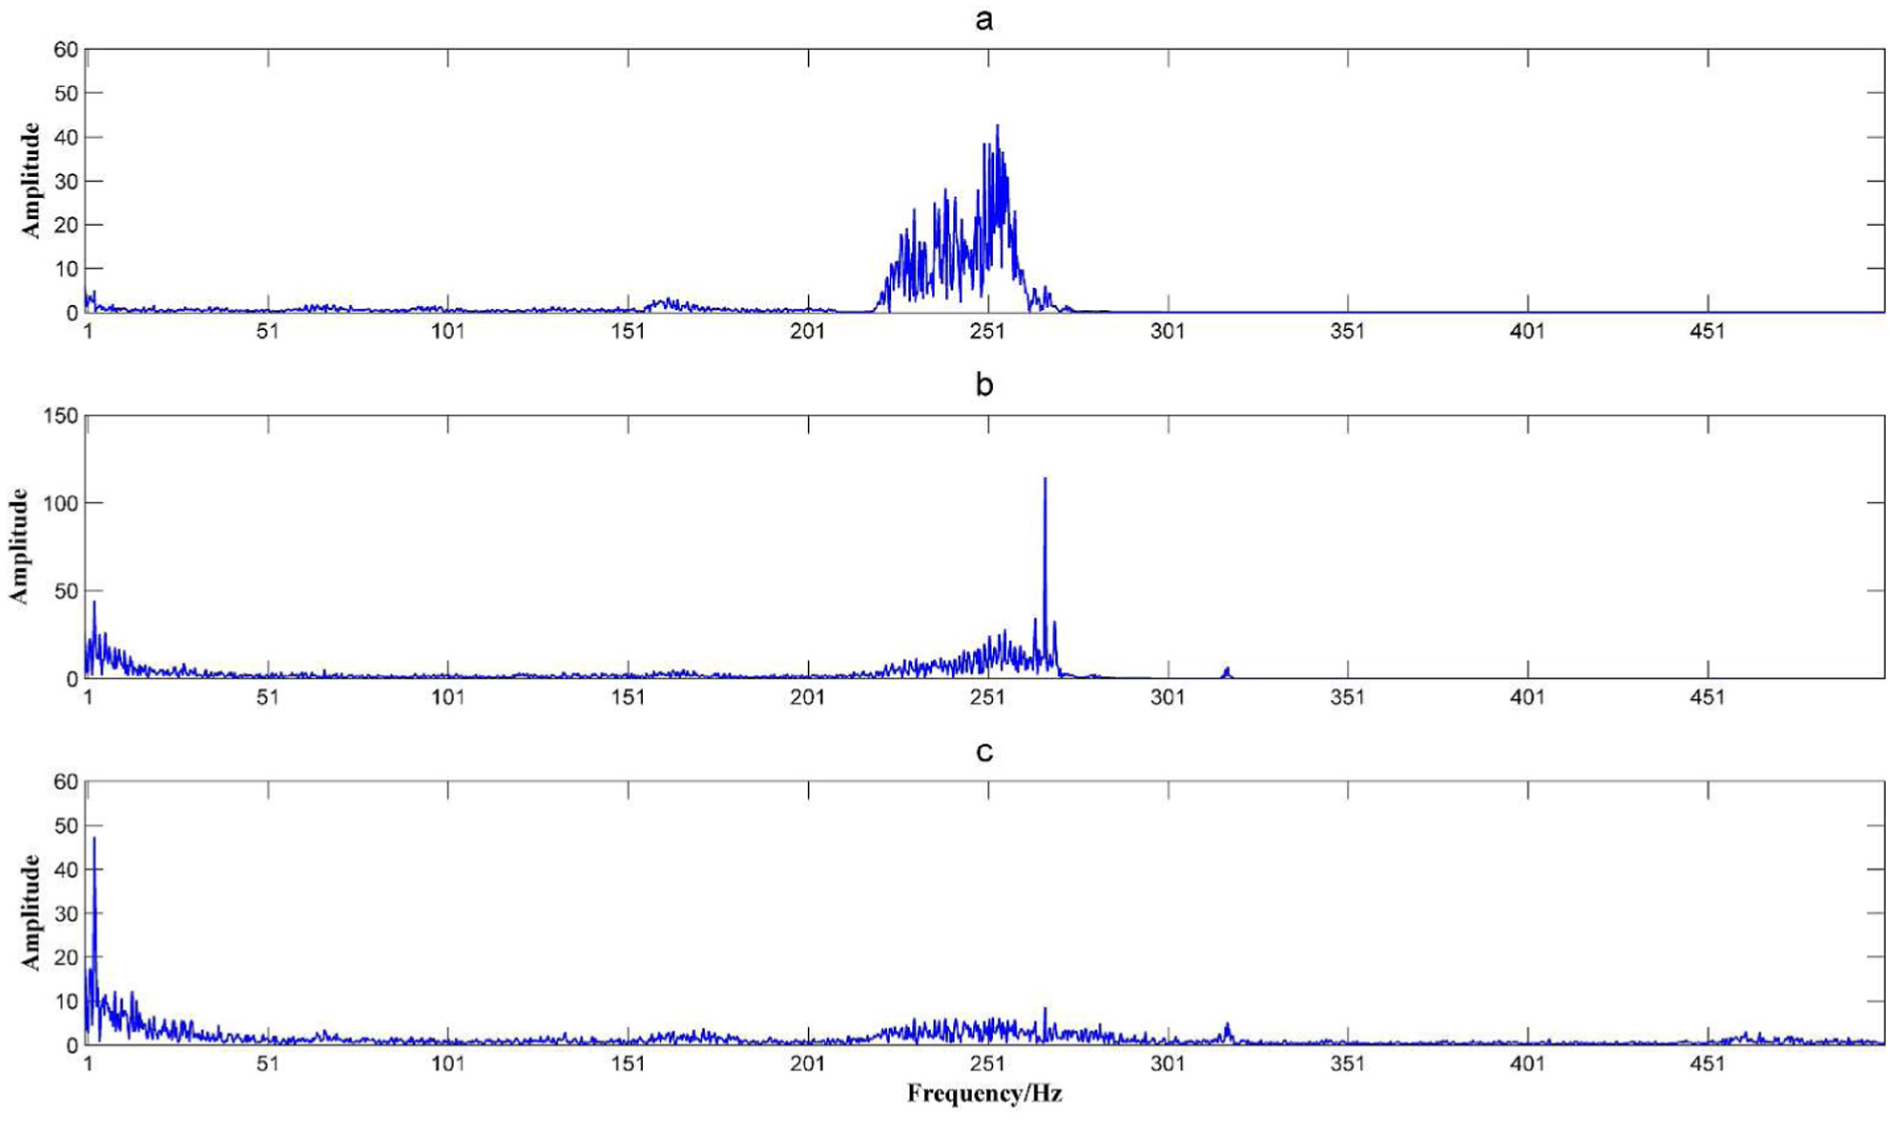
Frequency spectrum of the decomposition result: (a) the machining chatter (low-oscillatory) component; (b) the cutting (high-oscillatory) component; (c) the residual component.
For the purpose of comparison, the same signal is processed by WPT to demonstrate the effectiveness of the proposed method. The decomposition level is set to be 4 and the sym8 wavelet of Sym wavelet series is chosen as the basis function. The main separated components and corresponding frequency spectrums are shown in Figures 16 and 17. As shown in Figure 17(a), the low-band frequency component has been separated effectively, but the components corresponding to frequency of 254 and 266 Hz shown in Figure 17(b) have not been separated effectively and they are still mixed up. WPT fails to extract the machining chatter component from the raw signal.
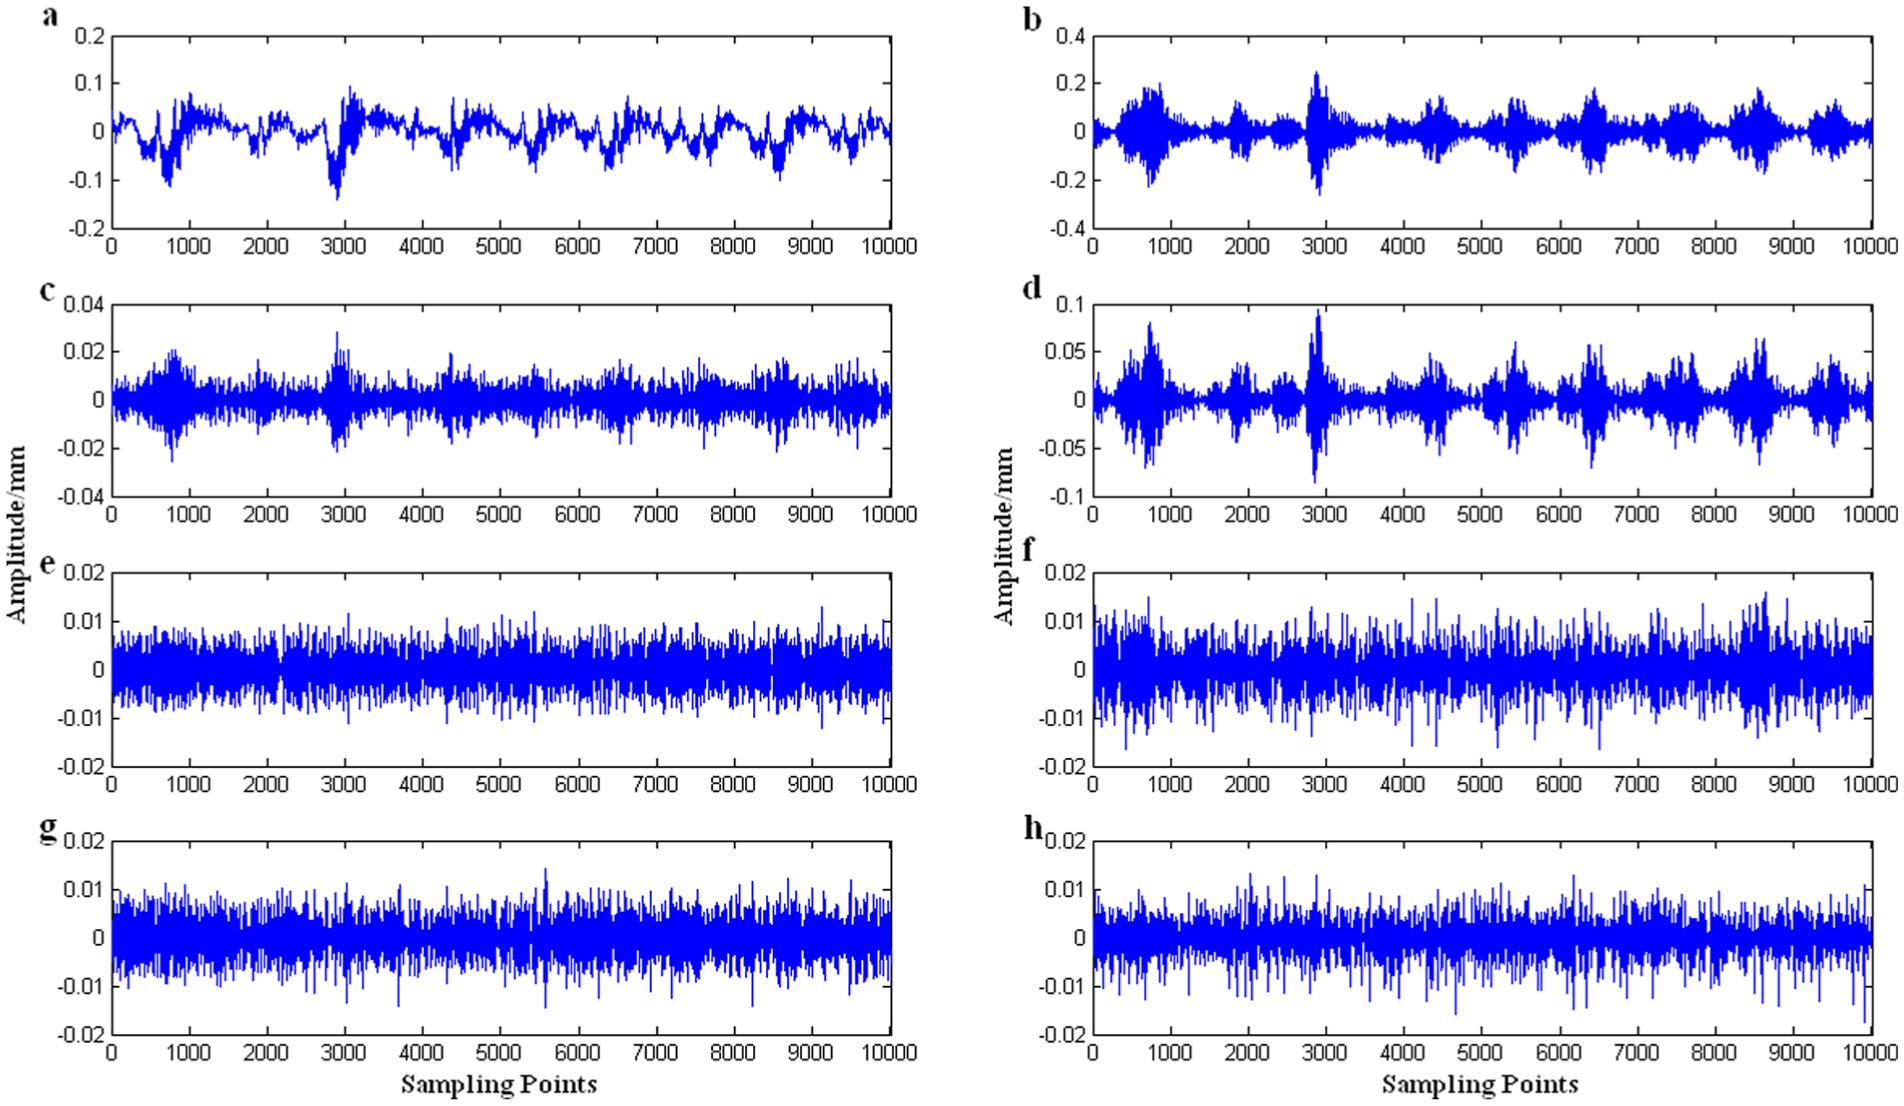
The decomposition result of the raw signal with wavelet packet transform (WPT).
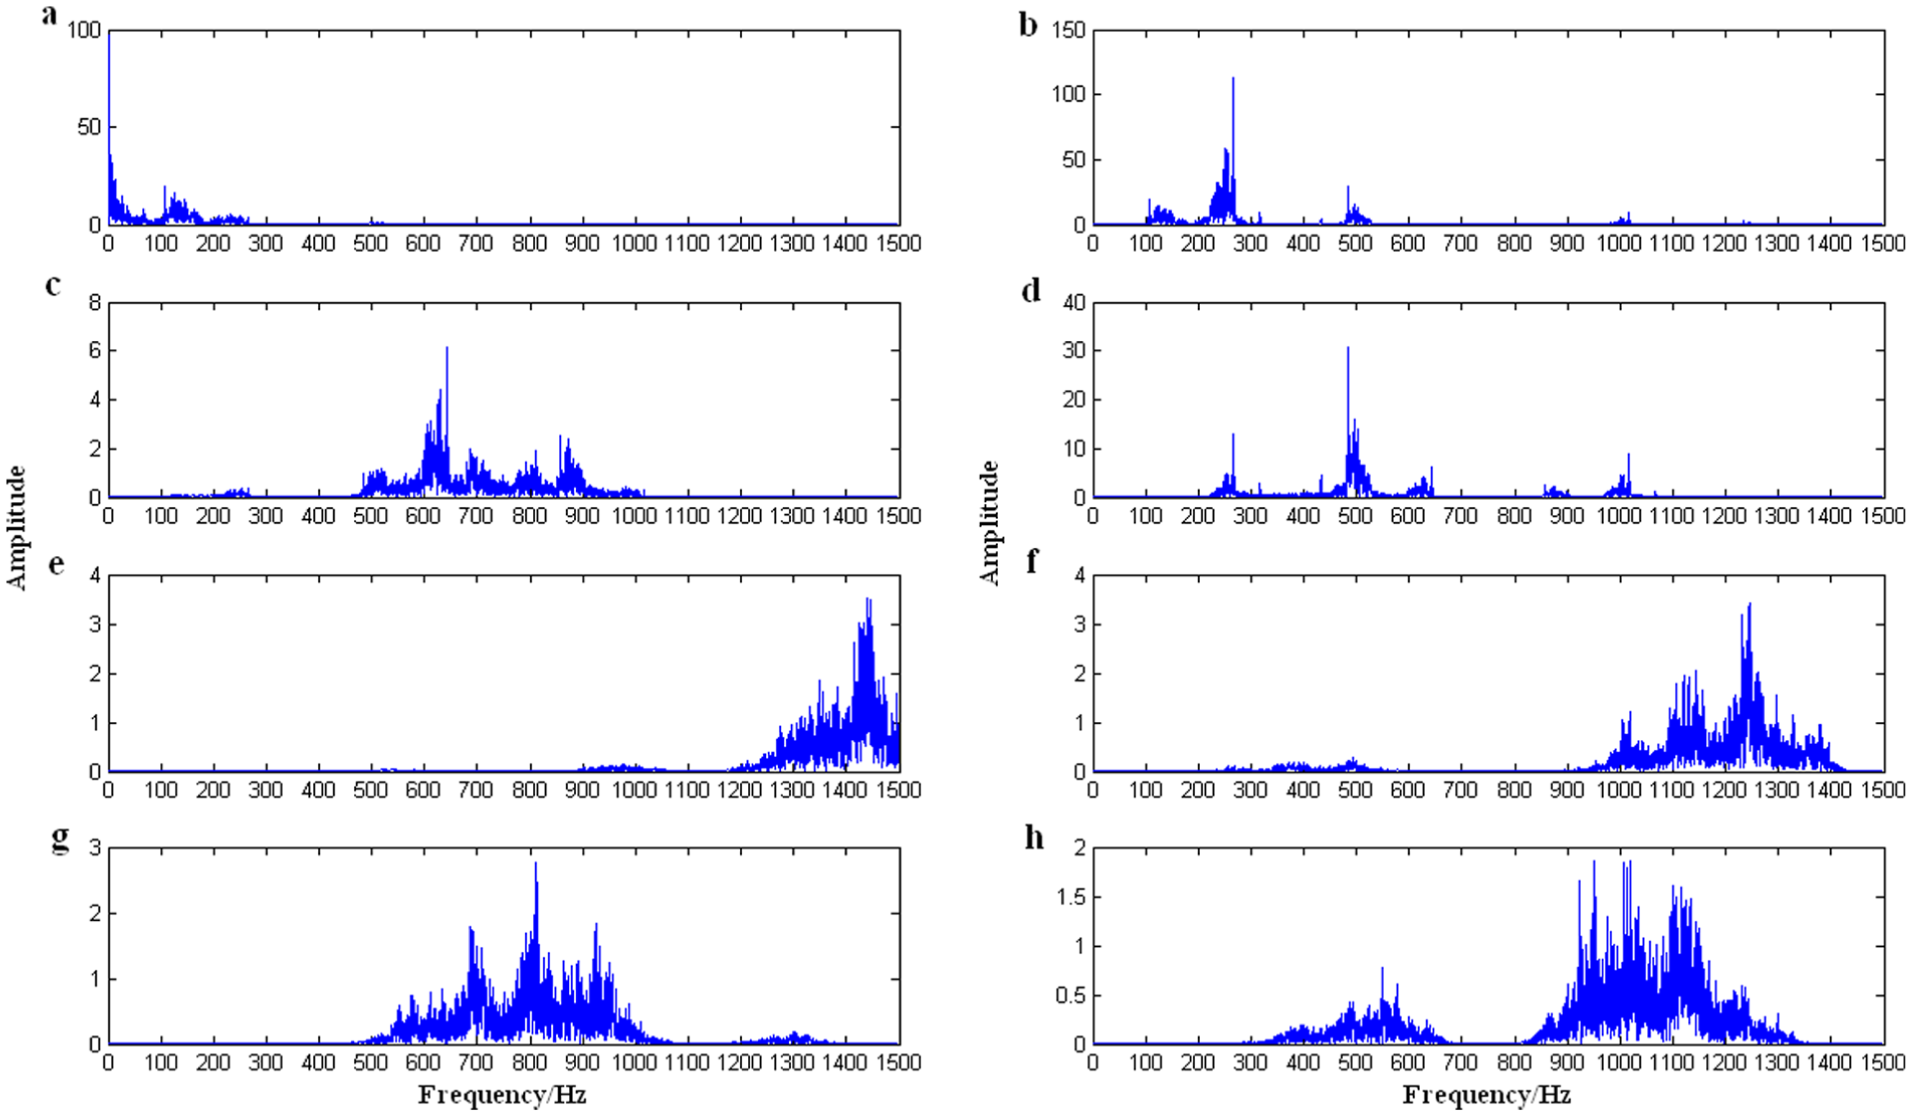
The frequency spectrums of the decomposition results with wavelet packet transform (WPT).
Conclusions
In this article, decomposition of the full-oscillatory components from noisy machining vibration signals by minimizing the Q-factor variation has been developed. A precise calculation method of Q-factors based on quadratic interpolation of LPC was proposed in this paper. An iterative algorithm by combining the sparsity-enabled signal analysis method and precise calculation of Q-factor was designed to decompose full-oscillatory components from noisy machining vibration signals. Numerical simulation and practical machining vibration procedure was performed to validate the effectiveness of the proposed method. Comparative research between the proposed approach and WPT was performed. The results indicated that the proposed approach exhibited a more effective extraction ability.
The component directly related to the chatter has been separated from the mixed signal. With further analysis of the separated component, more precise information such as the centre frequency, band width, spectral kurtosis, crest factor and so on will be obtained, which will deepen the understanding of chatter in thin-walled processing. Secondly, the mechanical part, which induces the chatter, will be identified and the further action will be proceeded to avoid the chatter. All this work will be performed in the future study.
Footnotes
Funding
This work is supported by National Basic Research Program Funding Agency of China (Grant No. 2014CB046604) and the National Natural Science Funding Agency of China (Grant No. 51305062).
Conflict of Interests
The authors declare that there is no conflict of interest.