





Abstract
Inertial mapping unit (IMU) in-line inspection (ILI) has become routine practice for long-distance buried transport pipelines of oil and gas. It is capable of measuring the pipeline centerline position coordinates and locating the pipeline anomalies, features and fittings to help the oil company manage it. The IMU inspection data also can be used to compute the pipeline bending strain and assess the potential deviation from the original position where endures the extra stress. This paper introduces the main principle, measurement and data processing for IMU ILI. As a key point of calculation for centerline and bending strain, the identification and optimization of the signal are also discussed. At the end of this paper, the developments of IMU ILI are presented. The IMU ILI becomes an important and effective method for pipeline integrity management and safe operation of buried oil and gas pipelines.
Introduction
The significance for in-line inspection of pipelines
With the sustained rapid economic development, the demand for energy is increasing (Aihua, 2009). The issues for energy shortages and security becomes serious (Yao, 2012). The countries that are short of oil and gas have to import these resources from other countries or develop the offshore oil and gas exploration to ease the energy deficiency. It is well known that the long-distance pipeline is a safe, efficient and economical solution to oil and gas transportation (Feng et al., 2011). Urgent demand for oil and gas resources will greatly develop the industry for offshore and onshore oil and gas pipelines (Feng et al., 2010). However, owing to the oil and gas pipelines being operated under high pressure over a long period, they will be affected by corrosion, wear, construction (Panetta et al., 2001), geological disaster (O’Rourke and Liu, 1999) and other accidental damage that result in leakage, explosion and huge economic lost (Barbian et al., 2011). Regular oil and gas pipeline safety assessment (Paeper et al., 2006; Varela et al., 2015) is required to avoid fatal accidents and decrease the failure risk for pipelines (Wang and Hua, 2012).
In order to ensure the safety of long-distance oil and gas pipelines, the operation company usually selects external or in-line inspection (ILI) to inspect the defect (Czyz et al., 1996) and corrosion of coatings and body of pipeline (Li, 2004). Especially, the ILI is the most useful method to inspect the defect of pipeline body. Different types of intelligent pig that are loaded with different functions of electronic sensors put into the pipeline and inspect any metal loss, deformity or dents (Czyz, 2000a), and so forth, without stopping transportation (Yu, 2005). Then the pipeline integrity and fitness assessment evaluate these detected defects. It not only can protect the safety operation of pipelines, but can also extend the life of the pipeline. Nowadays, the main ILI includes magnetic flux leakage (MFL), geometry deformation, inertial mapping (IMU) (Xionga, et al., 2014) and ultrasonic (UT), and so forth. After nearly 40 years of development, ILI has been widely used in pipeline industry and provided important decisions for safety operation of pipelines (Liu, 2010). With the continuous development of the pipeline construction, the ILI technology will also promote and aim for high accuracy and better adaptability.
A brief introduction of IMU ILI
Pipeline Integrity Management (PIM) is the major method for international pipeline companies to ensure the pipeline safety and economic operation. Pipeline centerline coordinates and other location parameters are the important basic data for PIM, and these data combined with GIS, GPS and other technologies can achieve digitization, visualization management for pipelines (Snodgrass et al., 2004). In China, most of long-distance transportation buried oil pipelines were constructed more than 30 years ago. Owing to changes in parts of the pipelines and personnel mobility, a large amount of pipeline information has been lost. Also, if the new construction pipeline without accuracy centerline, it would be great inconvenience for accident prevention.
In addition, owing to the characteristics of long-distance transport for oil and gas pipelines, they will inevitably go through unstable soil or naturally hazardous regions. Large lateral or transverse movements result in large lengths of a pipeline being displaced from its original position, which include landslides, settlement, fault creep, earthquake ground displacement, insufficient cover (buoyancy), frost heave, thaw settlement, subsidence owing to long wall mining or other subterranean operations, and so forth. As such, these lateral displacements induce significant strains in addition to those under normal operating conditions. Once the additional stress exceeds the limits of the pipe material, serious consequences will occur. According to statistics, natural force damage only equates to 8% of significant incidents but causes 34% of all property damage (Murray, 2014). For example, Gasverbund Mittelland AG (GVM) natural gas pipeline ruptured in 2014, which was constructed in the mid-1960s. This accident was investigated and revealed that there was additional stress on the pipeline owing to ground movement in this area without any other defect (Murray, 2016).
In order to solve the pipeline centerline mapping and pipeline movement caused by additional stress (Czyz, 2000b), a useful ILI that is based on inertial navigation technology has become a routine inspection for many pipeline companies over recent years (Sadovnychiy, 2008).The IMU tool can be run in normal oil and gas transportation to use the inertial component to map the pipeline centerline (Yang, 2013). These ILI data provide the accurate 3D coordinate for pipeline anomalies, features and fittings (Zirnig, et al, 2001). The mapping data also can be used to determine the section of pipeline deviation from the pipelines’ original position (Woodman, 2007). Pipeline bending strain is calculated by the mapping data to identify the sharp deformation of pipeline owing to construction or expansion and contraction causing by thermal stress. Repeat runs can identify the section where the movement occurs.
As shown in Figure 1, a typical IMU ILI tool consists of the following:
Drive vehicle with battery to offer the driving force and system power;
The IMU and control unit mounted in the electronic vehicle to collect the attitude information of ILI tool. Steady wheels are used to ensure the electronic vehicle can locate the pipeline centerline.
Two to four odometer wheels to measure the distance and offer the speed of the tool.
Girth weld detector can inspect the position and pass time of each girth weld. It can be used as the alignment for every spool for repeat inspection.
Tracking system to include extremely low frequency electromagnetic transmitter and ground maker.
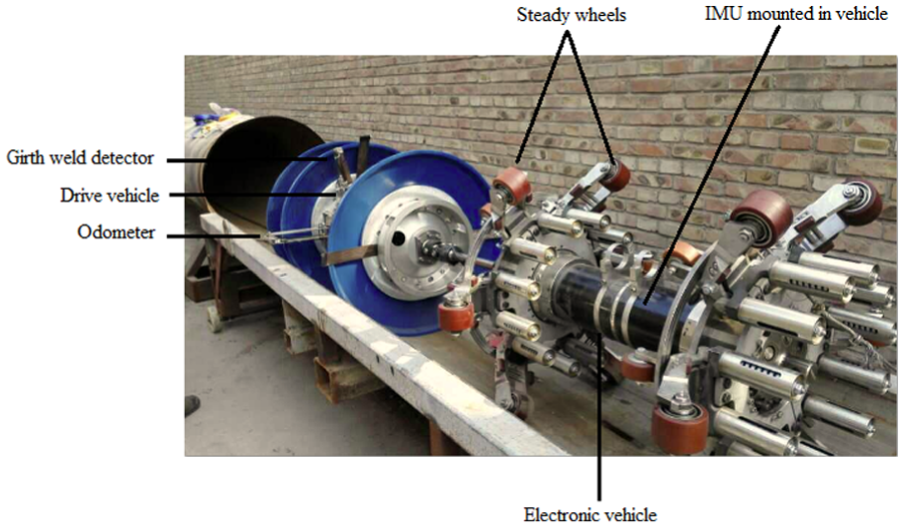
A typical IMU ILI tool.
Principle, component and sensors for an IMU ILI tool
Principle and classification of inertial navigation
The IMU ILI is based on inertial navigation technology (Foxlin, 2005; Skog, 2007). The basic principle of inertia in the pipeline mapping is Newton’s laws of motion mechanics, which is same as aerospace inertia navigation (Skaloud and Viret, 2004). In accordance with the inertial mapping unit mounting method on the carrier, it can fall into the platform inertial navigation system. The platform inertial navigation system is that the inertial mapping unit is mounted on a platform body. The strapdown inertial navigation system is that the inertial mapping unit is mounted directly on the carrier. The strapdown inertial navigation system can be used in smaller spaces that eliminated the platform, but the accuracy is lower than platform INS with the heavy calculation workload (Wiley, 2007).
In stable platform inertial navigation systems, the sensors of inertial are mounted on a platform and mechanically isolated from any external rotational motion (Kim, 2003). This is the original application of inertial navigation system technology (Cao, 2012). A stable platform IMU is shown in Figure 2. Three gyroscopes are orthogonally mounted on a platform to detect platform rotations. The signals measured by gyroscopes are fed back to Azimuth, Pitch and Roll motors to rotate gimbals in order to keep the platform aligned with the global frame. The orientation of the device mounted stable platform IMU can be calculated by the angle pick-offs. The position of the device can be acquired by quadratic integration of acceleration data from orthogonally mounted accelerometers. The brief algorithm for stable platform inertial navigation is shown in Figure 3. The platform INS requiring bigger room is usually used in ships or submarines, and so forth, which have enough room to set.
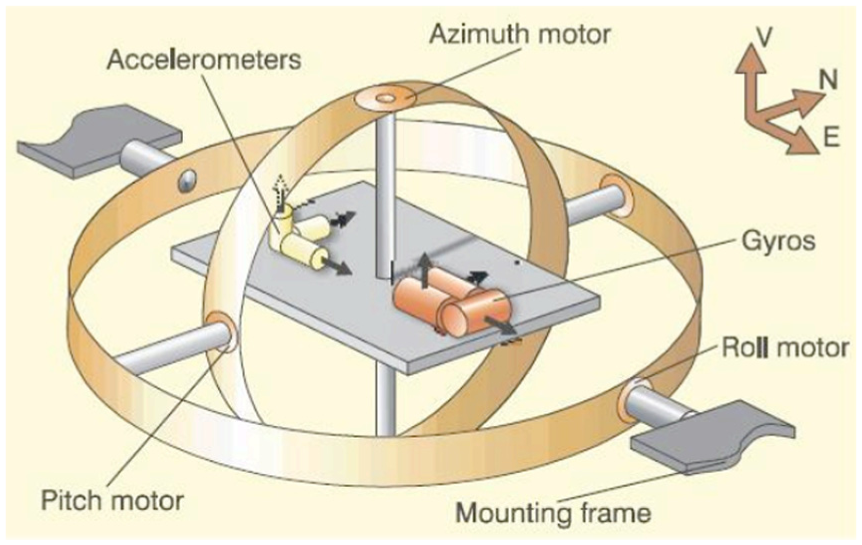
A schematic diagram of stable platform IMU.
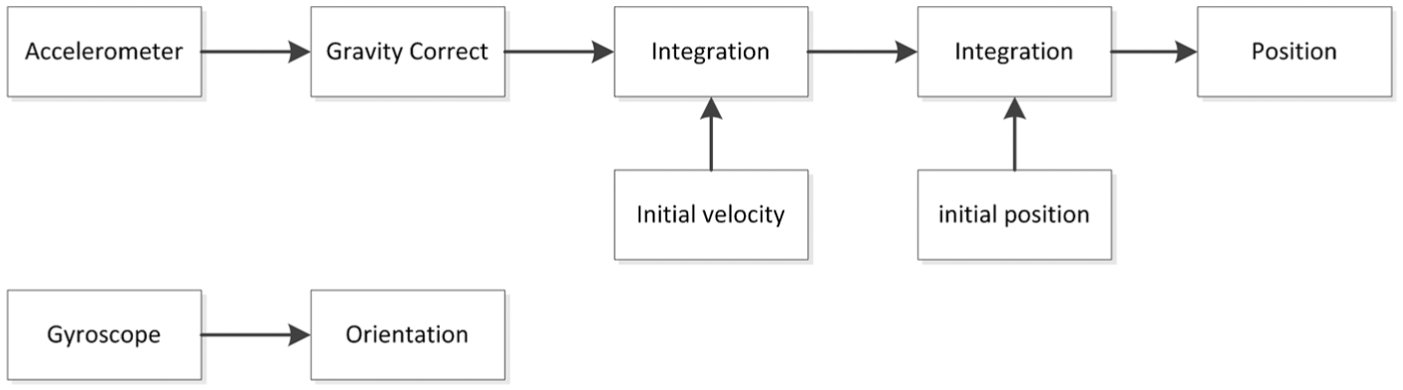
Stable platform inertial navigation algorithm.
With the development of computer technology, another type of INS called strapdown inertial navigation systems (SINS) has been widely used in industry (Cho, 2011). This system removes the complexity mechanical of platform, and mounts the inertial sensors to the body of the device. It measure the body frame rather than global. There are many benefits for this system compared with the platform system, such as greater and widely reliability, lower cost, smaller size and so on. A typical schematic of strap down inertial navigation unit is shown in Figure 4. Three gyroscopes and three accelerometers are orthogonally mounted in the IMU with other data acquisition circuit, control circuit and power circuit respectively. Integrated strapdown INS can be conveniently mounted in the device, vehicle and ILI tools, and so on.
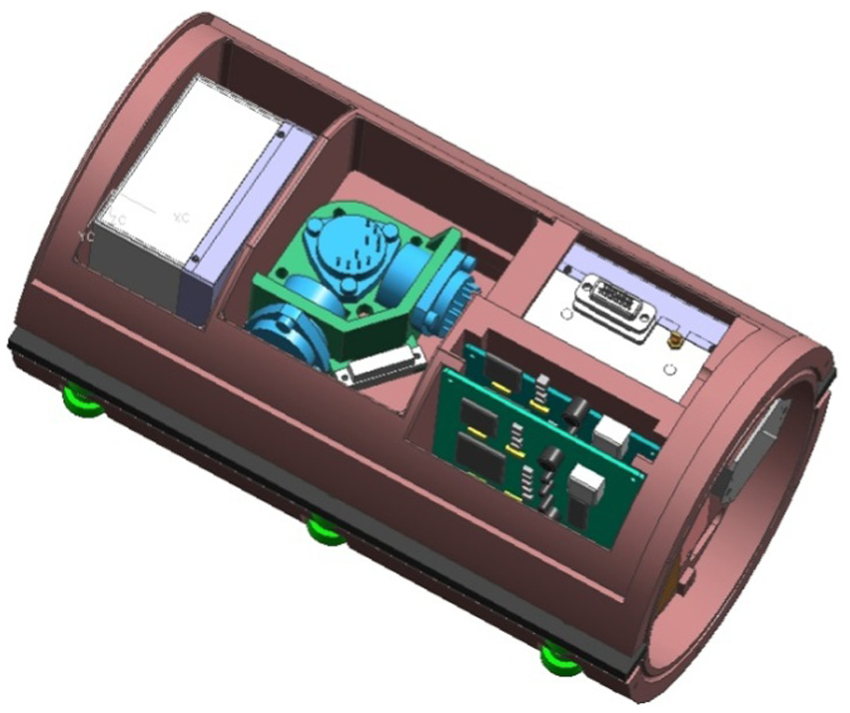
A schematic diagram of strapdown inertial navigation unit.
The brief algorithm for strapdown inertial navigation is shown in Figure 5. The tracking of orientation is integrated from the signals of the three directions for rate gyroscopes to compute the information of attitude for tool (Himmelsbach, 2011). The three accelerometer signals can be integrated into the global coordinates that are computed by orientation from the integration of the gyros. However, because of the Mean-squared navigation errors increase with time, drift error and other system errors, the strapdown inertial navigation need the more complicated calculation. Owing to the requirement of accommodation and accuracy, the IMU ILI tool selects the strapdown inertial navigation. The strapdown IMU used in ILI tools processes the position centerline and bending strain to fuse with the requirements of the other sensors to decrease the inertial errors.
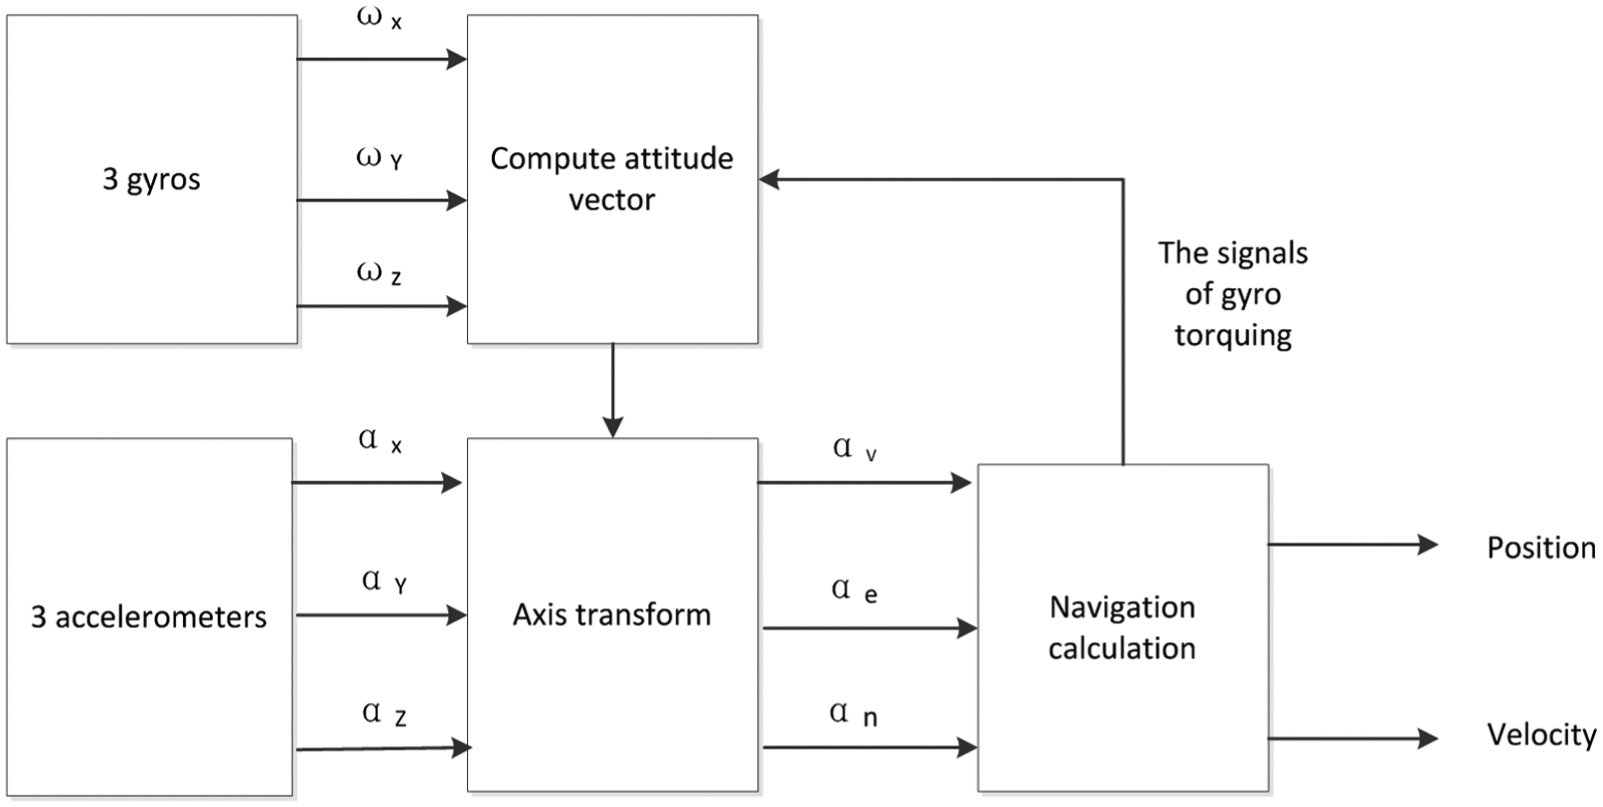
Strapdown inertial navigation algorithm.
The inertial sensors-gyroscopes and accelerometers
As a precision measurement system, the gyroscopes are the key sensors for inertial navigation system (Noda et al, 2014). Therefore, the gyroscopes used in the INS have higher requirements and applicability (Durfee et al, 2006). The most important characteristic of the gyroscope is drift bias stability (Krobka, 2014). The drift bias stability for routine gyroscopes can be achieved 2°/h. The mid-accuracy gyroscopes demand by the drift bias stability is smaller than 0.01°/h. The high-accuracy gyroscopes demand that the drift bias stability for 0.001°∼0.00001°/h (Li G. et al, 2015). There are usually several types of gyroscope used in the industry such as mechanical, fiber optic, MEMS and laser (Hamed et al., 2015). A famous ILI company named Ge PII solution select where the Honeywell laser gyro to be used in the ILI tool, which drift bias stability is 0.0035°/h (Xia et al, 2014). The Petrochina pipeline company has researched a laser gyro used in ILI, which drift bias stability is 0.005°/h. Laser gyro is an optical gyroscope (Wang et al., 2014) based on Sagnac effect (Li et al., 2014). Its working principle is that where the light emitted by the light source is divided into two beams after going through coupler and Y waveguide (Verma, 2015). One beam passes the laser sensor ring in a counterclockwise direction; the other one is on the contrary direction, at last the two beams conflate in the Y waveguide. When the laser sensor loop is in a stationary state, a stable interference light intensity signal can be detected at the detector. However, when the laser sensor ring goes around its central axis, the optical path difference between two beams will change, causing the interference of light phase change. The phase changes and the rate of rotation of the laser ring in a proportional relationship, thus the carrier angular movement can be obtained by measuring the phase change. The system errors arise in gyroscope and effect the integrated signal, which cause significant problems in the solution. A constant bias error is the average output from the gyroscope when it is not undergoing any rotation, which causes accumulated linearly error with time. Owing to the initial bias changes over time when the IMU worked, the error of system is increasing. Because this bias relates to the temperature, time and/or mechanical stress, it usually compensates temperature in manufacture to increased stability of the measurement (Strelow et al., 2015). A random noise is presented in gyroscope when measured constant signal, which described as a stochastic process. The results of quality for static alignment relate to the noise of the sensors. Another error of gyroscope is related to temperature, which effects the orientation when the bias integrated. All of these errors should be measured and standardized after manufacture (Yoon et al., 2014). Allan Variance analysis is usually used to detect and determine the properties of noise processes.
The accelerometer (Diamant and Jin, 2014), which is the core component of the IMU (Williams et al., 2009), is mounted on a carrier. When the carrier accelerates on the input axis direction of accelerometer with respect to the inertial space, the mass pendulum generates an inertia moment that causes the angular displacement of the detection mass around the flexure axis (Murakoshi et al., 2003). The angular displacement causes the differential capacitive sensor to generate the capacitance difference, then the capacitance difference is converted into a current signal by the servo circuit and sent to the torquer device. The torquer generates a restoring torque (electromagnetic feedback torque) to restore the mass pendulum to its equilibrium position. In this case, the current required by the actuator is directly proportional to the input acceleration, so the acceleration of the carrier along the input axis of the accelerometer can be measured by measuring the current value of the torque loop.
Principle and identification of weld detector for the IMU tool
The weld detector is the important component of the IMU ILI tool. It can be used to identify the spiral and girth weld for the pipeline (Kopp and Willems, 2013). The weld detector is not only to locate the feature position, but also to be used to align every spool of pipeline in repeat run (Safizadeha and Azizzadeh, 2012). When the IMU ILI tool runs in pipeline, the weld detector records all the pass time (accurate to the millisecond) for every girth weld of the pipeline (Pechenkov et al. 2011). The precise calculation of pipeline coordinate from the IMU tool is used to align with each girth weld for ground location and dig conveniently.
Different kinds of principle can be used in weld detection such as eddy current MFL (Dutta, et al, 2009), and so forth. As shown in Figure 6, a MFL weld detector consists of a magnet and coils (Chen et al, 2015). When the ILI tool runs in the pipeline, the magnet magnetizes the part of the inner pipe wall where close to the weld detector (Zhi-Ye. et al., 2007). Magnetic field lines uniformly continuously go through the inner wall (Li X. et al., 2009). For a uniform continuous smooth pipe wall, magnetic flux does not change too much (Kopp, G. et al., 2013). However, the signal will distort when the weld detector passes the girth or spiral weld, owing to the magnetic flux change. The coil can be used to transform this magnetic flux change to weak analog signals (Joshi et al, 2007; Xu et al., 2012). The prepositive filter and amplifier circuit should be used to process the transformed signals, which are shown in Figure 7.
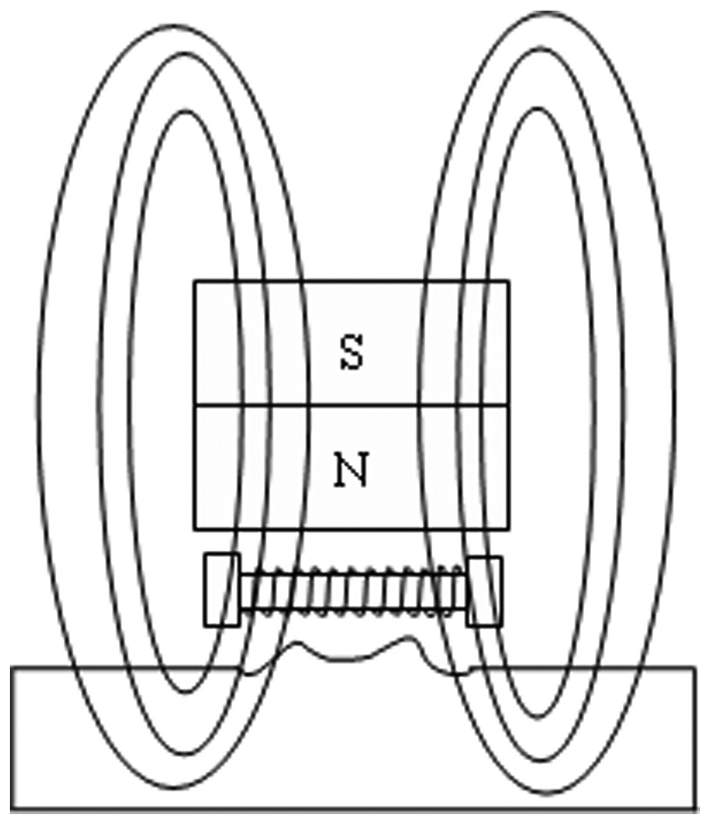
Schematic for weld detector.
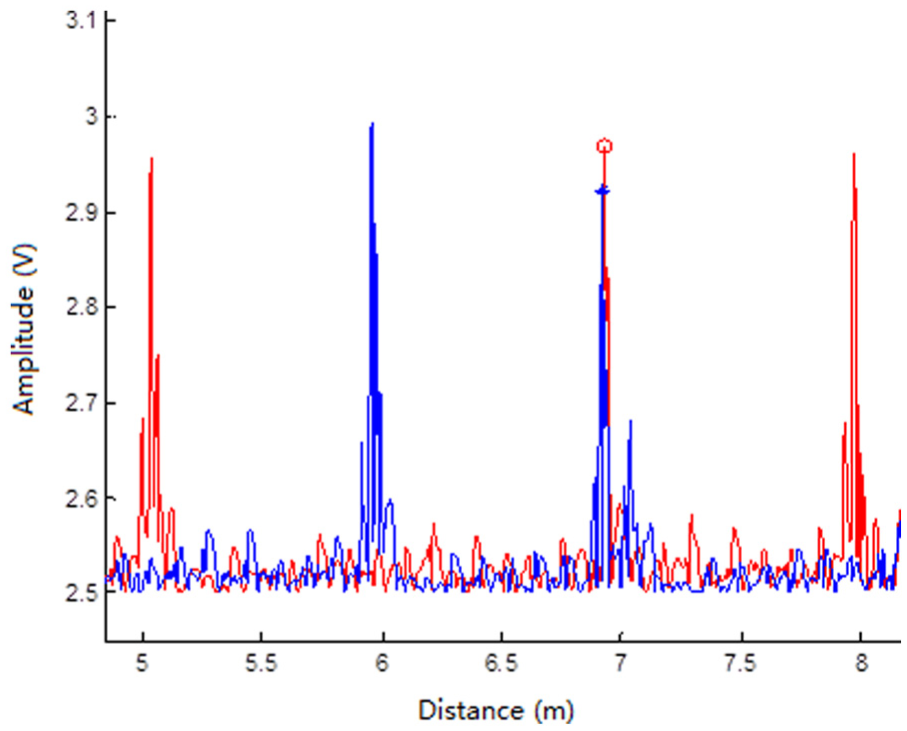
Identification weld signal for two weld detectors.
A signal weld detector can identify all the spiral and girth weld for the pipeline. In order to distinguish the girth weld, a simple method is to use two to four weld detectors opposite or orthogonal mounted on the tool. As shown in Figure 7, two weld detectors are mounted on the tool to detect the girth weld in opposite direction. It can identify the girth weld when the signal from the two detectors overlap. But the girth weld signal would be interfered in actual ILI owing to instability speed or vibration. Zhao et al. (2016) proposed a useful method to confirm sensitivity and threshold of the identification of the girth weld for pipeline.
Odometer sensors for IMU tool
The ILI tool inspects the signals of corrosion or deformation corresponding with pipeline actual position. This actual position is used to the determination of the location of pipeline defects and selection of dig site. Especially, for the IMU ILI tool, the speed from the odometer can be used to modify and reduce the accumulated error of the IMU. There are two main position methods used in ILI, which are odometer and ground marking method. Generally, two or three odometers mount on the ILI tool to measure the inspection distance. The work status and accuracy of the odometer determine the reliability. The key technology of the odometer is proper function and output of a pulse signal in high accuracy in complex environment.
The odometers roll along the inner pipe wall when the tool runs in the pipeline. A number of magnetic sensors are average mounted in the odometer generate a pulse when the odometer rolls at a certain angle. This signals are continuously collected by the Hall sensor to calculate the relative position and distance. However, the odometer may have slipped or failed in the inspection, which leads to measurement errors. The longer inspection distance, the greater error will be accumulated. Therefore, two or three odometers are installed in the ILI tool in circumferential direction. Each odometer generates the pulse signal when it rotates in the pipeline. Because a reliable and minimum error of distance signal should be selected, a method of comparison of these odometers is used to track the right signal. Hyungseok Han (2004) from Kyungwon university mentioned a method to reduce and compensate the accumulated errors of odometer. A simulator experiment to evaluate error of odometer verified the correct method. Song Zhi-dong (2006) from Tianjin University proposed algorithms to design and implement the odometer signals. An algorithm of comparison for multi-odometer signal and processed electronic circuit are presented in this paper, respectively.
Ground tracking and positioning for the IMU tool
In the process of ILI, tracking and positioning of the ILI tool are required to ascertain their status and position during the operation, especially for the malfunction of the tool, such as stoppage (Paperno and Grosz, 2009). For the IMU ILI tool, owing to the errors of inertial sensors and odometer (Grosz, et al., 2011), it is important to require the accurate ground GPS information (latitude, longitude and height) which interval for 1–2km to reduce the system errors. For the long-distance buried Oil and gas pipelines, the tracking and positioning methods for the ILI tool can only be used without cable or wireless (Del Marco and Weiss, 1997). There are several kinds of methods used in the ILI tools tracking. The main methods of tracking out of pipeline include active tracking, methods based on MFL (Riera-Guasp et al., 2008:), acoustic-based on sound wave and detection-based on extremely low frequency (ELF) (Hari et al., 2012).
The basic principle of active tracking on the pipeline is applying an AC excitation signal, and then detecting the output signal across the resistor. When the ILI tools run in the pipeline, the equivalent capacitance of metal poles will be changed, which cause the signal of output voltage to change. Therefore, the position of ILI tool can be detected (Poor and Hadjiliadis, 2008). However, this method only adapts to short-distance exposed onshore pipeline, not suited for long-distance buried pipeline and subsea pipeline. A kind of ILI tool named MFL tool contains strong magnets that magnetize the pipeline wall during the inspection. This MFL signal can not only be used to inspect the defect of metal lost, but also used to detect the position of the ILI tool with the ground marker (Grosz et al., 2010). The method based on acoustics as a useful ground marker to detect vibration when the ILI tool runs in the pipeline. When the ILI tool passes the position under the ground marker, the sound signal is strongest. This method can be considered to detect the exact position of the tool. But this method cannot be used to detect the tool position when it has stopped in the pipeline.
The ELF is the radio signal of frequency between 3HZ–30HZ. The ELF can penetrate such things as seawater, rock and even metal, which is applied to resource exploration, earthquake prediction, drilling telemetry, submarine communication, and so on. The method based on ELF is placed more suitable for oil and gas pipeline for tracking of the IMU ILI tool. As show in Figure 8, the ELF marker place on the ground and above the buried pipeline. Two coil antennas are mounted in the marker orthogonally to receive the signal of ELF transmitter (Wang and Willett, 2005). When the ILI tool passes below the marker, the coil antenna which is parallel to the pipeline will receive the strongest ELF signal. The time of peak of this signal can be determined by the trigger Time, which should be recorded for millisecond degree. The GPS module is also set in the marker to detect the coordinate for position. This information is used to modify the IMU inertial errors and mileage error. The company named CDI, TDW, ROSEN, PII and Petrochina research the ELF transmitter and marker to apply in the ILI tool tracking. The accuracy of position accuracy can be achieved ±1m.
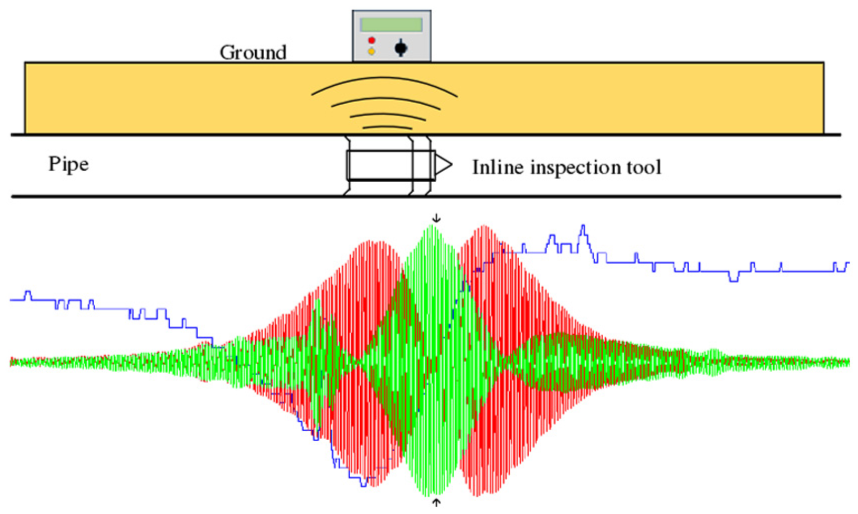
Diagram of matker and receive signals.
Measurement and processing for pipeline centerline and bending strain
Calculation for centerline based on multi-sensor data fusion
The IMU ILI tool is an equipment that mounts inertial sensors and embedded system computers to collect position and attitude information when it runs in pipelines by the transported oil or gas. The weld detectors detect every girth weld to be used to align the data for repeat runs. The odometer is commonly used to provide the distance but incomplete and inaccurate owing to cumulative errors. The ground marker is important to provide exact ground coordinates for feature points of the pipeline. The calculation of pipeline centerline is the reconstruction of the trajectory for the IMU tool. However, because of the IMU outputs are integrated with time, the inertial cumulative errors grow fast for only a few minutes. In order to minimize the effect of the cumulative errors, a method called multi-sensor fusion is the solution for combining the inertial and non-inertial sensors (Rui, et al. 2014). The multi-sensor data fusion technology is an actual simulation of the human brain function that integrated with treatment of complex problems. Compared with the single sensor, the technology of multi-sensor data fusion technology can be used in the detection, tracking and target recognition and other issues (Rui et al, 2013). It not only enhances the viability of the system and improves the reliability and robustness of the entire system, but also enhances the credibility of the data to improve the accuracy, time expansion of the system, spatial coverage, and real-time information to increase utilization of the system, and so on. In this process, it is necessary to take advantage of all multi-sensor information with the use of reasonable control (Jin et al., 2002). The ultimate goal of information fusion is based on the separation of each sensor observation information obtained through multiple levels of information (Zhao W et al., 2012).
In the integrated navigation system, Kalman filtering technique is the most successful fusion of a specific implementation method for multi-sensor data fusion (Hart et al., 2006). Owing to the inertial navigation system being non-linear, the Extended Kalman Filter (EKF) (Shin and El-Sheimy, 2005) is the kernel algorithm to be used to process the data fusion (Welch and Bishop, 1995). The status of heading (orientation), velocity and position of the system combining the information from inertial and non-inertial sensors are estimated by the EKF (Yang et al., 2015). The basic principle of EKF is processed to distribute, and then fuse to obtain the global estimation based on all observation (Yang et al., 2013). The speed and position from the IMU, odometer and GPS can be fused by the EKF to modify the ILI tool trajectory (Shin, 2005).
A typical algorithm of multi-sensors fusion for pipeline center is presented in Figure 9. In this process, inertial navigation system computes the ILI tool attitude and the position, odometer offers the distance and velocity. However, because of the errors of IMU, the calculation of pipeline centerline is incorrect. The error model is set up by the system of navigation and nonlinear dynamic systems. The dead reckoning of the ILI tool is calculated by these sensors’ information. All errors (Zihajehzadeh et al., 2015) of IMU and odometer are estimated a compensated using EKF. The EKF estimates the status vector and observation to feedback to inertial navigation system to obtain the correct result (Niu et al., 2016). Finally, the accurate position of pipeline centerline is corrected with the data of GPS marker. In order to improve the accuracy of calculations further, a smoothing filter is used tfor modification of result after EKF. This modified algorithm can be a compatible form for the calculation of pipeline centerline.
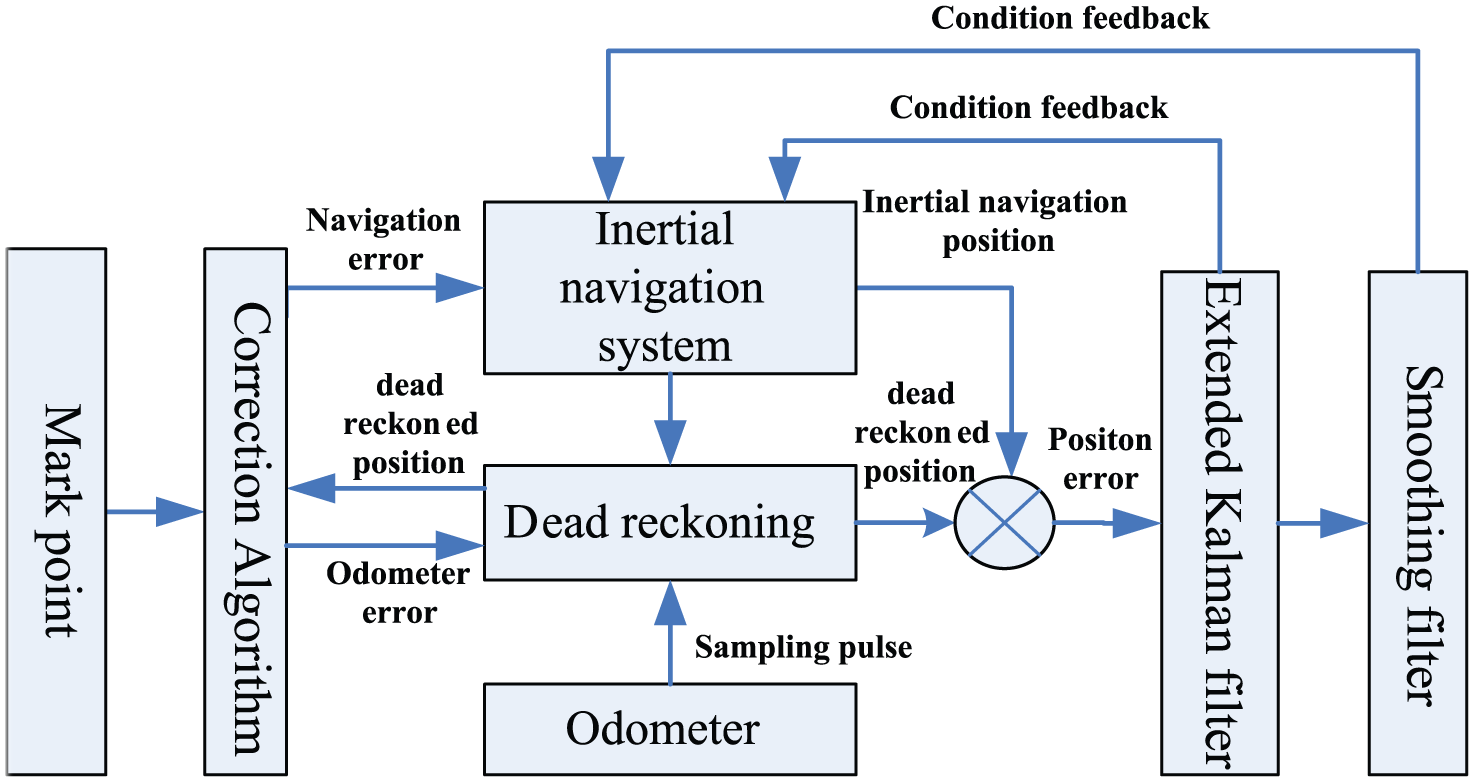
Multi-sensors fusion algorithm for pipeline centerline.
In recent years, the multi-sensors fusion algorithm for pipeline centerline has been developed. Two EKF used to process the calculation that called forward EKF and backward EKF are shown in Figure 10. The first EKF is used to update the states of the dynamic model with the sensor data and produce the updated state vector. The second EKF tracks the errors of the estimated states, combining the dynamic model of the errors with the measurement errors of the sensors. Then the corrected state estimation can be computed by the different results of two EKF. Jaejong Yu from Seoul National University proposes a method of modified nonlinear fixed-interval smoothing filter for the IMU tool. The proposed smoothing filter estimates the position and attitude of the IMU ILI tool efficiently and the measured positions are consistently less than 1m (Yu et al., 2005).
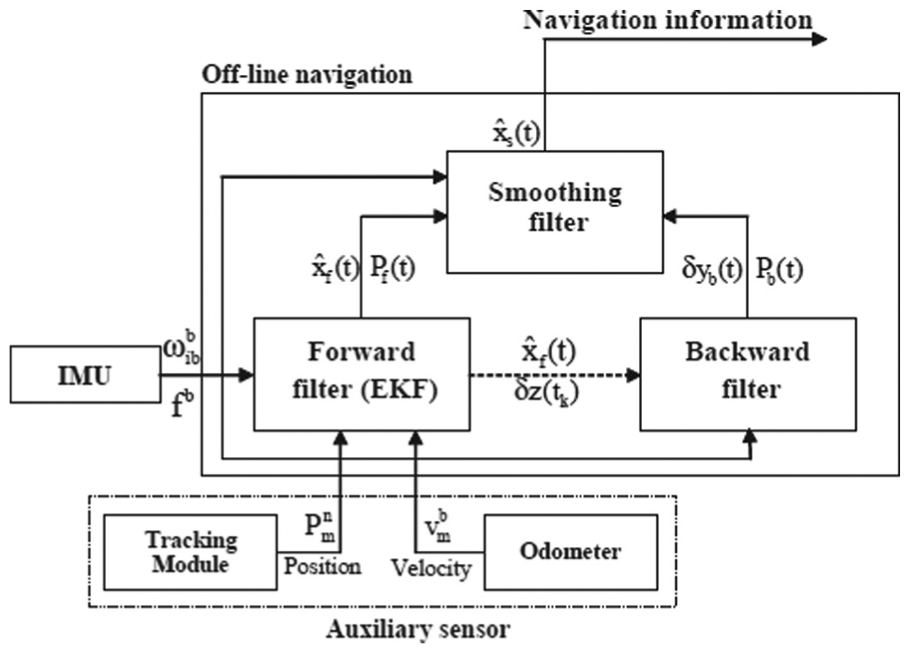
Forward and backward EKF used in multi-sensors fusion algorithm for pipeline centerline.
Calculation and optimization for pipeline bending strain
Calculation for pipeline bending strain
Except in the inspection of pipeline centerline, the IMU ILI tool can be used to determine the displacement of pipeline potential deviation from the original position and to assess bending strain of the pipeline with additional stress owing to natural force damage or other external loading. The use of data from repeat runs can identify where even small changes for pipeline shape changes are occurring. The pipeline strain consists of two primary components: longitudinal and hoop strain. The bending strain is one of the components for longitudinal strain. It can be described by the following formula (Czyz and Adams, 1994):
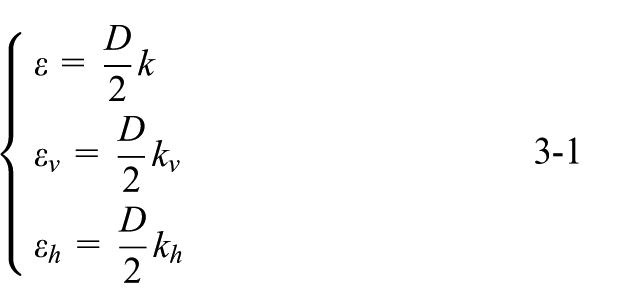
Where the

where the
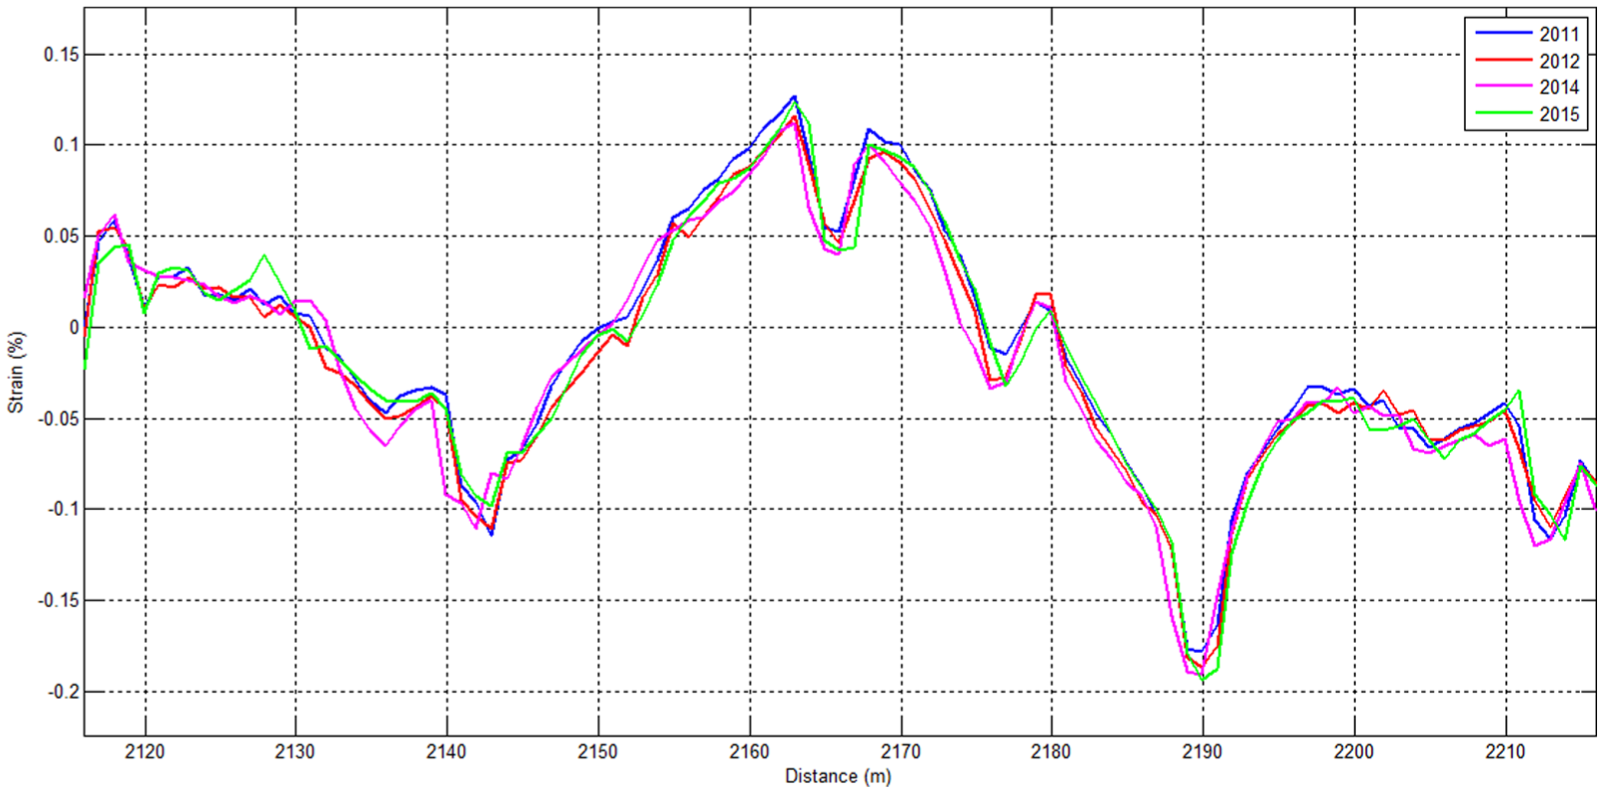
Four times IMU tool inspection for bending strain.
Installation and rotated errors
The IMU ILI tool should remain in the pipeline centerline when the tool runs. This can reduce the initial attitude error to measure the more accurate inspection data. However, it is hard to reduce this error completely in actual work.
In addition, in order to prevent the partial wear during the inspection, supporting wheels with a regular angle used to be installed on the tool. But the rotational error is produced during the inspection and affects the accuracy of centerline and bending strain. It is found that the regular measurement error produced in vertical direction of the pipeline centerline during the inspection. The installation and rotated errors changed spirally when the tool ran in the pipeline (Christopher et al., 1996).
The measurement deviation affects the accuracy and repetition of the measurement and the computation of the bending strain. In order to reduce these errors, different sizes of an IMU tool require repeatedly pull through test for a straight test pipeline to collect the inspection data (Ma et al, 2012). Multi-inspection should be operated to compute the installation error angles and rotational error by the method of data fitting (Hart et al., 2014).
Noise of the IMU ILI tool for bending strain
When the IMU ILI tool runs in the pipeline, the attitude that includes pitch and azimuth of ILI measurements are always affected by noise and errors, which are caused by the leap of weld and vibration of measuring devices. According to formula 3-7, for the calculations on the bending strain, the results are very sensitive to the noise and errors and deviate from the real values. This problem should be considered for exact integrity assessment.
Spectrum analysis and filtering of the signal are the important methods to process this issue. Discrete Fourier transform (DFT) is the basic method of Fourier analysis method of signal analysis. Fourier transform is the core for Fourier analysis that is widely used in signal processing, image processing and quantum physics, and so on. The collection of signal can be used with DFT transform from the time domain to the frequency domain, and then research the spectrum structure and variation to the signal. Another useful method of signal analysis is wavelet analysis, which belongs to time domain analysis. For the traditional Fourier transform, the signal is completely unfolded in the frequency domain, which does not contain any time domain information. However, dropped time domain information may be equally important for certain applications, so the promotion of the Fourier analysis is researched. The wavelet transform is an analysis method of time- frequency that includes characteristics of multi-resolution analysis. It has the ability to characterize the local signal characteristics in the time domain and frequency domain.
The signal of the IMU ILI tool can be used in these two methods to analyse the spectrum. Hart et al. (2014) present the process method for the noise of the IMU ILI tool. A suitable low-pass filtering is selected with cut-off frequency from spectrum analysis. As shown in Figure 12, the effect of the filtering is obvious as it virtually reduced the system noise.
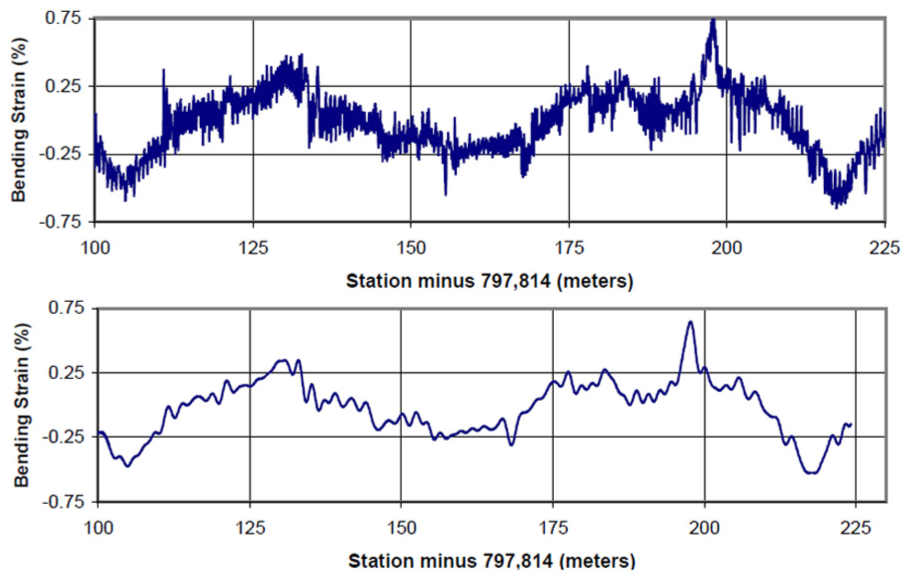
Comparison for unfiltering and filtering bending strain
Feature identification for the pipeline bending strain
The analysis and identification of the feature for the pipeline bending strain is the key for the IMU ILI tool. The bending strain calculated by the IMU ILI tool data includes types of the features for the whole pipeline such as displacement, deformation, dent, bend and girth weld, and so forth. These features should be distinguished and identified for integrity assessment. In view of the characteristics of pipeline bending strain, the method of feature identification can be divided into several processes.
Bayesian is a type of identification algorithm based on probability statistics algorithms, such as Naive Bayesian algorithm. These algorithms mainly use Bayesian theory to predict the likelihood of an unknown sample belonging to the category, and then select a most likely category as the final category of the sample. The establishment of Bayesian theory needs a conditional independence assumption, but this assumption is often not established in reality, thus classification accuracy will be declined. For this reason, there have been developed a number of modified independence assumption Bayesian classification algorithms, such as Tree Augmented Naive Bayesian algorithm, which is the property of the association between the increases in the basis of Bayesian network structure.
Support vector machine (SVM) is a method based on statistical theory that puts forward new methods of learning (Lin and Lin, 2003). The greatest feature of SVM is based on the structural risk minimization criterion (Ahmad et al., 2014), which uses the maximize classification interval to structure optimal hyper plane to improve the generalization ability of learning machine (Kim and Choi, 2014). It can be used to solve the problems of nonlinear, high dimension, and so on. For the identification of signal (Devos et al., 2014), the SVM calculates the surface area of decision based on the region of the sample, thereby determining the area of the unknown sample category (Claesen et al., 2014).
The Neural Network (NN) is another method that is used to process the identification of the feature for bending strain (Sudheer and Jain, 2014). This method is similar to brain synapses coupled mathematical model of information processing of an application. In this model, a large number of nodes (or “neurons” or “unit”) (Kalchbrenner et al., 2014) are connected to form a network that achieved the purpose of processing information (Cohen et al., 1987). Usually, the neural networks require training, which is the process of network learning. The value of connection rights of the network is changed by training progress to have identification function. The trained network can be used to identify the different feature. Currently, there are hundreds of different neural network models that can be used to solve the problem of signals identification, such as common BP network, RBF radial basis network, Hopfield network, Stochastic Neural Networks, competitive neural network, and so on (Zamora-Martínez et al., 2014).
In summary, these identification methods can be used to process the inspection signal, which help technicians to analyze the features more effectively. But these methods should be improved by the analysis of the feature to achieve more accurate identification.
Statistical identification of pipeline displacement
When the pipeline endures the external stress to lead the longitudinal displacement, it will displace to two directions that are horizontal and vertical, respectively. The changes of bending strain are used to detect the local pipeline where displacement occurred. For the high precision IMU, when the change of bending strain is more than 0.02%, the displacement can be detected. Some advanced technological IMU ILI tools can detect the smaller displacements that are lower than 0.02%. This is more useful to the micro-seismic and large load area. Once the change of bending strain has been detected, the analysis of displacement should be processed (James and Zulfiqar, 2008).
The IMU ILI tool runs in pipeline to collect the attitude information by a stable frequency. These discrete points describe the movement angular of the tool (SSD Inc, 2007). When the repeat run in the same pipeline to detect the change of bending strain, these displacements of local pipeline can be computed by the discrete attitude angular. The method of numerical integration is used to compute the displacement. When a tool inspects along the pipeline, its change in vertical position (Δy) is carried out by following equation (Cayz and Wainselboin, 2003):

Where the V is the velocity of the tool run along the axis of the pipeline from odometer, θ is the angle of pitch of the tool relative to the horizontal and Δt is the interval in time. By Equation 3-3, the displacement of the pipeline can be computed. However, the accumulated error is produced by the odometer, which is described in section 2.4. This accumulated error is increased by the integration, which leads the accuracy of displacement to decrease. The filtering algorithms, including interpolation and polynomial, can be used to solve the noise and accumulated error (Aue et al., 2007). The method of polynomial is easy computer implementation, integration and differentiation. The order of the polynomial is selected based on the accuracy level required (Short and Ogunjimi, 2001). The filtering computation of displacement can be verified by pull through and field test.
Another computation of displacement is based on the pipeline bending strain. As shown in Figure 13, curvature of pipeline specifications are more easily understood as deflection that would be seen at the center of a 12 m deformation – the typical minimum length for detection and characterization. The limit case of a threshold strain will produce different deflections in different pipeline diameters for a deformation length. For this method, it assumes that the curvature is at threshold for the entire length of the deformation, and that the initial and final portions (each of length L/4) take the pipe away from a straight line, with the central portion (of length L/2) curving to connect them. Pattern in a plot of curvature against distance that is characteristic of environmentally induced deformation. Pattern in a plot of curvature against distance is the characteristic of deformation induced by environment. In the case of a free span, the central deformation is an under bend with an over bend at either end. The displacement can be computed by following formula:

where L is the length of pipeline and R is the measured curve radius that can be computed by the bending strain. This method is effective to process the value of displacement where the pipeline displaced in high degree of confidence. The important step is align the same local pipeline. All the spools of pipeline should be aligned with the girth weld information.
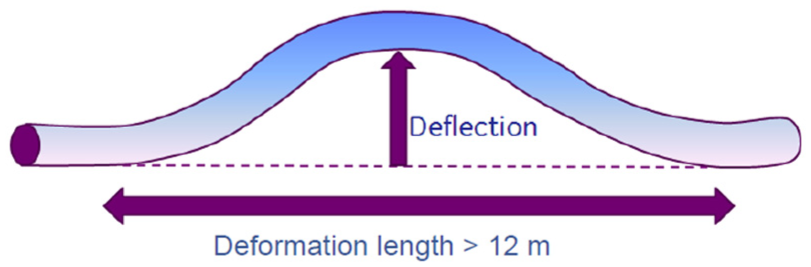
A typical displacement for the bending deformation.
The neural network method has been successfully applied to process the signals of displacement analysis and calculation. Different kinds of samples from the different size pipelines. The feature of the field sample can be decomposed into several factors. The actual displacement is measured by level meter and ruler. The computed model is trained by these data for predicting or computing other data. However, the neural network is very sensitive for initial weights and initialize the network in different weights, which tend to converge to different local minimum. Secondly, the convergence of neural network is slow, and the generalization ability is poor. These disadvantages need the appropriate improvements to neural network
The Wavelet Neural Network (WNN), based on the topology of BP Neural Network, uses wavelet basis function as transmit function in Hidden layer nodes. The signal transmits forward when the errors transmit in opposite direction. The WNN is derived based on the Neural Network and Wavelet theory. It is effective at localization of wavelet transform and combines with the self-learning ability of Neural Network. The WNN can be adapted to reduce extrapolation errors according to new data. The adjustable parameters of the structure of WNN could shorten the training time as well. This method can be used to identify the displacement of pipeline based on bending strain more effective.
Finite Element Analysis used in pipeline displacement
Finite Element Analysis (FEA) is a modern calculation method for the analysis of structural mechanics that developed rapidly (Luo et al., 2014). It is a numerical technique for finding approximate solutions to boundary value problems for partial differential equations. The whole problem is subdivided into smaller, simpler parts that are called finite elements. FEA methods could minimize the error of approximation by fitting trial functions into the partial differential equations. A stable solution could be achieved when the error function reached a minimum. Compared with continuous multiple segments for minor-linear approximation circle, the FEA contains all possible methods that are much simpler for equation of small areas, and it is used to estimate the complexity of a larger area of the equation. The advantage of FEA method is not only high accuracy, but also high applicability; it could be used with a variety of complex shapes, thus becoming an effective method of engineering analysis.
Pipelines constructed through mountainous areas are susceptible to landslides or other geological disasters. In order to monitor the displacement and strain changed, the IMU ILI tool is used to determine the pipeline position and strain. To extend the capability of this inspection, the FEA can be used to predict the future integrity of a pipeline subject to extra loadings from multiple inspections. The FEA used in calculation for pipelines is not only based on interpreting inspection data alone, it also includes the effects of soil-pipe interaction and axial pipeline stress to provide a more complete assessment of pipeline integrity (Liu et al., 2010). Lockey and Young (2012) researched the FEA applied in calculation of pipeline strain to large diameter oil pipeline. Some benefits are used for the pipeline operator by this method based on IMU ILI. The remedial works of plan is more certainty by the reliable prediction for pipeline subjected to extra loading. The knowledge of pipeline movement is assisted the operator in scheduling further ILIs as well and making a cost-effective contribution to an integrity management system.
The FEA is an effective method to develop the inspection data of IMU tool for the inspection of bending strain and displacement of the pipeline. This method is not only used for assessing the bending strain, but also can be used for other results of ILI such as metal loss, geometry, and so on. Therefore, the operator or company achieves the maximum value from the ILI budget and investment.
Future development
The current status of research for ILI for pipeline centerline and bending strain achieves some gratifying results in theoretical and experimental studies. The accuracy of position can achieve±1m, the identification of bending strain changes can achieve 0.02%. However, some developments for this ILI should be carried out such as: engineering using less quantitative research; the accuracy of sensors of gyro or accelerometer needs to be improved in limitations of space with the ILI tool; the algorithm of pipeline centerline and bending strain to be further improved; other noises and error should be further corrected.
The other auxiliary device amount on the IMU ILI tool, such as odometer and tracking system, should be also developed. Owing to the accumulated error of odometer, the mileages for multiple inspections are different. The smaller accumulated error of odometer should be improved by the technology and machinery. For the tracking system, the performance for anti-interference ability, detection of the depth of tool and higher precision of trigger time of marker should be improved. For the limit space of the IMU ILI tool, the drift error of inertial sensors is more important for the accuracy of data collection. The higher accuracy of inertial sensors gyro and accelerometer are applied in the ILI, the calculation for pipeline centerline can be corrected in longer periods with the external reference.
Most importantly, the calculations of pipeline centerline and bending strain should be further developed. The algorithm of multi-sensor data fusion is the basic method to compute the pipeline centerline. This method based on the discrete nonlinear Kalman filtering. In recent years, many researchers have improved the Kalman filter, and use other advanced algorithms to assist it to improve the accuracy of the algorithm. With development of intelligent algorithms, the accuracy of calculation for pipeline centerline will be improved.
Although the pipeline bending strain is inspected by the IMU ILI tool, the application and assessment is limited (Marewski, 2012). As the important assessment parameter, currently, assessment method based on the bending strain is insufficient. Now the consistent evaluation method is not carried out elsewhere. The research of this work should be processed by the effort work.
Conclusions
The IMU ILI become an important method to measure the accurate position, pipeline displacement and bending strain of buried oil and gas pipelines. It is important to offer the pipeline positon for operators and managers to survey and excavate the defects easily. The calculation of bending strain based on this inspection can be also used to identify the pipeline displacement that endures the extra stress, such as frost heave, earthquakes, and so on. The IMU ILI is the effective method for PIM and safe operation for buried oil and gas pipelines.
This paper introduces the principle, measuring methods and analysis of inertial measurement unit in-line inspection (IMU) method:
IMU ILI is the effective method to inspect the centerline for long-distance buried oil and gas pipelines. The precise position of the pipeline can be computed by the ILI tool. Based on the centerline result, the displacement and pipeline bending strain can be calculated. Application of this work: the operator runs the ILI tool to inspect the pipeline and assesses the integrity of structure for the pipeline.
The IMU ILI tool consists of inertial and non-inertial sensors such as gyro, accelerometer, odometer, girth weld detector and other auxiliary device. The performance of these sensors effect the accuracy of inspection. The ground marking system is the important information for the position correcting.
The algorithm of multi-sensor data fusion is the common method to compute the pipeline centerline. Several calculations have been researched to apply the centerline process. This method should be improved by the development of intelligent algorithms.
Statistical identification method is used to identify the feature of deformation that are caused by displacement owing to the extra strain. The neural networks and other identification algorithms can be used to identify and quantize the features.
During the inspection, the noise and spiral error would be effected the accuracy of the calculation for centerline and bending strain. These errors should be reduced in order to the improvement of inspection accuracy.
The FEA can be used to analyze the pipeline displacement based on the IMU ILI. It not only simplifies assessment of the bending strain, but also can be used by other types of results of ILI for the pipeline integrity assessment.
Footnotes
Declaration of conflicting interest
The author(s) declared no potential conflicts of interest with respect to the research, authorship, and/or publication of this article
Funding
The author(s) disclosed receipt of the following financial support for the research, authorship, and/or publication of this article: This work was supported by the project of Petrochina Pipeline Company, “The research of safety service of buried pipeline in permafrost region”.