
Abstract
Electronic tongue mimics human gustatory sensation and is used to characterize and discriminate beverages and foods. Feature extraction plays a key role in improving the classification accuracy by preserving the distinct characteristics while reducing high dimensionality of data generated from electronic tongue. This paper presents a new feature extraction method based on stationary wavelet singular entropy for a developed electronic tongue system to classify pasteurized cow milk. The electronic tongue consists of an array of five working electrodes along with a reference and a counter electrode to characterize milk sample. The feature extraction of acquired data is done by computing stationary wavelet transform to obtain detail and approximate coefficients at different level of decomposition. These coefficients are processed using singular value decomposition followed by calculation of entropy to obtain stationary wavelet singular entropy values. These values form the feature set and feed to two classifiers, k-nearest neighbor and back propagation artificial neural network, and their classification accuracy is evaluated with variation in their model parameters. The proposed method is compared with other wavelet transform-entropy methods in terms of classification accuracy, which indicates that the proposed method is more effective in discriminating milk samples.
Keywords
Introduction
The ability to mimic human sensation using an artificial sensor system has been an area of continuous interest. Electronic tongue is an artificial sensor system made up of an array of sensors having various degree of selectivity combined with pattern recognition method to complement the gustatory sensing of humans and collect data indicating chemical composition of a sample. This data is useful to discriminate, analyze and characterize beverages and foods. Voltammetry is one of the methods used for electronic tongue in which an electrical potential is applied between a noble working electrode and a reference electrode and the resulting current between counter electrode and working electrode is measured. A plot of resulting current as a function of applied potential, called voltammogram, provides the data that can characterize a sample under analysis (Ivarsson et al., 2001). It is a popular technique that has been applied for discrimination and analysis of various foods and beverages like coffee (Morais et al., 2019), olive oil (Dias et al., 2016), honey (Hassani et al., 2018), fruit juices (Wu et al., 2017; Yu et al., 2018) and rice (Lu et al., 2016). In context of classification of milk, a few literatures on electronic tongue are reported. Pascual et al. (2018) implemented voltammetric electronic tongue to discriminate five varieties of milk and predict its sensorial attributes. A voltammetric electronic tongue based on array of biosensors is reported to discriminate between milk samples and predict its lactose content. (Salvo-Comino et al., 2018). Bougrini et al. (2014) proposed a hybrid electronic nose and electronic tongue system to discriminate different pasteurized milk brands and recognize milk sample of different storage days. An excellent discrimination was achieved from data fusion of the combined system. However, no clear discrimination was seen when electronic tongue system was used individually. In work conducted by Wei et al. (2013), a multi-frequency rectangular pulse and staircase pulse voltammetry was implemented to characterize milk samples based on storage time and predicted the total bacterial count and viscosity of milk sample.
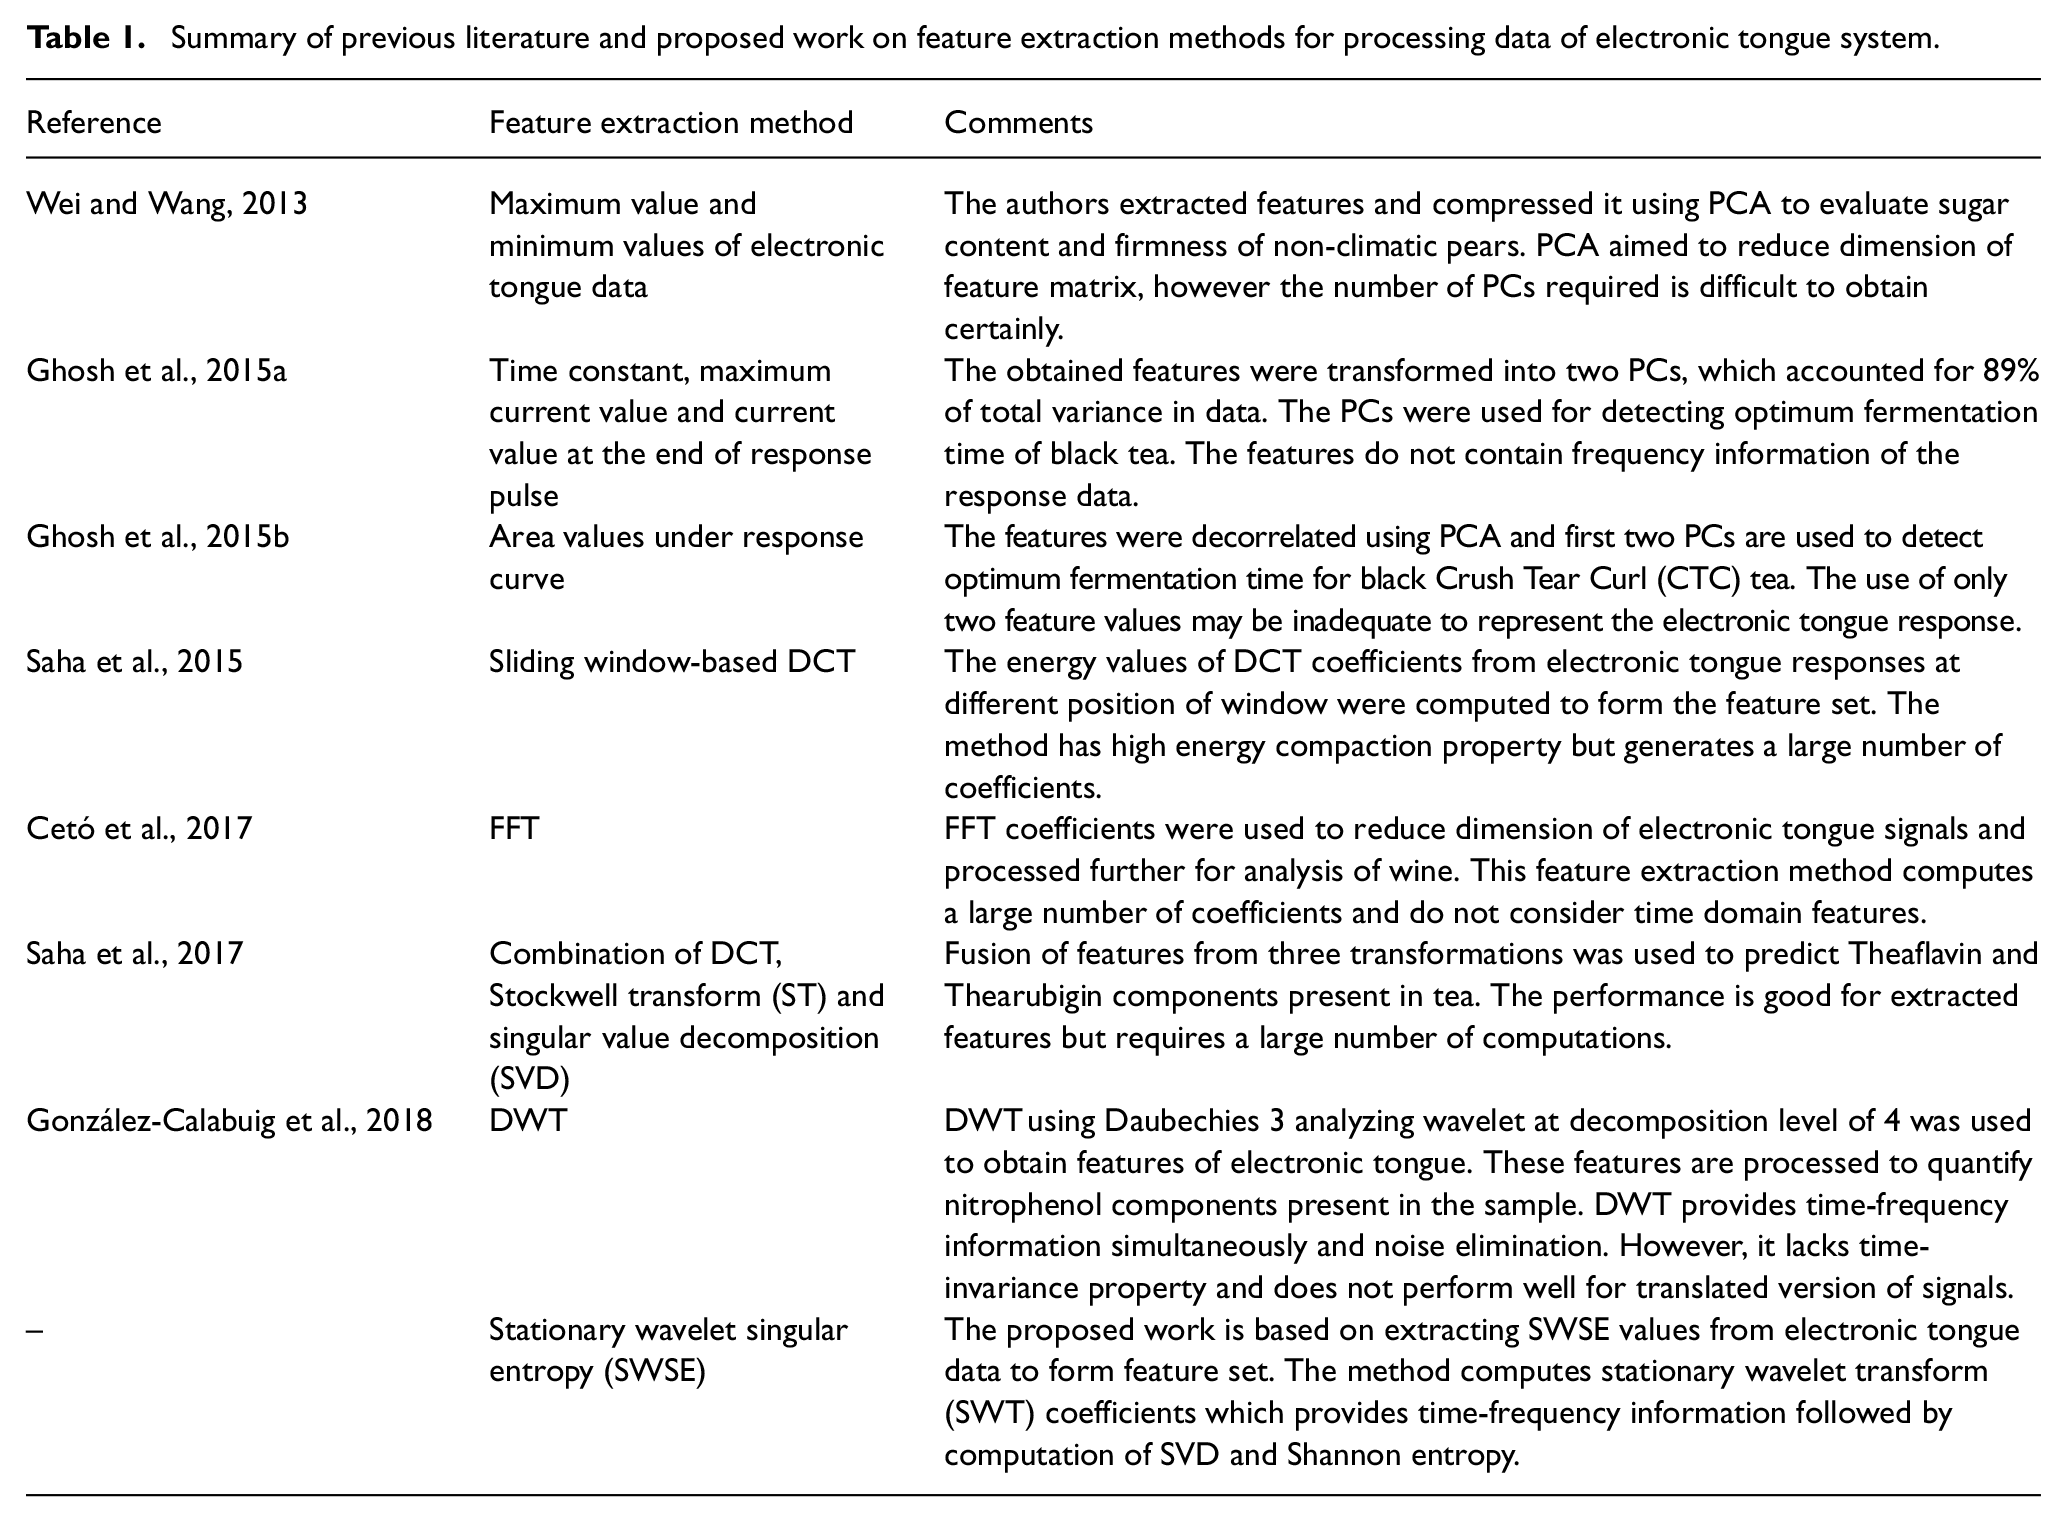
Due to large amount of data generated in an electronic tongue system, feature extraction is required that reduces the dimensionality of data matrix and extract features while retaining the class discriminatory information as much as possible. An optimal set of features is desirable as it leads to improved performance of an electronic tongue system. Table 1 presents the summary of the previous literature results and the proposed work for processing the data of electronic tongue system. It can be seen from the table that geometric based feature extraction methods like principal component analysis (PCA), peak values, area parameters of response of electronic tongue were reported to reduce dimensionality of electronic tongue data. However, these features are limited in number and also do not provide any frequency information present in the response. The transformed based methods like discrete cosine transform (DCT), fast Fourier transform (FFT), discrete wavelet transform (DWT) were used to compress the data by providing time, frequency information but it generates a large number of coefficients. The selection of few coefficients from all the transformed coefficients to form a feature set can lead to removal of vital information that inadequately represent the sample and thus system performance degrades. This motivated us to explore transformation methods with feature reduction technique to obtain an optimal feature set that can characterize the electronic tongue data.
Summary of previous literature and proposed work on feature extraction methods for processing data of electronic tongue system.
In this paper, work is carried out using stationary wavelet singular entropy (SWSE) as a feature extraction method to process electronic tongue data for classification of milk. The proposed method is rarely investigated for feature extraction of electronic tongue data. In this novel method, stationary wavelet transform (SWT) (Sharma and Sunkaria, 2018; Sundararajan, 2015), singular value decomposition (SVD) (Elden, 2007) and information entropy (Shannon, 1948) are combined to process data of electronic tongue to obtain a feature set. SWT simultaneously provides time-frequency information of time series data of electronic tongue in terms of approximate and detail coefficients. These coefficients account for changes in data of electronic tongue due to electrochemical process occurring at electrode surface during cyclic voltammetry and are used to form feature set for characterization and discrimination of milk samples under different storage days. SWT offers significant advantage over conventional DWT for processing electronic tongue data due to its time-invariance property. It means that for a translated version of electronic tongue data, the information of the signal is adequately captured. The feature set is obtained by computing singular entropy of the SWT coefficients using SVD and Shannon entropy. SVD is computed for obtaining spatial features, data compression and de-noising of wavelet coefficients, whereas information entropy provides the complexity of the features.
The SWSE was applied to extract features in other fields. The SWSE was used to extract fault signature pattern for diagnosis of bearing failure. In another work, SWSE features were extracted from MRI brain images for pathological brain detection (Wang et al., 2018). It was found that the performance of SWSE was superior as compared to other wavelet-entropy methods. The implementation of SWT with singular entropy for signals generated by electronic tongue system can prove to be a useful method for extracting vital features for sample characterization and discrimination. The extracted features from electronic tongue are used by classification models for discrimination of the samples. The back propagation artificial neural networks (BP-ANN), support vector machine (Han et al., 2017), linear discriminant analysis (Cetó et al., 2015) and k-nearest neighbor (k-NN) (Silva and Paixão, 2017) were reported in studies for classification purpose. The proposed feature extraction method is applied to electronic tongue data to discriminate and classify milk samples stored for four consecutive days. Two classification models, k-NN and BP-ANN are used to evaluate the efficacy of feature extraction method in terms of classification accuracy. Further, the experimental results are compared with results obtained using discrete wavelet singular entropy (Zarei and Asl, 2018), discrete wavelet packet singular entropy (Lin et al., 2016), stationary wavelet packet entropy (Alves et al., 2018), SWT combined with multi-scale permutation entropy (Li et al., 2017; Ouyang et al., 2013), energy entropy and energy difference entropy (Bafroui and Ohadi, 2014; Li et al., 2019).
This paper is organized as follows. Section ‘Electronic tongue’ describes the developed electronic tongue setup in detail. The algorithm to compute feature extraction based on SWSE for developed system is discussed in the ‘Proposed method’ section. In ‘Experimentation’, the data collection on pasteurized milk using electronic tongue is presented. In ‘Results and Discussion’, the SWSE is implemented for discrimination of milk samples and compared with other feature extraction methods. The final section provides the concluding remarks.
Electronic tongue
The electronic tongue consists of an array of five metal wire type working electrodes, made up of gold, iridium, rhodium, palladium and platinum, an Ag/AgCl reference electrode and a platinum counter electrode (pH ionics, India) The functional block diagram of the electronic tongue is shown in Figure 1. The system consists of a three electrode electrochemical cell, a potentiostat unit, signal generation and working electrode selection unit, data acquisition unit, feature extraction and classification unit. The hardware set up of the system is shown in Figure 2. The signal generation unit is designed using a 8 bit microcontroller ATmega328 interfaced with Digital to Analog Converter DAC0808 to produce bipolar analog voltage range from –2V to +2V with resolution of approximately 38 mV. The output voltage range and scan rate can be adjusted by suitably programming the microcontroller. The Potentiostat unit maintains the potential of a working electrode at a constant level relative to reference electrode by adjusting the current at counter electrode. It uses a control amplifier that keeps voltage between reference electrode and working electrode close to output of signal generation unit. The resulting current between counter electrode and working electrode is measured using data acquisition unit. The working electrodes are sequentially changed by using working electrode selection circuit by the digital outputs from data acquisition unit. The three-electrode electrochemical cell consists of a round bottom flask to hold a milk sample (200 ml), which is to be analyzed. The flask has three mouths through which the three electrodes namely, working, counter and reference electrode, are dipped into the sample. All the five working electrodes are immersed into the sample but amongst them all only one is selected at a time, which is controlled by the selection circuit. The resultant current from potentiostat is converted to voltage using I to V converter and acquired. This data acquisition unit also incorporates a voltage level shifter at the output of I to V converter to shift negative voltage to positive as the data acquisition unit does not read negative voltages. All the data are stored in PC by interfacing the system with MATLAB software (version 8.1.0.604) and further analysis is done.
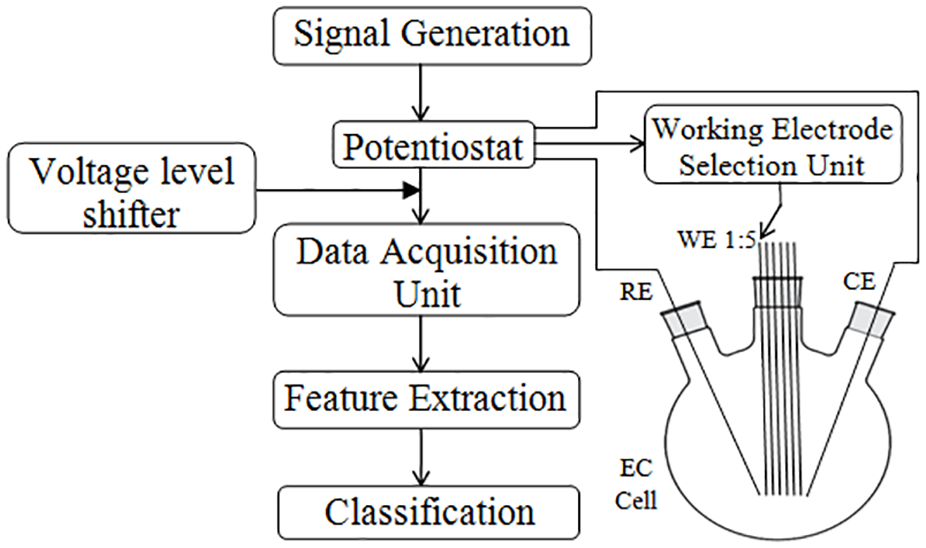
Functional block diagram of the electronic tongue.
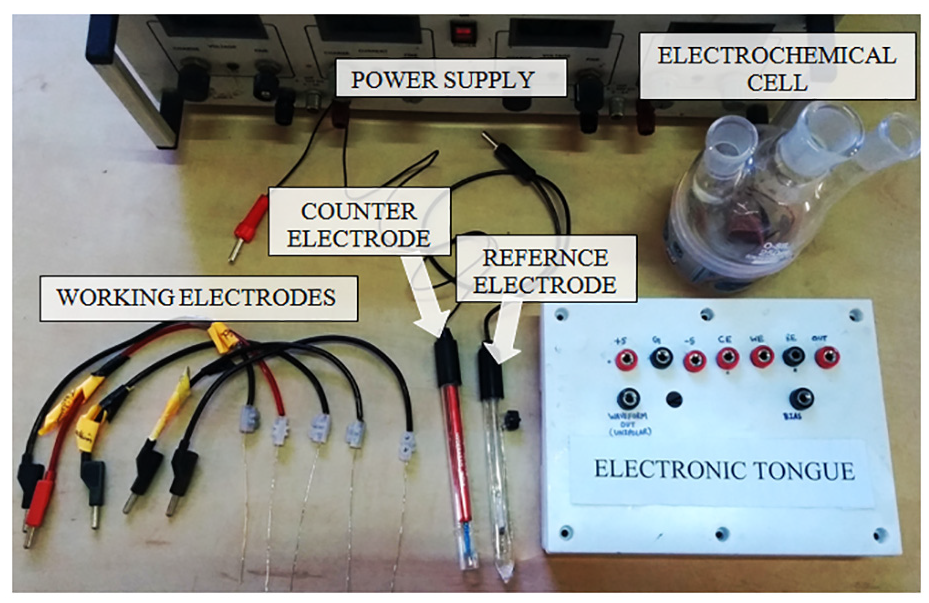
Hardware setup of electronic tongue.
The developed electronic tongue system is validated by obtaining voltammogram of a standard solution of 3mM potassium ferricyanide (K3[FeCN)6]) in 1M potassium nitrate (KNO3) solution. A triangular waveform from –0.2 V to 0.8 V is applied with a scan rate of 80 mV/sec and the resultant voltammogram is plotted, as shown in Figure 3. Since ferrocyanide/ferricyanide reaction is a one electron reversible redox reaction, a distinct anodic and cathodic peak is seen as shown in the figure. The values of anodic and cathodic peak current are calculated and found to be same as reported in literature results (Brownson and Banks, 2014). The developed system is used to acquire signals for milk samples based on storage days, which are processed further for discriminating purpose.
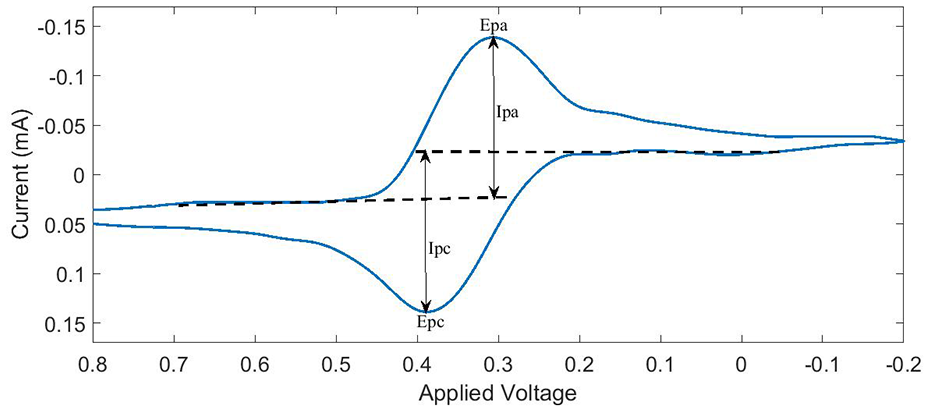
Cyclic voltammogram for a solution of 3mM potassium ferricyanide in 1M potassium nitrate.
Proposed method
The voltage data acquired from electronic tongue is preprocessed by filtering it using Savitzky–Golay filter, which is a digital filter for the purpose of smoothing the data and to increase the signal-to noise ratio without greatly distorting the signal. The proposed method for feature extraction of acquired signal is based on SWSE, which combines the advantage of SWT, SVD and information entropy. The flowchart of computing SWSE for classification of milk samples is shown in Figure 4. Initially, the voltage data for milk sample of different storage days is acquired using electronic tongue system. The decomposition of acquired data is done using SWT to obtain approximate coefficients and details coefficients. In order to decompose data using SWT, an optimal analyzing wavelet was chosen using mean squared error (MSE) criteria, whereas the optimal decomposition level was selected based on class separability measure. The obtained coefficients at each decomposition level are compressed by computing the singular values using SVD method. The probability of singular values is computed and is used to compute information entropy. The output of computation of information entropy provides the feature value, which is fed to BP-ANN and k-nearest neighbour classifier models to classify milk samples based on storage days.
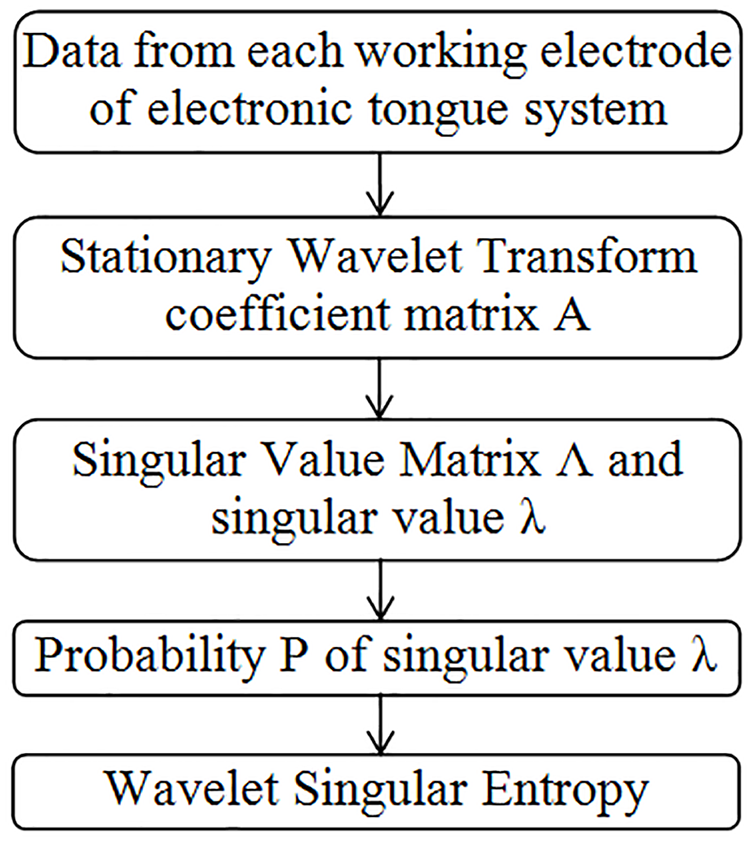
Steps for computing SWSE.
DWT
The DWT is a useful tool for the analysis of non-stationary signals as it provides time-frequency information of the signal at the same time. It is implemented by Mallat’s pyramidal algorithm, which decomposes the signal into different frequency bands by successive high pass and low pass filtering. The low-pass filter creates the approximation coefficients and the high-pass filter creates the detail coefficients. The output of high pass and low pass filter are subsampled by factor of two to constitute the first level of decomposition. The algorithm is repeated and approximate coefficient are further decomposed with high and low pass filters and subsampled. A discrete signal x[n] generated as the output of electronic tongue can be decomposed into detail coefficients, Dj[n] and approximate coefficients, Am[n] as
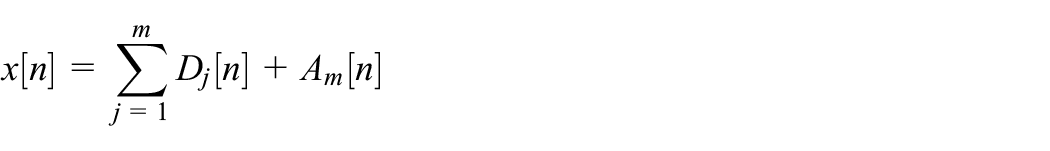
where j = 1,2…m, m is the maximal decomposition scale. The values of the coefficients depend on the shape of the analyzing wavelet and nature of information.
SWT
The SWT decomposes the signal into approximate coefficients and detail coefficients similar to DWT. One major difference between SWT and DWT is that the SWT is a translated invariant wavelet transform. It is an important property used in applications for detecting changes in time series like signals of electronic tongue. Time invariance means that SWT of a signal and its translated version are translated version of each other. It is because SWT consists of decomposing the data with no subsequent down-sampling of wavelet coefficients. Instead, the filter coefficients are dyadically up-sampled by padding them with zeroes and thus length of wavelet coefficients is same as that of length of the data. The tree diagram for computation of SWT is shown in Figure 5. The figure indicates second level of decomposition, which results in two sets of detail coefficients (D1 and D2) and one set of approximate coefficients (A2), all of length equals the length of original signal x[n].
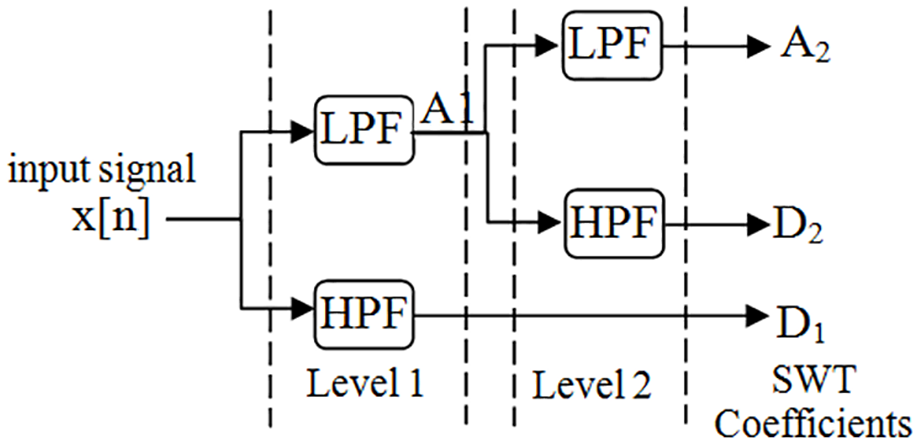
Tree diagram to compute SWT for decomposition level 2.
An optimal analyzing wavelet is chosen by computing detail and approximate coefficients of different analyzing wavelets of different orders at different decomposition level. The data is reconstructed and MSE between original data and reconstructed data is calculated. Analyzing wavelet having least mean squared error for all decomposition levels is selected as the optimal analyzing wavelet. Among Haar, Daubechies, Symlets, Coiflets, Biorthogonal and Discrete Meyer, Haar Wavelet provided minimum mean squared error for all decomposition levels and is selected as the analyzing wavelet. The optimal decomposition level is selected by applying class separability measure on obtained wavelet coefficients for all decomposition levels for milk samples of different storage days. The class separability measure uses information related to the way feature vector samples are scattered in the feature space. The method selects features in such a way that between-class distance is maximized and within-class distance is minimized in the feature vector space or feature set. This means that features should take distant values in the different classes and closely located values in the same class. The within class scatter matrix Sw and mixed scatter matrix Sm are defined as
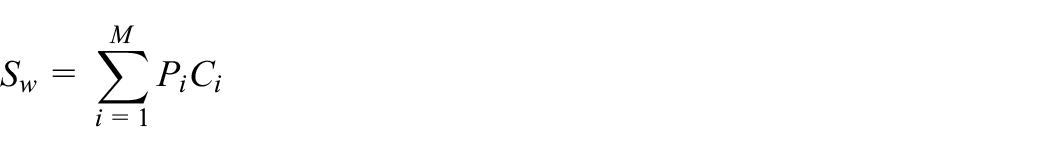


where Ci is the covariance matrix for class i, Pi is the prior probability of class i, given as the ratio of the number of samples ni in class i to the total of N samples, M is the total number of classes, x is a m-dimensional feature vector representing the data, μi is the sample mean vector of class i, μ0 is the global mean vector, and E is the expected value operator. The objective function J for selecting level of decomposition is given as
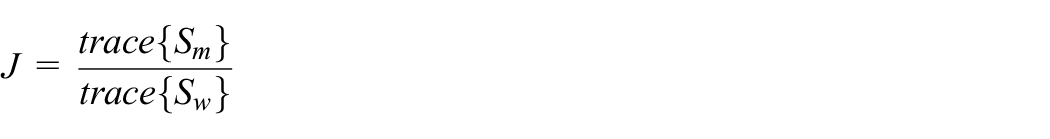
J takes large values when samples in the feature space are well clustered around their mean, within each class, and the clusters of the different classes are well separated. The level of decomposition is most optimal for which a larger value of J is obtained. In this case, the fourth decomposition level is selected as the most optimal decomposition level.
SVD
The obtained detail and approximate coefficients are stored and SVD matrix is computed. SVD decomposes a m x n matrix A into two orthogonal matrices U (m x n) and V (n x n) and a diagonal matrix Λ (n x n) as given by

where
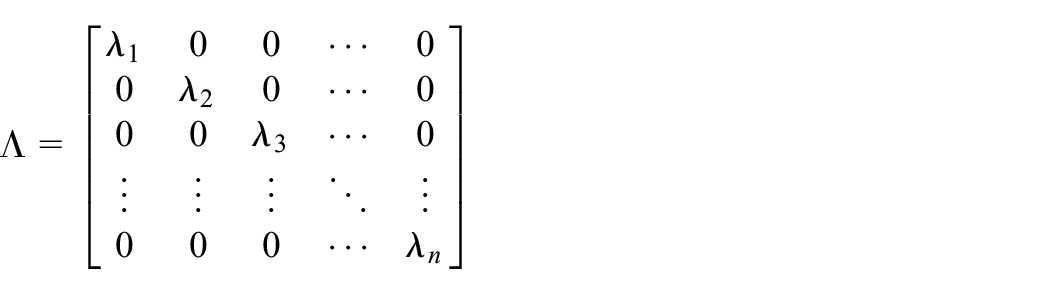
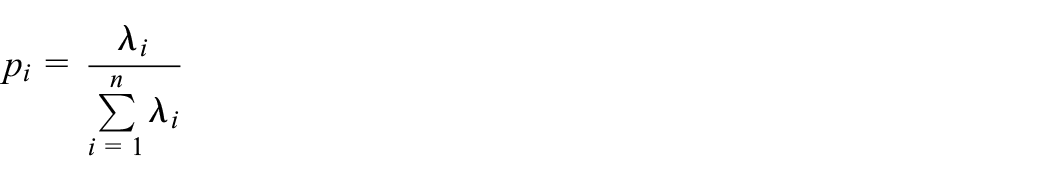
The diagonal elements λi (i=1, 2…n) of matrix Λ are non-negative singular values. The detail and approximate coefficients of each decomposition scale of SWT is stored in matrix A. This matrix is processed using SVD to obtain singular values which accounts for variance in these coefficients. The probability pi associated with singular values λi for different decomposition scale is computed as
SWSE
Information entropy is a measure of variability within a signal and indicates the complexity of the signal. The measurement of complexity of the coefficients obtained by using SWT can provide features to represent the signal. According to the principle of information entropy, the SWSE is calculated as
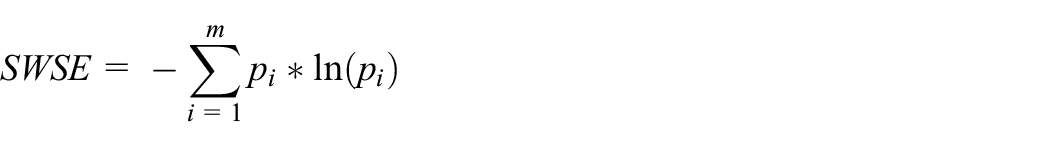
The SWSE has advantage of: (1) SWT for providing information of signal in time-frequency representation to form a feature set, (2) SVD for data compression and de-noising of wavelet coefficients, and (3) information entropy to indicate complexity of the signal. For analysis of a milk sample using electronic tongue system, the signal acquired from each working electrode is processed and SWSE value is obtained. The value of SWSE can account for changes in acquired voltage of electronic tongue system due to electrochemical process occurring at electrode surface during cyclic voltammetry. An array of five SWSE values are obtained for analysis of a single sample using five working electrodes. This forms the feature set for classification purpose. Singular entropy values using DWT, wavelet packet transform and stationary wavelet packet transform are also computed and a comparative analysis with proposed method is done.
Classification
The feature set containing SWSE values are fed to two classification models, BP-ANN and k-Nearest Neighbour, to evaluate the performance of proposed feature extraction method. BP-ANN are implemented on feature set with five input nodes corresponding to five SWSE values obtained for each milk sample. One hidden layer and a single output node are considered which provides numerical value based on storage day of milk sample. The activation function is “tansig” and “purelin” and learning rate is 0.01 and 0.1 for hidden nodes and output node, respectively. The classifier performance is evaluated by varying the number of hidden nodes from 5 to 10. K-NN is a supervised classification model in which we store the training feature set and predict the class of unknown feature set by finding out the majority of class of k closest neighbours in the training feature set. The value of k is changed from 3 to 8 and misclassification error is calculated. The largest value of k for which error is smallest is taken as the optimal value of k for k-NN model. The performance of both the classification models is validated using ten-fold cross validation method.
Experimentation
All the measurements on milk sample is performed by generating triangular waveform from signal generation unit with voltage amplitude ranging from –1.5 V to +1.5V at the scan rate of 80 mV/sec, which is applied between working electrode and reference electrode. The excitation input waveform is shown in Figure 6. Five working electrodes having diameter 0.5 mm and length 10 cm, an Ag/AgCl reference electrode and a platinum counter electrode having an area of 0.5 cm2 is used to carry out cyclic voltammetry. The working electrodes are sequentially selected and measurement is recorded for milk samples. The working electrodes are chemically cleaned with 0.1 mol/l HCl solution, followed by rinsing in deionized water between consecutive measurements. To minimize any potential drift in reference electrode, it is always stored in 3 M NaCl solution when not in use. The three-electrode electrochemical cell is used to collect 200 ml of sample to be analyzed and is kept at room temperature.
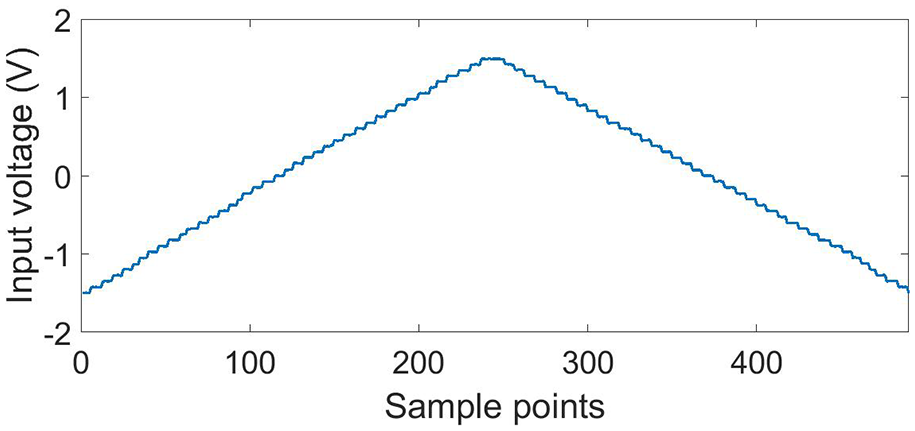
Excitation input waveform applied between working electrode and reference electrode.
Three different commercial available brands of cow’s pasteurized milk samples are taken: Katraj, Gokul and Nandani. The milk samples are analyzed for day 1, 2, 3 and 4 and kept under refrigeration at temperature of 4oC when not used. A total of 120 measurements on milk samples are recorded at ambient temperature for discriminating milk samples with different storage days. The resultant current from cyclic voltammetry experiment is converted to voltage, level shifted and acquired using 10 bit Analog to Digital converter of data acquisition unit at a sampling rate of 20 Hz. The number of measurement point generated from each electrode is 496 and thus the complete response for five working electrodes consists of 5×490 = 2450 measurement points of a single sample. Cyclic voltammetry is performed on milk samples for each working electrode and responses are acquired. The acquired data is preprocessed using Savitzky–Golay digital filter with polynomial order of 4 and frame length 11 and voltammogram is plotted, as shown in Figure 7. It can be observed from the figure that with different storage days of milk, small changes in intensity of peaks and shift in its position is seen, particularly at –0.75 V, –0.45 V and 1.4 V. Due to the presence of various components in a milk sample, it is not possible to state which chemical component causes a certain peak. Each of the components in milk having unique electrochemical properties contributes to the summed response in the voltammogram.
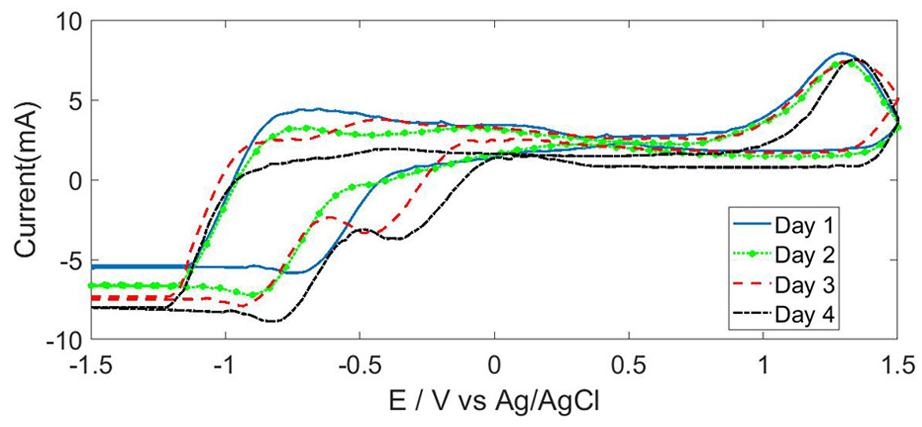
Cyclic voltammogram of cow’s pasteurized milk at four storage days using rhodium electrode as working electrode.
Results and discussion
Selection of analyzing wavelet and decomposition level
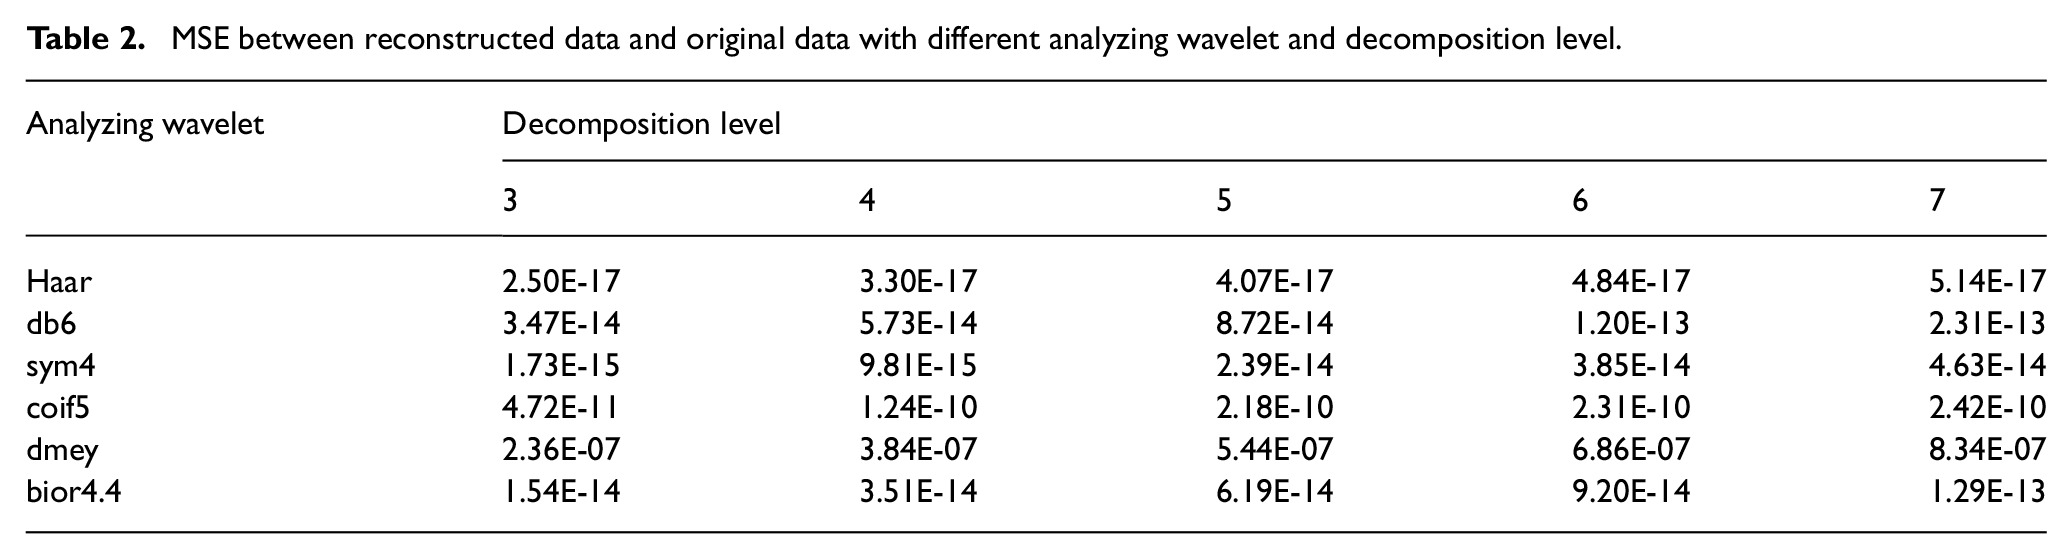
The electronic tongue presented in this work is used for discrimination of milk samples of different storage days. The acquired data is decomposed using SWT. The optimal analyzing wavelet is chosen by calculating mean squared error between original data and reconstructed data for different analyzing wavelets at different levels. Haar wavelet provided the minimum MSE for all decomposition levels and is selected as the analyzing wavelet as indicated in Table 2. Using Haar wavelet, the objective function, J of class separability technique is calculated for decomposition levels 3 to 7. The highest value is obtained for fourth decomposition level and is selected as optimal decomposition level.
MSE between reconstructed data and original data with different analyzing wavelet and decomposition level.
Computation of SWSE
The detail coefficients (D1, D2, D3 and D4) and approximate coefficients (A5) using Haar wavelet at fourth decomposition level for milk samples under different storage days for iridium electrode are shown in Figure 8.
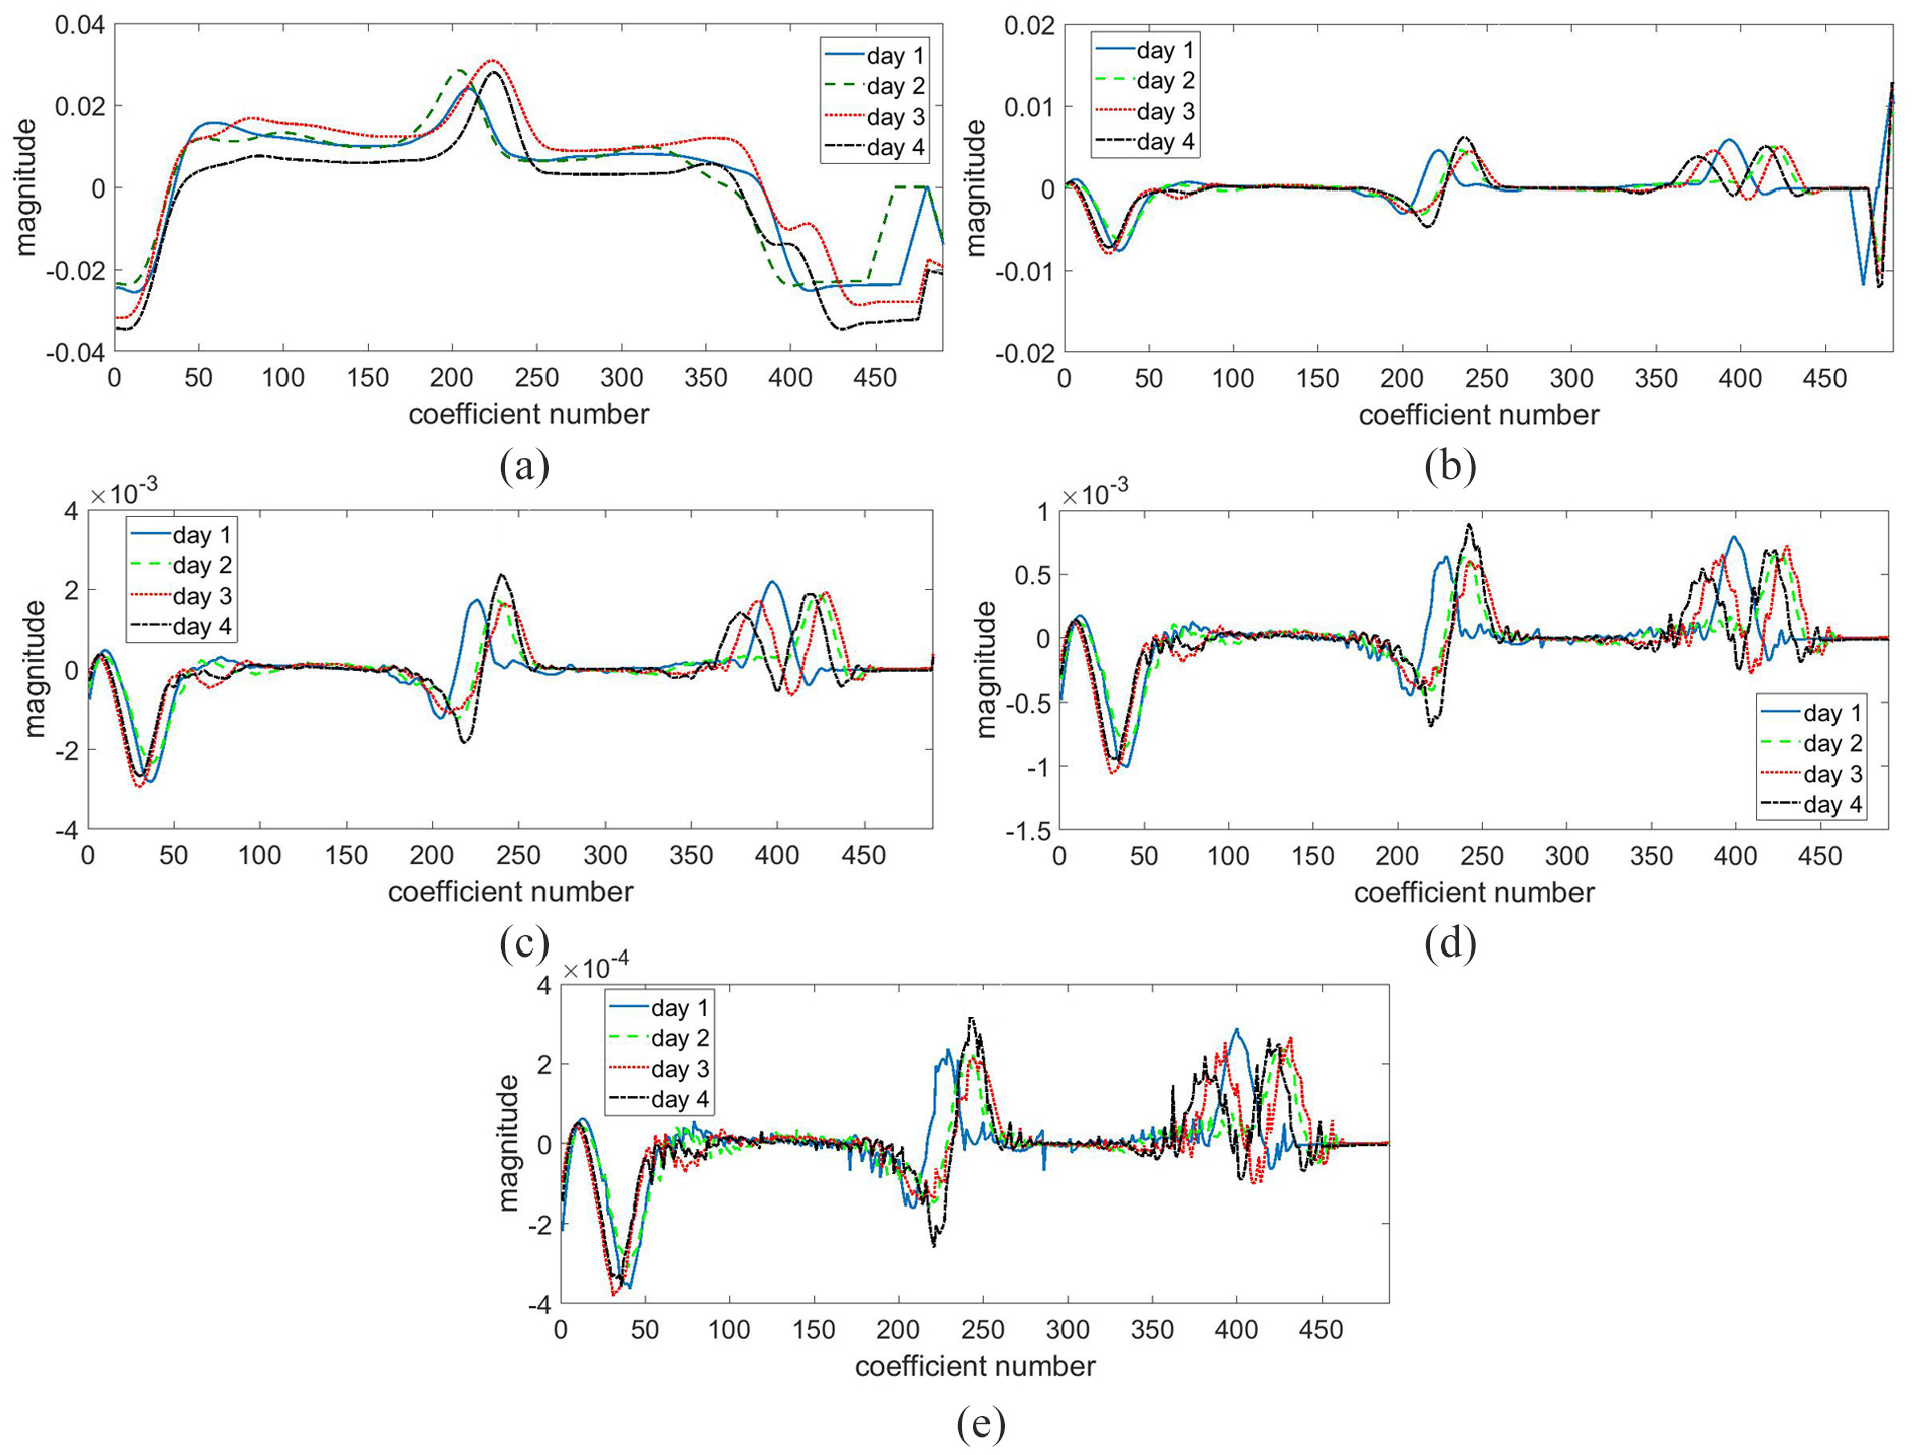
SWT coefficients: (a) approximate coefficients, (b) d4 coefficients, (c) d3 coefficients, (d) d2 coefficients and (e) d1 coefficients obtained for responses of milk samples under different storage days on iridium electrode.
It can be seen from the figure that the wavelet coefficients obtained after each decomposition level provide discriminative information for milk samples. The magnitude of coefficients of D1, D2 and D3 are relatively smaller as compared with D4 and A4. However, wavelet coefficients of all levels are preserved and processed further as they provide some discriminative information of the milk sample. Detail coefficients of each decomposition level and approximate coefficients of fourth decomposition level are reduced in dimension while maximizing the variance by computing SVD. Based on singular values, SWT singular entropy is computed.
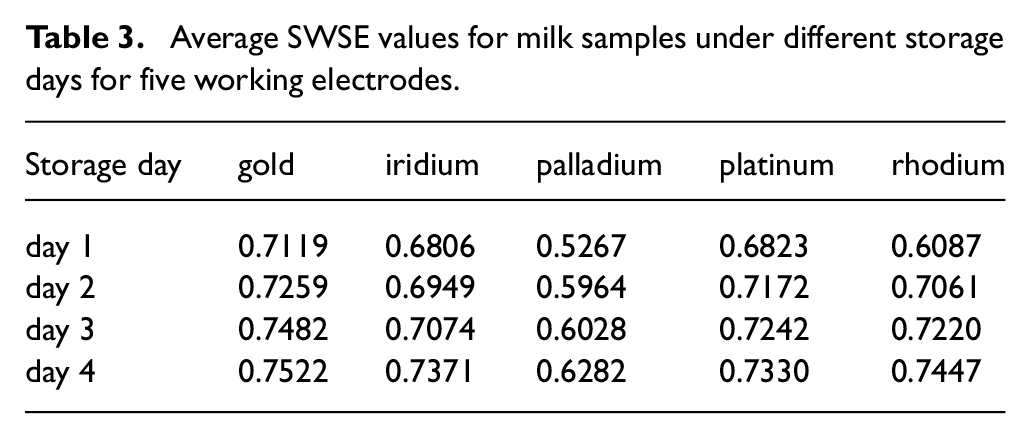
The average stationary wavelet transform singular entropy (SWSE) values of milk samples are shown in Table 3. From the table, it can be noted that a different SWSE value is obtained for responses of the working electrodes on milk samples for different storage day. Thus, the SWSE values are sensitive to milk sample and value of the feature depends on the day of storage. The value of features is increasing for milk sample under storage days indicating an increase in complexity of signals with increase in number of storage day. The values of SWSE from all working electrode forms a feature set that characterizes a milk sample under analysis. PCA is performed on obtained feature set to visualize underlying clusters of milk samples of different storage days, as shown in Figure 9. From the figure, four distinct clusters associated with milk samples of four storage days can be seen. The first principal component and second principal component has accounted for 95.06% of total variance present in the feature set. The correlation between the values of the features and storage days of milk is quantified by computing correlation coefficient (R2) by regressing first two principal components on number of storage days. The value of correlation coefficient is obtained to be 0.9953, which indicates a high positive correlation exist between storage days of milk and value of the features. Thus, the features contain rich information and can be used by classifier models to discriminate milk samples.
Average SWSE values for milk samples under different storage days for five working electrodes.
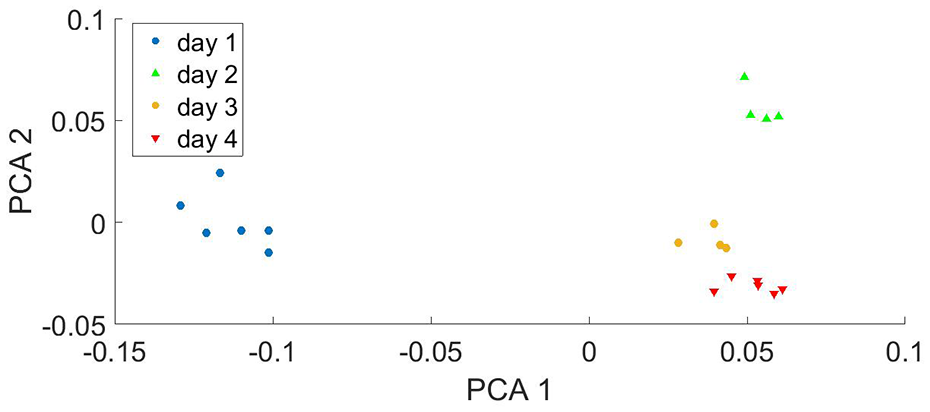
PCA score plot for milk samples under different storage days.
Classification
A total of 120 dataset is obtained for four storage days, which is used for the classification purpose. The classification result is evaluated using ten-fold cross validation method in which the dataset is divided into 10 groups having 12 datasets in each group. For each fold, one group is taken as the test set and other nine groups are taken as the training set. The feature set is fed to two classifiers, k-NN and BP-ANN, and performance is assessed by evaluating classification accuracy and standard deviation.
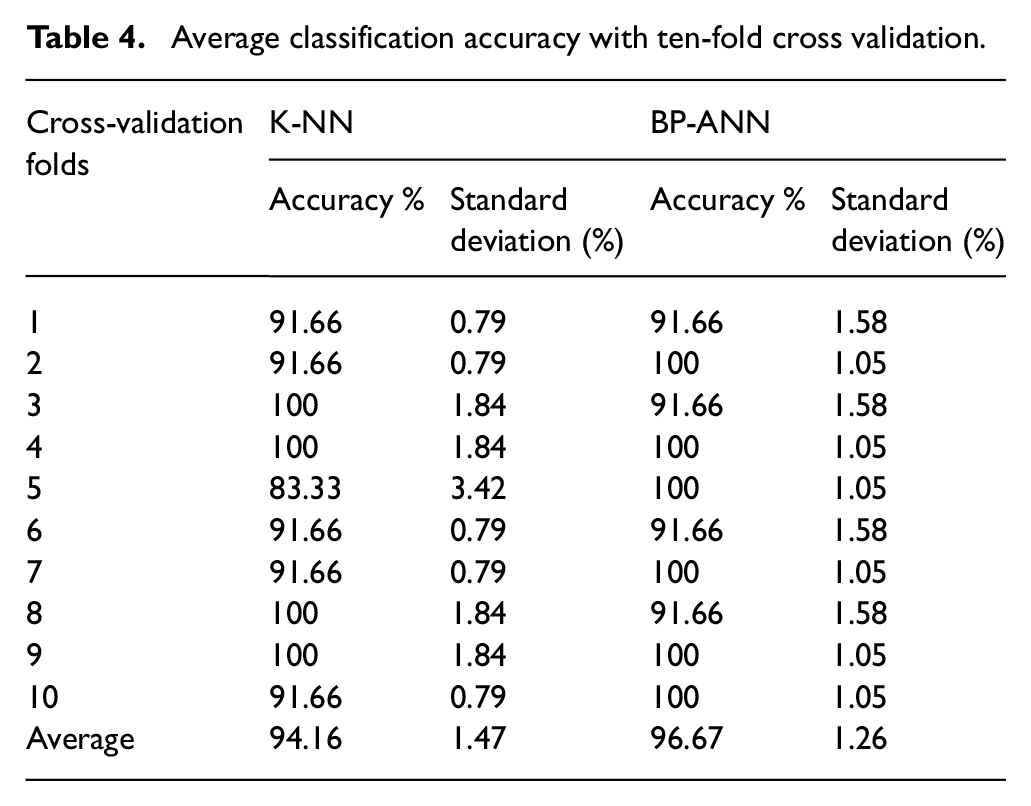
The k-NN classifier is implemented for the values of k ranging from 3 to 8 and optimal value taken as 7 as it provided highest classification accuracy as shown in Figure 10. Likewise, the number of hidden nodes in the hidden layer of BP-ANN is varied from 5 to 10 and optimal number taken is 8, as indicated in Figure 11. Both the classifiers are implemented at their optimal model parameter for each fold of cross validation and performance is evaluated, as shown in Table 4. From the table, it can be noticed that misclassification error is small for both the classification models indicating rich information contained in the features used by classification models. The BP-ANN provides the higher classification accuracy and lowest standard deviation as compared with k-NN. It is reasonable as BP-ANN is implemented using non-linear function in the hidden layer. The results are encouraging; however, a larger dataset could lead to a more generalized classification model.
Average classification accuracy with ten-fold cross validation.
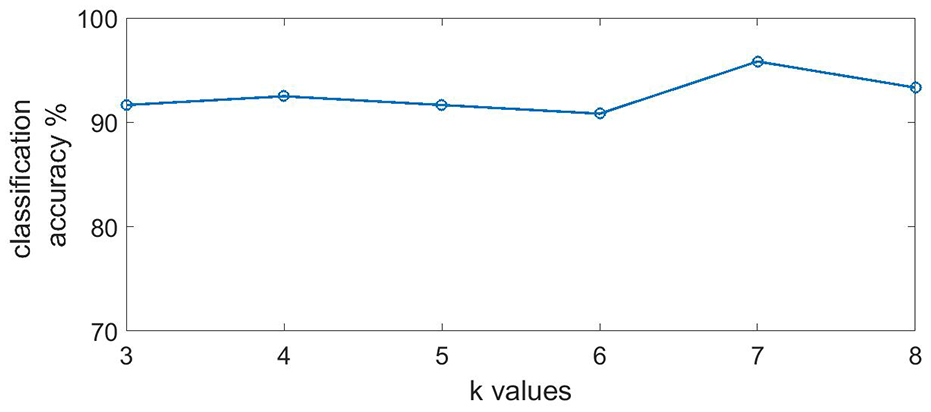
Classification result for processing features of SWSE for different values of k during tenfold cross validation.
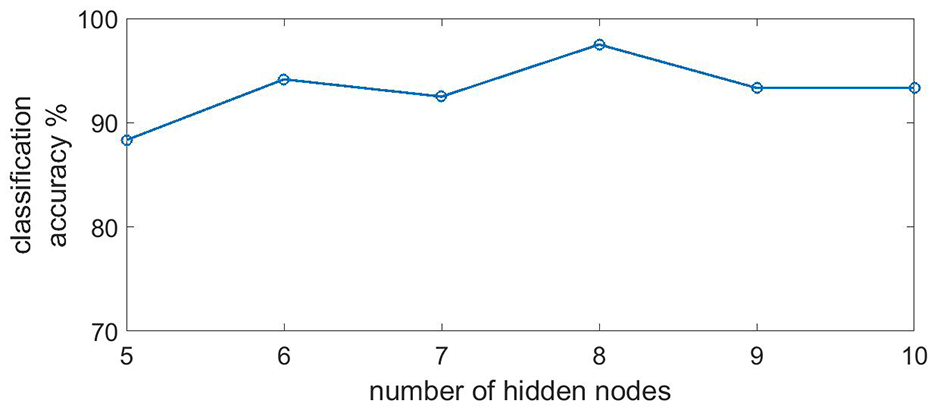
Classification result for processing features of SWSE for different number of hidden nodes using BP-ANN.
Comparison of SWSE with wavelet transforms based singular entropy
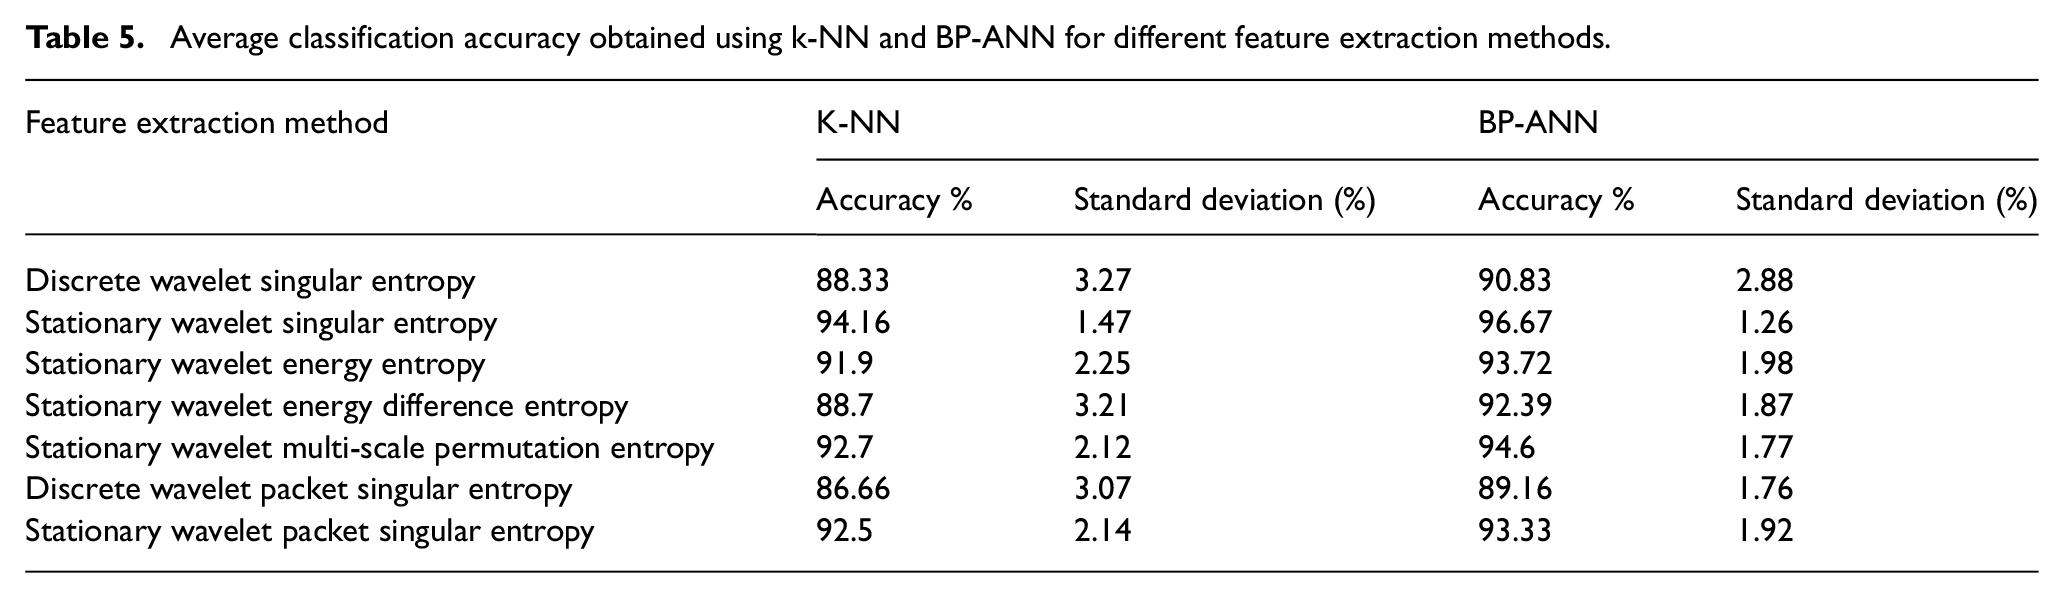
The classification results obtained using SWSE is compared with wavelet transforms combined with entropy methods such as discrete wavelet singular entropy (DWSE), discrete wavelet packet singular entropy (DWPSE), stationary wavelet packet singular entropy (SWPSE), stationary wavelet transform multi-scale permutation entropy (SWMPE), stationary wavelet transform energy entropy (SWEE) and stationary wavelet transform energy difference entropy (SWEDE). Firstly, wavelet transform is computed followed by computation of entropy values to obtain DWSE, DWPTSE, SWPTSE, SWEE, SWEDE and SWMPE. These obtained features are passed on to the BP-ANN and K-NN classifiers and performance is evaluated in terms of classification accuracy and standard deviation. The procedure to evaluate performance of classifiers is same as discussed above in the paper. The comparison of classification results is shown in Table 5, which indicates that our proposed method has outperformed other methods with highest classification accuracy of 96.67% and lowest standard deviation of 1.26. Improved performance is obtained for SWSE method, which could be due to advantage of SWT as translated invariant wavelet transform, SVD for obtaining spatial features and information entropy for indicating complexity of the data. Thus, SWSE can prove to be an alternate feature extraction method for processing electronic tongue data to enhance the quality of extracted features with limited number of feature size.
Average classification accuracy obtained using k-NN and BP-ANN for different feature extraction methods.
Conclusion
In this work, a novel feature extraction method based on SWSE is described to extract features of data generated by developed electronic tongue for classification of milk sample. The method processes the acquired data using SWT followed by SVD and information entropy to obtain feature set. The features are sensitive to milk samples and have shown high correlation coefficient of 0.9953 towards number of storage days of milk sample. The features are used by two classifiers models, k-NN and BP-ANN, and results are evaluated in terms of classification accuracy and standard deviation. The BP-ANN provided the highest classification accuracy of 96.67% and lowest standard deviation of 1.26 indicating that SWSE can be used as feature extraction tool for processing electronic tongue data. The obtained results are compared with other wavelet singular entropy methods, namely DWSE, DWPSE, SWPSE, SWEE, SWEDE and SWMPE. It is found that our proposed method provided superior performance for both the classifier models. It is due to THE advantage of SWT as translated invariant wavelet transform to decompose electronic tongue data into SWT coefficients, SVD for obtaining spatial features and information entropy for indicating complexity of the data that has led to better characterization and improved classification of milk sample. Based on these results, it can be concluded that the proposed feature extraction method presented in this paper is useful for classification of milk samples and can be implemented to discriminate different beverages and food samples.
Footnotes
Declaration of conflicting interests
The author(s) declared no potential conflicts of interest with respect to the research, authorship, and/or publication of this article.
Funding
The author(s) received no financial support for the research, authorship, and/or publication of this article.