
Abstract
This study examines the relationship between flexicurity policies and work–life balance, addressing the research question ‘How do higher flexicurity efforts in a country relate to employee perceptions of work–life balance?’ The European Commission adopted flexicurity in 2007 and proposed employment quality as an expected outcome. Work–life balance, a dimension monitored as part of employment quality, has so far been assumed as an implicit outcome of flexicurity, but no empirical research is dedicated to the topic per se. In this article the authors construct a composite indicator to proxy for national flexicurity efforts following the European Commission’s guidelines. For work–life balance and other individual characteristics, the authors employ data on about 74,000 EU27 employees from the three latest waves of the European Working Conditions Survey. First, findings show that the between-country differences in work–life balance were narrower in 2015 compared to 2005. Second, the multilevel analysis suggests that the higher a country scores as regards its flexicurity policies, the likelier its citizens are to report having a work–life balance.
Introduction
Globalization, technological progress, and the growth of the services sector have all reshaped working life in the past few decades. Member countries of the European Union (EU) have expressed concern about the labor markets of the future, given the increasing demand for new skills, new business models, and constantly changing consumer preferences. In this context, the European Commission focused on designing well-functioning labor markets and welfare systems within its member states (European Commission, 2017a). Thus, in 2007, in its effort to improve labor markets and welfare systems, the European Commission made flexicurity a focus of its social policy agenda, and it has remained so ever since (Bekker, 2018). The Towards Common Principles of Flexicurity Communication (European Commission, 2007) defines the policy as a mix of four dimensions: flexible and reliable contractual arrangements, comprehensive lifelong learning strategies, effective active labor market policies, and modern social security systems. The present study examines flexicurity in this framework, in a way similar to other authors such as Manca et al. (2010) and van Oorschot and Chung (2015).
Towards Common Principles of Flexicurity (European Commission, 2007) also sets out the desired flexicurity outcomes: increased employment rates and growth in labor productivity; decreased youth unemployment ratios, long-term unemployment rates, and at-risk of poverty rates; and better employment quality. So far, the stream of literature analyzing flexicurity focuses more on its impact on classical labor market performance indicators rather than on the quality of working life. Several studies focus on job/employment/income insecurity, job/life satisfaction, work stress, health, and perceived well-being. However, the literature lacks empirical evidence on the relationship between flexicurity and the work–life balance, which is one of the seven dimensions of ‘Quality in Work,’ as defined by Eurostat.
The current study addresses this gap by analyzing the relationship between flexicurity policies and work–life balance: How do higher flexicurity efforts in a country relate to how employees perceive their work–life balance? To answer this question, the study uses data on employees from 27 EU countries from the three most recent waves (2005, 2010, and 2015) of the European Working Conditions Survey (EWCS). It takes self-perceived work–life balance as the dependent variable. Flexicurity is a composite indicator that follows the European Commission’s definition. Additional independent variables include employees’ sociodemographic characteristics and care responsibilities as well as the socioeconomic and technological factors of the country where the employees work and reside. The estimation uses a multilevel logistic regression model with a binary outcome.
Literature review
Work–life imbalance is associated with decreased productivity (e.g., Hope et al., 2021), harming not only employees’ wealth but also their community’s wealth and well-being. Therefore, work–life balance (among other mental health issues) and its determinants should concern legislators (Hammig and Bauer, 2009). The recent EU Strategic Framework on Health and Safety at Work 2021–2027 (European Commission, 2021) considers promoting and improving mental health in the workplace as a top objective for the coming years. Moreover, the European Commission has set guidelines and monitoring tools to foster the work–life balance of parents and people with care responsibilities through the European Pillar of Social Rights (European Parliament et al., 2017) and the Work–Life Balance Directive (European Union, 2019). Work–life balance (as part of ‘Quality in Work,’ later renamed as ‘Quality of Employment’) is also an expected flexicurity labor market outcome, as stated in Towards Common Principles of Flexicurity (European Commission, 2007). 1
However, the literature lacks findings on the relationship between flexicurity and work–life balance. In the absence of data on perceived work–life balance, some authors assume that if other well-being outcomes are met, work–life balance may also be attainable (van Oorschot and Chung, 2015). Prior analyses of flexicurity and employee well-being outcomes can be divided based on the flexicurity 2 proxy used and further divided based on the well-being outcome studied. Most studies focus on the impact of the flexibility side, considering only the employment arrangement type to express flexicurity (Bender and Theodossiou, 2018; Berglund, 2015; Gracia et al., 2011; Green and Leeves, 2013; Klandermans et al., 2010; Origo and Pagani, 2009; Santos-Larrazabal and Basterretxea, 2021; Svetek, 2020; Virtanen et al., 2011; Wilczynska et al., 2016). Nevertheless, a few studies use more encompassing indicators (Chung and van Oorschot, 2011; Probst and Jiang, 2017; Russell et al., 2020; van Oorschot and Chung, 2015). Regarding the well-being outcomes studied, the current literature focuses on: job/employment/income insecurity, job/life satisfaction, job stress, health, and perceived well-being, as well as the interplay between these concepts. Table 1 briefly describes these studies based on the flexicurity proxy used, well-being outcome studied, samples, and findings.
Studies on the links between employee well-being and flexicurity.

Note: GDP = Gross Domestic Product; EPL = Employment Protection Legislation; FCA = flexible and reliable contractual agreement; MSSS = modern social security system; ALMP = active labor market policy; LLL = lifelong learning.
In flexicurity debates, work–life balance is usually attributed to flexible working arrangements and combined security (e.g., Larsen, 2010; Wilthagen and Tros, 2004). This assumption would imply that obtaining a work–life balance is problematic only for people with care responsibilities, and that the other employees do not face work–life conflicts. It would also imply that care services and working time flexibility are the sole enablers of work–life balance. We argue that this does not explain the entire picture. Each dimension of flexicurity contributes positively to improved work–life balance: (1) Flexible and reliable contractual arrangements (FCA) relate positively to work–life balance since atypical employment arrangements provide space to juggle different work and life demands. They also allow people with care responsibilities to be in employment. (2) Modern social security systems (MSSS) also relate positively to work–life balance since they provide reassurance of continuing a similar lifestyle in the case of unemployment. In addition, care facilities help family caregivers fulfill their work engagements. Further, (3) active labor market policies (ALMP) and (4) lifelong learning (LLL) relate positively to work–life balance since they improve employability. These dimensions mitigate worries about possible contract termination and difficulties in finding another job or a better one. They also allow employees to adjust to the labor market demands and fit into jobs that provide them with the work conditions needed to meet life demands.
The principle of institutional consistency and coherence underpinned by Schmid (1995) emphasizes the importance of a diverse combination of labor market policies that are complementary or at least compatible with each other. Following Schmid (1995), this study considers flexicurity as a consistent and coherent combination of FCA, MSSS, ALMP, and LLL. Accordingly, we construct a composite indicator to capture the joint effect of these four flexicurity dimensions.
Data and methods
Sample and endogenous variable
Individual-level data are from the European Working Conditions Survey (EWCS) 3 and country-level data are from Eurostat. The EWCS has been conducted in seven waves – 1990, 1995, 2000, 2005, 2010, 2015, and 2020/2021.
Micro-data for EWCS 2020/2021 were not available at the time of carrying out the present research. Moreover, the change in data collection methodology (from face-to-face to computer-assisted telephone interviewing), the sudden change in work and life boundaries, and the uncertainty caused by the emergence of COVID-19 require a different approach to modeling the EWCS 2020/2021 data. However, with the working life (partially) returning to pre-2020 standards, the current study’s results can provide useful policy insights.
The 1990 and 1995 waves of the EWCS included only the EU countries. The 2000 wave initially surveyed only the EU countries and Norway, and 13 candidate countries were added in 2001 and 2002. Therefore, since the earliest and most comprehensive dataset is for the 2005 wave, this study uses data from 2005, 2010, and 2015. After filtering for age, employment status, and missing values, 4 the sample covers 19,495 (2005), 25,714 (2010), and 28,740 (2015) employees aged 15–65 years from the EU27 5 (repeated cross-sectional data).
Work–life balance is measured by the survey’s question: ‘In general, how do your working hours fit in with your family or social commitments outside work?’ The answers range from ‘Very well,’ ‘Well,’ and ‘Not very well’ to ‘Not at all well.’ The proportion of respondents that answered ‘Not at all well’ is below 5% in each of the three analyzed years (Appendix A). As such, we define the dependent variable of work–life balance as dichotomous – employees who perceive work–life balance (having the value 1) are those who said that their working hours fit in very well or well with their family or social commitments outside work; their proportion in the 2005, 2010, and 2015 samples is 78%, 81%, and 82%, respectively. All other employees perceive work–life imbalance (value 0).
This means that one out of five European employees in our sample find themselves struggling to maintain a balance between their work and life roles. Moreover, the picture seems even more worrying when considering individual countries. For example, in Greece (2005), one out of two employees report difficulties in managing the two roles. In contrast, almost 9 out of 10 Danish employees in our sample (2005) declare they have work–life balance. However, this gap narrowed in the subsequent years. In the context of equal opportunities and social inclusion inside the European Union, we believe it is useful to investigate (1) what potentially causes these differences between countries and (2) whether policymakers could improve European employees’ chances to attain work–life balance no matter their country of residence. The European Commission’s ‘better jobs for everyone’ desideratum should not be limited to material conditions.
Flexicurity indicator: Definition and methodology
We compute a composite indicator to measure flexicurity efforts within the EU27 countries. In this subsection, we describe the data and methods used. We follow the EU flexicurity framework (European Commission, 2007), which defines the policy as a mix of:
flexible and reliable contractual arrangements (FCA);
modern social security systems (MSSS);
effective active labor market policies (ALMP); and
comprehensive lifelong learning strategies (LLL).
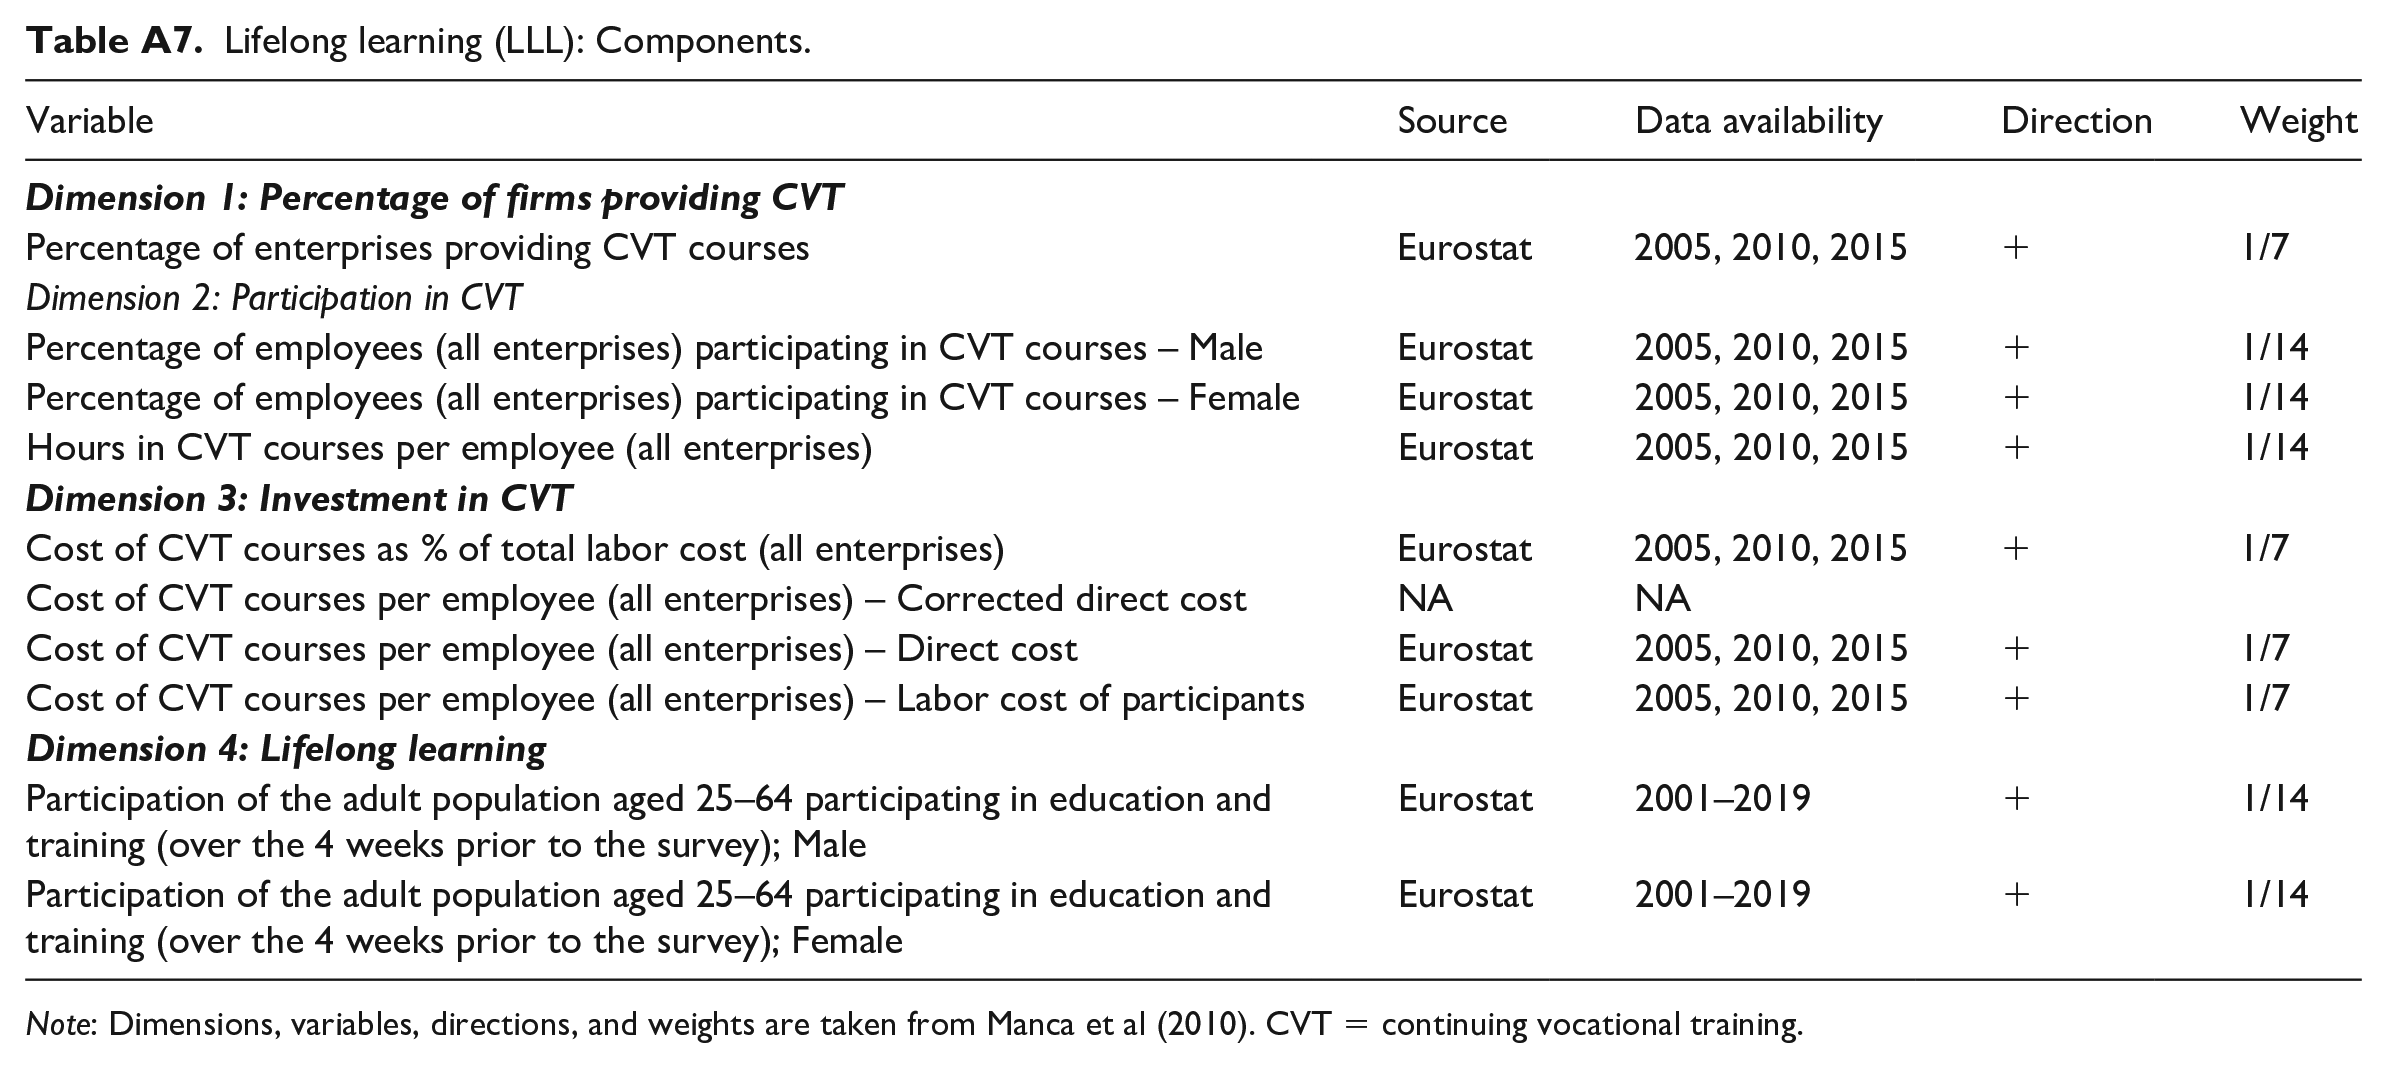
Following the guidelines of the European Commission (2007), Manca et al. (2010) constructed four sub-indices to benchmark EU countries’ progress in implementing flexicure policies. As such, the FCA sub-index includes external flexibility (EF), internal flexibility (IF), and combined flexibility (CF). First, EF includes measures of the strictness of employment protection legislation, share of employees having fixed-term contracts, and self-employment. Second, IF refers to the flexibility of the working time: irregular working hours, part-time and overtime usage, and access to variable working hours. Finally, CF refers to the flexibility of the work organization: work abandonment to fulfill care responsibilities or educational needs, employment impact of parenthood, and inactivity or part-time work due to the absence of suitable childcare services. Further, the MSSS sub-index covers the overall expenditure and coverage of unemployment benefits, financial incentives to start a job, amount and duration of individual unemployment benefits, and childcare services. The ALMP sub-index includes the expenditure on different ALMPs and the intensity of ALMP per participant and per person wanting to work. Lastly, the LLL sub-index includes the provision, participation, and investment in continuing vocational training, and the participation in lifelong learning schemes.
Manca et al. (2010) constructed these four sub-indices for 2005–2007. Appendix A summarizes variables used, data sources and weights within the sub-indices. To compute them for 2010 and 2015, we follow the same methodology:
Data extraction: Eurostat, Directorate-General for Employment, Social Affairs & Inclusion, Directorate-General for Economic and Financial Affairs, and Organisation for Economic Co-operation and Development (OECD) databases.
Data standardization: min-max standardization.
Data aggregation: weights and directions as in Manca et al. (2010).
To aggregate the four sub-indices into one composite indicator, this study follows Nardo et al. (2008). The four flexicurity sub-indices are min-max standardized on a 0–100 scale:
Subsequently, the four sub-indices are aggregated into a composite indicator by using the arithmetic mean:

where:
Chung (2012) identifies different definitions and frameworks for flexicurity measurement. While the author notices that there is no right or wrong way to measure flexicurity, she highlights the importance of explaining one’s choice in understanding and translating flexicurity into empirical research. This motivation is necessary to clarify the implications and limitations of the research framework used. Based on our understanding, the European Commission’s flexicurity model is one integrated policy strategy that encompasses four complementary components that develop in accordance with each other – that is, synchronically – as opposed to four strategies that develop separately (for example, the flexibility of firing and hiring cannot be developed without having in mind the social security and activation components). We thus translate this ‘one integrated policy strategy’ into one equally-weighted composite indicator. Further, by adopting an equal weight allocation inside the flexicurity index, we assume that each component has equal status. We do so for two reasons. First, equal weights allocation is the most appealing weighting scheme in the absence of a clearly established empirical or statistical guideline supporting a different weights allocation (e.g., Manca et al., 2010; Nardo et al., 2008). Second, the European Commission (2007) 6 considers the four components as ‘mutually supportive constituent pillars of flexicurity.’ Therefore, in the current index we translate mutual support into ‘equal partners’ that have equal status.
We test the robustness of the flexicurity index to the inclusion/exclusion of variables. We obtain 56,700 flexicurity index scenarios per year. Table 2 presents the initial flexicurity scores and average and median values from the simulations. The initial flexicurity scores are highly correlated (0.98) with the average and median scores from the simulations. This suggests that the flexicurity index has low sensitivity to the inclusion/exclusion of variables and captures well the flexicurity phenomenon (see Nardo et al., 2008; Saisana and Saltelli, 2006).
Flexicurity index scores.
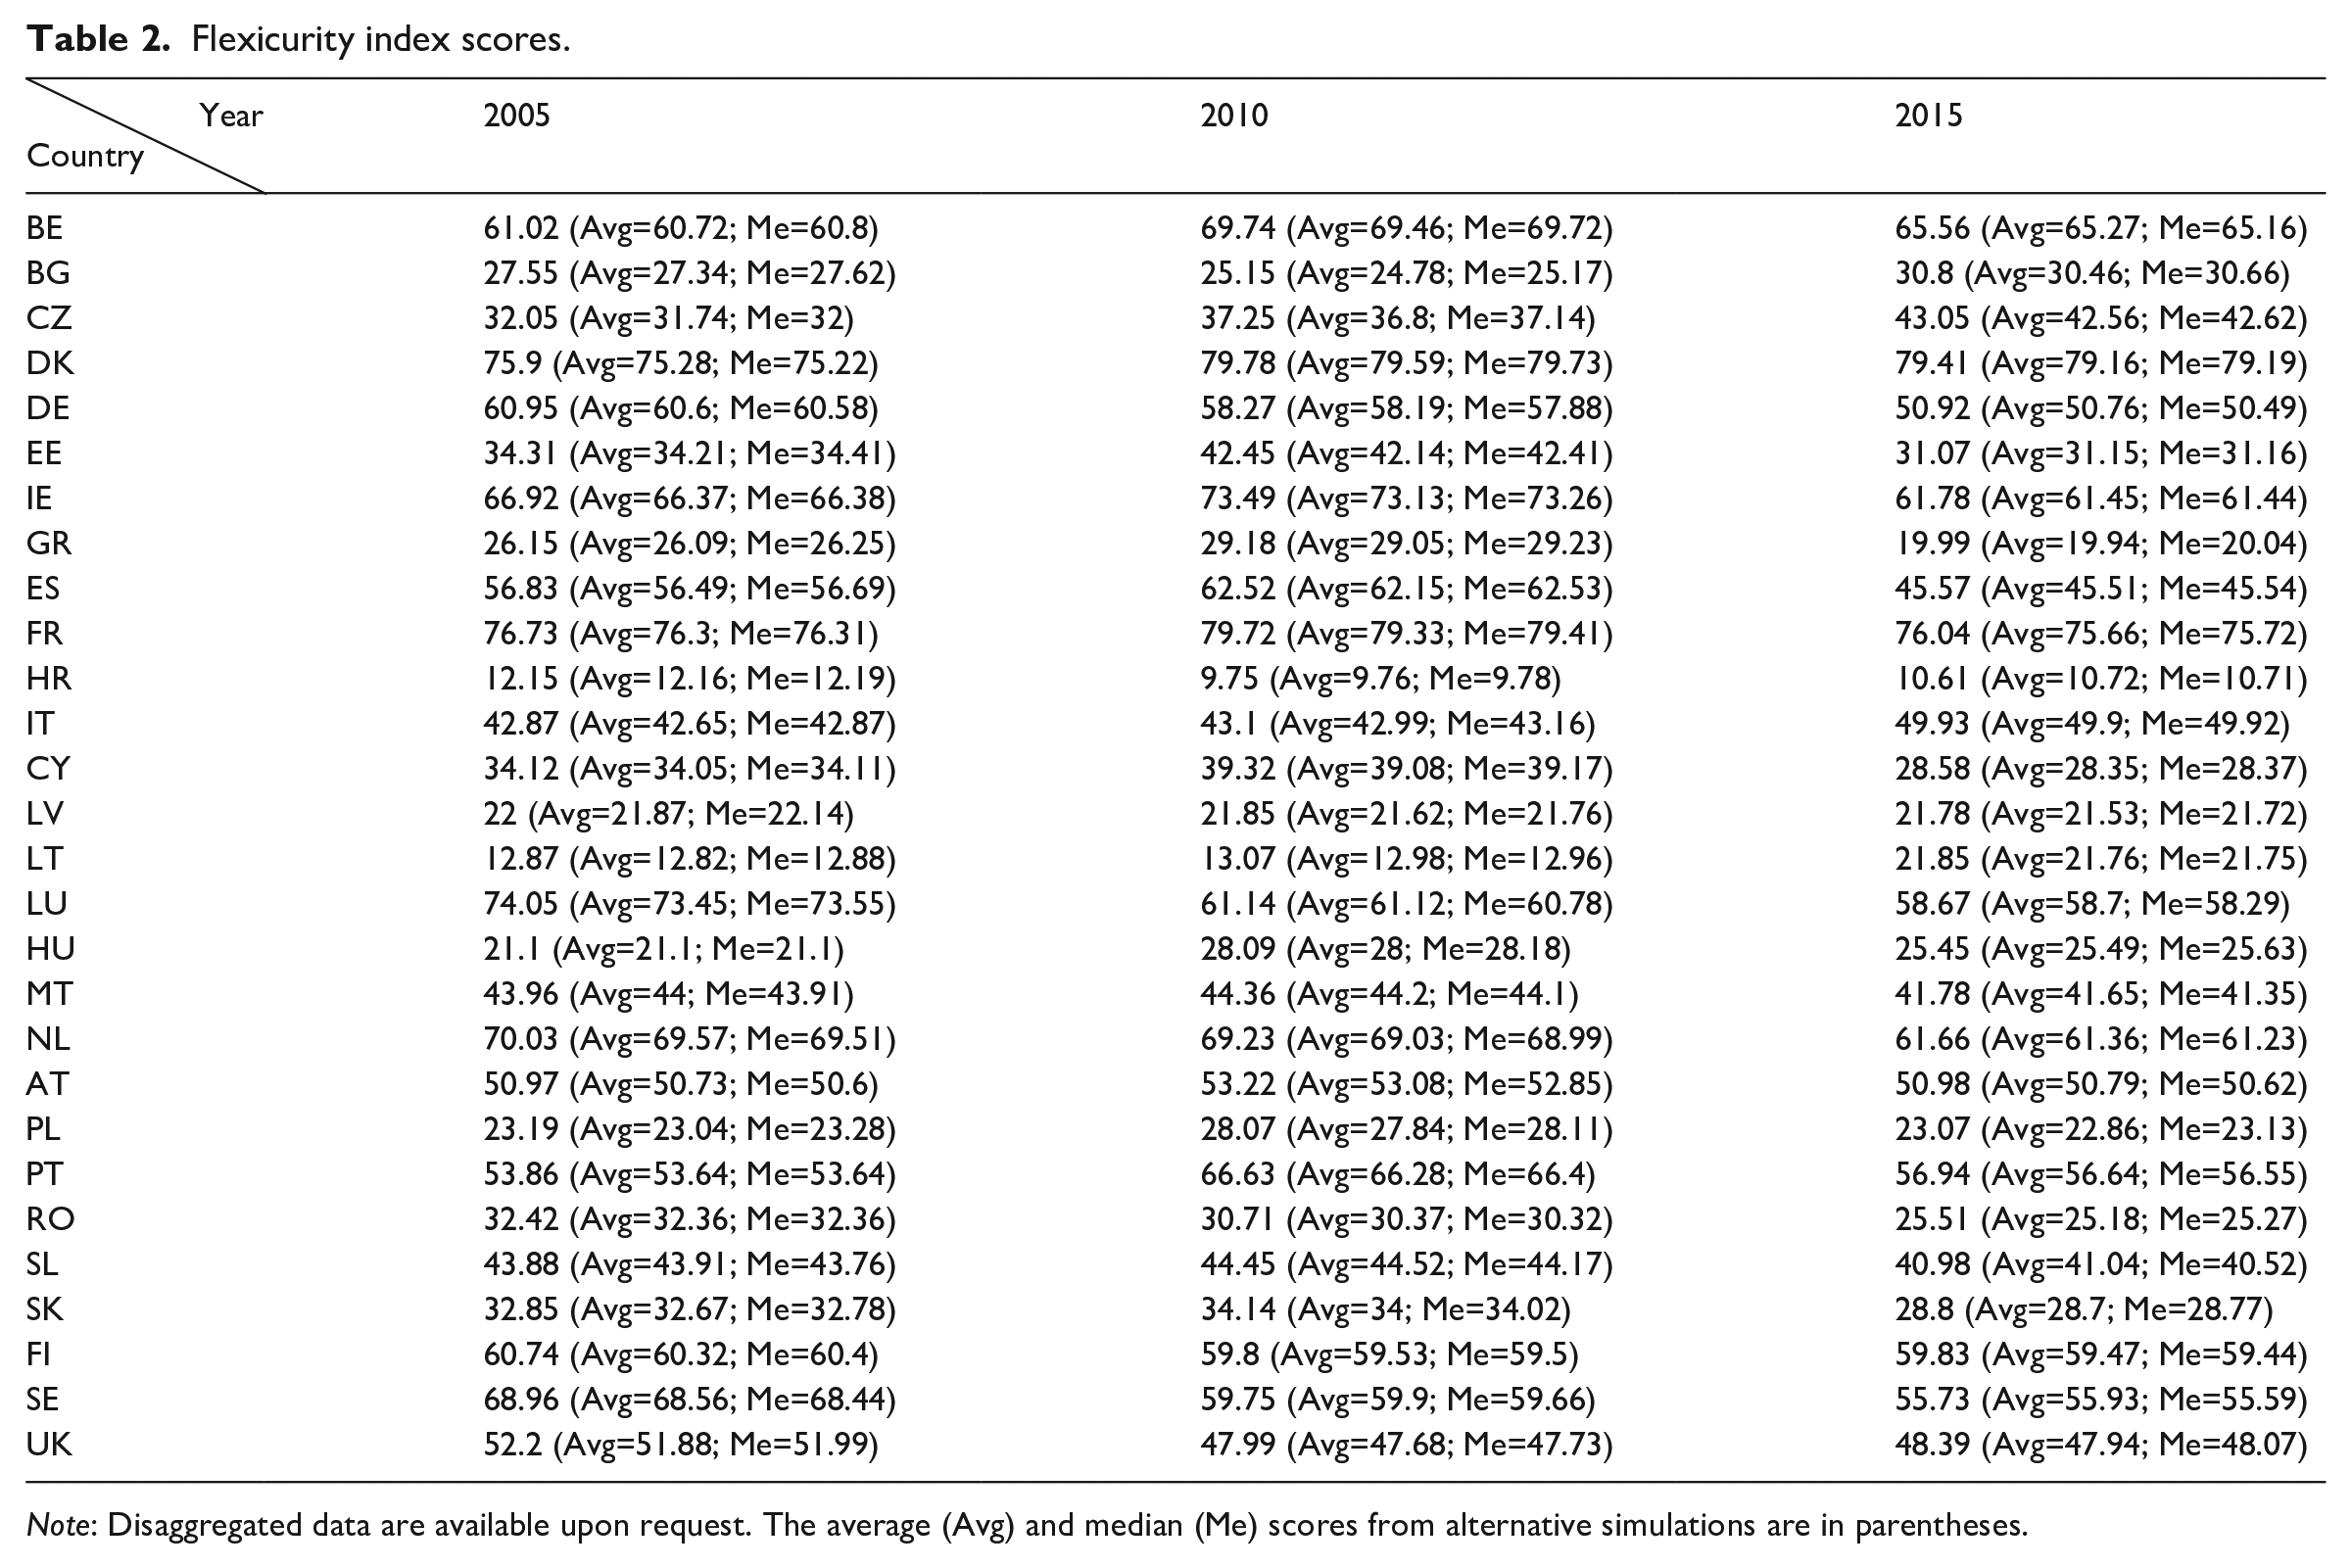
Note: Disaggregated data are available upon request. The average (Avg) and median (Me) scores from alternative simulations are in parentheses.
This study uses a composite indicator because it is interested in flexicurity’s combined effect rather than the impact of its different components. Additionally, this approach minimizes the number of country-level variables included in the regression. It further helps overcome methodological constraints – when estimating a multilevel model with only a few countries, Bryan and Jenkins (2015) and Stegmueller (2013) recommend limiting the number of country-level variables to ensure the results’ robustness.
Control variables
Regarding individual-level explanatory variables, this study considers the employees’ sociodemographic characteristics and care responsibilities (Table 3). The data are obtained from the European Working Conditions Survey. The literature suggests that the younger and more educated people are, the more they experience work–life conflicts (Pichler, 2009; Tausig and Fenwick, 2001). Care responsibilities (toward children or people who are older/have a disability) relate negatively to work–life balance. Previous research also shows that employees with care responsibilities report higher stress levels. They declare that they feel guilty for not spending enough time with their families and find it difficult to relax (Larsen, 2010; Phillips et al., 2002). Similar findings are expected for migrants compared with indigenous people since migrants tend to prioritize work over family life (Ramsey and Lorenz, 2020).
List of control variables.
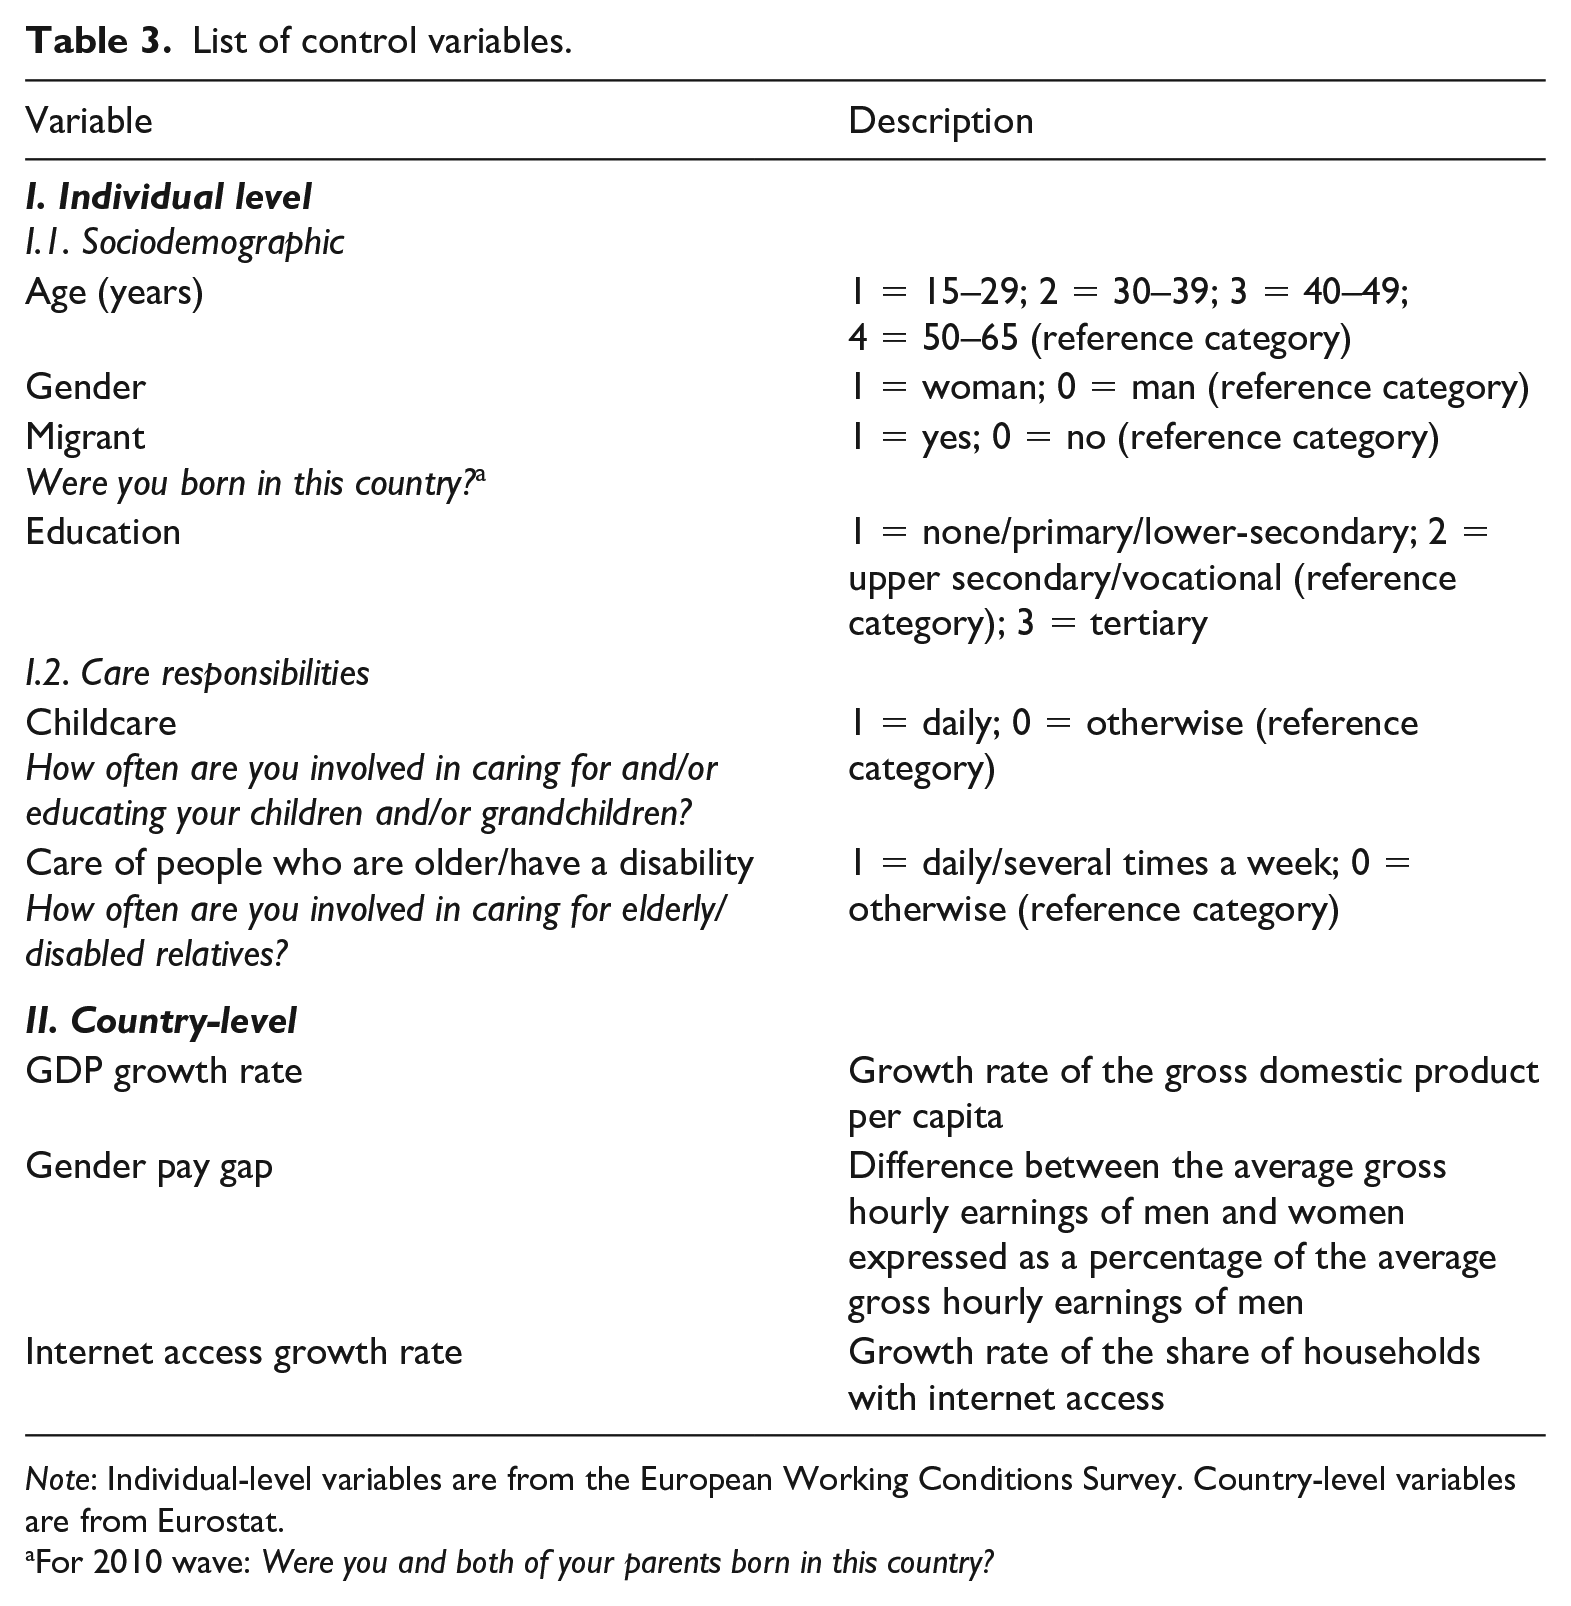
Note: Individual-level variables are from the European Working Conditions Survey. Country-level variables are from Eurostat.
For 2010 wave: Were you and both of your parents born in this country?
Regarding country-level characteristics, Schöneck (2018) attributes increased work and life demands to socioeconomic and technological advances. Such advances affect work–life balance by creating an accelerated pace of life and time scarcity. As such, this study employs the growth rates of gross domestic product per capita, internet access, and the gender pay gap to proxy the economic, technological, and social contexts (Table 3).
Estimation strategy
To assess the relationship between work–life balance and independent variables (individual and country-level factors), this study employs a two-level logistic model with a binary outcome. Such estimation presumes that the characteristics of the society where an individual lives influence that individual’s characteristics. In this case, the assumption is that country characteristics, namely flexicurity and socioeconomic and technological variables, impact the individual’s work–life balance. Here, the classical logistic regression can distort parameter estimates and standard errors because it fails to account for the data’s nested structure. Individuals from the same country are more similar to each other than those from different countries. Thus, observations of individuals from the same country are correlated and share cluster-level effects. Therefore, a multilevel model (also known as a hierarchical or mixed-effects model) is suitable in this case (Hox, 2002). Accordingly, we estimate a separate regression for each year. 7
The model is as follows:

where:
Following Heck et al. (2013), we first estimate a null (no predictors) model to test whether there is enough statistical reason to include country-level variables in explaining work–life balance. Second, we include the characteristics of employees – sociodemographic characteristics and care responsibilities (individual-level model). Third, we add flexicurity and the rest of the country-level variables to the regression. To ensure the results’ robustness: the study reports bootstrapped standard errors (1,000 samples) 8 and statistical significance based on t-test probabilities, 9 and it uses a forward-stepwise estimation strategy.
Empirical findings
Figure 1 shows the cross-country percentage of employees that perceived having a work–life balance among the total number of surveyed employees. In 2005, Denmark, the Netherlands, Finland, and Austria had the highest share of employees reporting satisfactory work–life balance (89%, 88.5%, 88.4%, and 86%, respectively). In contrast, Greece, Italy, Latvia, Hungary, and Slovenia had the lowest percentage of employees reporting satisfactory work–life balance (52.3%, 72%, 69.9%, 72.3%, and 72.6%, respectively). In general, the perception of work–life balance increased in EU countries in 2010 compared with 2005. Notable improvements were observed in Greece, Romania, and Poland, where the perception of work–life balance increased by 11.31, 10.49, and 10.10 percentage points, respectively. Work–life balance perceptions in Greece further increased by 10.55 percentage points in 2015 compared with 2010. On the other hand, in the United Kingdom, Denmark, and Sweden, such perceptions decreased by 6.44, 5.86, and 5.45 percentage points, respectively. In 2010, the lowest work–life balance levels were in Greece, Italy, and Spain, and the highest were in Denmark and the Netherlands. In 2015, Italy slightly outperformed its cluster. Otherwise, the best and worst performers remained the same.
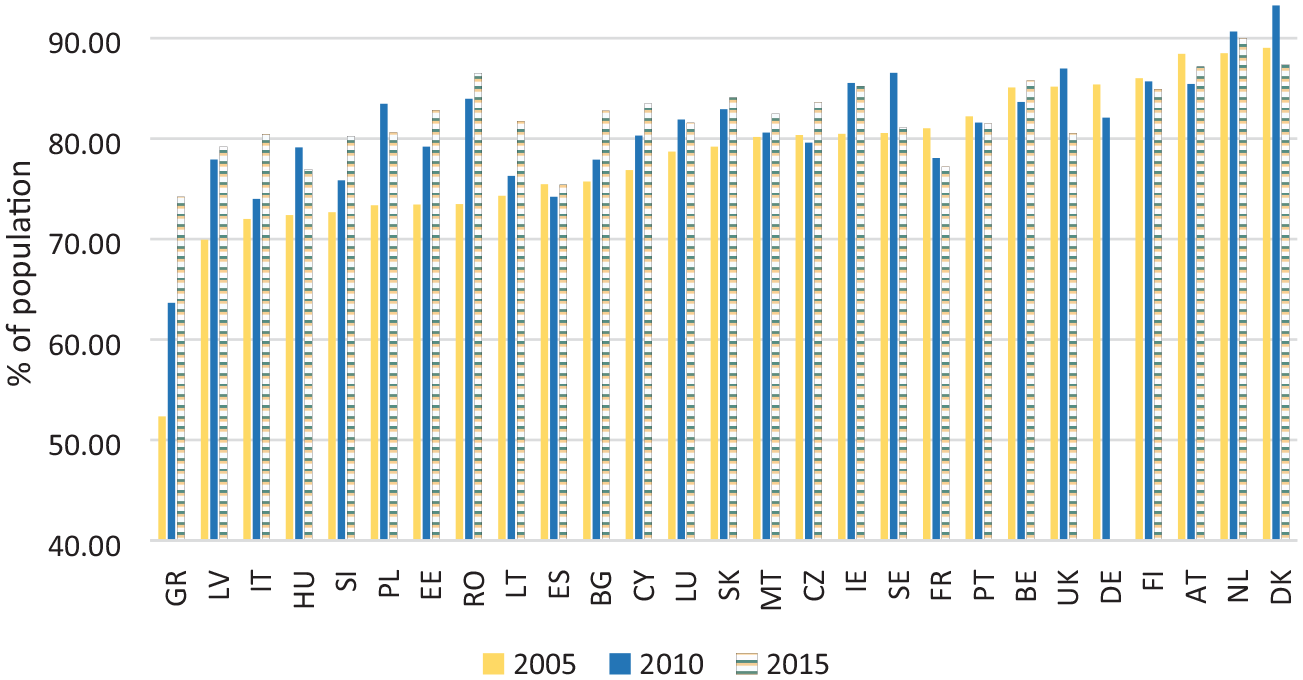
Perceived work–life balance: Cross-country percentages.
The interclass correlation (ICC) 10 of the null model is 0.0434 (2005), 0.0513 (2010), and 0.0148 (2015). These values suggest that the country where the respondent works and resides (through, for example, institutions) is responsible for approximately 4.3%, 5.1%, and 1.5% of the variability in the respondent’s self-perceived work–life balance in 2005, 2010, and 2015, respectively. The 2005 and 2010 results are close to those of Schöneck (2018) for 23 European countries in 2010 and 2011. The decrease in ICC over the last five years could suggest that the EU27 countries became more similar in terms of institutions and policy frameworks.
Flexicurity relates positively (statistically significant) to work–life balance in all three analyzed years and all estimated models (Tables 4–6). These regression results could suggest that the greater the flexicurity index of a country, the more prone its citizens are to better work–life balance. Similar results are found when the flexicurity index is replaced by the average or median flexicurity scores from alternative simulations (available upon request).
Estimation results: 2005.
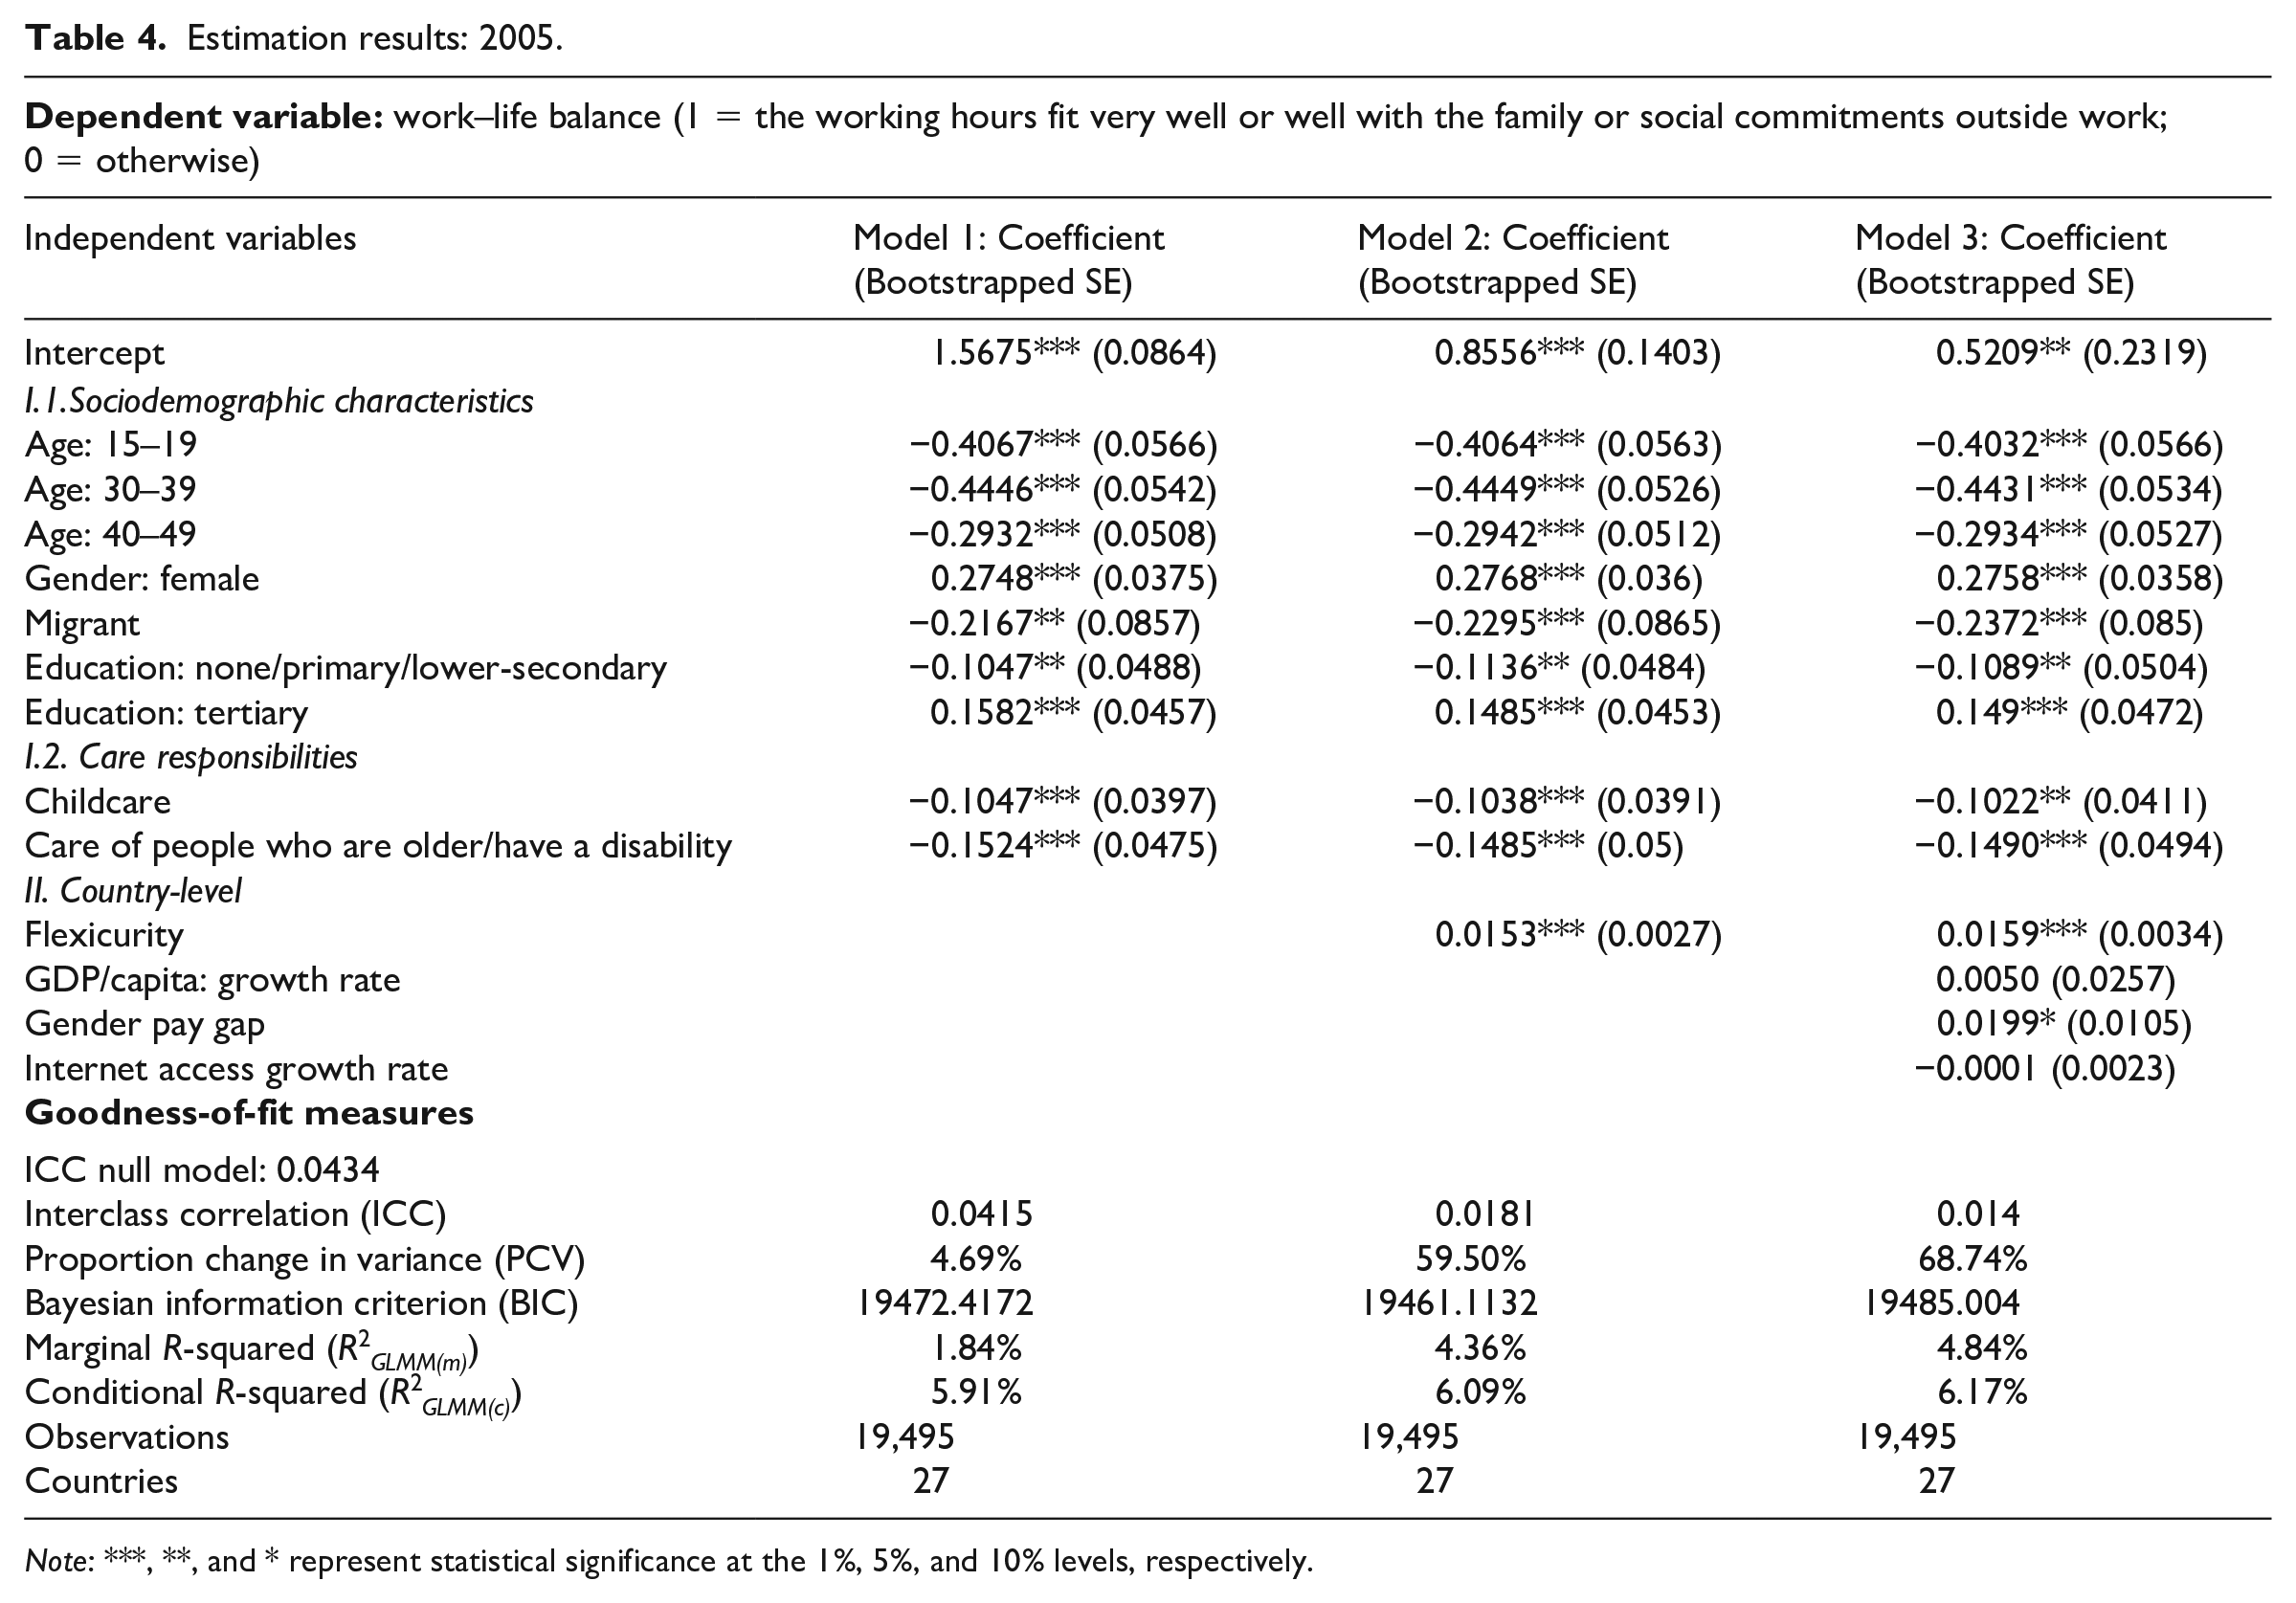
Note: ***, **, and * represent statistical significance at the 1%, 5%, and 10% levels, respectively.
Estimation results: 2010.
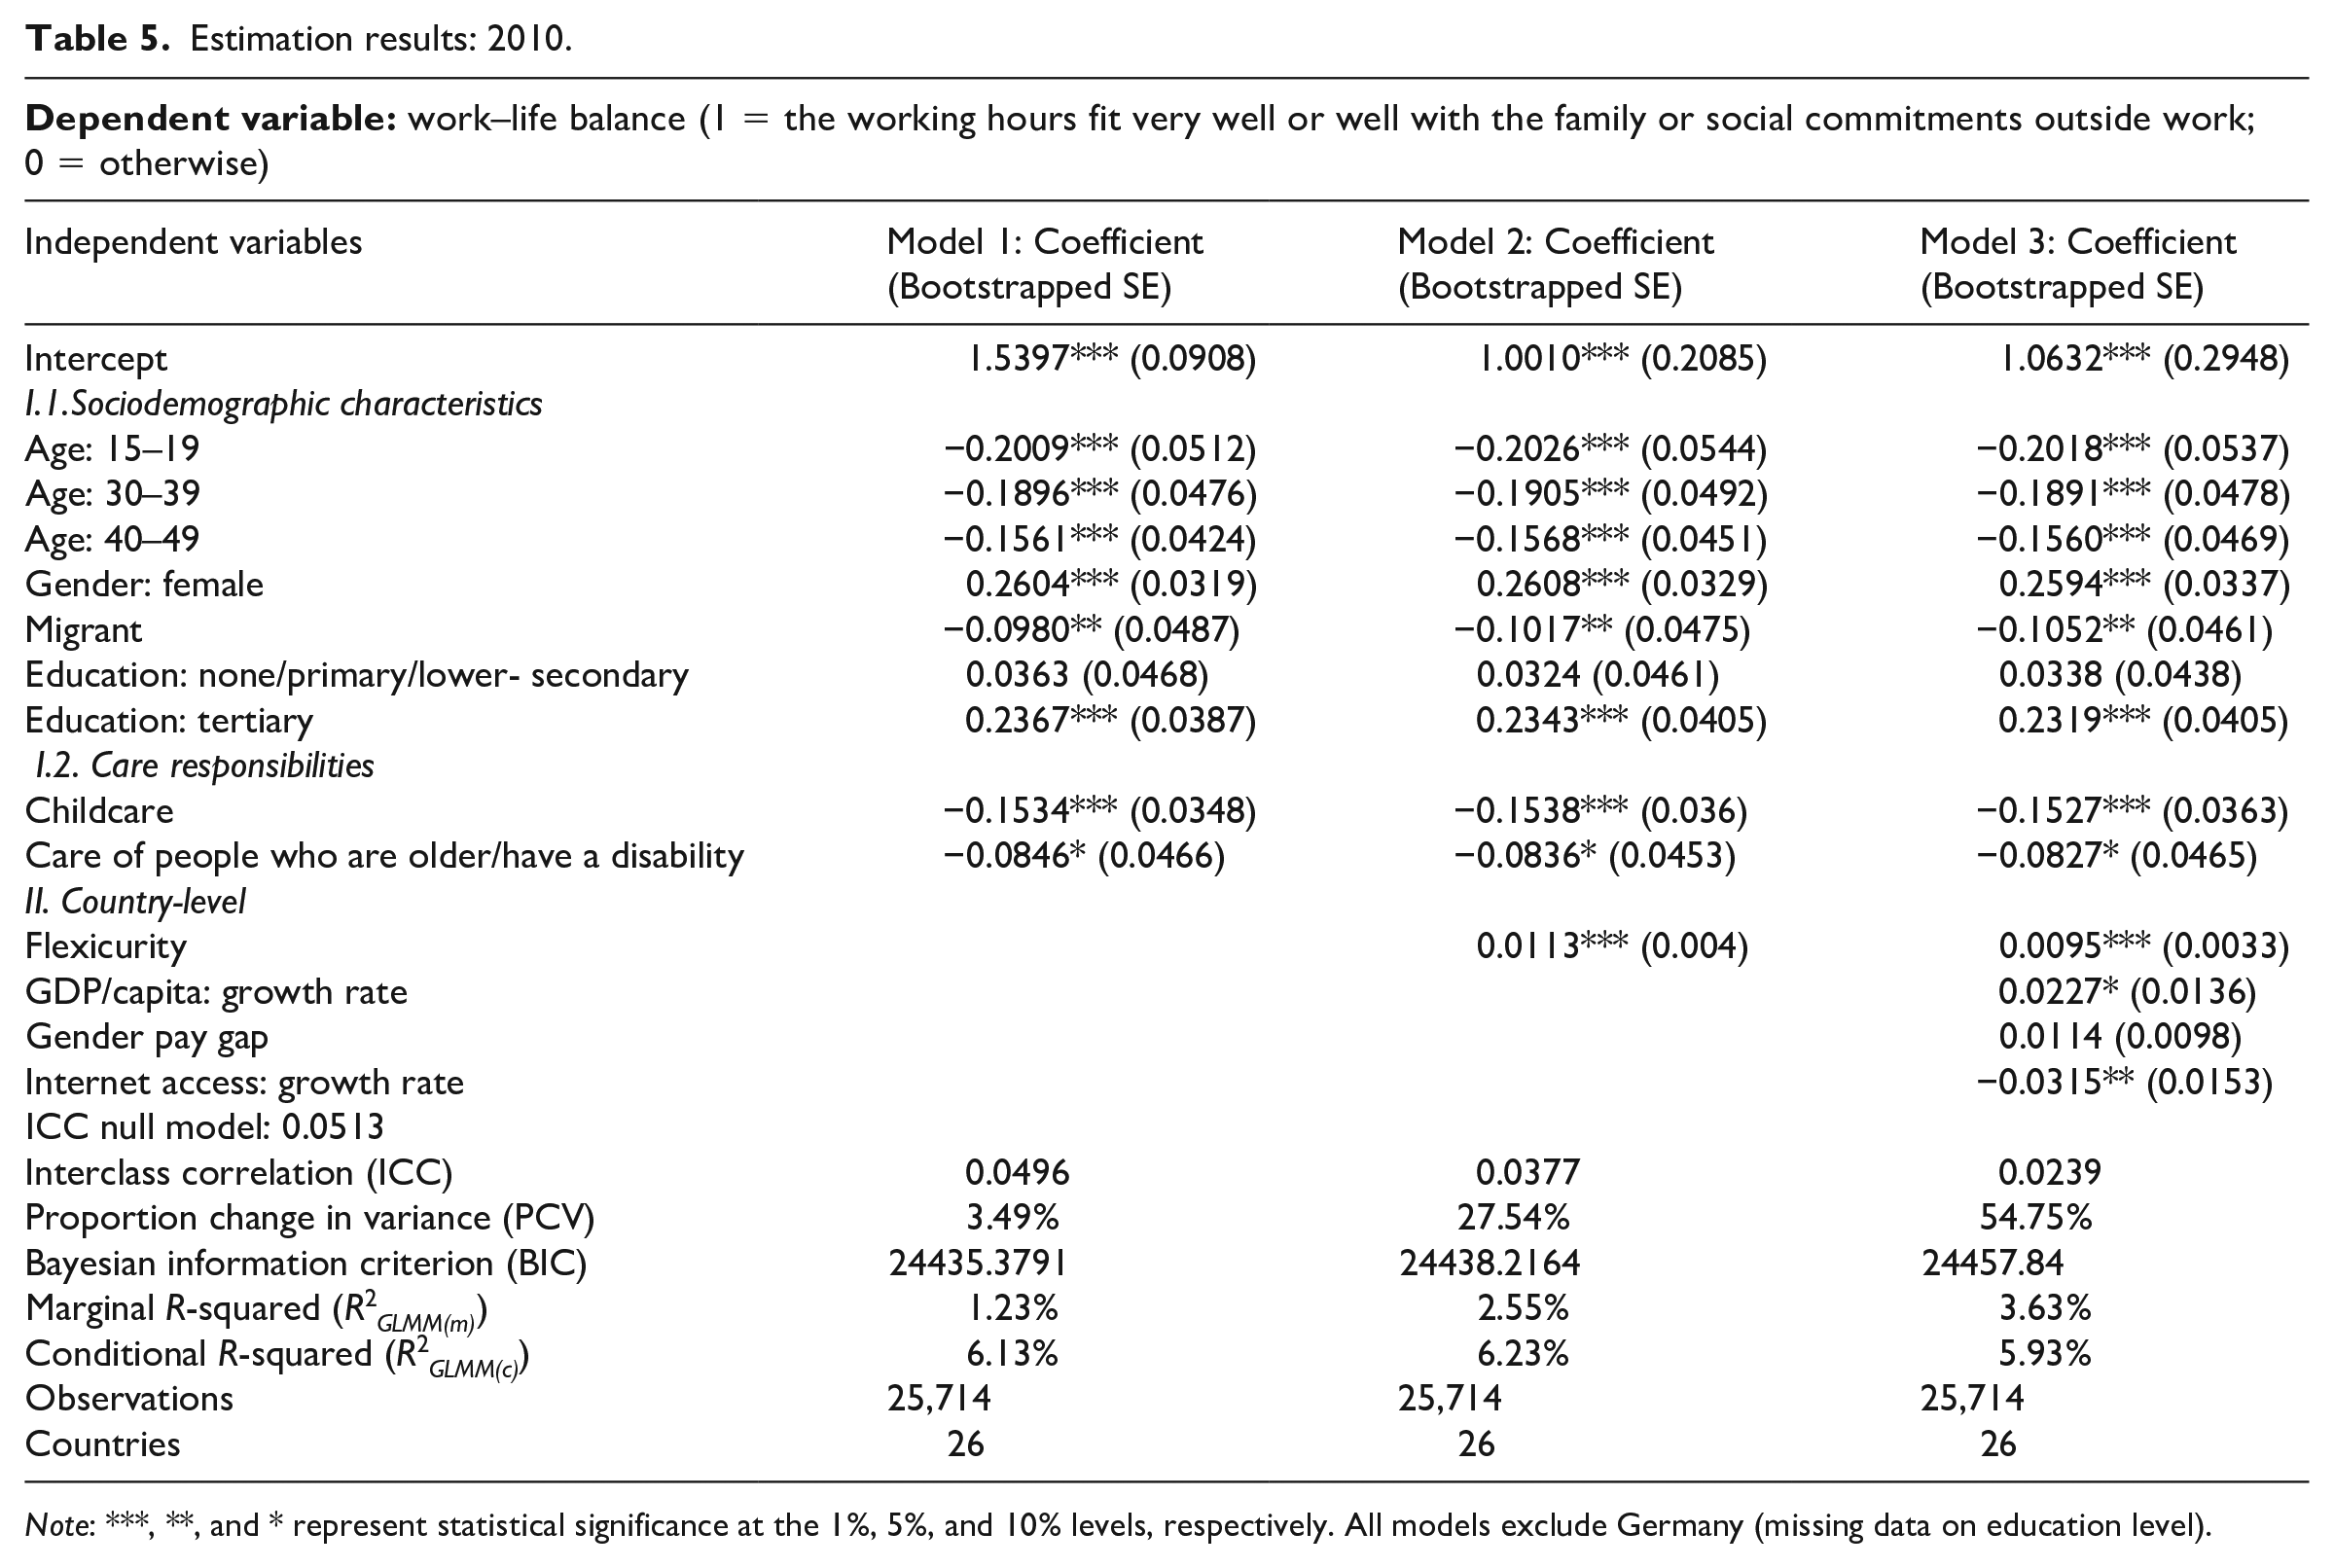
Note: ***, **, and * represent statistical significance at the 1%, 5%, and 10% levels, respectively. All models exclude Germany (missing data on education level).
Estimation results: 2015.
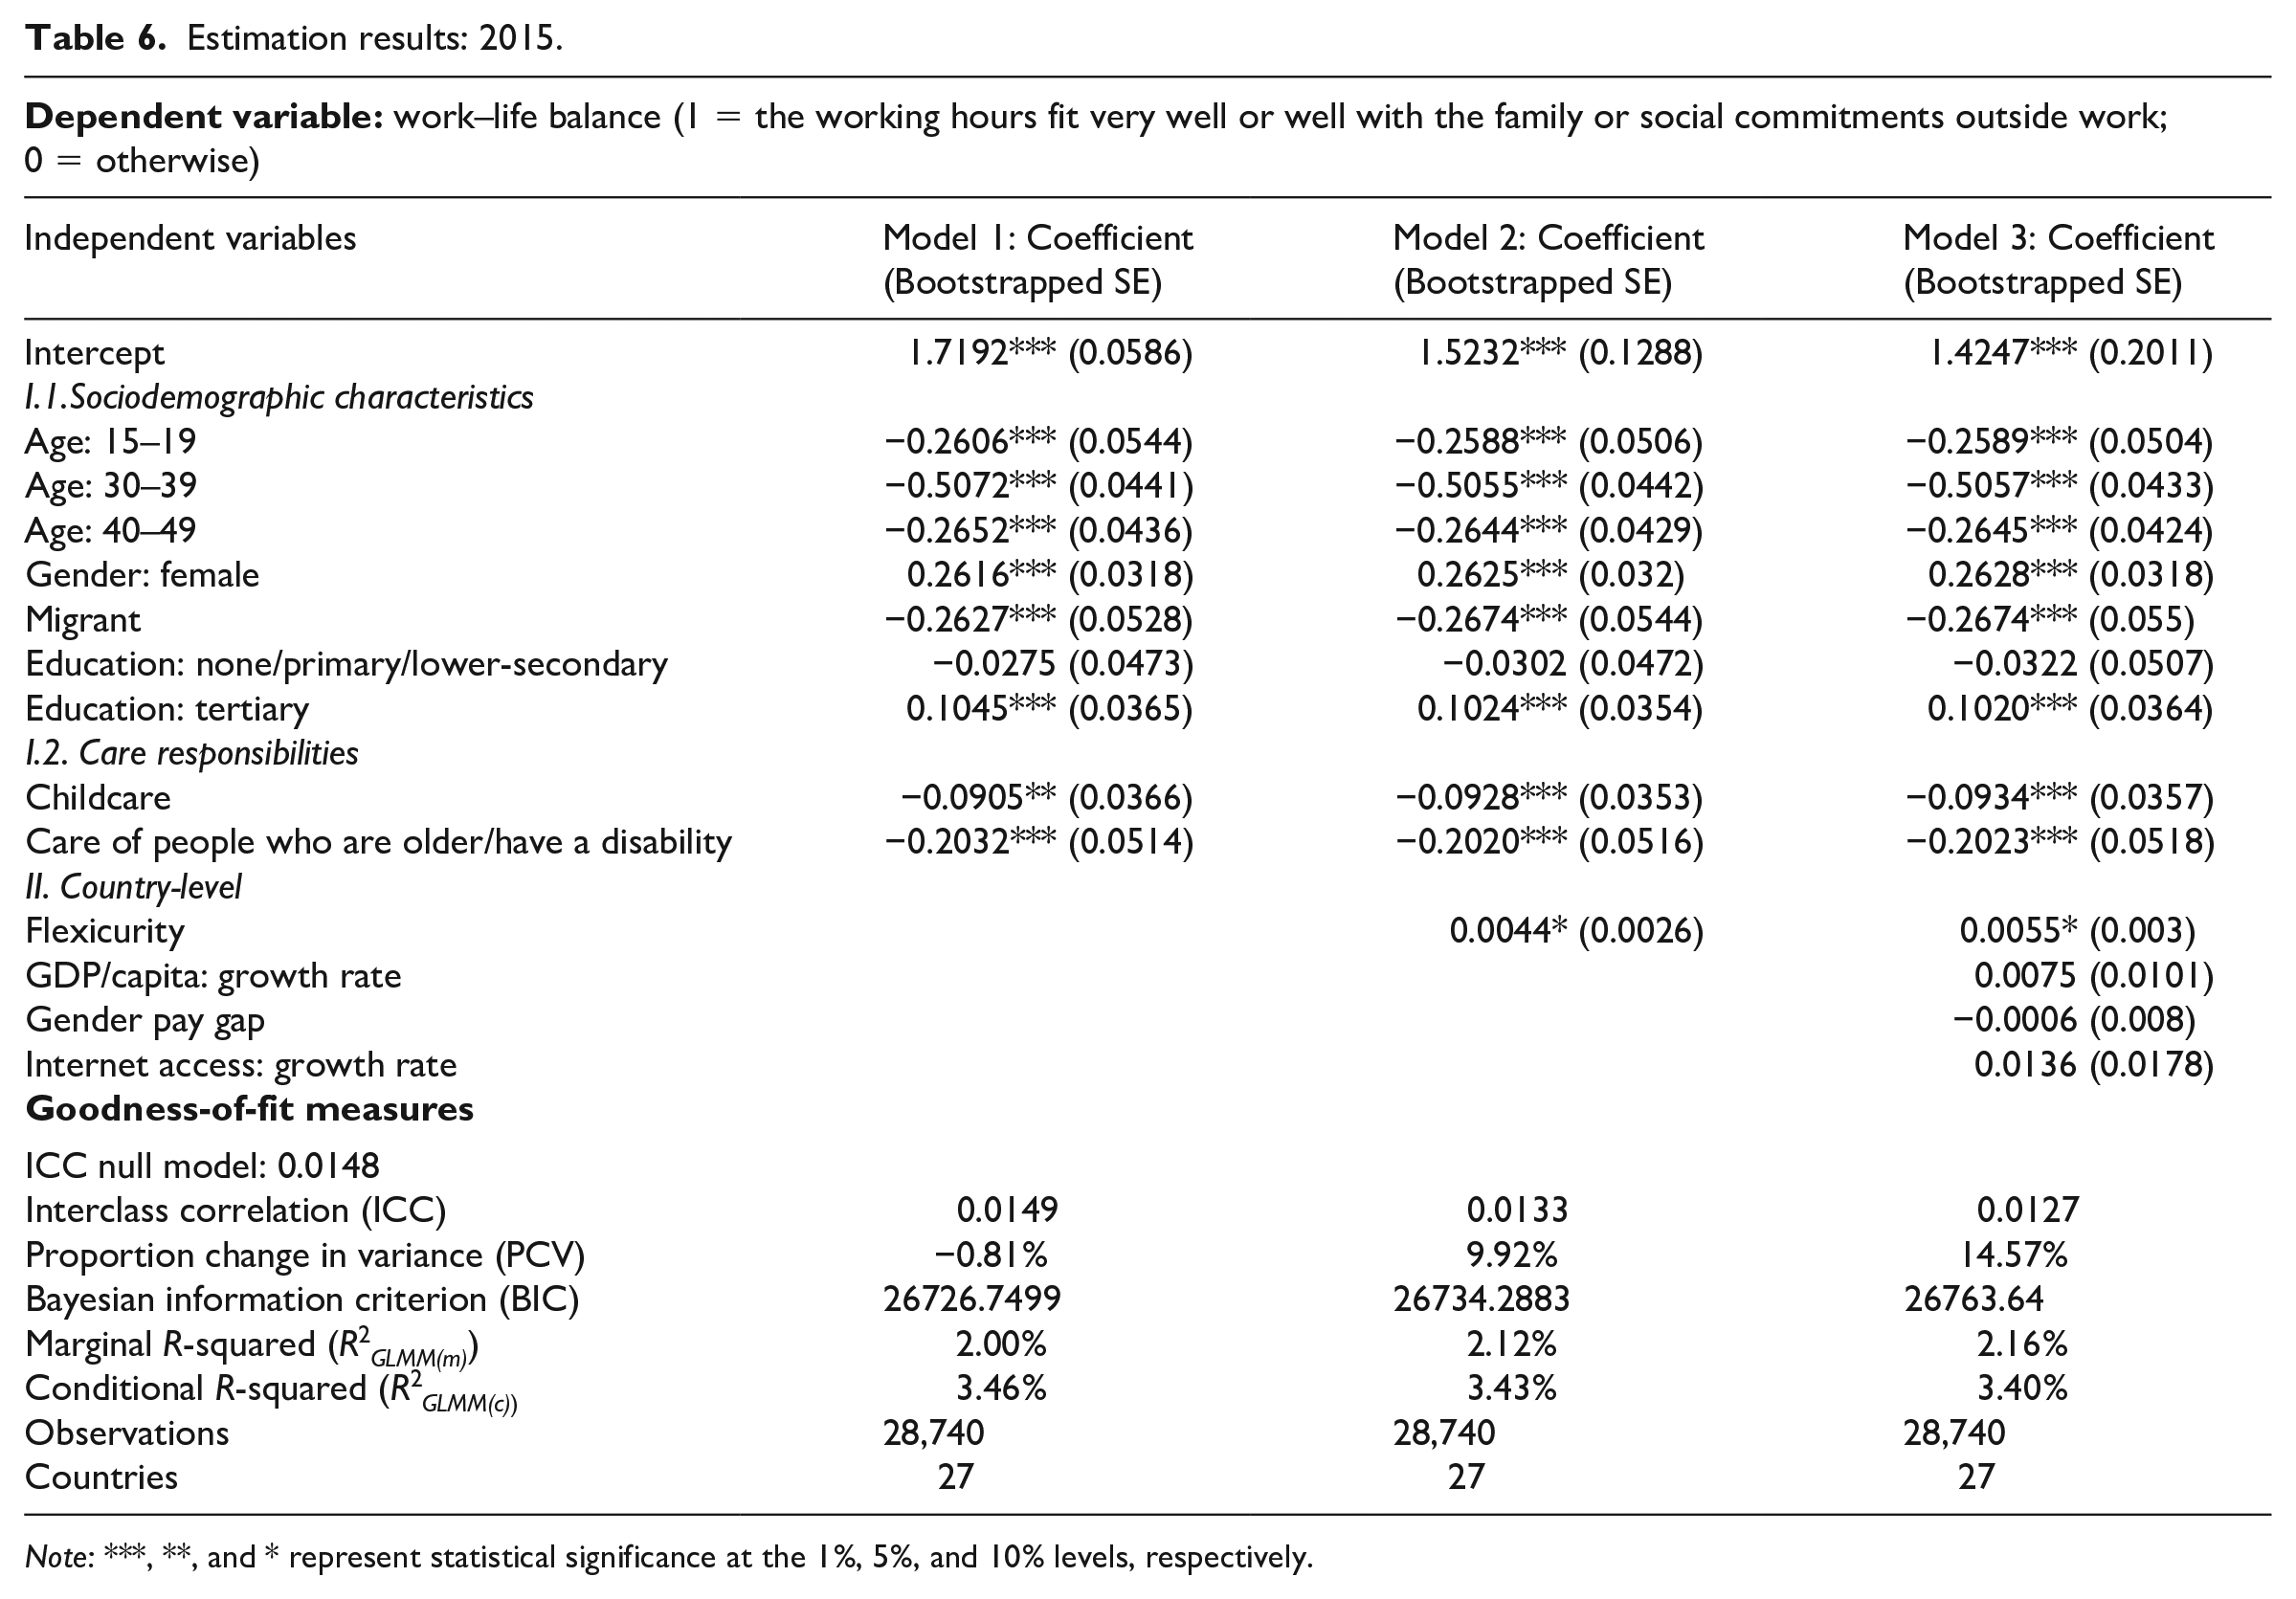
Note: ***, **, and * represent statistical significance at the 1%, 5%, and 10% levels, respectively.
Nakagawa and Schielzeth (2013) recommend using multiple measures to assess model fit. Hence, we report the interclass correlation (ICC), proportion change in variance (PCV), 11 marginal R-squared (R2 GLMM(m) ), and conditional R-squared (R2 GLMM(c) ) 12 along with the Bayesian information criterion (BIC). In all three years, the ICC is minimum in the case of the most general model (Model 3). The maximization of the PCV and marginal R-squared reinforces the preference for Model 3.
Based on the PCV measure, flexicurity seems to contribute most to explaining the cross-country variation in feelings of work–life balance. Model 1 (which includes only individual characteristics) has a 4.69% lower variance than the null model in 2005; this percentage is 3.49% in 2010, and –0.81% in 2015. Model 2 (which adds flexicurity) has 59.5% lower variance than the null model in 2005; this percentage is 27.54% in 2010, and 9.92% in 2015. Finally, Model 3 (which adds the rest of the country-level characteristics) has a 68.74% PCV in 2005; this percentage is 54.75% in 2010, and 14.57% in 2015.
Based on the marginal R-squared, flexicurity makes the greatest total contribution to the variance explained in 2005. Its contribution decreases in 2010 and even further in 2015. Thus, in the last year of the analysis, the greatest total contribution to the variance explained is that of sociodemographic characteristics and care responsibilities. The contribution of flexicurity is still greater than that of the other macro-level variables.
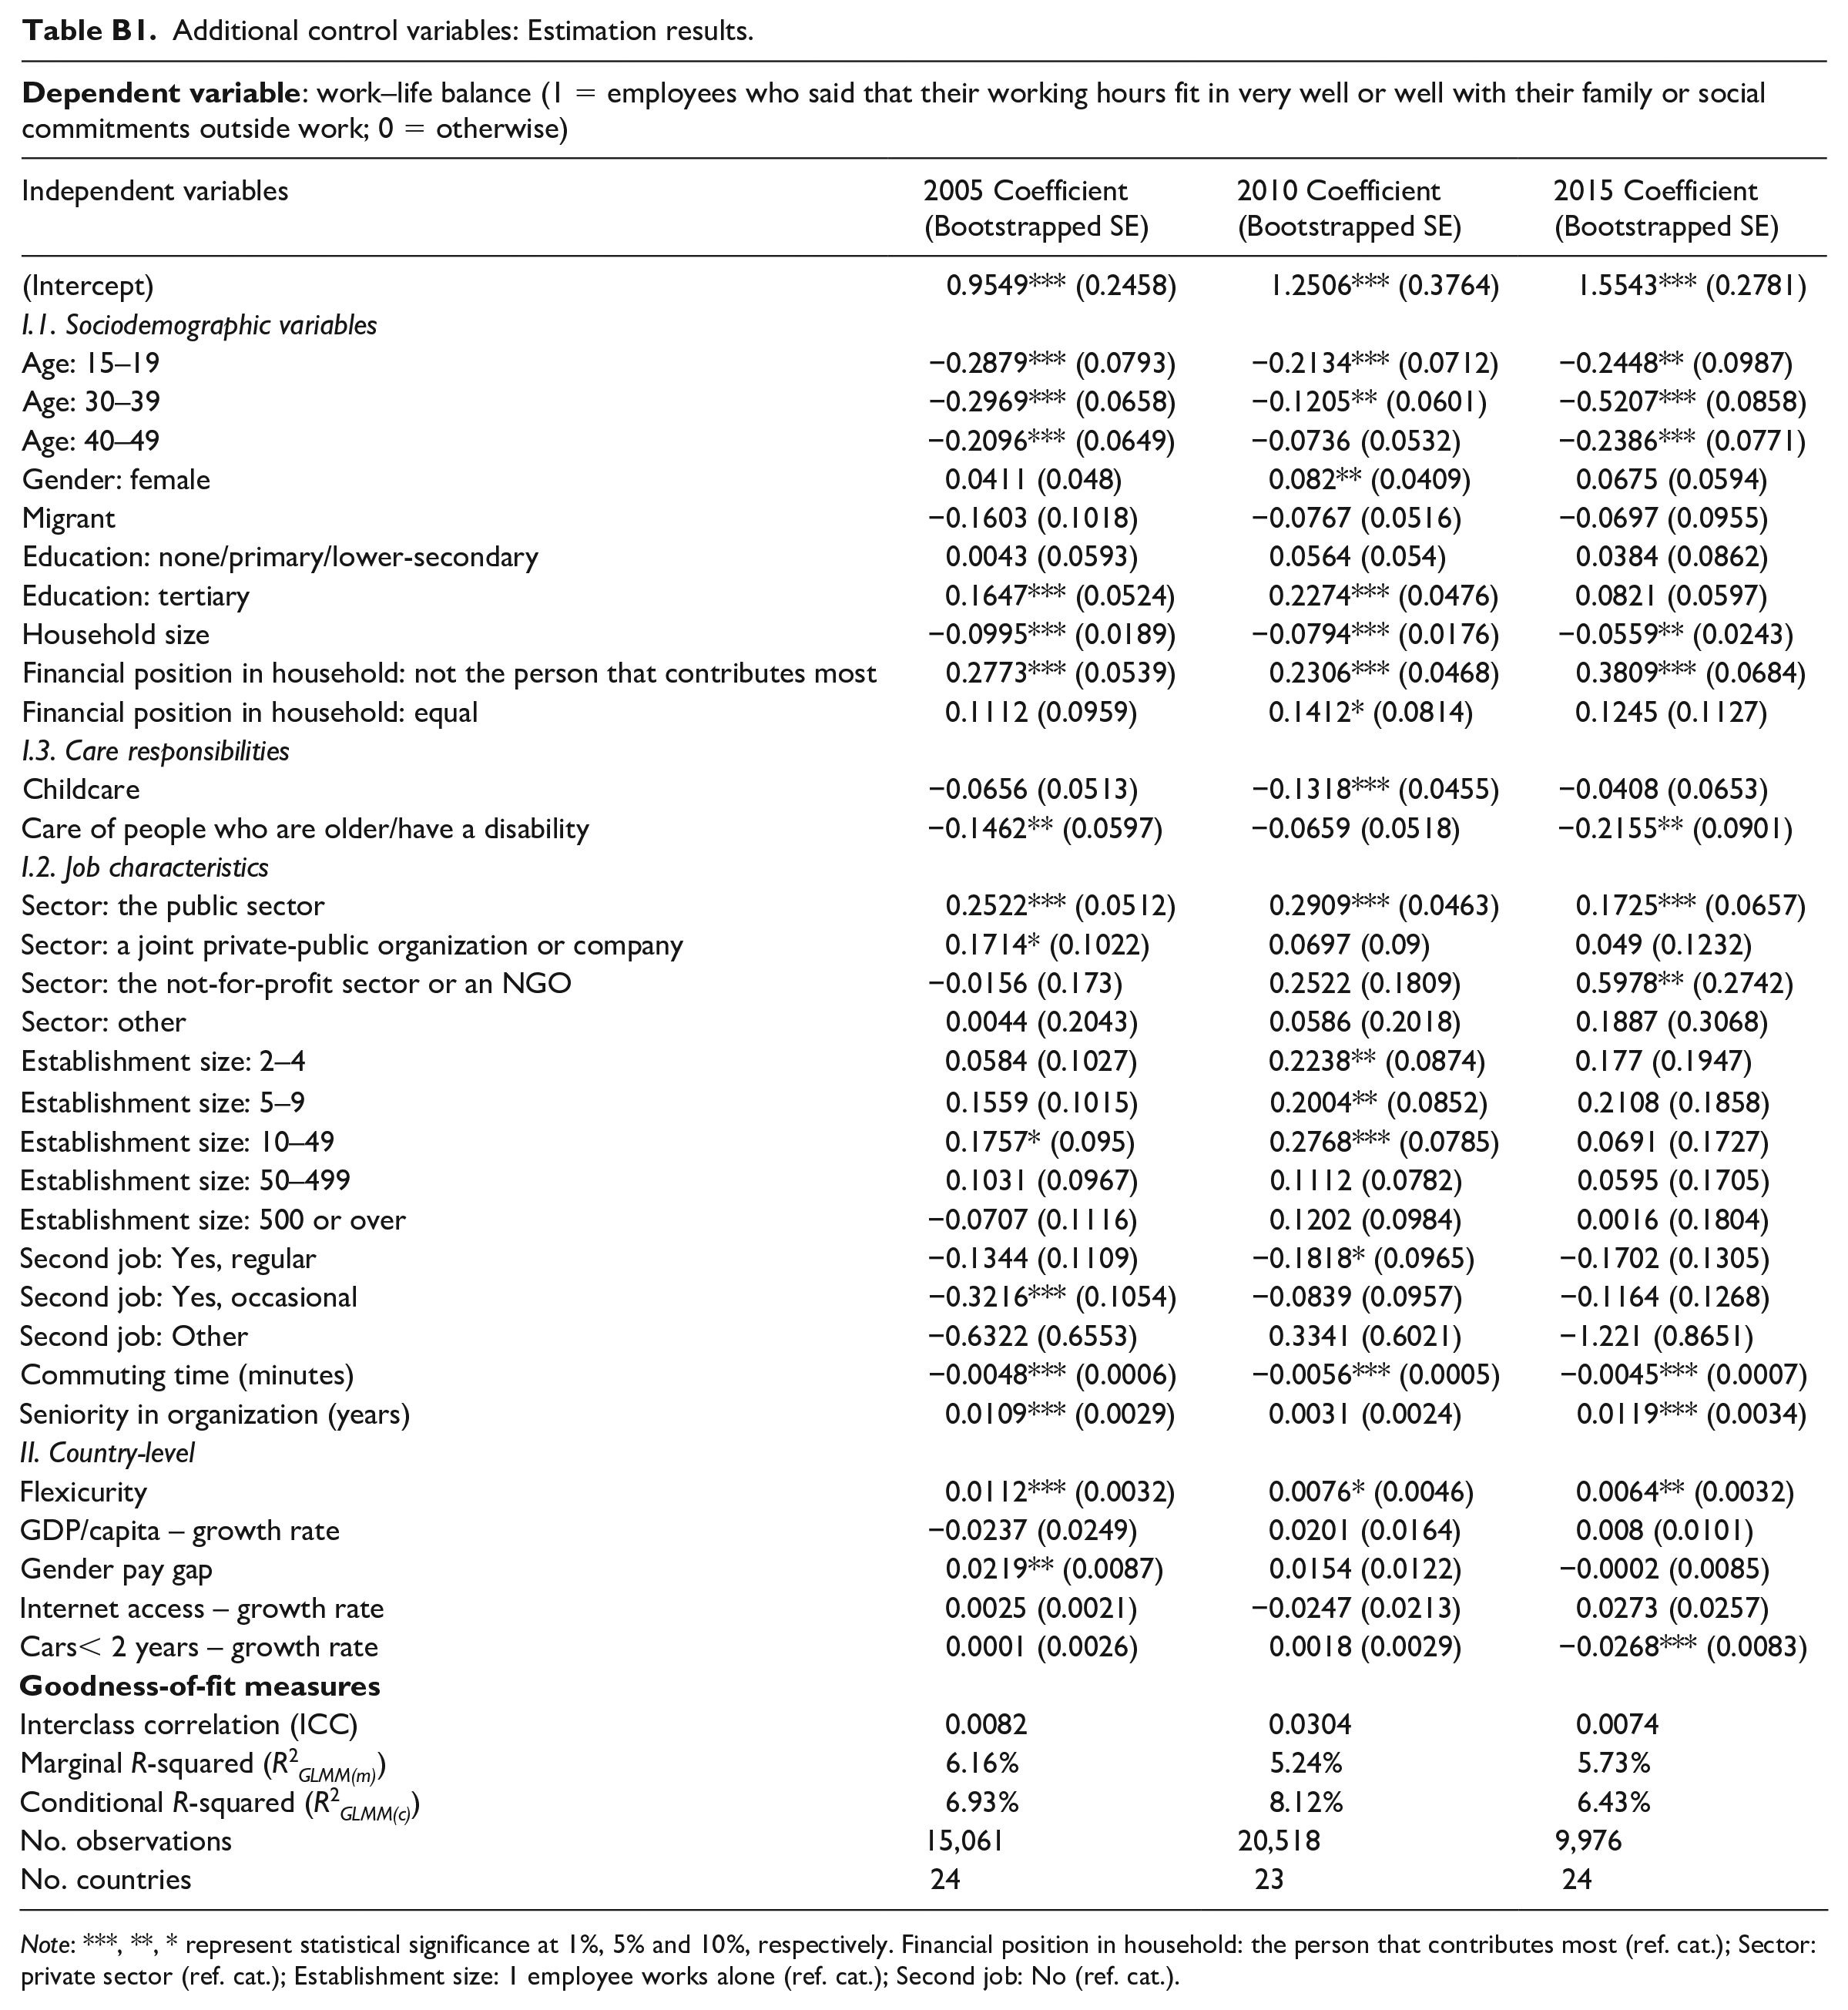
Alternative estimations (Appendix B) include household size, financial position in the household, sector, establishment size, seniority level, second job, commuting time, and growth rate of cars newer than two years. The coefficient of flexicurity remains positive (statistically significant). The additional control variables are not added from the beginning of the research due to many missing values; the sample sizes are thus reduced to 15,061, 20,518, and 9,976 from 19,495, 25,714, and 28,740 in 2005, 2010, and 2015, respectively.
Discussion and conclusions
Flexicurity has been a central EU policy aimed at fostering inclusive labor markets and welfare systems since 2007. Employment quality is one of the expected flexicurity outcomes. So far, the literature lacks empirical studies on the relationship between flexicurity and work–life balance, which is one dimension of quality of employment. This study is the first to analyze the association between perceived work–life balance (feeling that working hours fit very well or well with family or social commitments outside work) and flexicurity.
In the three analyzed years (2005, 2010, and 2015), Greek citizens were less likely to report work–life balance, whereas Danish and Dutch citizens were most likely to (among the EU27 countries). The multilevel analysis shows that the variation in individual perceptions of work–life balance comes from the individual’s country of residence in a proportion of approximately 4.3%, 5.1%, and 1.5% in 2005, 2010, and 2015, respectively. The fact that the percentage of variability attributed to the country has decreased over the 10-year period could suggest narrower differences in policies affecting work–life balance.
We computed a composite indicator that captures information on the four dimensions of flexicurity: flexible and reliable contractual arrangements, modern social security systems, comprehensive lifelong learning strategies, and effective active labor market policies. We estimated two-level logistic regressions to accommodate individual and country characteristics determining employee work–life balance. In all the estimated models, the coefficient of flexicurity was positive (statistically significant), suggesting that the higher a country scores in flexicurity policies, the likelier its citizens are to report satisfactory work–life balance.
These results seem to support the inclusion, monitoring, and fostering of flexicurity as a possible policy enabler of work–life balance. On the one hand, countries could support flexicurity by continuing to invest in the provision of care and active labor market services. On the other hand, countries could lessen legislative barriers and provide incentives to encourage companies to offer continual vocational training and flexible working arrangements to their employees where the field of work allows them. These actions provide employees with the means to manage their time in a manner that suits their work and outside-work needs and supports them in continuing or improving their current lifestyle.
Regarding flexicurity’s contribution to the variance explained, the study followed Nakagawa and Schielzeth’s (2013) recommendation of assessing both the marginal R-squared and the proportion change in variance in the case of multilevel estimations. Both measures suggested a decreasing trend in flexicurity’s contribution to explaining the variation in work–life balance. First, considering the PCV, in all the analyzed years, flexicurity contributed to explaining the between-country variation in the perception of work–life balance more than the population composition or socioeconomic factors did. While flexicurity did explain half of the between-country variation in the perception of work–life balance in 2005, the share decreased to a quarter in 2010 and to a tenth in 2015. Second, the marginal R-squared values showed that the flexicurity index made the greatest total contribution to the variance explained in 2005. However, this contribution not only decreased in the following years, but it was exceeded by one of the sociodemographic characteristics and care responsibilities in the last year of the analysis.
The decreasing contribution of flexicurity could question the policy’s (future) relevance to work–life balance strategies. However, since the between-country differences narrowed significantly from 2005 to 2015, it is reasonable to expect that the country-level variables make a lower contribution to explaining work–life balance compared with individual-level characteristics (seen through marginal R-squared). In addition, despite having a lower proportion than that in 2005, the between-country differences in work–life balance are better explained by the flexicurity index than by the rest of the variables (seen through PCV). From a research perspective, we consider that these findings highlight the value of the repeated cross-sectional design of this study, which allowed us to make contribution comparisons between the three analyzed years.
From a policy advice perspective, we would rather interpret these findings as a recommendation to monitor both flexicurity and work–life balance. This is because different economic situations could lead to austerity and a decrease in flexicurity and thus negatively impact work–life balance. Furthermore, in the spirit of evidence-based policymaking, data collection and sharing are essential for adequate research as monitoring both flexicurity and work–life balance measures translates into providing researchers with data and fostering more empirical findings.
Lastly, we present a few conclusions that can be drawn from the current study in regard to the control variables. Concerning the age of the respondent, the results are in line with Pichler (2009) and Tausig and Fenwick (2001), who suggest that younger employees face higher levels of work–life conflicts. Regarding employee gender, the results are similar to Schöneck (2018). Concerning migrants, the results are in line with Ramsey and Lorenz (2020), who state that expatriates face increased work–family conflicts since the job tasks absorb all the expatriate’s resources, and none are left to deal with family. Moreover, Schöneck (2018) finds that more years in education are related to better work–life balance. Lastly, concerning care responsibilities, the results support the role theory and are in line with Katz and Kahn (1978), Phillips et al. (2002), and Presser (2006). These studies suggest that employees with outside work commitments tend to accumulate feelings of guilt and frustration. Consequently, they find it difficult to relax and report low work–life balance.
Footnotes
Appendix A: Data and methods
Lifelong learning (LLL): Components.
| Variable | Source | Data availability | Direction | Weight |
|---|---|---|---|---|
| Dimension 1: Percentage of firms providing CVT | ||||
| Percentage of enterprises providing CVT courses | Eurostat | 2005, 2010, 2015 | + | 1/7 |
| Dimension 2: Participation in CVT | ||||
| Percentage of employees (all enterprises) participating in CVT courses – Male | Eurostat | 2005, 2010, 2015 | + | 1/14 |
| Percentage of employees (all enterprises) participating in CVT courses – Female | Eurostat | 2005, 2010, 2015 | + | 1/14 |
| Hours in CVT courses per employee (all enterprises) | Eurostat | 2005, 2010, 2015 | + | 1/14 |
| Dimension 3: Investment in CVT | ||||
| Cost of CVT courses as % of total labor cost (all enterprises) | Eurostat | 2005, 2010, 2015 | + | 1/7 |
| Cost of CVT courses per employee (all enterprises) – Corrected direct cost | NA | NA | ||
| Cost of CVT courses per employee (all enterprises) – Direct cost | Eurostat | 2005, 2010, 2015 | + | 1/7 |
| Cost of CVT courses per employee (all enterprises) – Labor cost of participants | Eurostat | 2005, 2010, 2015 | + | 1/7 |
| Dimension 4: Lifelong learning | ||||
| Participation of the adult population aged 25–64 participating in education and training (over the 4 weeks prior to the survey); Male | Eurostat | 2001–2019 | + | 1/14 |
| Participation of the adult population aged 25–64 participating in education and training (over the 4 weeks prior to the survey); Female | Eurostat | 2001–2019 | + | 1/14 |
Note: Dimensions, variables, directions, and weights are taken from Manca et al (2010). CVT = continuing vocational training.
Appendix B: Empirical findings
Additional control variables: Estimation results.
| Independent variables | 2005 Coefficient (Bootstrapped SE) | 2010 Coefficient (Bootstrapped SE) | 2015 Coefficient (Bootstrapped SE) |
|---|---|---|---|
| (Intercept) | 0.9549*** (0.2458) | 1.2506*** (0.3764) | 1.5543*** (0.2781) |
| I.1. Sociodemographic variables | |||
| Age: 15–19 | −0.2879*** (0.0793) | −0.2134*** (0.0712) | −0.2448** (0.0987) |
| Age: 30–39 | −0.2969*** (0.0658) | −0.1205** (0.0601) | −0.5207*** (0.0858) |
| Age: 40–49 | −0.2096*** (0.0649) | −0.0736 (0.0532) | −0.2386*** (0.0771) |
| Gender: female | 0.0411 (0.048) | 0.082** (0.0409) | 0.0675 (0.0594) |
| Migrant | −0.1603 (0.1018) | −0.0767 (0.0516) | −0.0697 (0.0955) |
| Education: none/primary/lower-secondary | 0.0043 (0.0593) | 0.0564 (0.054) | 0.0384 (0.0862) |
| Education: tertiary | 0.1647*** (0.0524) | 0.2274*** (0.0476) | 0.0821 (0.0597) |
| Household size | −0.0995*** (0.0189) | −0.0794*** (0.0176) | −0.0559** (0.0243) |
| Financial position in household: not the person that contributes most | 0.2773*** (0.0539) | 0.2306*** (0.0468) | 0.3809*** (0.0684) |
| Financial position in household: equal | 0.1112 (0.0959) | 0.1412* (0.0814) | 0.1245 (0.1127) |
| I.3. Care responsibilities | |||
| Childcare | −0.0656 (0.0513) | −0.1318*** (0.0455) | −0.0408 (0.0653) |
| Care of people who are older/have a disability | −0.1462** (0.0597) | −0.0659 (0.0518) | −0.2155** (0.0901) |
| I.2. Job characteristics | |||
| Sector: the public sector | 0.2522*** (0.0512) | 0.2909*** (0.0463) | 0.1725*** (0.0657) |
| Sector: a joint private-public organization or company | 0.1714* (0.1022) | 0.0697 (0.09) | 0.049 (0.1232) |
| Sector: the not-for-profit sector or an NGO | −0.0156 (0.173) | 0.2522 (0.1809) | 0.5978** (0.2742) |
| Sector: other | 0.0044 (0.2043) | 0.0586 (0.2018) | 0.1887 (0.3068) |
| Establishment size: 2–4 | 0.0584 (0.1027) | 0.2238** (0.0874) | 0.177 (0.1947) |
| Establishment size: 5–9 | 0.1559 (0.1015) | 0.2004** (0.0852) | 0.2108 (0.1858) |
| Establishment size: 10–49 | 0.1757* (0.095) | 0.2768*** (0.0785) | 0.0691 (0.1727) |
| Establishment size: 50–499 | 0.1031 (0.0967) | 0.1112 (0.0782) | 0.0595 (0.1705) |
| Establishment size: 500 or over | −0.0707 (0.1116) | 0.1202 (0.0984) | 0.0016 (0.1804) |
| Second job: Yes, regular | −0.1344 (0.1109) | −0.1818* (0.0965) | −0.1702 (0.1305) |
| Second job: Yes, occasional | −0.3216*** (0.1054) | −0.0839 (0.0957) | −0.1164 (0.1268) |
| Second job: Other | −0.6322 (0.6553) | 0.3341 (0.6021) | −1.221 (0.8651) |
| Commuting time (minutes) | −0.0048*** (0.0006) | −0.0056*** (0.0005) | −0.0045*** (0.0007) |
| Seniority in organization (years) | 0.0109*** (0.0029) | 0.0031 (0.0024) | 0.0119*** (0.0034) |
| II. Country-level | |||
| Flexicurity | 0.0112*** (0.0032) | 0.0076* (0.0046) | 0.0064** (0.0032) |
| GDP/capita – growth rate | −0.0237 (0.0249) | 0.0201 (0.0164) | 0.008 (0.0101) |
| Gender pay gap | 0.0219** (0.0087) | 0.0154 (0.0122) | −0.0002 (0.0085) |
| Internet access – growth rate | 0.0025 (0.0021) | −0.0247 (0.0213) | 0.0273 (0.0257) |
| Cars< 2 years – growth rate | 0.0001 (0.0026) | 0.0018 (0.0029) | −0.0268*** (0.0083) |
|
|
|||
| Interclass correlation (ICC) | 0.0082 | 0.0304 | 0.0074 |
| Marginal R-squared (R2 GLMM(m) ) | 6.16% | 5.24% | 5.73% |
| Conditional R-squared (R2 GLMM(c) ) | 6.93% | 8.12% | 6.43% |
| No. observations | 15,061 | 20,518 | 9,976 |
| No. countries | 24 | 23 | 24 |
Note: ***, **, * represent statistical significance at 1%, 5% and 10%, respectively. Financial position in household: the person that contributes most (ref. cat.); Sector: private sector (ref. cat.); Establishment size: 1 employee works alone (ref. cat.); Second job: No (ref. cat.).
Acknowledgements
We are grateful to the Editor (Jan Ottosson), Associate Editor (Ann-Britt Hellmark), and two anonymous referees for their careful and timely editing, insightful comments and constructive feedback, which highly improved the quality of this manuscript. We also thank Paula Curt, Cristian Litan, and Monica Zaharie for valuable suggestions on a previous version of our manuscript.
Declaration of conflicting interests
The authors declared no potential conflicts of interest with respect to the research, authorship, and/or publication of this article.
Funding
Dorina Lazar acknowledges that this work was supported by the project ‘A better understanding of socio-economic systems using quantitative methods from Physics’ funded by the European Union – NextgenerationEU and the Romanian Government, under National Recovery and Resilience Plan for Romania, contract no 760034/23.05.2023, cod PNRR-C9-I8-CF255/29.11.2022, through the Romanian Ministry of Research, Innovation and Digitalization, within Component 9, Investment I8.