






Abstract
Applications using quasi-experimental comparison group designs in regional science and geography have increased substantially over the last three decades, inspired by the work of Andrew Isserman and colleagues in the 1980s and 1990s, robust literatures on quasi-experimental design in fields like education and psychology, a vast program evaluation literature, observational studies methodology in statistics, and the growing interest in experimental and nonexperimental (natural) designs in empirical economics. This article discusses the state of quasi-experimental comparison group research today, with a primary focus on studies in which regions—census tracts, counties, cities, metropolitan areas, provinces, or states—are the units of analysis. There is still progress to be made in improving matching methods, making more extensive use of time-series designs, undertaking more systematic sensitivity testing and checks for the robustness of findings, focusing greater attention on effect heterogeneity and research designs that aid policy and program improvement, and improving the practice of regional quasi-experimental research generally.
Keywords
Introduction
In a traditional experiment, researcher-controlled randomized selection of the objects of study into treatment renders treated and untreated units equivalent and outcomes for the latter are an unbiased estimate of the unobservable counterfactual: what would have occurred in the treated group had it not received treatment. This is a statistical solution to the fundamental problem of causal inference as described by Holland (1986). A quasi-experiment is a research design that is structured conceptually much like a traditional experiment except that the study objects—for example, people, places, firms, government entities, or other organizations—are not randomly assigned to the treatment, condition, or phenomenon under investigation. In a quasi-experiment, nonrandom selection means that observed effects for any untreated group are a likely biased estimate of counterfactual outcomes and thus special care must be taken to mitigate that bias. In regional science and geography applications, “treatment” often constitutes a government policy for which it is not ethically, politically, or practically feasible to exclude beneficiaries in order to create equivalent comparison groups; past public investments for which an ex post evaluation or impact assessment is desired; influences on the location choices of individuals or firms that are beyond the control of the researcher; or environmental events such as natural disasters.
Among the first major contributions to quasi-experimental research design in regional science and geography was the work of Isserman and Merrifield in the early to mid-1980s on comparison (or control) group methods (Isserman and Merrifield 1982, 1987). 1 References to quasi-experimental research design are very few in regional science prior to the appearance of Isserman and Merrifield’s first paper in 1982. Bartels, Nicol, and van Duijn (1982) discuss a modest body of early work in policy evaluation and Isserman and Merrifield themselves cite several antecedents, including Wheat’s (1969, 1970) use of matched city pairs to study the impact of airline service and highways on manufacturing growth and Bender and Schwiff’s (1982) comparison of six Wyoming boomtowns with a six-city control group to assess town governments’ capacity to capture rents in rapid economic growth conditions. Isserman and Merrifield also draw a connection between comparison group techniques and the use of base referents in regional analysis, such as when selected regions are used as reference area alternatives to the nation in shift share analyses or as comparators in the minimum requirements approach to economic base multiplier analysis (see also Boarnet 2001). The economy of one place may be compared to another either for the purpose of generating an ex post explanation—as in traditional shift share analysis—or to produce an ex ante prediction—as when the economic structure of a place that has already achieved a more advanced level of development is used to simulate potential or forecasted input–output relationships in a less-developed study community. Isserman and Merrifield cite Isard et al. (1960) and Tiebout (1969) in these contexts.
Those antecedents aside, Isserman and Merrifield are notable as the first to investigate systematically the strengths and weaknesses of quasi-experimental comparison group designs in regional research settings. Their aim was not just application but also the systematic development of new methods, models, and research procedures. They motivated the value of quasi-experimental research with reference to experimentation as the gold standard in the study of causation and program evaluation while also extolling the relative ease of communicating quasi-experimental findings to policy and lay audiences, much as advocates of natural experiments do today (e.g., Angrist and Pischke 2010). Isserman would go on to publish three more journal articles and several working papers with different colleagues, part of a long-running research agenda fuelled by National Science Foundation grants and other external funding. A number of working papers, masters and doctoral theses, and journal publications by former students and colleagues came out of this program. Therefore, it is not a stretch to argue that Isserman was a major progenitor of research design based thinking in regional science, that is, of the value of giving “the research design underlying any sort of study the attention it would command in a real experiment” (Angrist and Pischke 2010, 12). References to quasi-experimentation in regional science have grown steadily since Isserman’s work with Merrifield. A casual Google Scholar search on the jointly included terms “quasi-experimental” and “regional science” finds a total of 4.0 annual entries between 1980 and 1990, 7.8 between 1990 and 2000, and 53.5 between 2000 and 2010. Google Scholar counts are not static, especially for recent years, but 168 entries are reported for 2011 as of this writing. Not necessarily overwhelming numbers over the last three decades, but a fast-increasing rate.
There is, of course, considerable recent work in regional science and geography that is motivated more by the natural experimentalist tradition in economics than the quasi-experimental perspective of Isserman and colleagues, especially the growing number of studies using a border matching design. Indeed, from a review of the most recent regional and spatial research papers that make use of quasi-experimental principles, it is clear that Isserman’s work is not as well known as one might expect. In part, this is due to expanding interest in geography and regional questions in fields that have their own intellectual antecedents. As the community of scholars and publication outlets that can be reasonably labeled “regional science” has widened, contributing scholars’ knowledge of early contributions in core regional science and geography journals naturally is more mixed. It is reasonable to expect that some convergence in terminology and approaches in the field will occur with time, especially as regional scientists and geographers make their own unique contributions to the theory and method of quasi-experimental research design.
The aim of this article is to discuss the state of quasi-experimental comparison group research today, with a primary focus on studies in which regions—census tracts, counties, cities, metropolitan areas, provinces, or states—are the units of analysis. I begin by revisiting Isserman and his colleagues’ major published work on the topic. After a brief citation-based assessment of that work’s impact on the field, I then discuss recent developments in design and method in some of the more active areas of regional research using quasi-experimental comparison group techniques. My approach is admittedly selective; comparison group designs are related to a much larger set of nonexperimental designs that are the subjects of their own vast and overlapping literatures on quasi-experimentation, natural experimentation, observational studies, and program evaluation. I conclude with thoughts about quasi-experimental comparison group design issues and topics that would benefit from additional investigation by regional scientists. There is still progress to be made in improving matching methods, making more extensive use of time-series designs, undertaking more systematic sensitivity testing, and focusing greater attention on effect heterogeneity. More broadly, regional scientists wishing to inform public policy—a major motivation for Isserman’s work—would benefit by paying more systematic attention to the kinds of results that are likely to be of value to policy makers and public program managers.
Isserman and Comparison Group Designs
The term “quasi-experiment” (QE) originated with the work of Campbell and Stanley (1963). Among the three requirements for establishing a causal relationship—that cause precedes effect, that cause and effect covary, and that no other explanation accounts for the hypothesized relation—the last is the most difficult for nonexperimental research designs to satisfy (Shadish, Cook, and Campbell 2002). Shadish, Cook, and Campbell (2002, 105) describe the essence of the quasi-experimental approach in terms of three principles used to rule out alternative explanations. First is the systematic identification of potential threats to internal validity, a process guided by consultation of enumerated lists of threats commonly arising in various research situations (Cook and Campbell 1979). Second is a preference for the use of research design elements like matching, comparison to multiple control groups, and extensive pretesting over the use of statistical procedures, a principle that Shadish et al. refer to as the “primacy of control by design.” It is not that statistical control techniques are abandoned but rather that a concerted effort is made to minimize overreliance on statistical adjustment after the fact, especially where it would obscure rather than illuminate the specific sources of variation in key variables. The third principle is the use of “coherent pattern matching,” or the forming and investigation of complex, linked predictions that alternative explanations would be unlikely to replicate. Although Isserman and his colleagues did not adopt the particular approach to validity threat assessment espoused by Campbell, Cook, and Shadish, or use the term “coherent pattern matching,” their basic philosophical embrace of the three principles of QE research is evident in their work.
Isserman published six papers developing and using quasi-experimental designs in regional studies, the first two with Merrifield (Isserman and Merrifield 1982, 1987), the third with Beaumont (Isserman and Beaumont 1989), the next two with Rephann (Rephann and Isserman 1994; Isserman and Rephann 1995), and the last with seven other authors (Greenberg et al. 1999). 2 The first five develop various aspects of QE designs or apply them in new contexts; the last is strictly an application that breaks no new ground. Thus, the first five represent the core of Isserman’s published scholarly contributions in this area. Although four of the five papers each contain an application of substantive importance in its own right, reading all five papers in succession reveals a systematic agenda focused on developing QE comparison group designs and techniques in regional science and geography.
The basic issues at the heart of that agenda are clear in the first paper, which consists of a test for regional policy effects using an interrupted time-series analysis with a nonequivalent no-treatment control group (Isserman and Merrifield 1982). The approach involves delineating calibration and policy periods, the former a period of time before the introduction of the policy that is suitable for selecting comparison places and the latter an appropriate post-policy period; selecting comparison regions that are as similar as possible to the treatment region (or regions) in industrial structure, size, and other characteristics (i.e., matching); evaluating the validity of the controls as an estimate of the counterfactual via tests of case and control similarity in the calibration period; calculating policy effects as the difference in relevant outcomes between treatment and comparison regions; testing for the robustness of the results to alternative calibration periods and matching assumptions; and interpreting findings.
Isserman and Merrifield’s application is an analysis of the economic effects of Economic Development Administration (EDA) funding directed to Summers County, West Virginia, which received some $13 million between 1968 and 1971 to improve its state parks and boost tourism. Isserman and Merrifield identified an initial sample of comparison counties from within West Virginia and the five nearest states, reasoning that this larger macro region would yield places that are most like Summers in industrial structure and other economic characteristics but ruling out counties immediately adjacent to Summers to ensure the economic independence of the case county and set of controls. Using a calibration period of 1962–1967, they reduced the pool of 523 prospective controls to 76 by applying population and industry mix criteria, then to 12 using factor and cluster analysis to evaluate similarities in income growth across fifteen major industries, then to eight by undertaking a painstaking check of each of the twelve for highly unique economic shifts or infrastructure projects occurring in the policy impact period. Tests for minimum differences in income growth between Summers and alternative groups of comparison counties resulted in a final control set of three counties in West Virginia and one in Kentucky. The overall income change difference between Summers and its control group was indeed near zero in the calibration period, but Isserman and Merrifield were unable to eliminate variation in growth by individual sector and the industry mix of some of the controls differed in significant ways from Summers. Those problems can be traced to the use of an ad hoc stepwise procedure instead of a joint evaluation of a wider range of county characteristics, such as single period industry mix indicators along with measures of industry growth. Isserman and Merrifield acknowledge that the validity of the controls could be challenged but contend they are far more similar to Summers than the nation, the typical comparator used by regional scientists in impact analyses.
Isserman and Merrifield’s impact measure, also used in the test for the validity of the controls in the calibration period, is based on shift-share logic:
The analysis in Isserman and Merrifield (1982) is a rudimentary application of the QE approach with spatial units. Nevertheless, it demonstrated the several major advantages of the QE method: it requires that operational hypotheses are unambiguous; the analyst is not obliged to construct a detailed theoretical model specifying the relationships among all pertinent variables and thus avoids imposing structure on the data; no assumptions regarding functional form are required, unlike in the use of regression; it provides a means of controlling for the influence of national and global economic conditions; it can be used for both policy evaluation and general ex post impact analysis, two major concerns of regional scientists; and it is a viable methodology for investigating supply-driven regional development since it is not premised on a stable regional economic structure, as are demand-oriented techniques like input–output analysis. The last advantage means that the regional QE comparison group designs are especially valuable for exploring economic, demographic, and social outcomes associated with major structural change, such as the installation of substantial new infrastructure, investment in mega-projects like sports stadia, spending on large-scale events, and significant supply disruptions associated with natural or manmade disasters.
Also apparent in the Isserman and Merrifield application are the limitations of QE designs. While identifying contexts where an estimated impact might be caused by the program, investment, or event under study is easy enough—what Isserman and Merrifield (1987) label plausible causality—in many research situations it may be impossible to separate empirically the influence of the study phenomenon from other factors also affecting economic trends (tractable causality). Most regions are subject to multiple policy interventions, infrastructure investments, or localized shocks, particularly over extended periods of time. Therefore, the likelihood of isolating the effect of any one influence may be very low. Finding a suitable comparison group for study regions may also be difficult in some contexts, an instance of the common support problem well known in the evaluation literature (Imbens 2004; Smith 2004; Ravallion 2008; Imbens and Wooldridge 2009).
Clearly, having a large number of spatial units from which to draw controls is important. Cities, counties, and census tracts are the most obvious candidates as there are many of them, increasing the likelihood of finding comparable controls for each study place. However, the sample of possible controls can drop rapidly when the number of study places grows and/or when macro-regional selection criteria are applied. For example, a decision to search for controls from among other Southern counties for a study county in the US South, owing to the unique economic and social history of the region, reduces the sample of possible controls from over 3000 to several hundred. Assuring sufficient economic independence to eliminate the prospect of the case county intervention affecting a control county will further restrict the number of comparison places, since very similar places are also often economically linked, even when not immediately adjacent to one another. Obviously, the difficulty of finding appropriate controls rises with the size and economic complexity of the place under study. Rarely can regional QE comparison group methods be applied to the study of metropolitan areas, larger regions, provinces and states, simply because the larger the place, the more unique it is; “there is only one Big Apple” (Isserman and Beaumont 1987, 7).
Subsequent papers by Isserman and colleagues refine and extend the regional QE comparison group approach by undertaking more sophisticated applications, implementing better methods for selecting control groups, and adopting statistical measures of effects. In terms of application, Isserman and Merrifield (1987) use the case of a gas, oil, and coal boom and construction of a power plant in a single Wyoming county to demonstrate the use of QE comparison group designs in economic impact analysis. They investigate spatial spillovers in the same study, testing for the effect of the study county’s boom-driven growth on a neighboring county, an approach Rephann and Isserman (1994) extended in investigation of the rural economic development impacts of the US interstate highway system. The highway study is notable for using a large sample of treatment places rather than a single case region. Estimation of impacts on counties adjacent to those with an interstate highway provided a means of testing for spillovers. Rephann and Isserman also categorized counties with highways in order to isolate impacts from road construction from the general presence of a highway, as well as to test for differential impacts on different kinds of places (rural counties with some level of urbanization, rural counties proximate to larger metropolitan areas, and rural counties well beyond the reach of urban spread or backwash effects).
Isserman’s last major application of QE methods, also in collaboration with Terance Rephann (Isserman and Rephann 1995), returned to policy evaluation to investigate the overall economic impact of the Appalachian Regional Commission (ARC). The study is precisely the kind of bold, large-scale, policy-motivated regional analysis Isserman and Merrifield (1982) believed QE comparison group techniques to be uniquely capable of delivering. Comparing the income and population trajectories of nearly all ARC counties against a sample of non-Appalachian twin control counties over the period 1965–1991 using difference-in-differences, Isserman and Rephann find that Appalachian counties grew significantly faster after 1969, outpacing their twins by an average of 48 percent in income, 17 percent in per capita income, and 5 percent in population. If one accepts that the comparison groups are equivalent, the income figures imply that $13 billion in direct expenditures by the ARC between 1965 and 1991 generated substantial aggregate income effects in the region, $8.4 billion in 1991 alone. A subsequent US General Accounting Office review discounted the results (GAO 1996), arguing that nothing in the Isserman and Rephann methodology links ARC spending programs directly to economic outcomes in Appalachia, a common criticism of quasi-experimentalist designs as compared to structuralist designs (Holmes 2010). QE comparison group designs do require something of a “leap of faith” (Isserman and Rephann 1995, 362), although they can be combined with other techniques such as regression analysis to test as thoroughly as possible for plausible competing explanations, as Isserman and Rephann themselves demonstrated. A clear disadvantage of the QE approach is the absence of estimated structural parameters that may be used to simulate impact scenarios and policy alternatives.
As already noted, Isserman and Merrifield’s (1982, 1987) heuristic approach to selecting controls suffered from a classic problem in the application of matching methods: improving the balance between treated and control units on some covariates can lead to a worsening of that balance on others. Isserman and Merrifield had no ready solution other than exploring combinations of controls by hand in order to find the least-worst groups. In essence, the approach consisted of applying a series of relatively blunt decision rules to reduce the number of potential control candidates in an age when machine-readable data and computing power were still limited. While the painstaking process of winnowing controls probably facilitated interpretation of impact results once the control group was determined, there was clearly high potential to produce suboptimal matches. Isserman and Beaumont (1989) sketched out ideas for automating control selection, better measuring posttreatment differences between case areas and control areas, and validating results, ideas that were subsequently applied in Rephann and Isserman’s interstate highways and ARC studies.
Those two papers made three significant advances on regional comparison group selection. The first was to systematically evaluate the equivalence between treatment and control regions. Instead of screening controls in a stepwise fashion and then refining samples by minimizing case–control sample differences using outcome variables for a period immediately preceding the treatment period, Rephann and Isserman (1994) and Isserman and Rephann (1995) adopt the Mahalanobis distance metric to calculate the similarity between each treatment area and each candidate control area for a broad set of matching variables identified on theoretical grounds. The scale invariant Mahalanobis measure weights variables by their covariances, so that the limited information introduced by any pair of highly correlated variables is taken into account. The second advance was to assign a unique twin area to each treatment area using an optimal matching algorithm that minimizes the sum of Mahalanobis distances over all matched pairs (Rosenbaum 1989). The third improvement was to distinguish the calibration and pretest periods. The calibration period is used in the matching phase. The validity of the matching result is then investigated for a period postdating the calibration period but predating the impact period. Ideally, the influence of specific calibration and pretest periods is investigated in sensitivity analyses (e.g., see Pender and Reeder 2011).
For example, in Rephann and Isserman (1994) counties are matched using a set of twenty-seven covariates capturing industry mix, size, density, distance to cities of different sizes, and income and population growth, with levels variables measured for 1959 or 1960 and change variables measured for the period 1950–1959. The suitability of the set of identified control twins is then investigated in two ways for the three-year period preceding the 1962–1984 treatment period: first, via a test of mean growth rate differences of the matched treatment and control twins for individual or sector-specific variables; second, via a test of global significance on the growth differences for all variables together. For the former, Rephann and Isserman use a simple t-test; for the latter, they use the Hotelling T2 statistic. The approach is similar in spirit to more modern tests for bias due to unobserved confounding factors (Imbens and Wooldridge 2009).
What steps should one take if the control group validation tests fail? Rephann and Isserman (1994, 735) outline four options: remove areas that were difficult to match—as indicated by high Mahalanobis distances—from the treated group sample (equivalent to imposing a common support requirement); choose a different pretreatment control selection period and find new case–control twins; change the initial screening variables (calipers) and/or covariates used in the matching (equivalent to improving the modeling of the treatment selection process); accept that the control group is an imperfect match to the treatment group and proceed. The last option is likely to be common practice since finding ideal matches to regions, counties, neighborhoods, census tracts, or other spatial units is very difficult given differences among places in geography, natural endowments, industrial specialization, and economic history combined with the limited samples from which controls can typically be drawn. Moreover the notion of a “failed” pretest is something of a misnomer. Although one could interpret a significant Hotelling statistic as sufficient evidence of failure, t-tests on individual variables will most often produce mixed results; a set of twins will often be good matches on some variables and not others.
The direction of the differences, both in the pretest and treatment periods, also matters, as does the nature of the problem under study. Isserman and Rephann (1995) argue that in tests of treatment effects on regional economic development, a treated group growing faster than the comparison group in the selection test period coupled with faster treated group growth in the treatment test (or impact) period implies a failed comparison group, if the hypothesis is that the intervention under study should boost regional growth. On the other hand, if the hypothesis is that the intervention constitutes a negative economic shock, such as a natural disaster, faster growth in the treated group in both pre- and post-shock periods might be construed as a conservative test of whether the shock dampened economic growth. Likewise, for a hypothesis of positive impacts, slower growth in the treated areas in the selection period coupled with faster growth in the impact period would suggest a conservative estimate of positive impacts. Even with this kind of reasoning, appreciable deviations in the growth between cases and controls in some suitable period preceding the intervention raises significant validity concerns and suggests study findings would have to be interpreted cautiously. It is often not hard to identify counterarguments that would turn a conservative test into a liberal one. For instance, some research suggests that natural disasters yield a net positive economic impact on afflicted areas as a result of spending associated with the disaster response, injections of insurance funds and other resources for rebuilding, and productivity improvements from improved infrastructure and new facilities and equipment (Xiao 2008). Just because we believe a particular intervention or shock yields a particular directional impact does not mean we are right.
Impact testing was the third major area of QE design refinement introduced by Isserman and colleagues. Under the case study-based framework in Isserman and Merrifield (1982, 1987), there is no standard by which to judge the magnitude of observed differences between case region and control group; that is, whether a given difference is due to chance versus actual impact or policy effect. Although Isserman and Beaumont (1989) propose nonparametric tests, either they did not pursue development of those techniques or their efforts were unsuccessful. Shifting to a design that matches many counties to control twins permits the calculation of means, variances, and differences in means. If the case and control growth rates are assumed to be drawn from a normally distributed population of growth rates, univariate and multivariate t-tests can be used to evaluate the likelihood of observing given differences. This is the approach used in both Rephann and Isserman (1994) and Isserman and Rephann (1995).
As discussed below, the application of quasi-experimental comparison group designs in regional research has advanced considerably since Isserman’s work with his colleagues. Among other things, researchers are using more sophisticated matching estimators as well as designs that combine control groups with other techniques, such as switching regressions and time-series modeling. However, the basic principles as they apply specifically to regional research contexts, as well as some of the fundamental limitations, remain very much as laid out in the Isserman et al. papers.
There is another feature of the Isserman QE work worth noting: its careful attention to local conditions and context in each study place, a necessary precondition for specifying good hypotheses and for effective sensitivity testing and evaluation of alternative hypotheses. Both theory and observation are required to do experimentalist work well, just as in structural research (Keane 2010). Good regional QE research requires meshing theory and a good familiarity with the economic and demographic mix, history, interregional linkages, demographic and economic trends, features of the policy or other “treatment” being investigated, and other possible influences on the growth and development paths of the communities or regions being studied. That may appear obvious, but with increasingly ready access to large online databases and ever more sophisticated and simple-to-use software containing preprogrammed matching and statistical analysis algorithms, it is easy—informed by only the vaguest understanding of local conditions—to generate many calculations for multiple areas, inevitably reducing any subsequent sensitivity analysis and robustness checks to mechanical exercises. Each of the applications discussed above is a good example of how compelling a regional QE comparison group design can be when the foundation of the work is a thorough understanding of both the study environment and the characteristics of the “treatment,” a point of emphasis in the observational studies and experimental design literatures (Shadish, Cook, and Campbell 2002; Rosenbaum 2010). 3
Isserman’s Impact
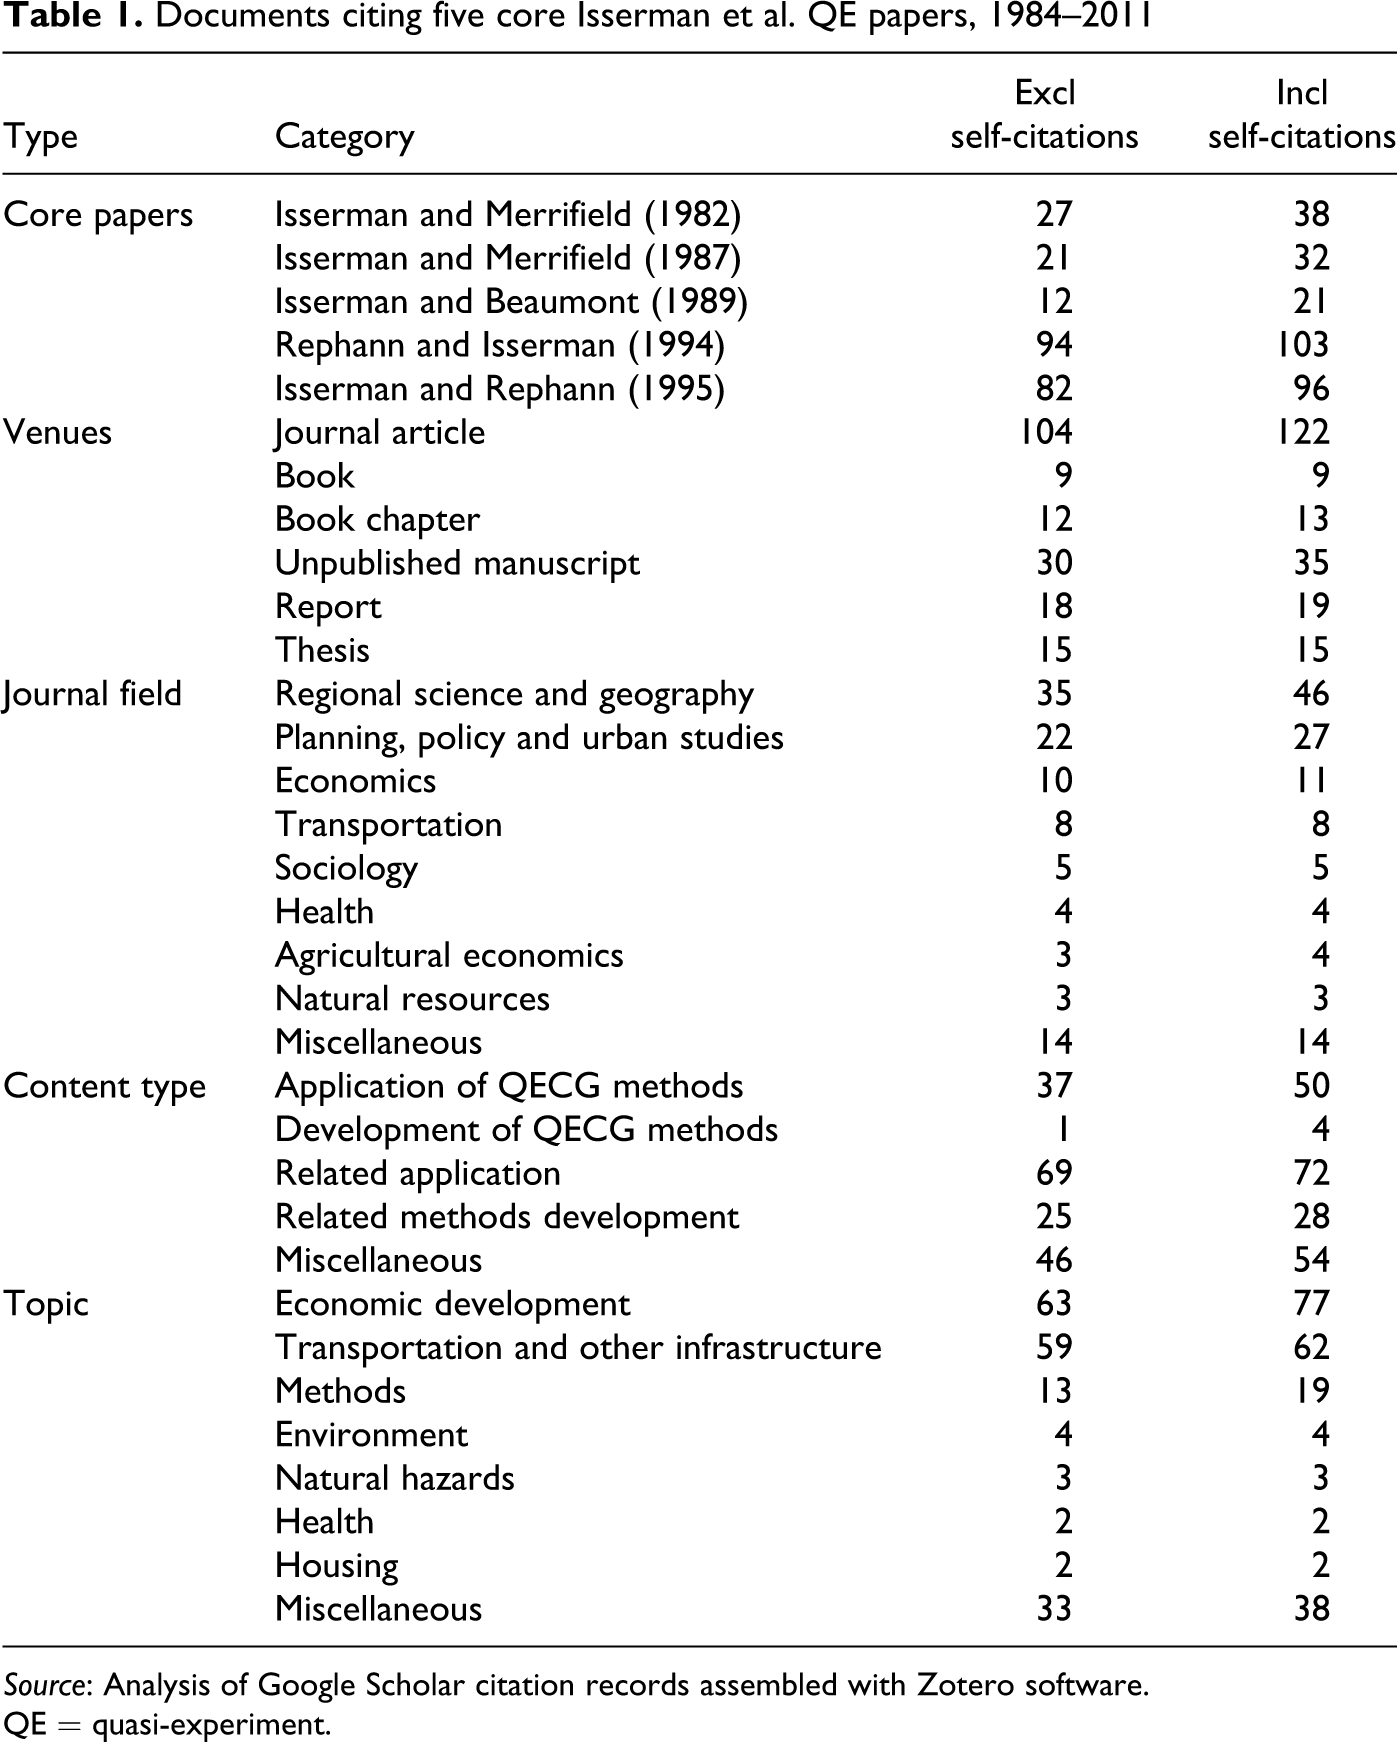
Citations provide a ready if imperfect means of assessing the influence of Isserman et al.’s contributions to regional scholarship and related fields of professional practice. Using Google Scholar in order to capture both scholarly and practitioner citations, verifying each source, and culling duplicates, finds 197 unique documents referencing one or more of the five core Isserman QE papers over the period 1984–2011, excluding any self-citations by Isserman and his collaborators. This includes 104 journal articles, nine books, twelve book chapters, and fifteen theses (see Table 1). Rephann and Isserman’s paper on highways and Isserman and Rephann’s paper on the ARC are the most widely cited of the five papers by a large margin, with the three more methodologically focused papers referenced only relatively infrequently. Among journal articles, predictably the majority are published in regional science and geography, planning, policy and urban studies, and economics outlets, although some also appear in selected sociology, health, and natural resource fields. 4 While thirty-seven publications apply QE comparison group techniques (fifty if one includes Isserman and his colleagues’ own papers), only a single paper is focused specifically on the methodology of regional quasi-experimental comparison group designs (Reed and Rogers 2003). A large number of publications use or develop related evaluation or impact analysis techniques, citing Isserman et al.’s work. Economic development, transportation, and infrastructure are the most common substantive topics in the mix. Of course, many of the citing documents are motivated by Isserman et al.’s applications and substantive findings rather than their development of QE designs, particularly those referencing Rephann and Isserman (1994) and Isserman and Rephann (1995).
Documents citing five core Isserman et al. QE papers, 1984–2011
Source: Analysis of Google Scholar citation records assembled with Zotero software.
QE = quasi-experiment.
Figure 1 plots the number of references to the Isserman et al. work per year, again excluding self-citations. While the trend is generally upward, one might interpret the relatively low overall numbers as evidence that the papers constitute a specialized niche in regional science that is not well known among the growing cadre of regional researchers contributing to the emerging interest in experimentalist and nonexperimentalist designs (as described by Angrist and Pischke 2010). On the other hand, influence can be indirect. Although many recent studies using administrative borders to distinguish comparison groups make no reference to Isserman et al. (e.g., Huang 2008; Billings 2009; Dube, Lester, and Reich 2010; Billings and Thibodeau 2011), a seminal contribution in that literature—Holmes (1998)—references Isserman and Rephann (1995) as an important intellectual antecedent. Direct citations to the work of Isserman et al. aside, what is clear is that quasi-experimentation in general is currently enjoying a renaissance in regional science, geography, and empirical economics. The next section discusses this renewed interest as well as developments in the use of area comparison group designs and techniques specifically.
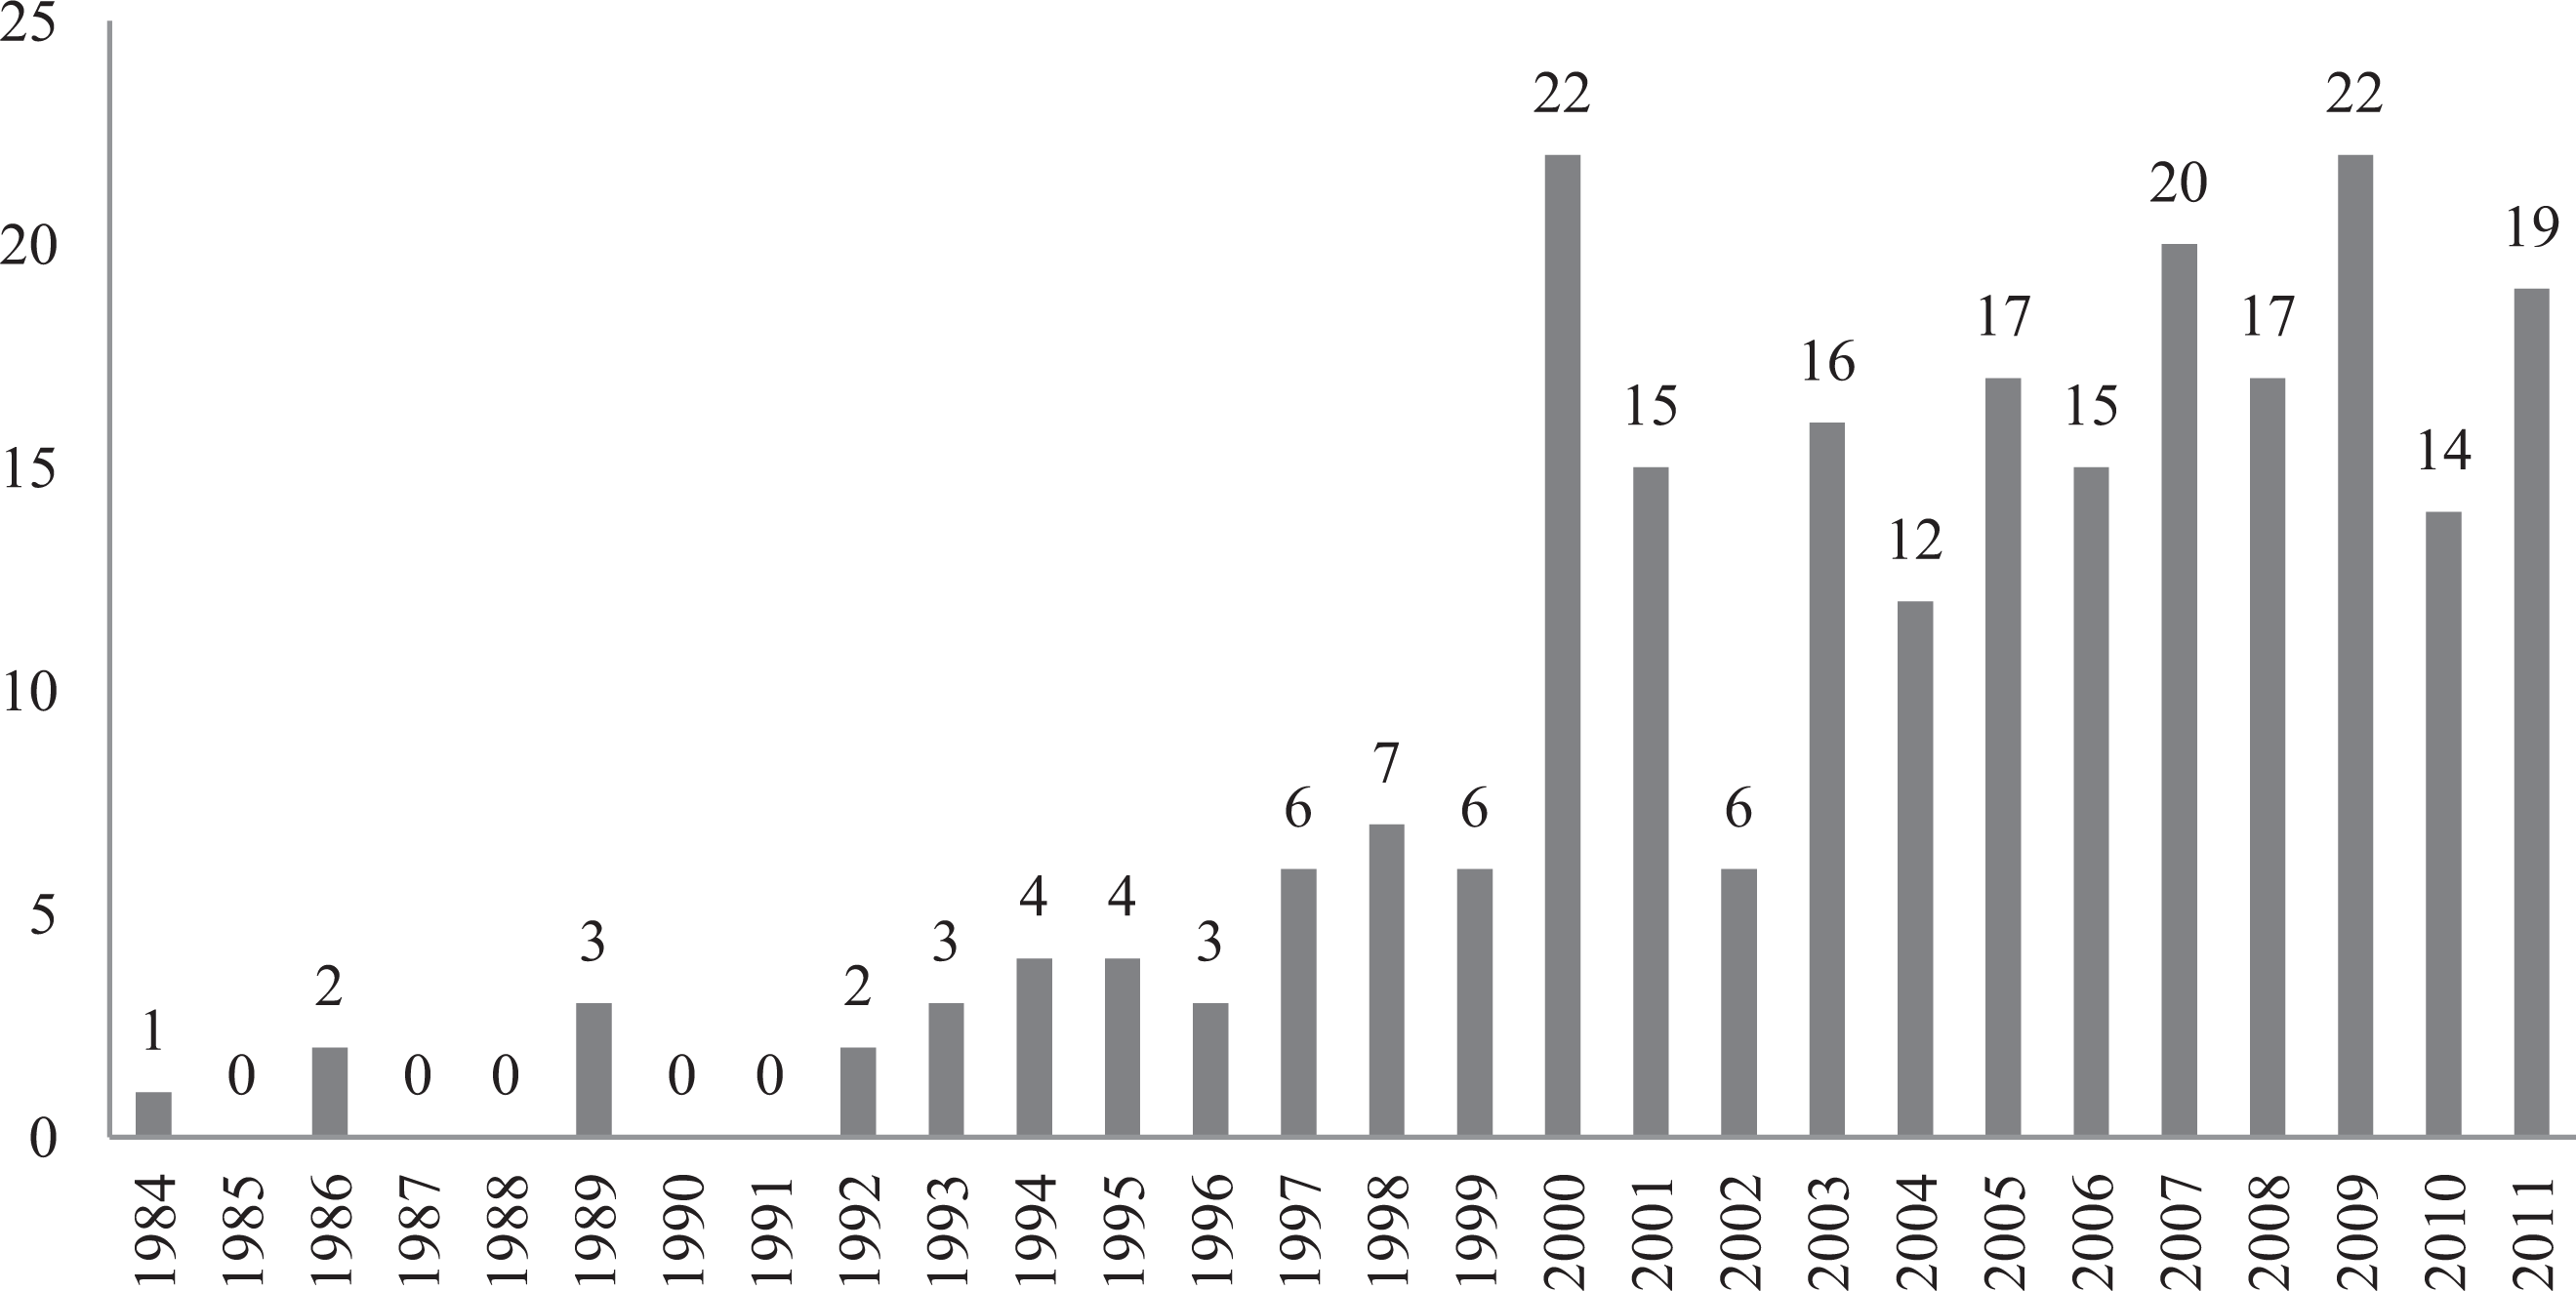
Isserman et al. QE papers: Citations per year (excluding self-cites). QE: quasi-experiment.
Recent Developments
Quasi-experimental research designs, which have been developed most extensively in education studies and psychology, are similar to the “natural experiments” of economists and the “observational studies” of statisticians (Meyer 1995; Rosenbaum 1999; Shadish and Cook 1999). In an observational study, the tight control of the research environment afforded in an experiment is “to a large extent, replaced by choice—the environment is carefully chosen” (Rosenbaum 1999, 259), while the rationale behind the natural experiment is that “if one cannot experimentally control the variation one is using [to estimate key parameters], one should understand its source” (Meyer 1995, 151). The label “natural” in a natural experiment refers to circumstances arising in field research settings that yield clear exogenous variation in explanatory variables. An early and well-cited example is Angrist (1990), who sought to measure the impact of military service on subsequent earnings. That the government used a lottery to identify draftees during the Vietnam War fortuitously yields a means of addressing a difficult selection problem, that is, individuals with the potential for lower long-run earnings are more inclined to enlist. The government’s adoption of a random draw coupled with that draw’s influence on likelihood of military service makes an indicator of draft eligibility based on lottery numbers an excellent instrument for military service. Border matching, regression discontinuity, and difference-in-differences designs are other staples in the (natural) experimentalist tradition.
Angrist and Pischke (2010) assert that natural experimentation and quasi-experimentation are becoming more prevalent in the economic and policy sciences in reaction to the naïve use of increasingly complex and assumption-laden econometric models and estimators (Leamer 1983; Berk 2010) and that a growing demand that scholars articulate their research designs and identification strategies is helping to reestablish the credibility of applied econometrics. As an example of this shift in outlook, Angrist and Pischke argue that the once common approach of using instrumental variables with only cursory justification is no longer adequate for scholarly publication. Researchers must now make a much stronger practical and empirical case for why using a given instrument convincingly captures a natural experiment. A related shift in thinking is underway in regional science and quantitative geography, where the capability of standard spatial econometric techniques to identify causal relationships associated with the core phenomena of scientific interest in the field—geographic spillovers, agglomeration, and spatial interactions—has become the subject of a robust debate (McMillen 2010; Pinske and Slade 2010; Corrado and Fingleton 2012; Gibbons and Overman 2012; McMillen 2012; Partridge et al. 2012). Gibbons and Overman (2012), in particular, counsel greater use of quasi-experimental or design-based research approaches in the investigation of spatial problems where uncovering causal relationships is the aim. Holmes (2010) and McMillen (2010) offer supporting views while Corrado and Fingleton (2012) have a slightly different take on the issue.
Geographical borders often present a useful device for natural experiments that are of particular interest to regional scientists and geographers. Applications exploiting this fact have proliferated in the recent years. As noted above, a classic example is Holmes (1998) who investigates whether state policies influence the location of manufacturing by comparing manufacturing employment shares in counties aligning state borders where one of the adjacent states has adopted right-to-work legislation and the other has not. Other border matching applications in which locational difference is more than just a setting that yields a convenient experiment include Black (1999) on school quality, Billings (2009) on enterprise zones, Charlot, Paty, and Visalli (2013) on influence of local taxes on property values, Billings and Thibodeau (2011) on the decentralization of local public goods, Rohlin (2011) on state minimum wages and business location, Cunningham (2007) and Zhou, McMillen, and McDonald (2008) on the impacts of zoning on land prices, and Huang (2008) on banking deregulation and local economic growth. Occasionally effects associated with a border itself are the object of interest. Examples are Fox (1986) who studies potential distortions in the location of retail activity along state borders due to differential income, sales, and property taxes, and Bronars and Lott (1998), who investigate whether “shall issue laws,” which require authorities in a given jurisdiction to license the carrying of concealed weapons, generate spillover crime in neighboring jurisdictions. Lacombe (2004) asks whether the typical border research methodology deals properly with spatial dependence. After finding that it does not in a comparison of Holmes’ (1998) methodology with one of his own (Holcombe and Lacombe 2004), he proposes an alternative approach using spatial autoregressive lagged dependent variables.
McMillen (2010) discusses the value of borders for spatial analysis when they yield geographic areas that are discrete in the sense that the values of observed and unobserved variables may be assumed constant within a given zone. In many—and perhaps most—instances, that is a very strong assumption and additional care must be taken through the use of regression or other techniques to control for sources of variation within zones that may be correlated with both treatment and outcomes. This serves to emphasize that the pure border matching design is a special case of a matching estimator where location in different zones is considered a sufficient criterion to yield comparable treatment and no-treatment groups.
A common matching estimator used in regional science applications is the Mahalanobis metric, the estimator adopted by Rephann and Isserman (1994) and Isserman and Rephann (1995). A large number of regional quasi-experiments adhere closely to the Isserman/Rephann example (e.g., Paskaleva 1989; Rephann et al. 1997; Rephann 2000; Sullivan et al. 2004; Ona, Hudoyo, and Freshwater 2007; Xiao 2008; Stenberg et al. 2009; Xiao 2011; Xiao, Wan, and Hewings 2011). However, the use of propensity scores is becoming increasingly common (McMillen and McDonald 2002; Greenbaum and Engberg 2004; O’Keefe 2004; Glasmeier and Farrigan 2007; Wenz 2008; Renski 2009; Smith 2009; Garcia-Milà and Montalvo 2011). A propensity score is the probability a study subject received treatment, conditional on a set of covariates measured prior to treatment. By definition, in a nonrandomized experiment, the true probability of treatment is unknown. Therefore, it must be estimated, typically with logit or probit regression. Matching on the basis of a propensity score—the propensity of receiving treatment—brings treated and untreated units into equivalence on pretest values, that is, constructs comparison groups that are balanced on covariates. Rosenbaum and Rubin (1983) proved that propensity score analysis will yield an unbiased estimate of treatment effects if the covariates capture all factors related to treatment assignment and potential comparison outcomes for all study units and the probability of being assigned to treatment or comparison groups is nonzero for all units. Those conditions meet the strongly ignorable treatment assignment assumption (Zhao 2004; Shadish and Steiner 2010). Propensity score matching is intuitively appealing compared to matching with the Mahalanobis metric. Whereas the latter measures similarity across covariates, weighting by the inverse covariance, the former weights more heavily those variables that have the strongest association with treatment assignment. Carefully identifying and measuring the selection process, as well as the quality of the pretest data, are essential to the valid application of the propensity score approach (Smith and Todd 2005; Shadish and Steiner 2010).
A particularly careful regional science application of propensity score matching is Pender and Reeder’s (2011) investigation of the impacts of spending by the US Delta Regional Authority (DRA), a study similar in basic design to Isserman and Rephann’s (1995) evaluation of ARC spending. Pender and Reeder match DRA recipient counties to a comparison group of non-DRA eligible counties using the Mahalanobis metric and three different forms of propensity score matching (with replacement, without replacement, and kernel matching), comparing results to assess the robustness of difference-in-differences estimates to the various techniques. They find that propensity score kernel matching performed the best in terms of bias reduction in the pretest while Mahalanobis matching performed the worst, although they acknowledge there are other trade-offs among estimators associated with both efficiency and calculation of standard errors. For example, the standard errors for a Mahalanobis metric estimator of average treatment effects on the treated (ATT) are asymptotically consistent if bias from imperfect matching on covariates is corrected whereas the standard errors for a propensity scoring estimator are inconsistent (Abadie and Imbens 2006, 2008). Therefore, the choice of best matching estimator is not self-evident, again highlighting the value of comparing results using different methods. Pender and Reeder find that growth in per capita personal income was between $499 and $660 higher in DRA counties than in matched non-DRA counties, depending on the matching estimator used and whether a correction for bias associated with imperfect matching is implemented. Notably, the impacts are not statistically significant in either set of bias-corrected estimates.
Pender and Reeder implement other methods that illustrate the emerging state of the art in regional quasi-experimental comparison group research, including the use of switching regressions to evaluate the influence of DRA program intensity on outcomes (marginal effects) and to test for possible heterogeneity in impacts for different covariates (following Crump et al. 2008). They also include an extensive set of sensitivity tests designed to investigate plausible alternative explanations for their positive impact findings. Both sensitivity testing and investigation of heterogeneity are valuable for implementing the coherent pattern matching principle in theory testing applications of quasi-experimental designs as well as producing results of practical value in program and policy evaluation. In a demonstration of the latter, Ferraro and Hanauer (2011) estimate the heterogeneous impacts of forest protection in Costa Rica, conditional on environmental and socioeconomic characteristics. The context is existing studies of mean treatment effects showing that land protection has been moderately successful in preventing deforestation as well as reducing poverty (Andam et al. 2008; Andam et al. 2010). In an analysis of statistically significant and policy relevant impacts on specific spatial subgroups, Ferraro and Hanauer find that the goals of deforestation prevention and poverty reduction via the assignment of protected areas may come into conflict when high impacts are sought on either objective; areas likely to generate highly positive environmental benefits are different from those likely to substantially alleviate poverty. More generally, Ferraro and Hanauer show how impact analysis can inform efforts to maximize the overall average impacts of a program or policy by conditioning on observable subgroup differences, an application of Manski’s (2005) concept of conditional empirical success (CES) rules.
Still relatively rare in regional QE applications is implementation of what Isserman and Merrifield (1982) argue is one of the major advantages of regional comparison group designs over traditional impact analyses: the potential to trace out the timing of impacts or policy effects, preferably by industry or other relevant categories to help evaluate the validity of the results as well as reveal insights into the structural evolution of regional economies. Still most common are simple difference-in-differences studies that estimate effects for a single time span (e.g., Pender and Reeder 2011). An exception is Xiao’s research on the county-level economic impact of flooding in the US Midwest, which marries the quasi-experimental comparison group design with ARIMA modeling (Xiao 2011; Xiao, Wan, and Hewings 2011) and structural break point analysis (Xiao and Feser 2012). Time-series analysis is common in disaster research (e.g., Ewing, Kruse, and Thompson 2005; Baade, Baumann, and Matheson 2007), but the usual approach is to focus only on affected areas and test for shifts in the time path of economic indicators like unemployment, commencing with the date of the disaster event and persisting for some period thereafter. Applying this approach on well-constructed comparison group differences helps control for broader macroeconomic trends. Determining time-series break points endogenously goes a step further to account for possible confounding from unrelated events that are proximate in time with the event under study (Bai and Perron 1998, 2003; Caporale and Grier 2005). Xiao’s work demonstrates how the combination of QE designs and time-series methodologies facilitates investigation of the short and long run resilience of regional economies to supply and demand disruptions associated with disasters. It is an approach that could be applied to other regional questions.
Conclusion
Applications using quasi-experimental comparison group designs in regional science and geography have increased substantially over the last three decades, inspired by the work of Isserman and colleagues in the 1980s and 1990s, robust literatures on quasi-experimental design in fields like education and psychology, a vast program evaluation literature, observational studies methodology in statistics, and the growing interest in experimental and nonexperimental (natural) designs in empirical economics. While regional scientists’ main concern is not in creating wholly new matching estimators, bias adjustments, robustness tests, and so on, increasing the number and sophistication of applications to theory, impact analysis, and regional policy evaluation is essential for building knowledge about which quasi-experimental methods and techniques perform best in regional and spatial analytical research settings. In this sense, more attention to the practice of quasi-experimentation is needed. Many regional studies choose and apply only a single matching estimator, ignore potential bias from selection on unobservables, choose matching covariates based on available data rather than careful consideration of the treatment selection process, conduct only limited sensitivity analyses and tests for plausible alternative hypotheses, and ignore possible effect heterogeneity. There is comparatively little attention to how coherent pattern matching can be used to rule out alternative explanations and efforts to join the quasi-experimental comparison group design with related analytical methods (e.g., time-series econometrics) remain few. In general, quasi-experimental applications in regional science and geography tend to be idiosyncratic and insufficiently introspective, implying a need for the development of principles and guides for quasi-experimental research practice. Interestingly, that was the central focus of Isserman’s early work with Merrifield.
To conclude, I will add a plug for applications that consider both the potential heterogeneity of treatment effects or impacts among key subpopulations and the tangible needs of policy makers and planners focused on the functioning of initiatives and programs. It is certainly important to have a good understanding of the average effects associated with a given policy, program, or phenomenon. However, considerably more specific findings are needed if regional scientists and geographers are to help policy makers and program managers undertake what Besharov (2009, 201) describes as doing the “unglamorous work of program improvement.” Taking Isserman and Rephann’s (1995) study of the Appalachian Regional Commission spending as an example, how would that research have been designed if the question was not whether ARC spending has a net income impact on the region’s economic trajectory, but rather how one could increase the impact of ARC spending? After all, even if one finds that a given program or policy has limited effects, it does not necessarily follow that the answer is to scrap the program. Instead what might be needed is restructuring, better implementation, more rather than less investment in order to build critical mass, different kinds of investments, public investments leveraged with private, better targeting of investments, and so on. Given that few government programs are ever eliminated, even when evidence of their aggregate benefits is scarce, we might do well to turn some of our attention to how we might aid the cause of improving programs and initiatives we appear destined to continue. It would not only open up new and potentially richer applications for regional quasi-experimentation, but it would necessarily draw the worlds of practice and scholarship closer together, hopefully to their mutual advantage, something regional scholars have called for many times before (Rasmussen 1990; Isserman 1994; Markusen 1999; Campbell 2000; Smith 2005; Barkley 2008; Jackson 2011).
Footnotes
Declaration of Conflicting Interests
The author(s) declared no potential conflicts of interest with respect to the research, authorship, and/or publication of this article.
Funding
The author(s) received no financial support for the research, authorship, and/or publication of this article.