






Abstract
The intima media thickness (IMT) of the common carotid artery (CCA) can be used to predict the risk of atherosclerosis. Many image segmentation techniques have been used for IMT measurement. However, severe noise in the ultrasound image can lead to erroneous segmentation results. To improve the robustness to noise, a fully automatic method, based on an improved Otsu’s method and an adaptive wind-driven optimization technique, is proposed for estimating the IMT (denoted as “improved Otsu-AWDO”). First, an advanced despeckling filter, i.e., “ Nagare’s filter” is used to address the speckle noise in the carotid ultrasound images. Next, an improved fuzzy contrast method (IFC) is used to enhance the region of the intima media complex (IMC) in the blurred filtered images. Then, a new method is used for automatic extraction of the region of interest (ROI). Finally, the lumen intima interface and media adventitia interface are segmented from the IMC using improved Otsu-AWDO. Then, 156 B-mode longitudinal carotid ultrasound images of six different datasets are used to evaluate the performance of the automatic measurements. The results indicate that the absolute error of proposed method is only 10.1 ± 9.6 (mean ± std in μm). Moreover, the proposed method has a correlation coefficient as high as 0.9922, and a bias as low as 0.0007. From comparison with previous methods, we can conclude that the proposed method has strong robustness and can provide accurate IMT estimations.
Keywords
Introduction
Cardiovascular disease (CVD) has been become a “first killer,” and is harmful to human health. 1 Atherosclerosis is a major source of CVD. 2 The common carotid artery (CCA) is a common site for atherosclerosis. Research has proven that the intima media thickness (IMT) is an effective parameter for predicting cardiovascular risk, as an increase of the IMT indicates a higher risk of atherosclerosis.3–7
As can be seen in Figure 1, there are three layers in the CCA wall. From the innermost to the outermost, they are the intima, media, and adventitia. These three layers can be seen in a longitudinal cut of the human carotid artery, over the near and far walls. The dark area in the middle is called the lumen (see Figure 1(a)). The two boundaries at the far wall represent the lumen intima interface (LII) and media adventitia interface (MAI), and the LII and the MAI compose the intima media complex (IMC) (see Figure 1(b)). The IMT is defined as the distance between the LII and MAI. In clinical practice, the IMT can be manually measured by experienced doctors. However, there are many problems in the manual measurement of IMT, such as low efficiency and manual errors. 8 To overcome the weaknesses of manual measurement, many efforts have been devoted to measuring the IMT based on semi-automatic or automatic measurement methods.8–10
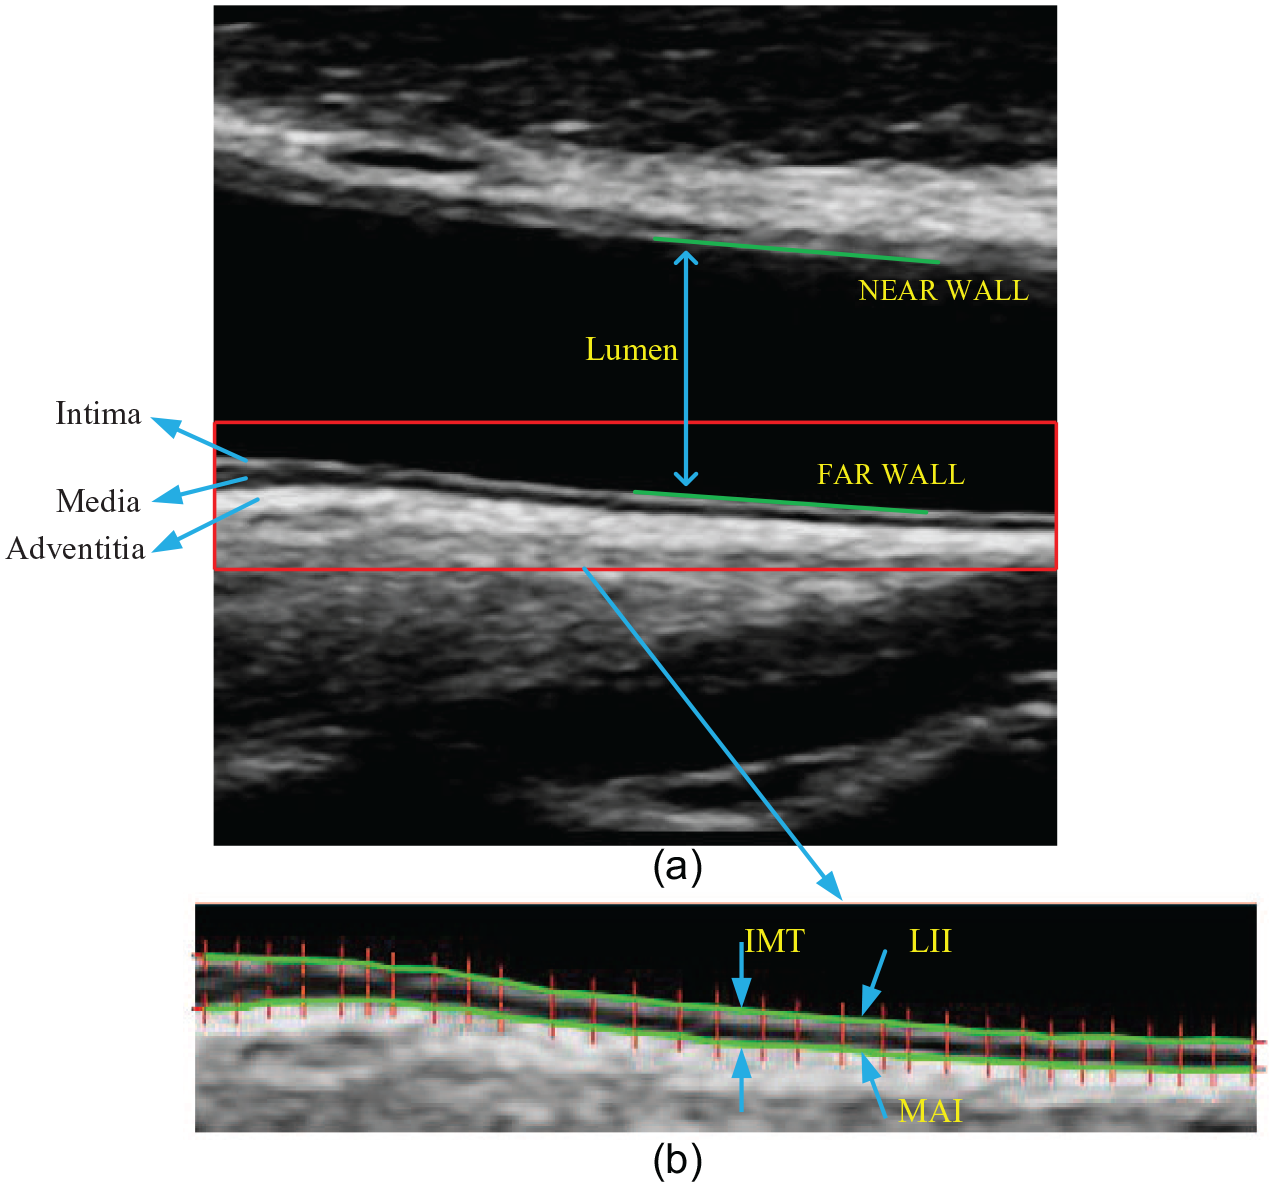
(a) A longitudinal section of the common carotid artery (CCA) in the ultrasound image. (b) The region of interest (ROI) from the carotid ultrasound image that shows two boundaries that compose the intima media complex (IMC), as delineated by an expert. The two boundaries are lumen intima interface (LII) and media adventitia interface (MAI).
A semi-automatic method based on the Hough transform and a dual snake model for IMC segmentation was carried out by Xu et al. 8 Nakagami modeling was used to estimate the IMT of the CCA by Destrempes et al. 9 Furthermore, many other techniques have been used for IMT measurement, such as the active contour models,10,11 completely automated layer extraction (CALEXia), 12 completely automated multi-resolution edge snapper (CAMES), 13 the structured random forest, 14 model-based approaches, 15 Markov random field models, 16 ant colony optimization, 17 neural networks, 18 and machine learning. 19 The objective of most of the previous studies is to obtain accurate IMT estimates. However, there is significant speckle noise in carotid ultrasound images. Severe noise can reduce the accuracy of IMT measurement. 20 Therefore, to meet the requirements of clinical application, the accuracy of IMT measurement needs to be further improved.
The purpose of this study is to develop a more effective strategy for achieving satisfactory accuracy in IMT measurement.
In recent decades, thresholding has been applied as an important tool in the field of image segmentation. Bi-level thresholding uses only one threshold value, and the pixels in the image are separated into two classes based on this threshold value. Furthermore, when the number of threshold values is greater than one, the task is called “multi-level thresholding” (MT). 21 To improve the performance of the MT technique, many works aim to obtain optimal multi-level threshold values based on the evolutionary approaches.22–26 Wind-driven optimization (WDO) 27 is a new evolutionary approach, and adaptive WDO (AWDO) is a modification of WDO. 28 Otsu’s method is an important thresholding technique, owing to its high efficiency and good performance in image segmentation. 29 Some studies have shown that the Otsu’s method combined with the WDO/AWDO algorithm (Otsu-WDO/Otsu-AWDO) can obtain more accurate results for IMT measurement as compared with other similar methods.27,28
However, Otsu-WDO and Otsu-AWDO are sensitive to speckle noise in carotid ultrasound images. Accordingly, this study proposes an improved Otsu-AWDO method for improving the robustness to speckle noise. First, a Nagare’s filter30,31 is used for reducing the speckle noise in the carotid ultrasound images. Next, an IFC method 32 is used for enhancing the blurred edges in the filtered images. Then, a new automatic method is used to extract the ROI from each carotid ultrasound image. Finally, the improved Otsu’s method, as combined with the AWDO algorithm, is used to segment the IMC for IMT measurement. The results of IMT measurements show the improved performance of the improved Otsu-AWDO as compared with other methods (see Section 3.2).
The layout of this paper is as follows. We describe the carotid ultrasound image acquisition protocol and explain the proposed method in Section 2. Section 2 also presents the performance evaluation methods and the statistical analysis methods. Section 3 reports the results of the proposed method and presents a comprehensive evaluation of the results obtained by our method and those from other methods. Section 4 provides the discussions. Finally, our conclusions are summarized in Section 5.
Materials and Methods
Materials
Image acquisition and recording
To verify the accuracy of the IMT measurements, six different datasets (dataset1, dataset2, dataset3, dataset4, dataset5, and dataset6) are used in this paper. Dataset1 consists of 12 B-mode longitudinal ultrasound images collected from the Yunnan province cancer center in Kunming, China. These images are acquired using the Esaote ultrasound machine. The size of the ultrasound images is
Methodology
Figure 2 shows the schematic diagram of proposed method, and the details of each block are described as follows.
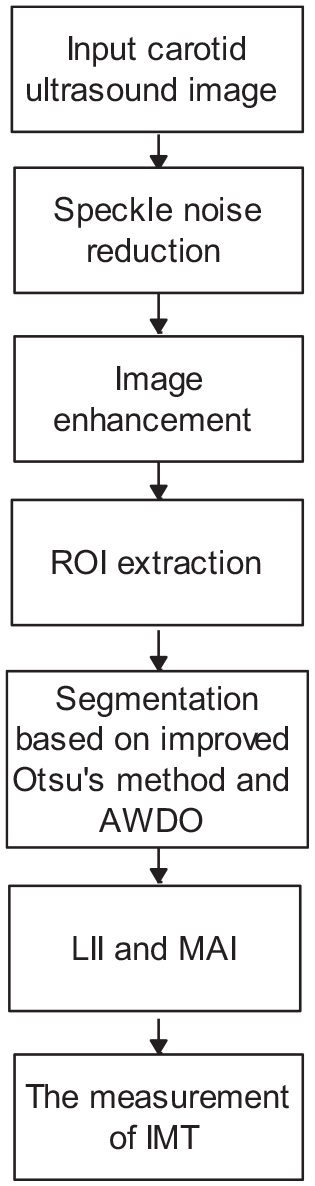
Overview of proposed method.
Image preprocessing
Speckle noise reduction
The primary cause of deterioration in the image quality of carotid ultrasound images is speckle noise.14,27 Speckle reduction is an important step in the preprocessing of the ultrasound carotid images. In this study, the Nagare’s filter30,31 is used for speckle noise reduction. This filter is a multi-directional perfect reconstruction filter bank designed with 2-D eigenfilter method, it can suppress the speckle noise via the effective utilization of the good frequency selectivity of the filters. However, almost all the despeckling filters are bound to produce distortion in the image edges. 33 Thus, this step can be omitted for ultrasound images with good image quality and low noise.
Image enhancement
To manage the blurred edges and complicated backgrounds in the filtered ultrasound carotid images, this study introduces an edge enhancement technique for the filtered images. According to the characteristics of the carotid ultrasound images, an improved fuzzy contrast (IFC) method 32 can be used to enhance the region of the IMC in blurred carotid ultrasound images. Thus, a filtered image can be mapped to the fuzzy domain:
where
where
where
Finally, the enhanced image can be obtained through inverse transformation. 32 The inverse equation is defined as follows:
Region of interest (ROI) extraction
Automatically extracting the region of interest (ROI) from original carotid ultrasound images is very important for the IMT measurement and may affect the performance of subsequent algorithms. In clinical application, the far wall is selected for ROI extraction. Based on the statistics of the IMCs of the carotid ultrasound images, the IMC in the far wall is located below the lumen, and the median gray value of the lumen is 0–5. Furthermore, repeatability and reproducibility of the IMT measurement process are of great significance to study the IMT.19,34 Plaque tends to grow into irregular shapes that are difficult to model analytically, few studies have addressed this issue.
17
Moreover, IMT without plaque remains a significant marker of an increased risk of vascular events and significantly predicts plaque occurrence.
4
For these reasons, IMT should be measured preferably on the far wall of the CCA within a region free of plaque.4,19 Assuming that
Where
Manual segmentations
In this study, two vascular doctors performed the manual measurements for the IMT. Each expert (Ex1 and Ex2) made two manual measurements for every image from six datasets spaced at least 20 days apart, implying 624 measurements. Each expert’s result was obtained by averaging the two manual measurements calculated by the expert. A ground truth (GT) was obtained by computing the average of the two experts’ results.
Automatic segmentations
A fully automatic segmentation (AS) approach for IMT measurement using improved Otsu-AWDO is presented in this study. Additional details of the improved Otsu-AWDO are described as follows.
The Otsu’s method and the traditional 2D Otsu’ method
The Otsu’s method
29
shows good performance when the histogram of the processed image has two distinct peaks, one belonging to the foreground, and the other belonging to the background.
36
Scholars from different fields have been devoted to improving this method, and have proposed many algorithms.37,38 However, when the images contain significant noise, these algorithms cannot obtain good segmentation results. To overcome the shortcomings of the 1D Otsu’s method, a 2D Otsu’s method has been proposed, with a 2D histogram.
39
As compared with the original Otsu’s method, the 2D Otsu’s method has a stronger robustness to noise. This method is introduced briefly as follows. The size of the source image
The gray level of point
In above formula,
The class mean vectors are defined as:
The total mean vector is obtained by:
Based on Equations (9) to (14), Equation (14) is rewritten as:
The definition of between-class variance is given in the following:
The trace of
The optimal threshold vector
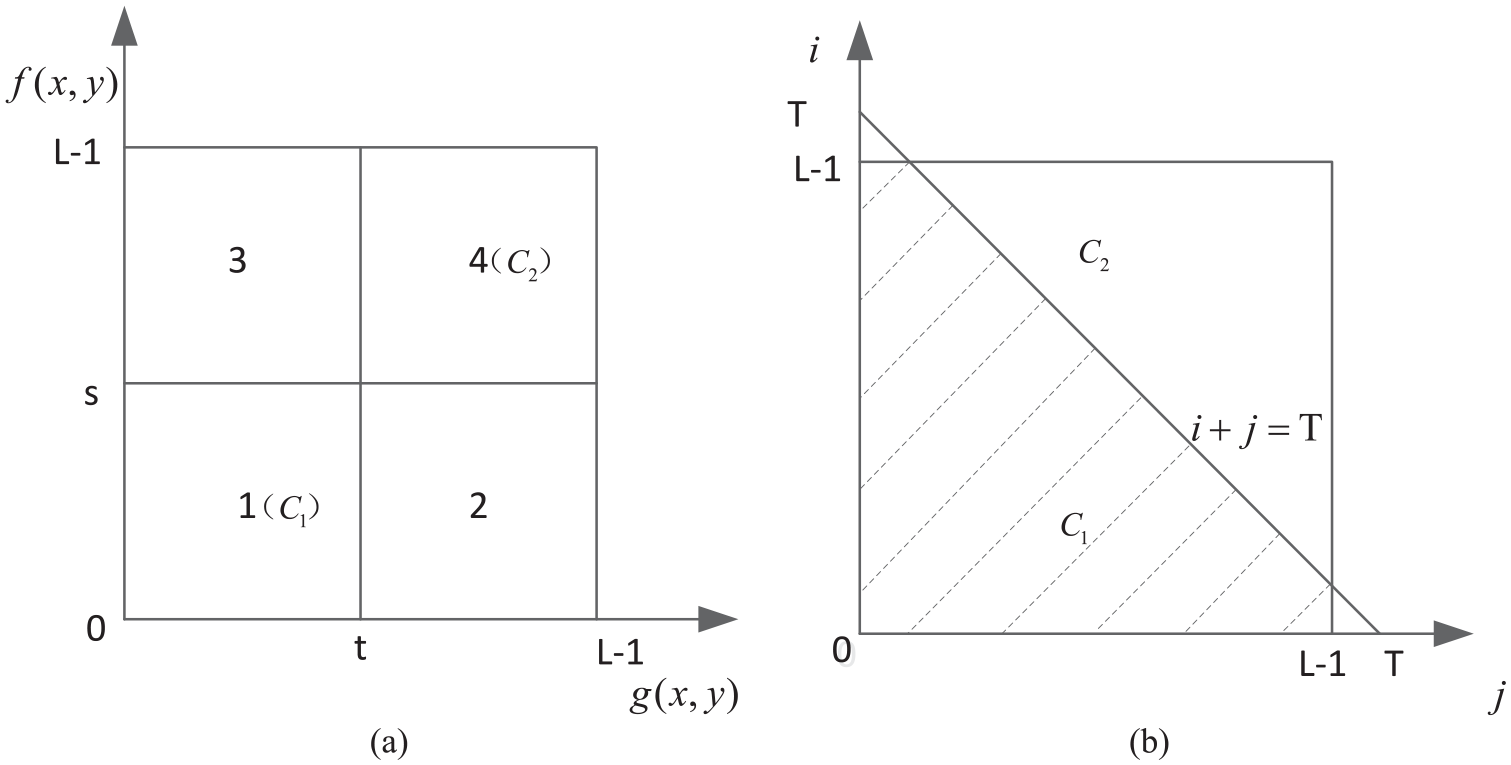
(a) The regional division of the 2D histogram. (b) Division of 2-D histogram by line thresholding.
Improved Otsu’s method
In the traditional 2D Otsu’s method, the gray level of both the original image and the corresponding averaged image can be used to build the 2D histogram. Put another way, this method uses an average filtering algorithm to suppress noise. However, the ultrasound images contain residual speckle noise after the step of the speckle noise reduction. The average filtering algorithm shows good performance for suppressing Gaussian noise, but it shows poor performance for reducing speckle noise. Thus, a median filtering algorithm is used to reduce the speckle noise.
40
Mathematically, for an input image
He et al. 42 established a line intercept histogram based on a traditional 2D histogram. This method has good anti-noise properties and robust performance. Inspired by the He’s method, this study uses the gray levels of both the original image and the corresponding median-average image to build the 2D histogram, and a line intercept histogram is established based on the 2D histogram. The description of this method is as follows.
The images used in this study are 8-bit grayscale (256-level grayscale) images. Assuming the number of the gray levels of the original images is
where
where
The objective of IMC segmentation is to obtain the LII and MAI using an MT segmentation method. In this study, the pixels in the image need to be separated into four classes, based on three threshold values. Thus, the number of threshold levels is set as three.
Adaptive wind driven optimization (AWDO)
WDO is a new high efficiency evolutionary approach. 43 There are two main mathematical equations in the WDO algorithm. One is a velocity update equation, and the other is a position update equation. The velocity update equation is given as follows:
where
where
where
Using WDO for MT image segmentation can produce more effective results than many other methods.
44
However, the four parameters
Improved Otsu-AWDO for IMC segmentation
AWDO has proven to be more effective for MT problems than other similar methods.28,45 In this study, the improved Otsu-AWDO is applied to obtain the LII and MAI. Figure 4 shows the step-by-step process of the improved Otsu-AWDO for IMC segmentation.
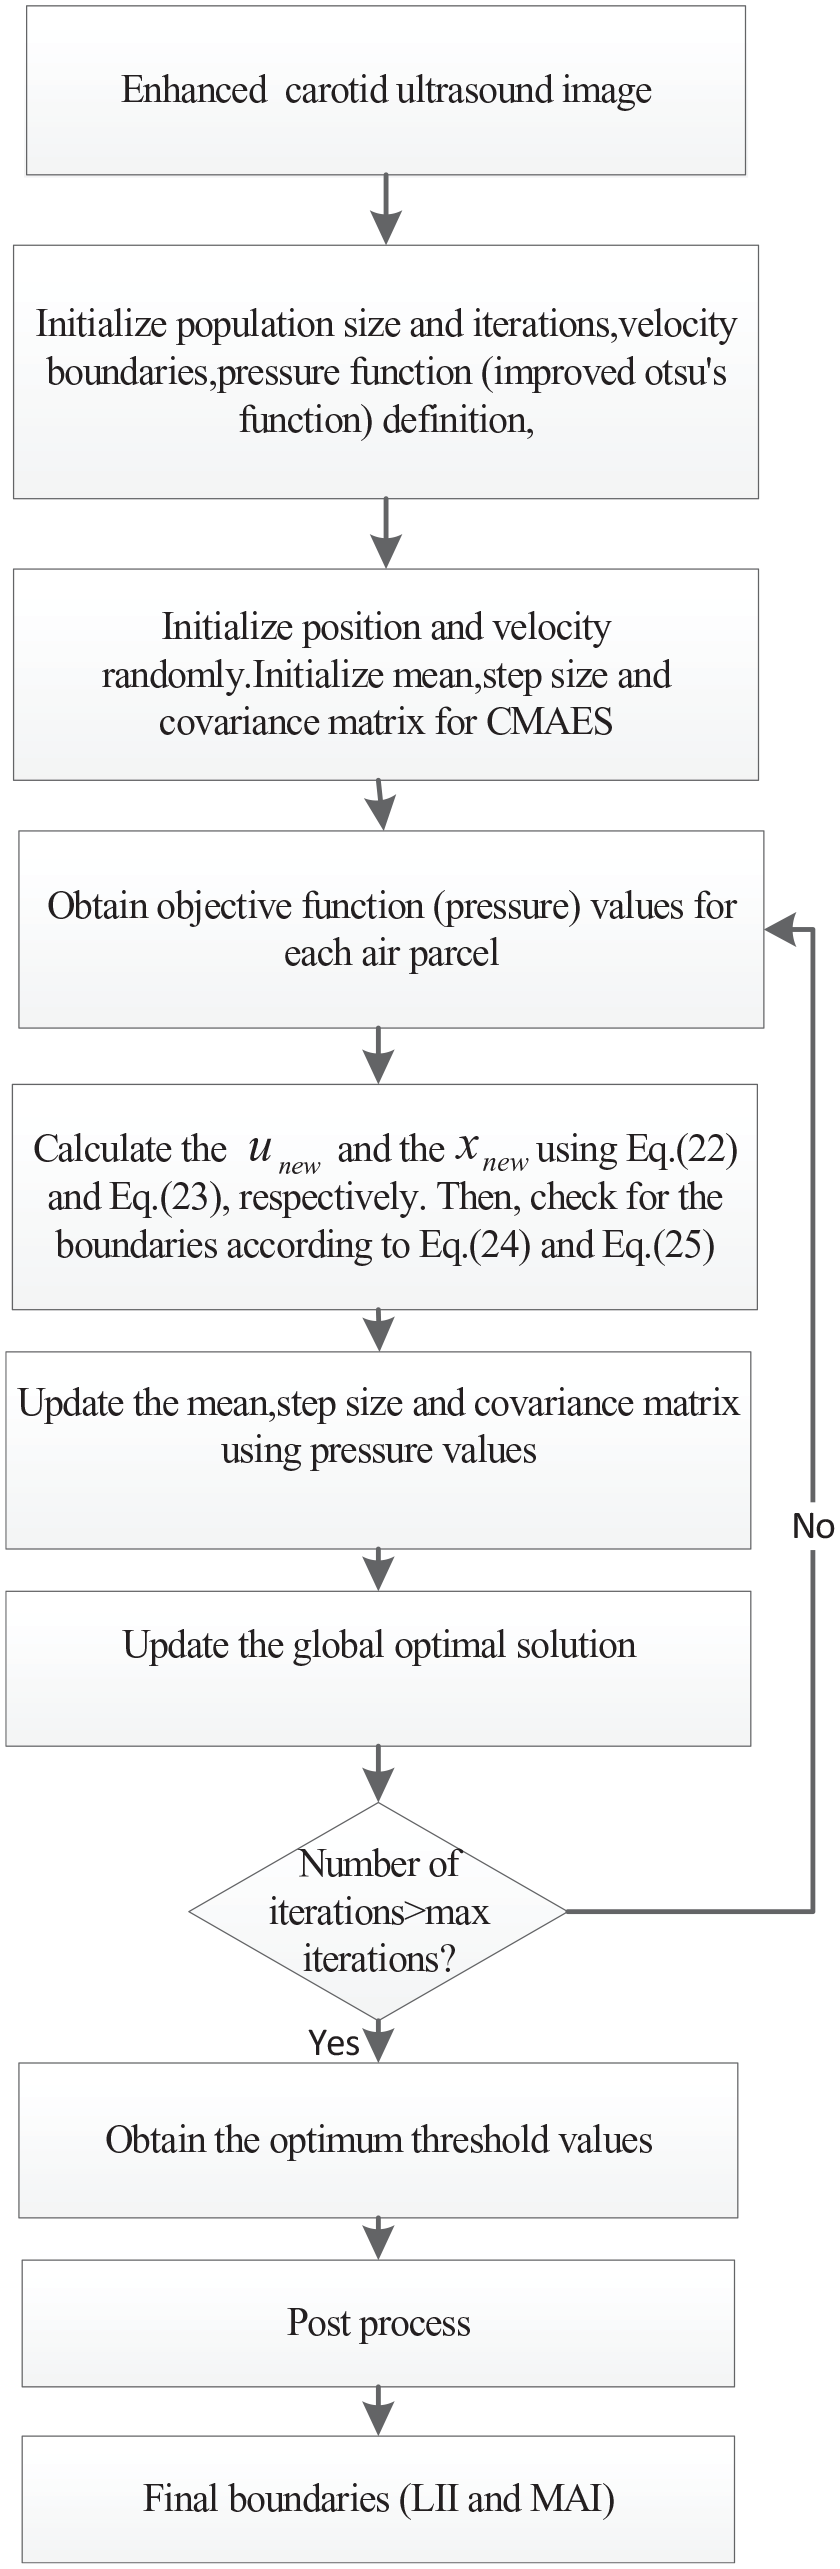
Flowchart of the improved Otsu-AWDO for IMC segmentation.
In step 4, the improved Otsu’s function is used as in Equation (20), that is, to obtain pressure function values for each air parcel. Based on the air pressure values, all air particles are sorted in descending order.
In step 7, to obtain a global optimal solution (global maximum pressure value), we compare each new solution with a corresponding previous solution. If the new solution is better than the previous solution, it is recorded; otherwise, the new solution is discarded, and the previous solution is preserved as it is.
In the penultimate step, after obtaining the three optimal values, the gray levels in the image can be divided into the four gray levels. Then, the LII and MAI can be determined from the demarcation lines of different gray levels. However, owing to the interference of noise in the carotid ultrasound image, the LII and MAI may be detected incorrectly. According to the characteristics of the IMC, the range of IMT without plaque is 0.3–1.4 mm. Based on Equation (6), the range of
Figure 5 shows the process of the IMC segmentation. Figure 5(a) shows an example of an original image. The corresponding filtered result, enhanced result, ROI image, and segmentation result are presented in Figure 5(b) to (e).
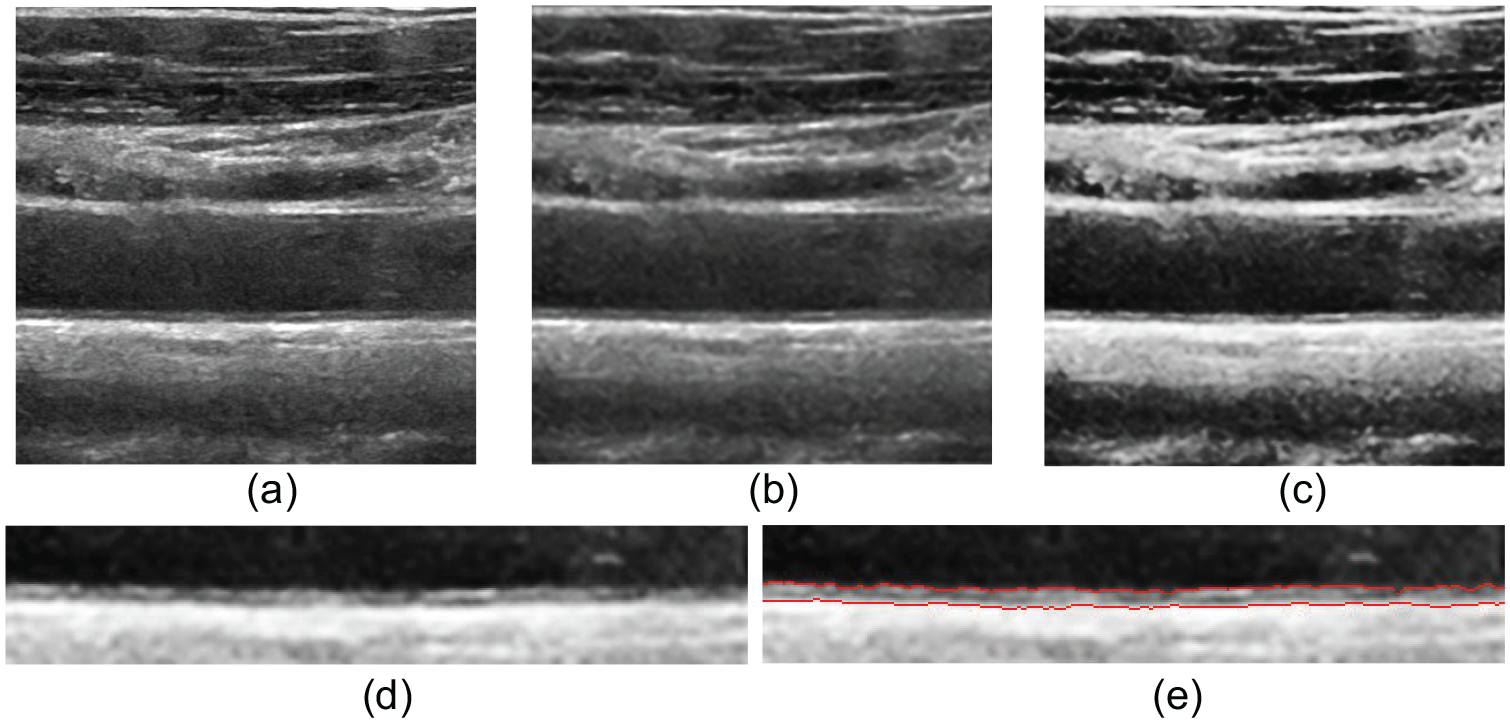
The process of the IMC segmentation. (a) Original image. (b) Filtered image using Nagare’s filter. (c) Enhanced image using IFC method. (d) The ROI of the carotid ultrasound image. (e) Segmentation result using improved Otsu-AWDO.
IMT measurement and performance evaluation methods
IMT measurement
In clinical application, the mean absolute distance (MAD) is the main measurement metric for the IMT. 47
With regard to the MAD,
where
Performance evaluation of automated segmentation methods
The performance evaluation metrics of the AS methods are calculated as follows.
The Pearson R-correlation coefficient 16 and the absolute error 18 of the AS measurements with GT data are calculated as follows:
where
where
where
Statistical analysis
A Bland–Altman’s plot,
48
regression analysis plot,
14
and boxplot11,14 are used for the statistical analysis of the IMT measurements. Other statistical data, such as the average
Results
Performance of manual segmentations
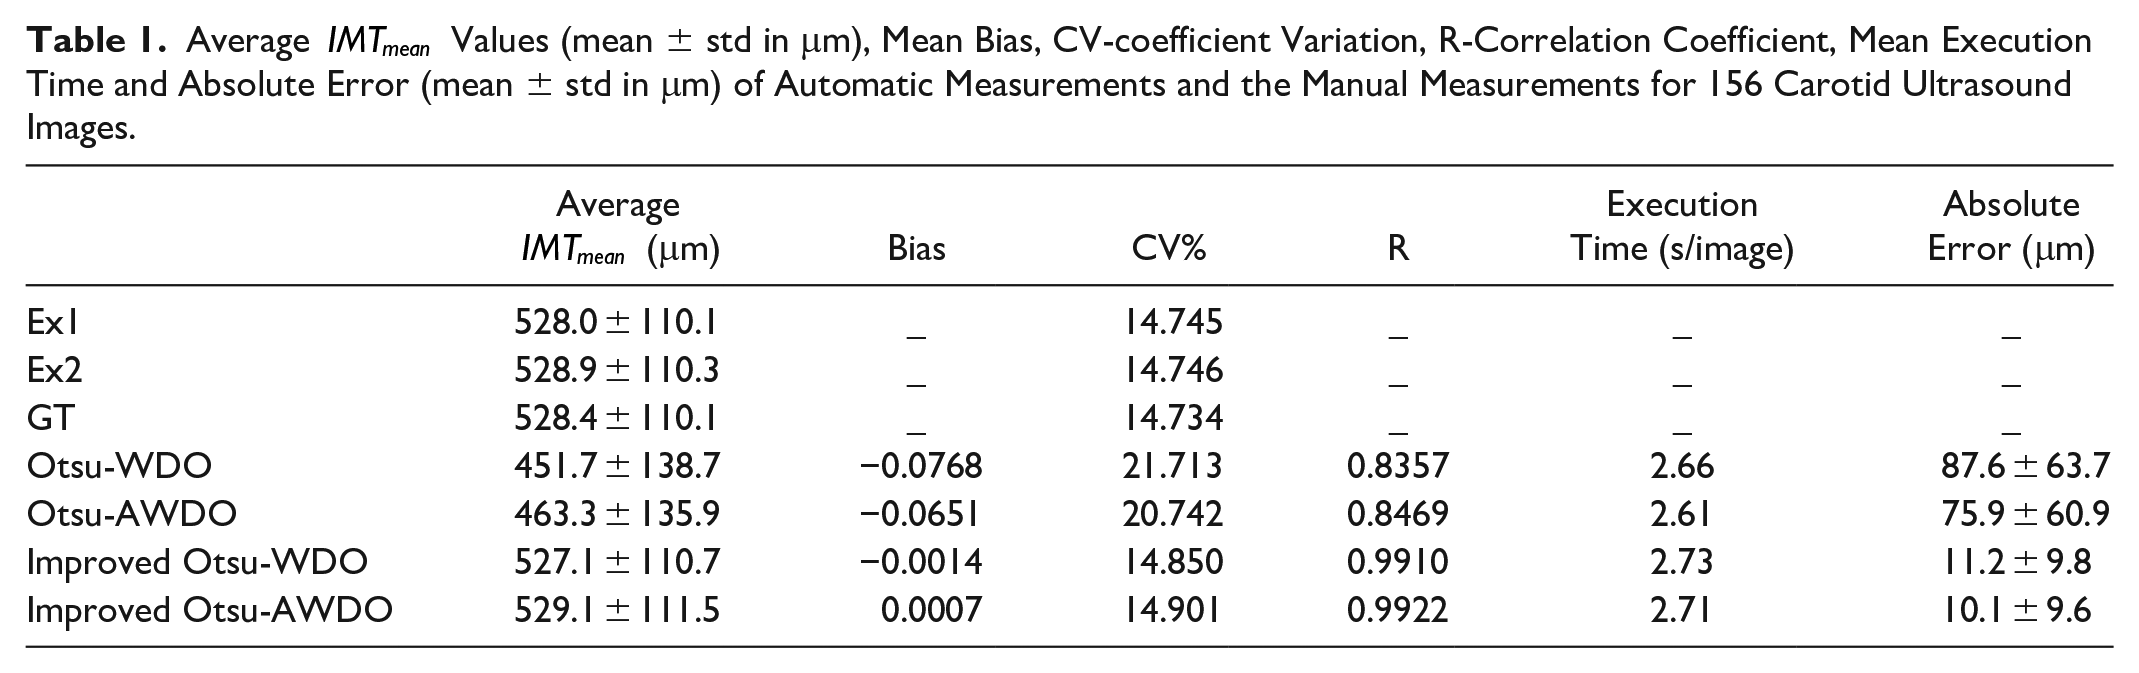
The two experts’ results (Ex1-Ex2) are shown in Table 1. The average
Average
Performance of automatic segmentations
To reflect the superiority of the proposed method, performance tests for the proposed algorithm are implemented using 156 carotid ultrasound images. Furthermore, other algorithms such as Otsu-WDO,
27
Otsu-AWDO,
28
and the improved Otsu’s method proposed by this study as combined with WDO (improved Otsu-WDO) are compared with the proposed algorithm. All the steps of preprocessing (such as speckle noise reduction, image enhancement, and ROI extraction) are identical for these algorithms. According to the characteristics of the carotid ultrasound images in six datasets used in this study, the upper limit of the gray level in the line intercept histogram is
Figure 6 shows the segmentation results of different methods for a carotid ultrasound sample image. Figures 6(a) to (d) show the manual delineations performed by the two experts. The Otsu-WDO and Otsu-AWDO methods appeared to result in distorted edges (see Figures 6(e) and (f)). The improved Otsu-WDO method and proposed algorithm produced good edge detection (see Figures 6(g) and (h)). Moreover, Figure 7 shows some other examples of segmentation results.
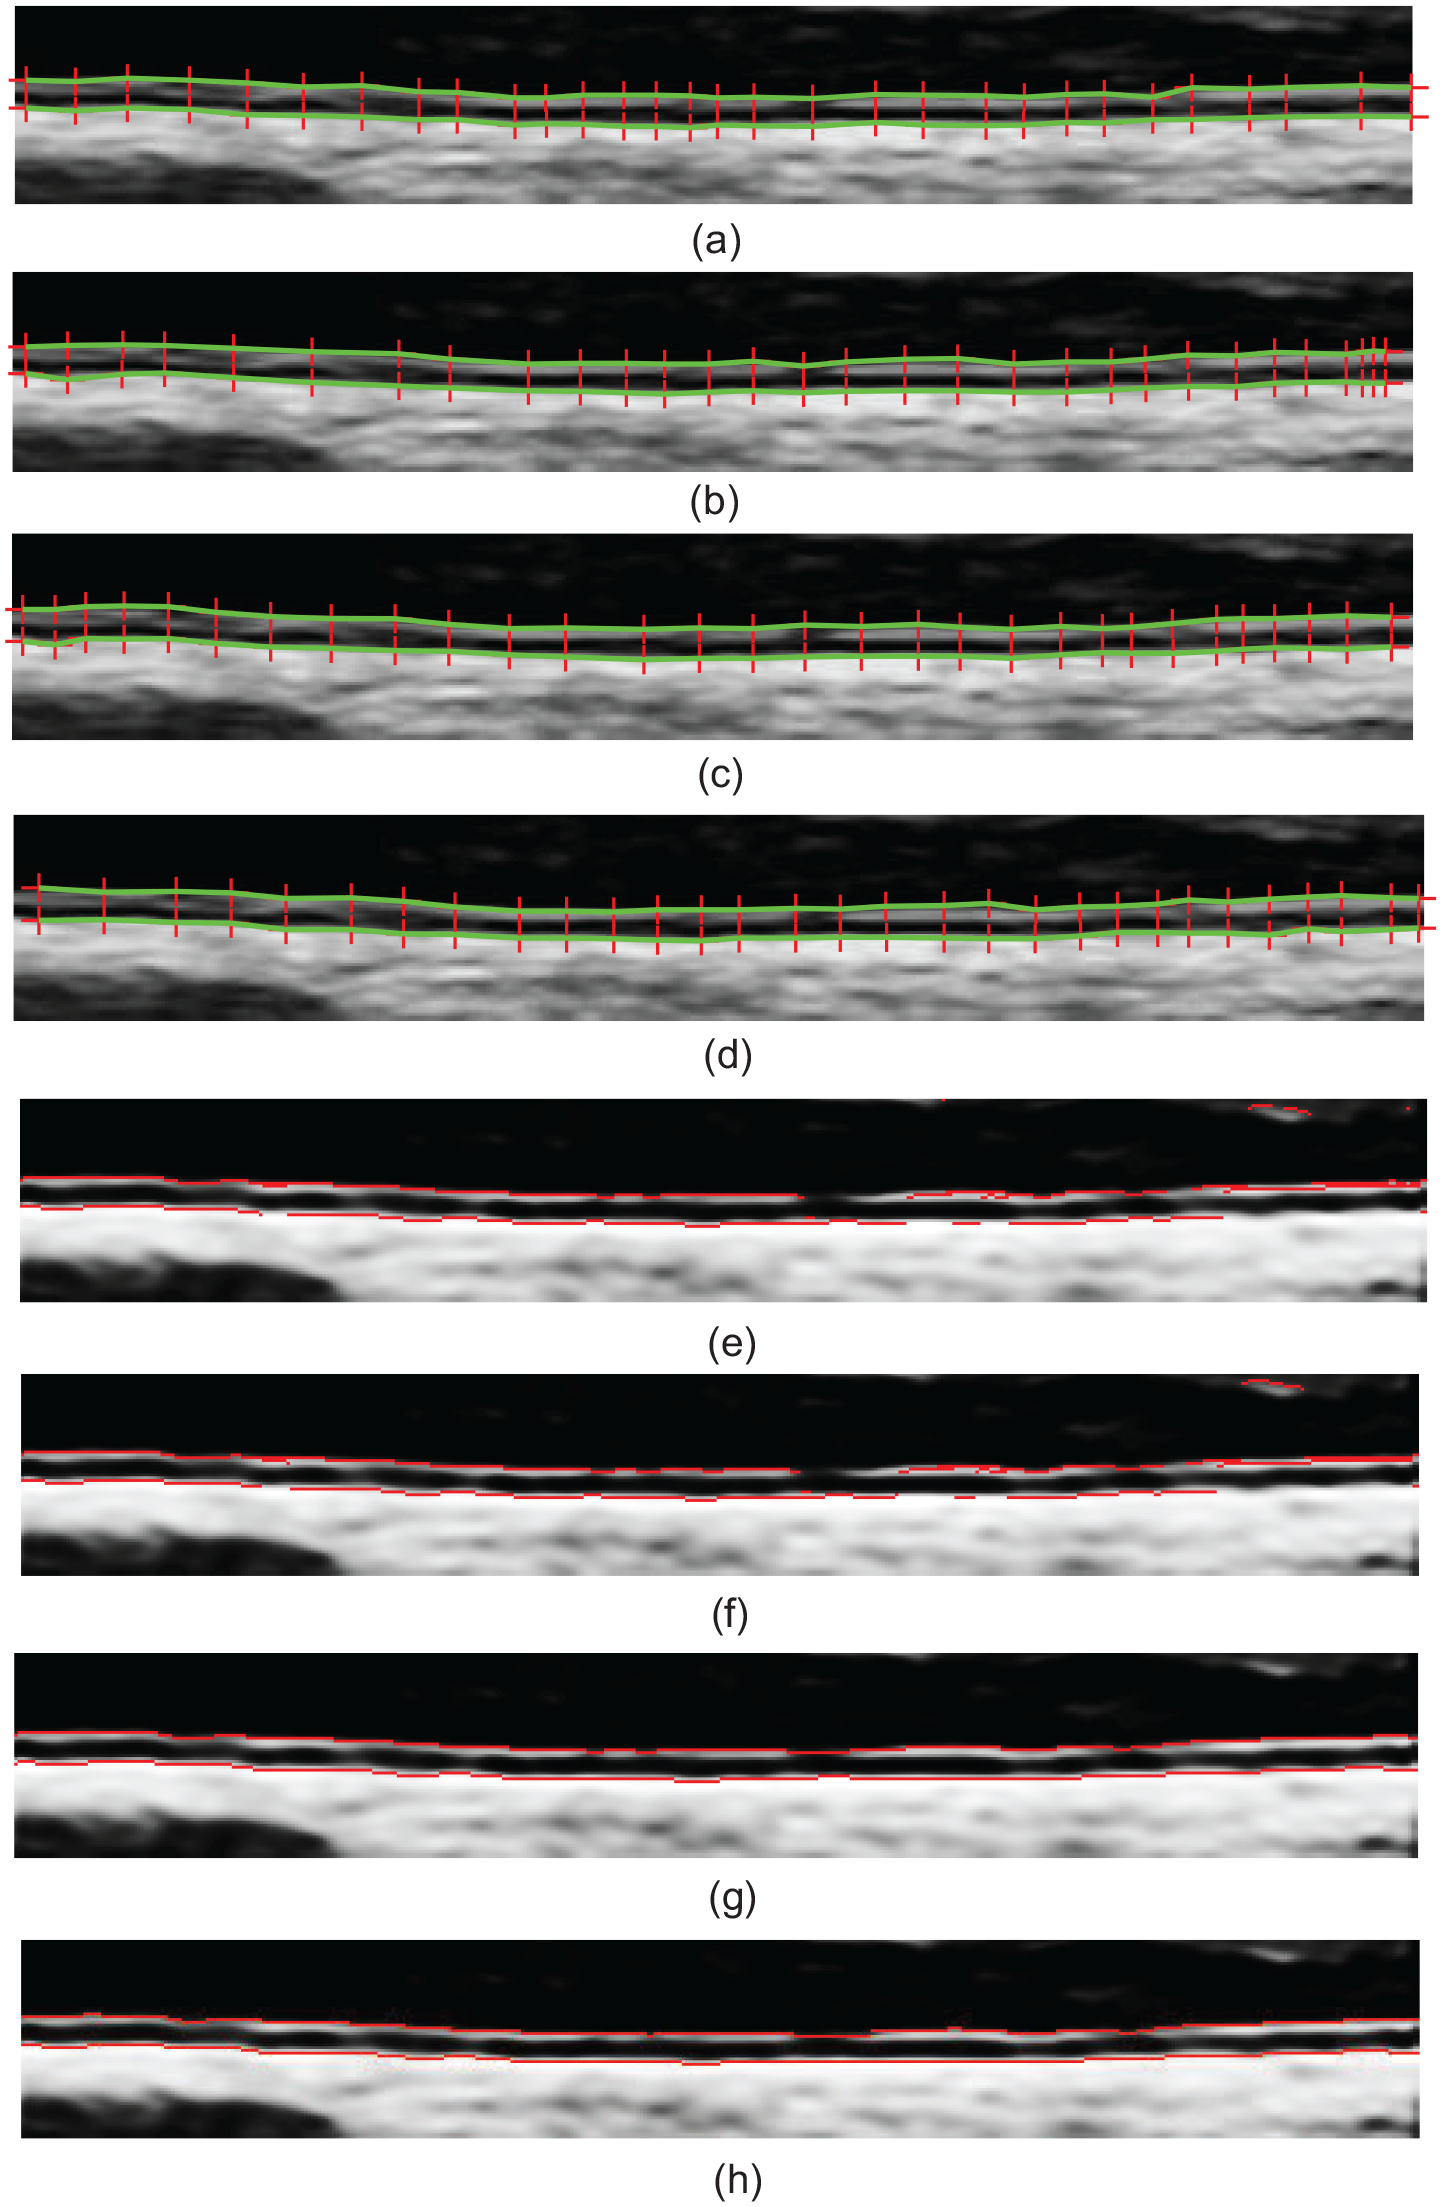
Original carotid ultrasound sample image with manual delineations from two experts and automated delineations using Otsu-WDO, Otsu-AWDO, improved Otsu-WDO, and improved Otsu-AWDO. (a) The first manual delineation from Ex1. (b) The second manual delineation from Ex1. (c) The first manual delineation from Ex2. (d) The second manual delineation from Ex2. (e) Otsu-WDO. (f) Otsu-AWDO. (g) Improved Otsu-WDO. (h) Improved Otsu-AWDO.
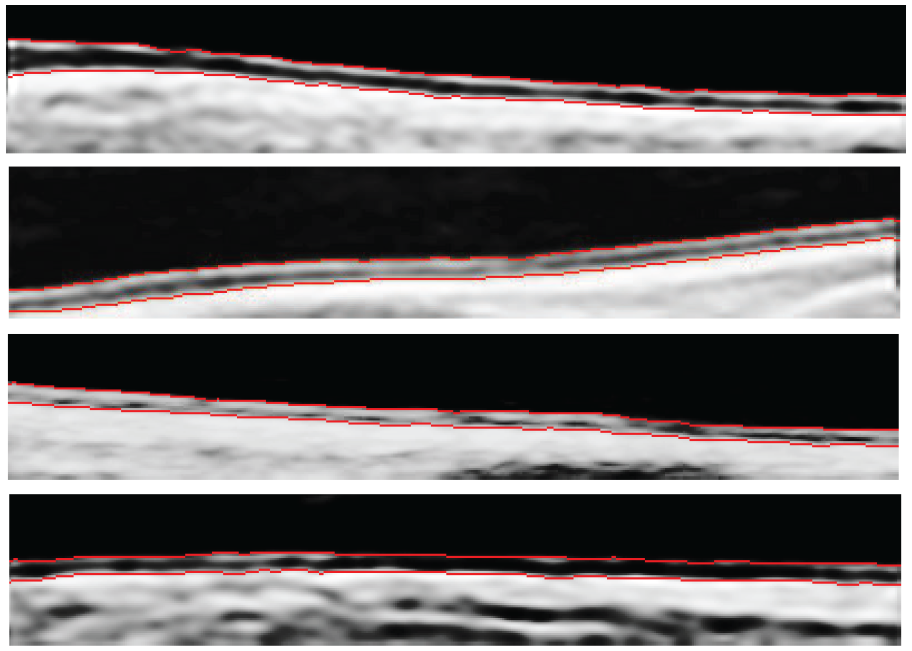
Different examples of the segmentation results using proposed method.
Table 1 lists the average
For the purpose of validating the accuracy of the automatic measurement, we need to obtain the average LII/MAI tracings for each image, and to compute the bias between the automatically and manually measured
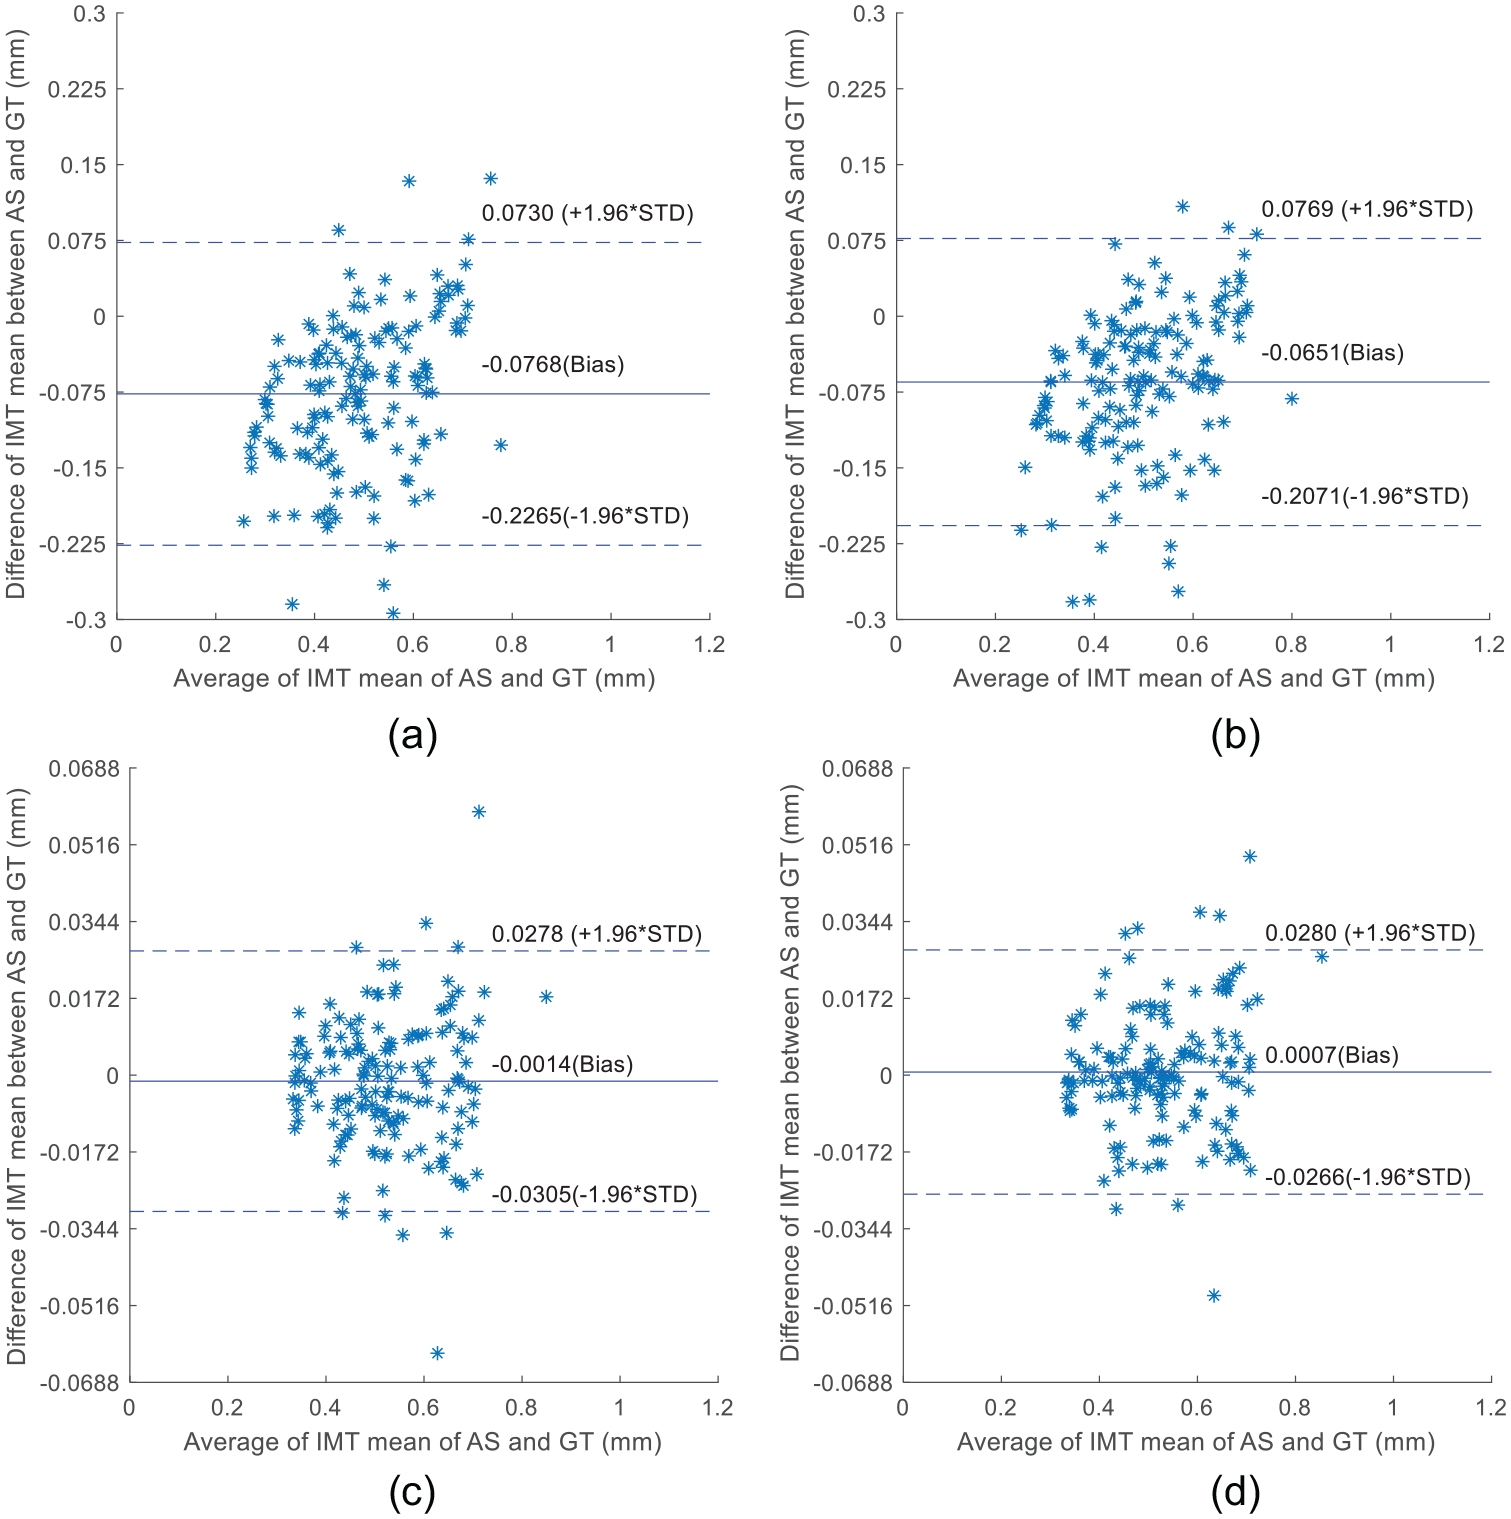
Bland–Altman plots comparing Otsu-WDO, Otsu-AWDO, improved Otsu-WDO, and improved Otsu-AWDO’s measurements with GT measurements (AS corresponding to the GT). (a) Otsu-WDO. (b) Otsu-AWDO. (c) Improved Otsu-WDO. (d) Improved Otsu-AWDO.
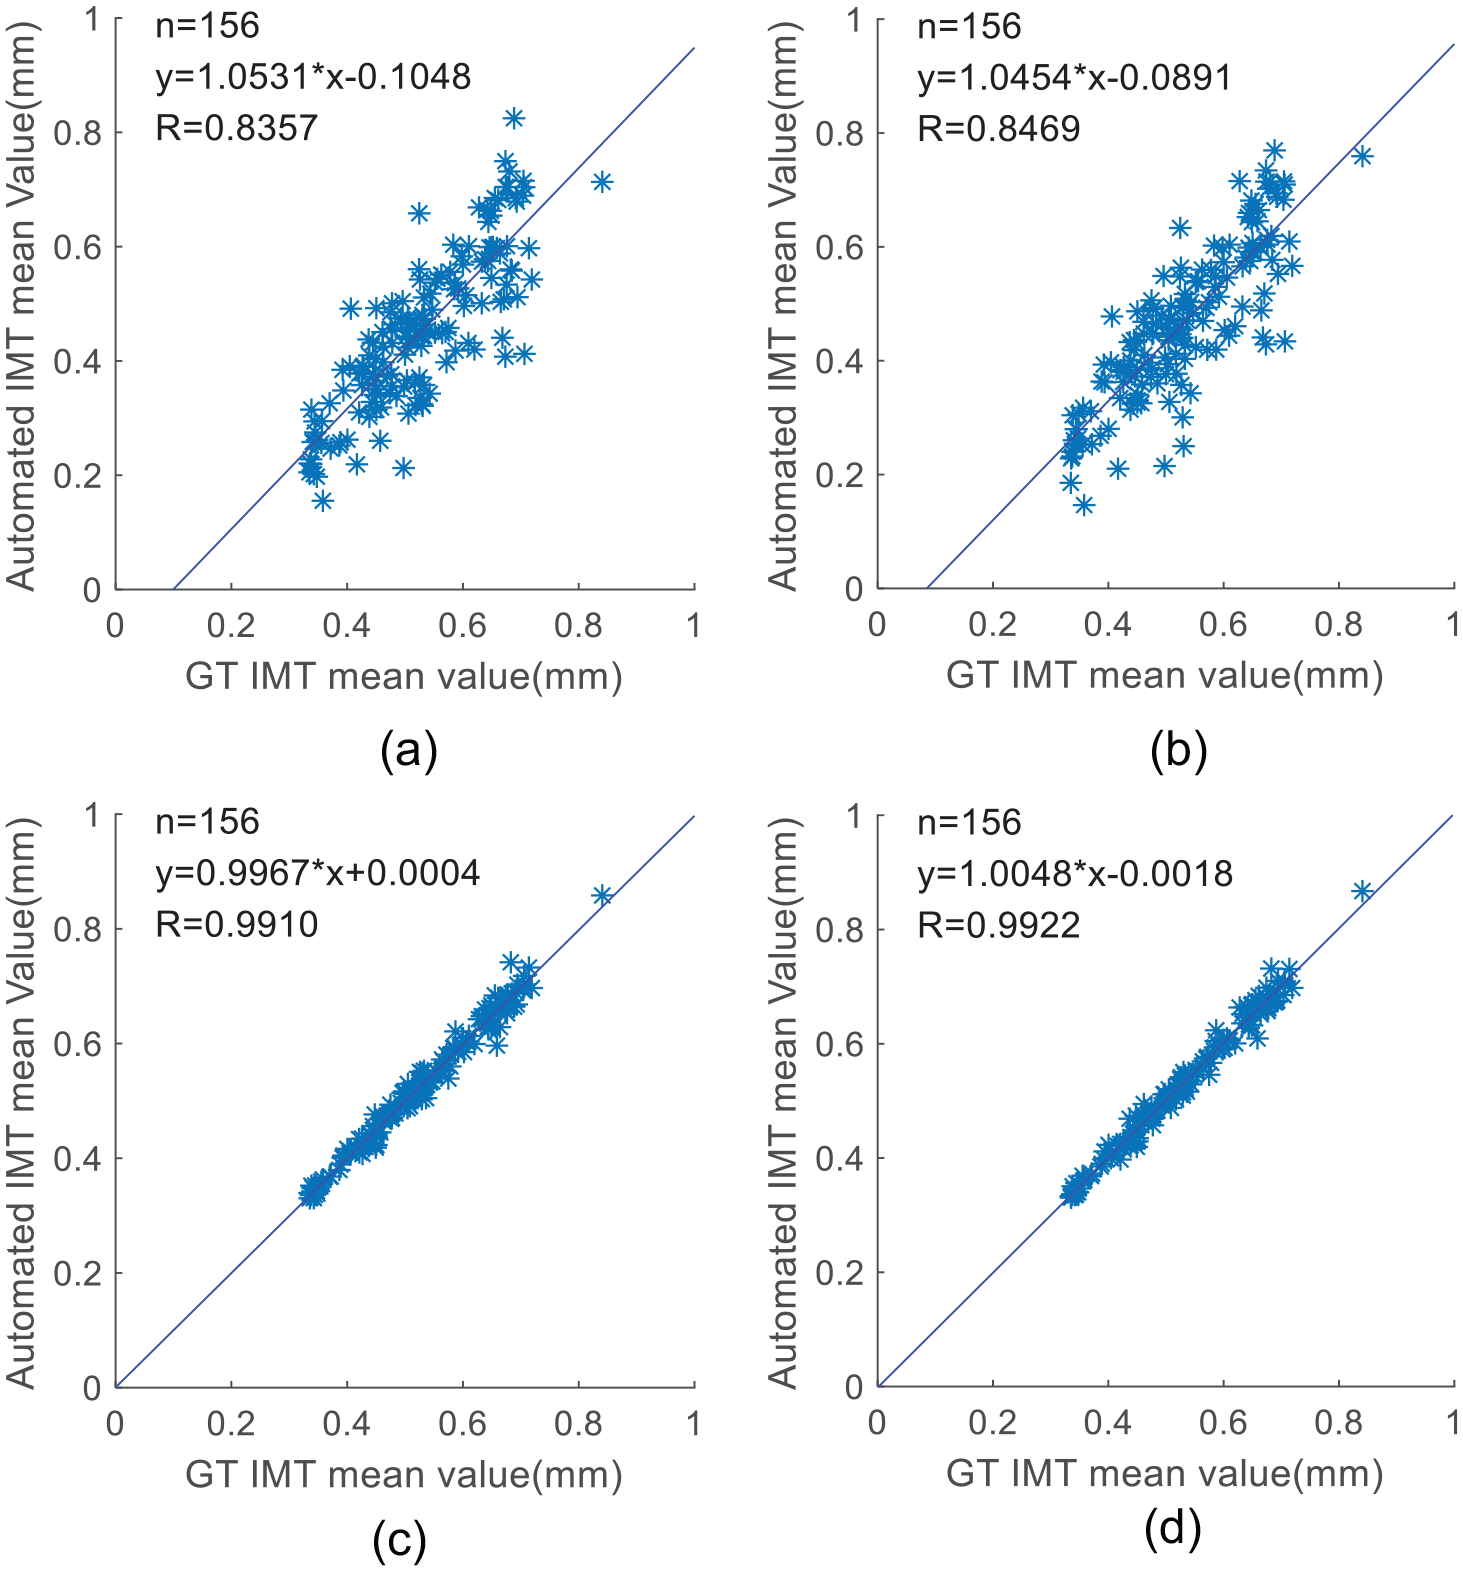
Regression analysis plots comparing Otsu-WDO, Otsu-AWDO, improved Otsu-WDO, and improved Otsu-AWDO’s measurements with GT measurements. (a) Otsu-WDO. (b) Otsu-AWDO. (c) Improved Otsu-WDO. (d) Improved Otsu-AWDO.
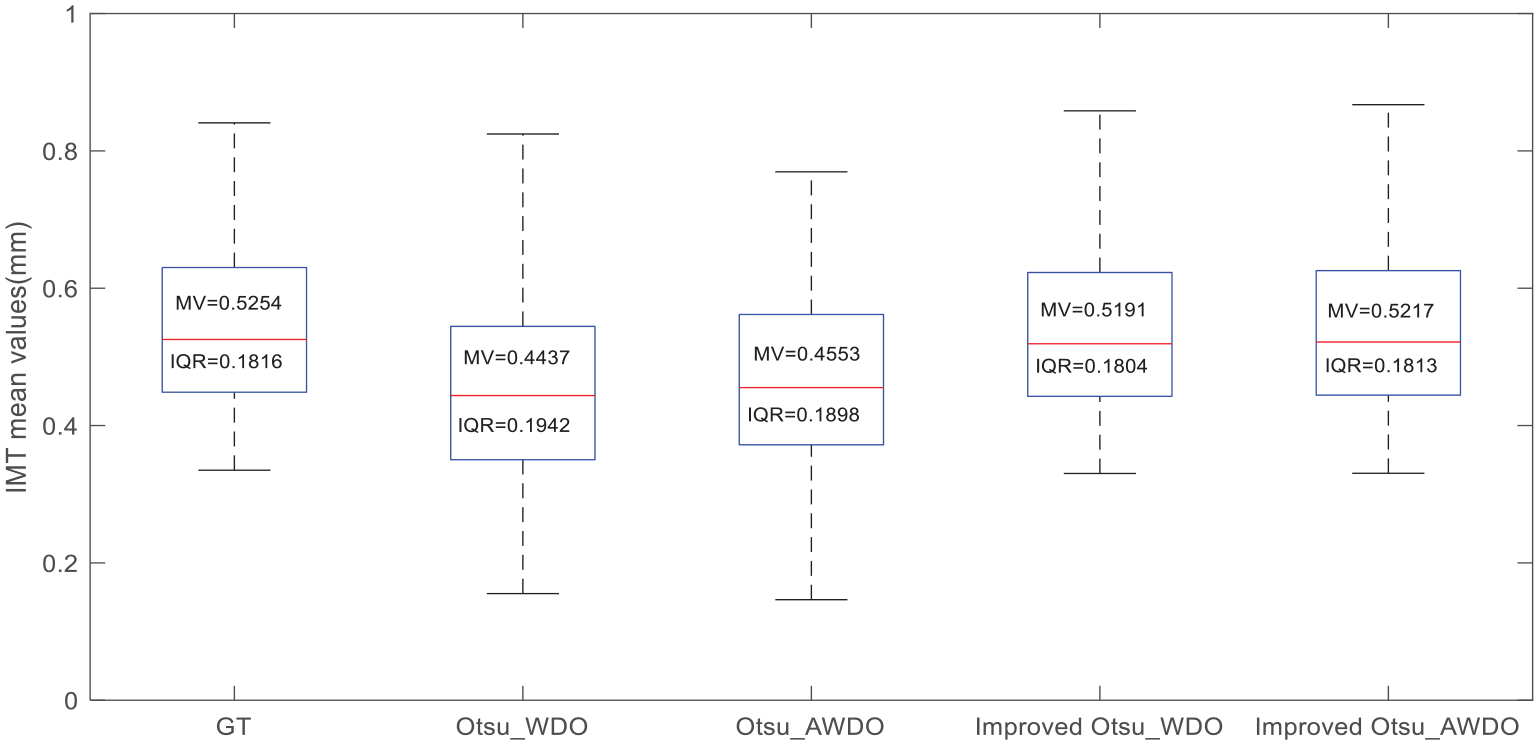
Box plots of the
To quantitatively evaluate the complexity of the four algorithms, we assumed that the four algorithms performed a complete procedure including four steps (speckle noise reduction, image enhancement, ROI extraction, IMC segmentation). Table 1 shows the average execution times for the four algorithms. The average execution times of improved Otsu-AWDO (2.71 s/image), improved Otsu-WDO (2.73 s/image), Otsu-AWDO (2.61 s/image), and Otsu-WDO (2.66 s/image) were roughly equivalent. Table 1 presents the absolute error for the IMT in the automatic measurements and manual measurements for the 156 carotid ultrasound images. It can be seen that the mean absolute error of improved Otsu-AWDO (10.1 ± 9.6 μm) is lower than that of Otsu-WDO (87.6 ± 63.7 μm), Otsu-AWDO (75.9 ± 60.9 μm), and improved Otsu-WDO (11.2 ± 9.8 μm).
Discussions
The objective of this study is to propose a fully automatic technique for IMT measurement in carotid ultrasound images. To reflect the superiority of the proposed approach, the proposed approach was compared with other similar existing approaches, such as Otsu-WDO and Otsu-AWDO. Furthermore, to further validate the superiority of improved Otsu-AWDO, an improved Otsu’s method combined with WDO (improved Otsu-WDO) was also used for comparison with the proposed approach. Figure 6 shows the segmentation results from the different methods. The results of Otsu-WDO and Otsu-AWDO include distorted edges (see Figures 6(e) and (f)), as they are sensitive to the speckle noise. In contrast, the results of improved Otsu-WDO and improved Otsu-AWDO show good performances (see Figure 6(g) and (h)), owing to their strong robustness to noise. The proposed approach can obtain good performance in different cases (see Figures 5(e), 6(h), and 7). This happens because the proposed method has strong robustness to the orientation and appearance of the CCA in the ultrasound images (i.e., slope and curvature).
To objectively evaluate the accuracy of the IMT measurement, several objective evaluation metrics are used to evaluate the different methods. Figure 8 shows the Bland–Altman plots
48
of the average versus the difference in the
Many studies regarding IMT measurements have been reported in recent years. An advanced method named as CALEXia was proposed by Molinari et al. 12 in 2010. In 2012, Xu et al. 8 proposed a semi-automatic technique that used a Hough transform and a dual snake model to measure the IMT. In this work, a leak of weak edges could be avoided by using a robust initialization, and the sub-accuracy could be achieved with a search of the local minimum in a continuous space. 8 An automatic method for segmenting the IMC in carotid ultrasound images using active contours was proposed by Petroudi et al. 10 in the same year. Furthermore, an automatic approach named as CAMES was proposed by Filippo Molinari et al. 13 in 2012. In 2014, Menchón-Lara et al. 18 used a neural network method to estimate the IMT. In 2015, Bastida-Jumilla et al. 11 used an automated approach to measure the IMT based on a frequency-domain implementation of the active contours, providing higher efficiency than semi-automatic methods. In the same year, Lu Xiao et al. 16 proposed an automatic method for finding the LII and MAI based on Markov random field models. Menchón‑Lara et al. 19 proposed an automatic method in 2015 that used a machine learning technique and a statistical pattern recognition method to measure the IMT. In 2016, Li H et al. 17 used a curvelet-guided ant colony optimization strategy for IMT measurement, and showed good robustness to noise. In 2018, a fast automatic IMC segmentation technique based on a structured random forest was proposed by Nagaraj et al. 14
Table 2 summarizes the results from the proposed method and the previous methods. N in Table 2 represents the number of images used for IMT measurements. Although the R value of Li’s method (0.9920) is close to that of our method (0.9922) and the R values of this two methods are substantially higher than other methods, the IMT error of the proposed method (10.10 ± 9.60 μm) is significantly lower than that of Li’s method (41.00 ± 36.00 μm), and is the lowest of all of the methods.
The Comparison Results Between Previous Methods and Proposed Method (All data of Previous Methods Come From the Published Paper).
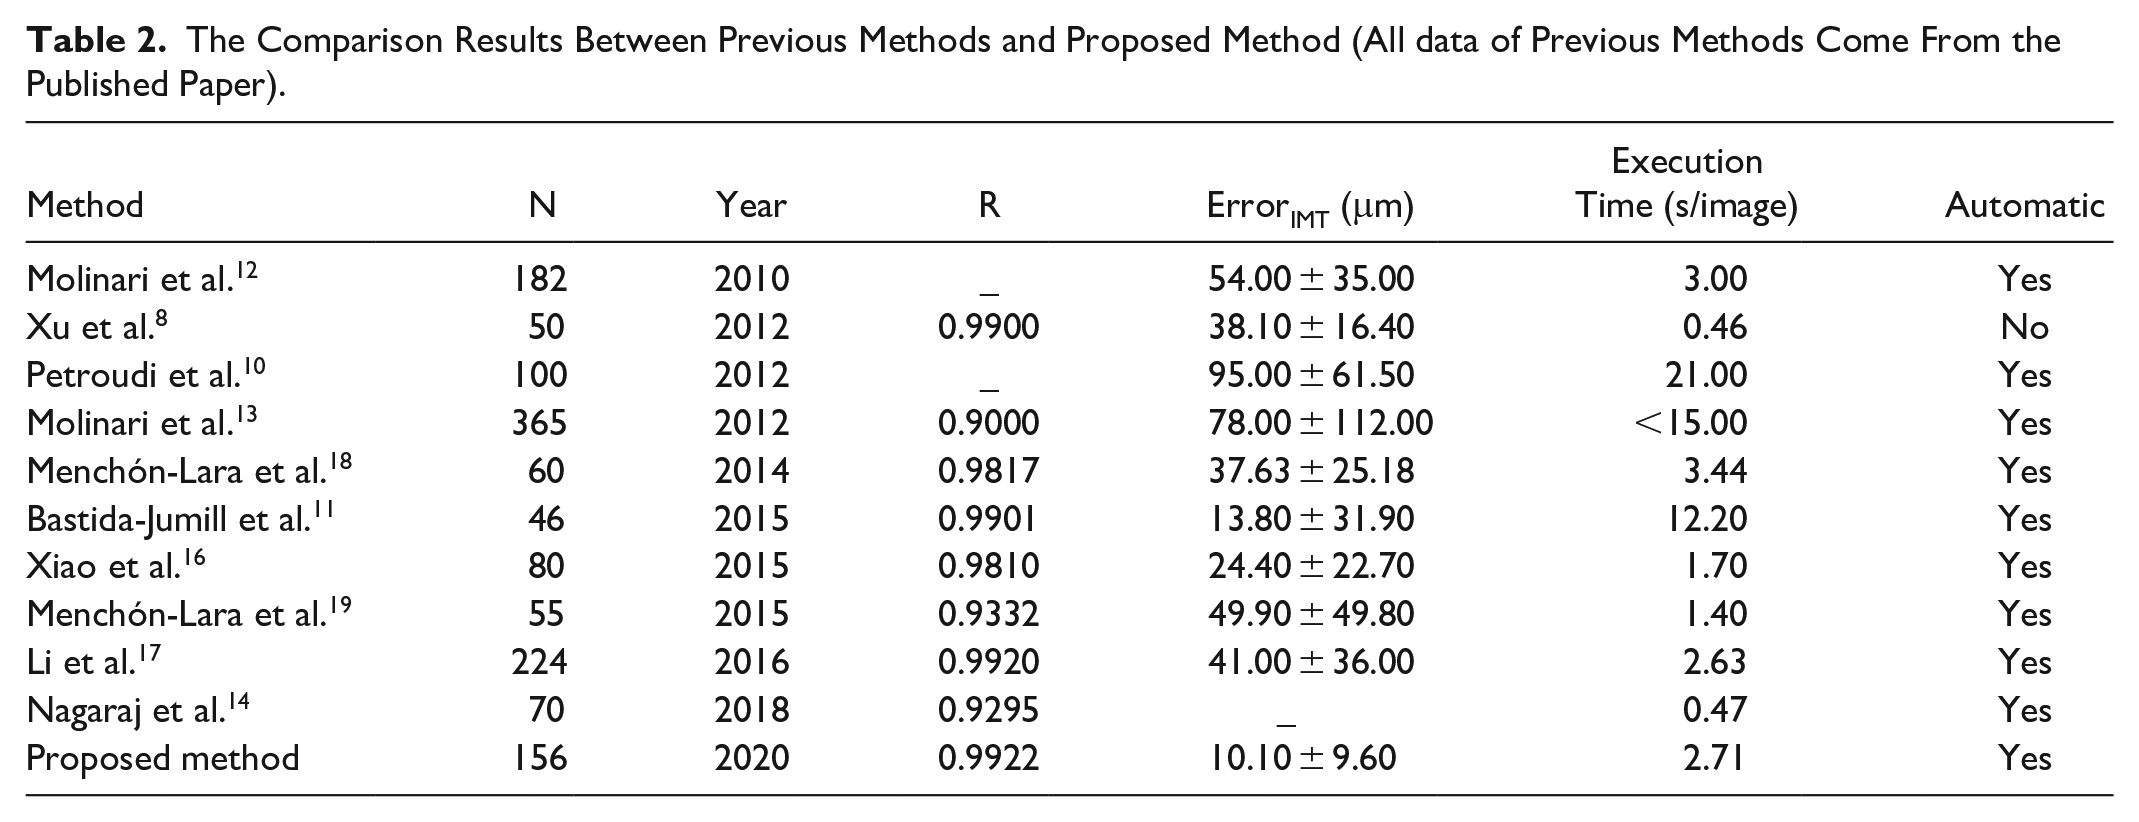
The proposed method still has limitations. First, the average execution time of the entire procedure (including speckle noise reduction, image enhancement, automatic ROI extraction, and IMC segmentation) was 2.71 s/image, which was longer than some of the previous automatic methods (see Table 2). The average time cost of the speckle noise reduction procedure (Nagare’s filter) was 1.98 s/image. Thus, we need to reduce the complexity of the algorithm, by finding a higher quality and more efficient despeckling filter. Moreover, in the step of IMC segmentation, a median filtering algorithm is used to overcome the sensitivity of the traditional 2D Otsu’s method to the speckle noise in ultrasound images. To further improve the performance of the IMC segmentation method without increasing the time complexity, future work will develop a new filter to replace the median filtering algorithm in the improved Otsu-AWDO. Moreover, in the IFC method, we use
Another possible limitation concerns the limited number of tested carotid ultrasound images in this work. Only six datasets of carotid ultrasound images were available for validating the performance of the proposed method. In future research, additional carotid ultrasound images from different ultrasound machines should be tested to further validate the clinical application value of the proposed method.
Conclusions
In the present study, an improved Otsu-AWDO method is proposed for estimating the IMT from carotid ultrasound images. In a step of preprocessing, a Nagare’s filter is used to address the noise in the carotid ultrasound images, and then the IFC method is used to enhance the blurred edges in the filtered images. According to the structural characteristics of the CCA in each ultrasound image, we use a new automatic method to extract the ROI from each carotid ultrasound image. The main stage of the proposed method is a segmentation stage. We propose an improved Otsu’s method for improving the robustness to speckle noise (to thereby improve the robustness of the Otsu-AWDO). First, we build a 2D histogram, based on an image and the corresponding median-average image. Then, we establish a line intercept histogram based on the 2D histogram. Finally, the best intercept threshold from the histogram is obtained based on the Otsu criterion. The improved Otsu’s method combined with the AWDO (improved Otsu-AWDO) is used to segment the IMC.
The proposed technique was tested using six datasets of 156 carotid ultrasound images. The IMT measurements using the proposed method were compared with values obtained from other similar methods. Quantitative metrics such as the absolute error, R-correlation coefficient, mean bias, and average
Footnotes
Declaration of Conflicting Interests
The author(s) declared no potential conflicts of interest with respect to the research, authorship, and/or publication of this article.
Funding
The author(s) disclosed receipt of the following financial support for the research, authorship, and/or publication of this article: This work was supported by the Grants (81771928 and 61761046) from the National Natural Science Foundation of China.
