
Abstract
The intima media thickness (IMT) of the common carotid artery (CCA) is helpful for the diagnosis of atherosclerosis. The CCA ultrasound image segmentation methods can be used for the IMT measurements. However, the speckle noise and the blurred edges can reduce the accuracy of the IMT measurements. To address this issue, a preprocessing method based on non-subsampled shearlet transform (NSST) and Phase Asymmetry Metric is proposed for the CCA ultrasound images. First, the CCA ultrasound image is decomposed into the NSST domain with a low-frequency sub-band and several high-frequency sub-bands. Next, the high frequency sub-band image is despeckling using an adaptive threshold method. Then, the processed image is reconstructed through NSST. Finally, an edge enhancement method based on the phase asymmetry (PAS) metric is used for enhancing the edges in the reconstructed CCA ultrasound images. In the simulated CCA ultrasound image experiments, the CNR value of proposed method is 1.8191 dB, which is the highest among four state-of-the-art methods. In the clinical CCA ultrasound image experiments, the average CNR values of proposed method is 1.5457 ± 0.6595 (mean ± std in dB), which is the best among four advanced methods. In the real application of IMT measurements, the average absolute error of intima-media thickness measurements of proposed method is 0.0790 ± 0.0588 (mean ± std in mm), which is the lowest among four advanced methods. In conclusion, the proposed approach has improved performance in suppressing the speckle noise and enhancing the intima media complex (IMC) regions, and it is a potential method for preprocessing of the CCA ultrasound images in clinical application.
Keywords
Introduction
Carotid atherosclerosis can cause stroke. In recent years, stroke is one of the main causes of death and disability. 1 The early prediction of the carotid atherosclerosis can be helpful for reducing the disability and fatality rates caused by stroke. Many research results have shown that the intima media thickness (IMT) is an important indicator for the early risk prediction of carotid atherosclerosis, as an increase of the IMT indicates a higher risk of atherosclerosis.2 -4 As shown in Figure 1, there are three layers in the common carotid artery (CCA) wall. They are the intima, media, and adventitia. Figure 1(a) shows a longitudinal cut of the CCA in the ultrasound image, over the near and far walls. The dark area in the middle represents the lumen. The two boundaries at the far wall that compose the intima media complex (IMC) denote the lumen intima interface (LII) and media adventitia interface (MAI). The IMT can be obtained by calculating the distance between the LII and MAI in the far wall (see Figure 1(b)). Moreover, in the clinical application, the IMT is manually measured by the experienced vascular experts. However, the shortcomings of the manual measurements are low efficiency, manual errors, and so on. 5 To address these issues, many segmentation methods are used for automatic IMT measurements.6 -9 However, speckle noise and blurred IMC regions in the clinical CCA ultrasound images can reduce the accuracy of the image segmentation. To improve the performance of the IMT measurements, the preprocessing is required before image segmentation.
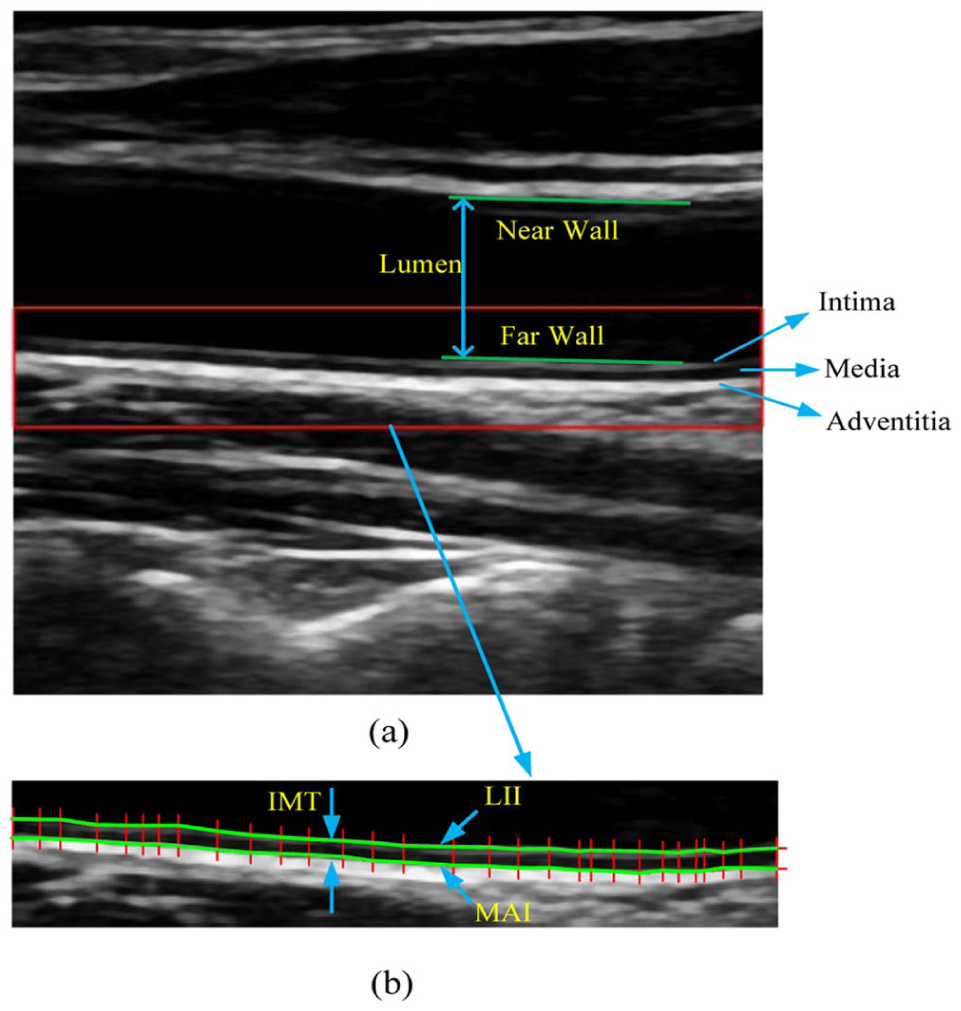
(a) A longitudinal section of the common carotid artery (CCA) in the ultrasound image. (b) The region of interest (ROI) from the carotid ultrasound image that shows two boundaries that compose the intima media complex (IMC), as delineated by an expert. The two boundaries are lumen intima interface (LII) and media adventitia interface (MAI).
In the last decades, many preprocessing techniques are proposed. Perona and Malik introduced the idea of the anisotropic diffusion (AD). 10 Tomasi and Manduchi 11 proposed the bilateral filtering for image denoising, and this filter has good performance in preserving the structural similarity. However, bilateral filter can’t maintain the balance in suppressing the noise and preserving the feature. To improve the despeckling performance, Yu and Acton 12 proposed an edge sensitive diffusion filter named speckle reducing anisotropic diffusion (SRAD). The SRAD filter has outstanding performance in smoothing the homogenous region and preserving the details compared with other traditional anisotropic smoothing filters. However, SRAD also has disadvantages. One of the main disadvantages is that SRAD can blur weak edges. Guo et al. 13 introducing a despeckling method using 2-D homogeneity and directional average filters. Coupé et al. 14 proposed an optimized bayesian nolocal means (OBNLM) based filter for ultrasound despeckling. Guo et al. 15 proposed a despeckling filter using a modified non local-based method. Cui et al. 16 proposed a guided trilateral filter for ultrasound image despeckling. Zheng and Tian 17 introduced a center affine filter based approach for image despeckling. Zhang et al. 18 introduced a Laplacian pyramid based non-linear coherence diffusion for medical ultrasound despeckling. Diwakar et al. 19 proposed an CT image denoising approach based on CNN and its Method Noise Thresholding. Diwakar et al. 20 introduced a fractional order total variation method for edge-guided filtering based CT image denoising. Diwakar et al. 21 proposed a CT image denoising method based on batch normalization and convolution neural network. However, almost all filters can produce distortion of the image edges, and the extent of distortion depends on the performance of filters.
The IMC regions are important for IMT measurements. Thus, many machine learning and deep learning techniques have been applied to IMC segmentation or IMT measurements. To improve the accuracy of the IMC segmentation, Yuan et al. 22 proposed a flexible method CSM-Net for the joint segmentation of IMC and Lumen in carotid ultrasound images. To improve the robustness of the image segmentation, Alam et al. 23 proposed an image segmentation method based on robust fuzzy RBF network and intelligent decision making system for carotid artery ultrasound images.
Furthermore, Ottakath et al. 24 proposed a new framework based on two components is presented to segment the intima-media layer of the carotid artery to aid in diagnosis of the status. To improve the performance of IMT measurements, the preprocessing stage is requirement. However, there are few studies on the preprocessing method for CCA ultrasound images. Moreover, the existed despeckling filter can result in blurred IMC regions. Therefore, the research goal of our study is to develop an effective strategy for achieving satisfactory performance in suppressing the speckle noise and enhancing the IMC regions. Furthermore, contrast enhancement is also required in the preprocessing stage in IMT measurements.
In recent years, attention has focused on the transform domain filters.25 -30 As compared with spatial domain filtering, transform domain filtering methods have become a better choice in ultrasound image despeckling. 26 Wavelet transform filtering methods are used for despeckling of ultrasound images.31,32 These methods can process the low frequency and high frequency image components. Thus, the wavelet-based filters can overcome the problems posed by spatial filtering. However, the image filtered by wavelet-based methods has some sharp discontinuities. 26 However, the direction of wavelet transform is limited, it can’t capture the edge details effectively using this method. The Contourlet transform and the Shearlet transform both exhibit excellent directional selectivity and anisotropy, but these methods lack of translation invariance and are prone to pseudo-Gibbs phenomenon. 33 Similar to the Contourlet transform, non-subsampled Contourlet transform (NSCT) has many characteristics, such as multi-scale and multi-directional. 34 Moreover, the image decomposed by NSCT has translation invariance, but the NSCT has low efficiency and restrictions on the number of directions. 33 The NSST is a discrete multiscale directional representation and has some characteristics, such as anisotropy and translation invariance. This method has not restrictions on the number of directions, and its inverse transform only requires a summation of the shearing filters rather than an inversion of the directional filter banks. 35 Therefore, the NSST has lower computational complexity than NSCT. Furthermore, as compared with shearlet transform, NSST can reduce the pseudo-Gibbs phenomenon. Thus, NSST is more suitable for CCA ultrasound image enhancement.
Moreover, the edge enhancement is important for the IMT measurement. The edges need to be identified before edge enhancement. The traditional edge detection approaches are based on gradient operators and are sensitive to noise. To accurately detect the edges, the edge detection methods based on phase asymmetry (PAS) metric are used in ultrasound image processing.36 -38 Thus, to improve the performance of the preprocessing step in IMT measurements, in this study, a combination of NSST and PAS metric approach is used to reduce the speckle noise and enhance the IMC regions in CCA ultrasound images. In the previous study, a metric named the contrast-to-noise ratio (CNR) 39 is used for the evaluation of the enhanced results. However, the purpose of the preprocessing method is to lay the foundation for IMT measurements. Thus, in the present study, the evaluations are extended to the preprocessing method’s impact on the performance of IMT measurements. Thus, the preprocessing method is extensively evaluated with the CNR and IMT measurements. Furthermore, to reflect the improved performance of the proposed method, in this paper, the other advanced methods are used to compare with the proposed approach.
The main contribution of this study is as follows:
i. A novel preprocessing method based on NSST and PAS metric is proposed for enhancing the IMC regions and reducing the speckle noise in CCA ultrasound images.
ii. Quantitative results of the clinical CCA ultrasound image experiments and real application of IMT measurements are reported and discussed to verify the feasibility and effectiveness of the proposed technique.
The rest of the paper is organized as follows. Section 2 presents the related works. Section 3 describes proposed method. The experimental results and discussions are presented in Section 4. Finally, Section 5 provides the conclusions.
Related Works
Non-subsampled Shearlet Transform (NSST)
NSST is an optimization of the shearlet transform, it has no subsampling for the non-subsampled pyramid and the shearing filter during the decomposition process. Thus, the NSST is shift-invariant, it can reduce the pseudo-Gibbs phenomenon caused by the shearlet transform. NSST is an affine transformation by scaling, shearing, and shifting the basic function. 40
When the dimension n = 2, the affine system of shearlet transform is as follows 40 :
where
The matrices

In domain

The basis function
For any

Moreover, partitioning
Da Cunha et al. 42 proposed the non-subsampled Laplacian pyramid (NSLP). The multiscale decomposition of the NSST is performed using NSLP. The iteration process of the NSLP decomposition is as follows:

where
The image is decomposed into one low-frequency sub-band and one high-frequency sub-band using NSLP. Then, shearing filter (SF) is used to decompose the high-frequency sub-band to obtain the multidirectional sub-bands. 43 Figure 2 shows the flowchart of the NSST.
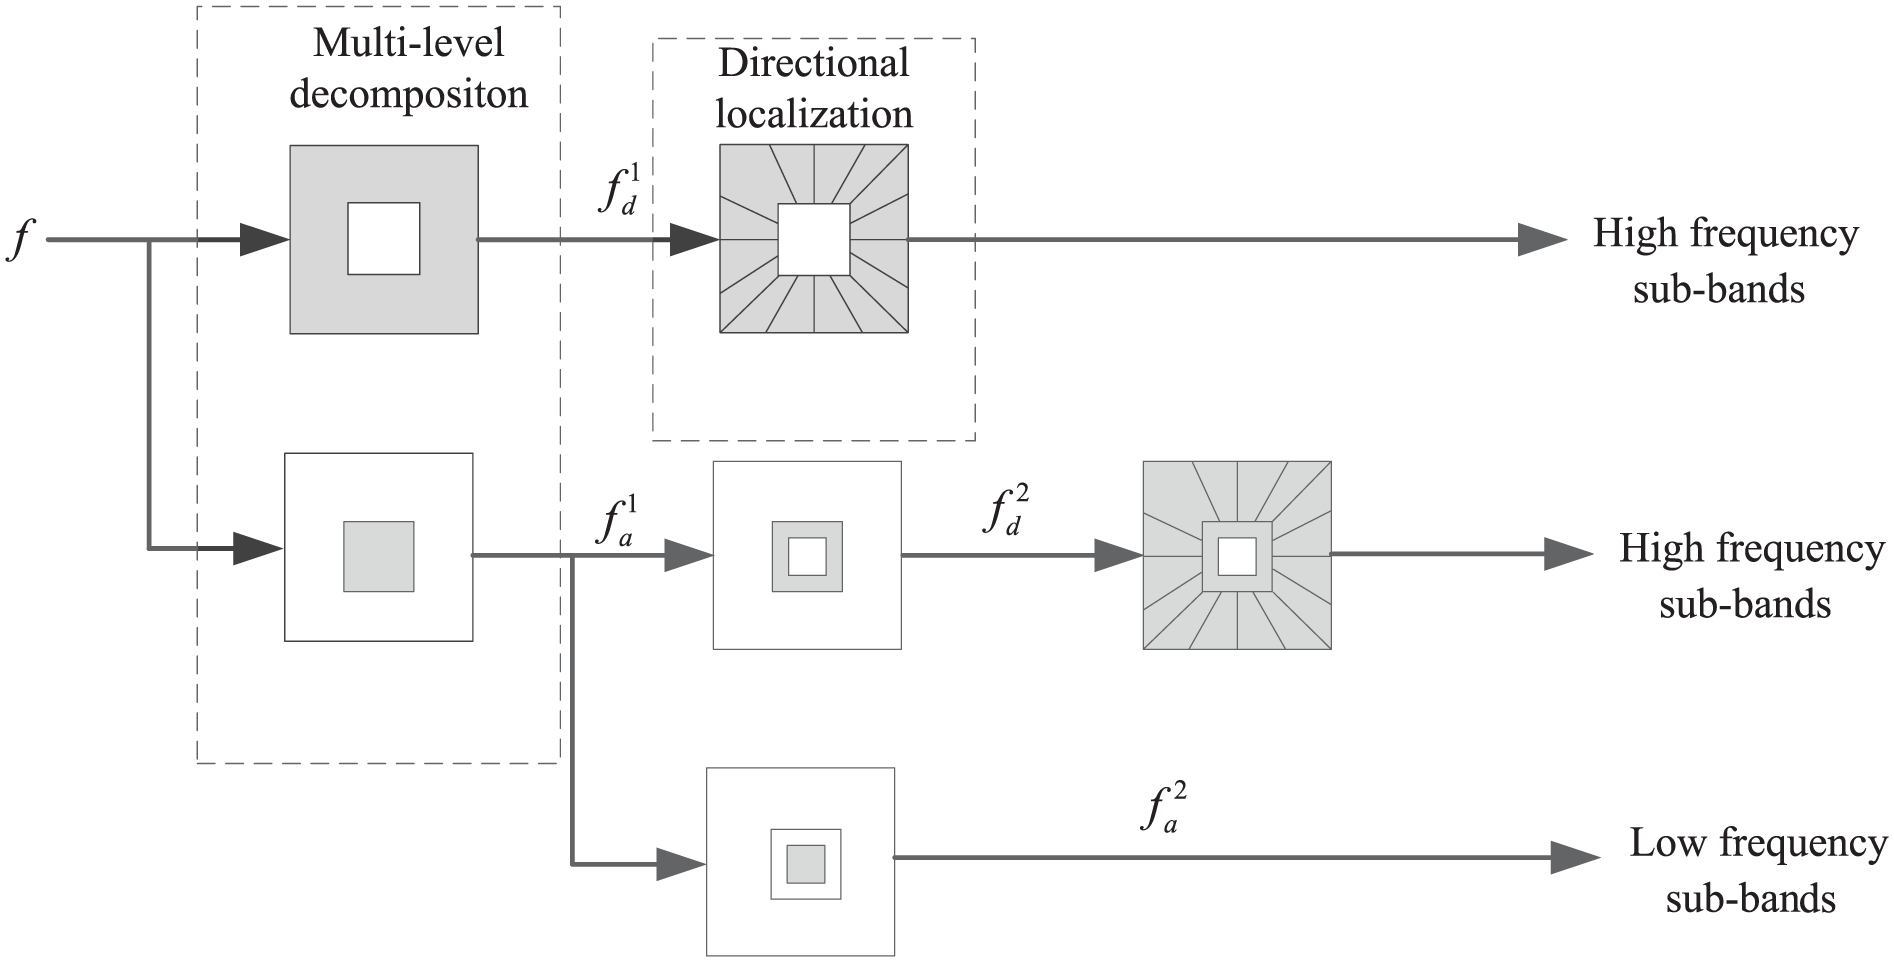
Flowchart of the NSST.
Figure 3 shows the low frequency and high frequency sub-band images of a CCA ultrasound image after two-level NSST decomposition. The low frequency sub-band image contains the main energy, and it is similar to the original image. The high-frequency sub-band image at level 1 has a total of four directions, and the high-frequency sub-band image at level 2 has a total of eight directions, including the edges, texture details, and noise of the original CCA ultrasound image.
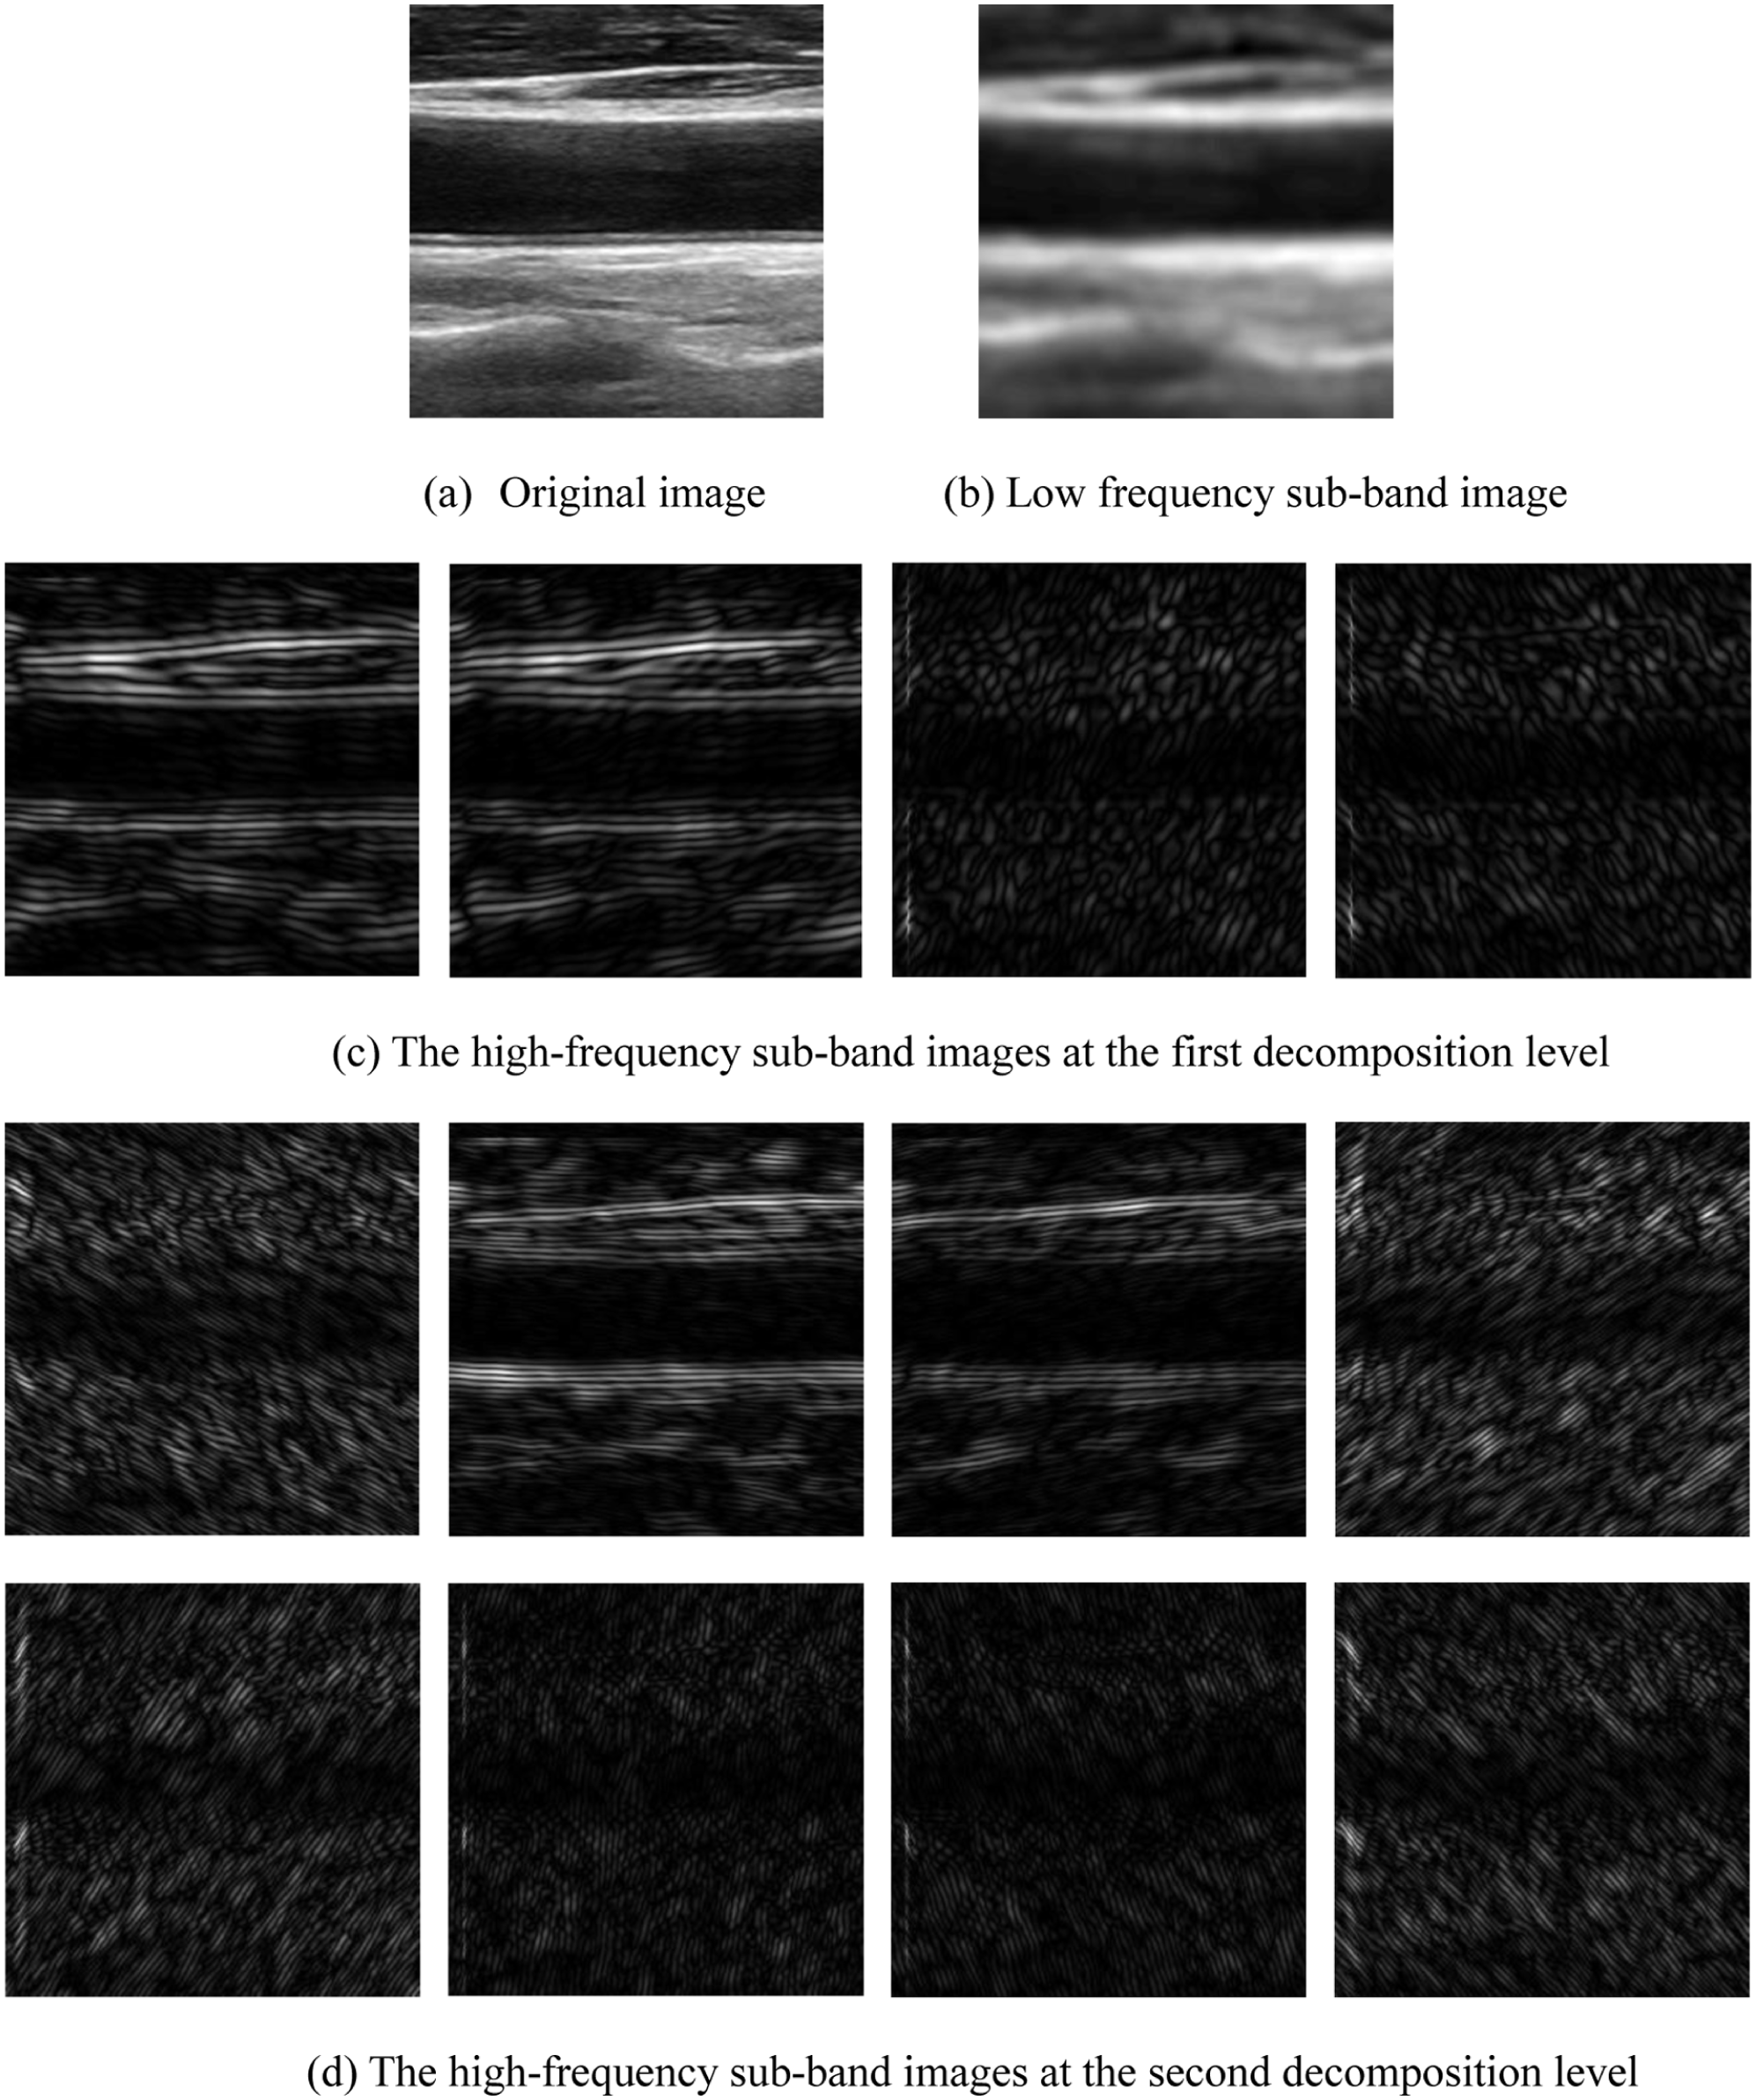
The two level NSST decomposition of the CCA ultrasound image. (a) Original image (b) Low frequency sub-band image. (c) The high-frequency sub-band images at the first decomposition level. (d) The high-frequency sub-band images at the second decomposition level.
Phase Asymmetry
To obtain the edge distribution of a 2D image

In equation (10),
The range of the frequencies of the image is widely in the frequency domain. Therefore, a set of bandpass quadrature filters

In equation (12), s denotes the scaling parameter,

In the equation (13),

In equation (14),
The multiple-scale PAS is expressed as 36 :

where
Figure 4 shows a CCA ultrasound image of PAS measure at different scales. Furthermore, it is important to note that the IMC region plays a crucial role in the measurement of IMT. It can be observed that the discontinuities present in some edges in the PAS maps at s = 10 and 20 can compromise the accuracy of edge localization. The details of IMC region in the PAS maps at s = 70 and 80 are lost. The PAS map at a moderate value of s (s = 50) effectively strikes a balance between maintaining edge continuity and preserving the details of the IMC region. Thus, this study chooses s = 50 to detect edges in real CCA ultrasound images.
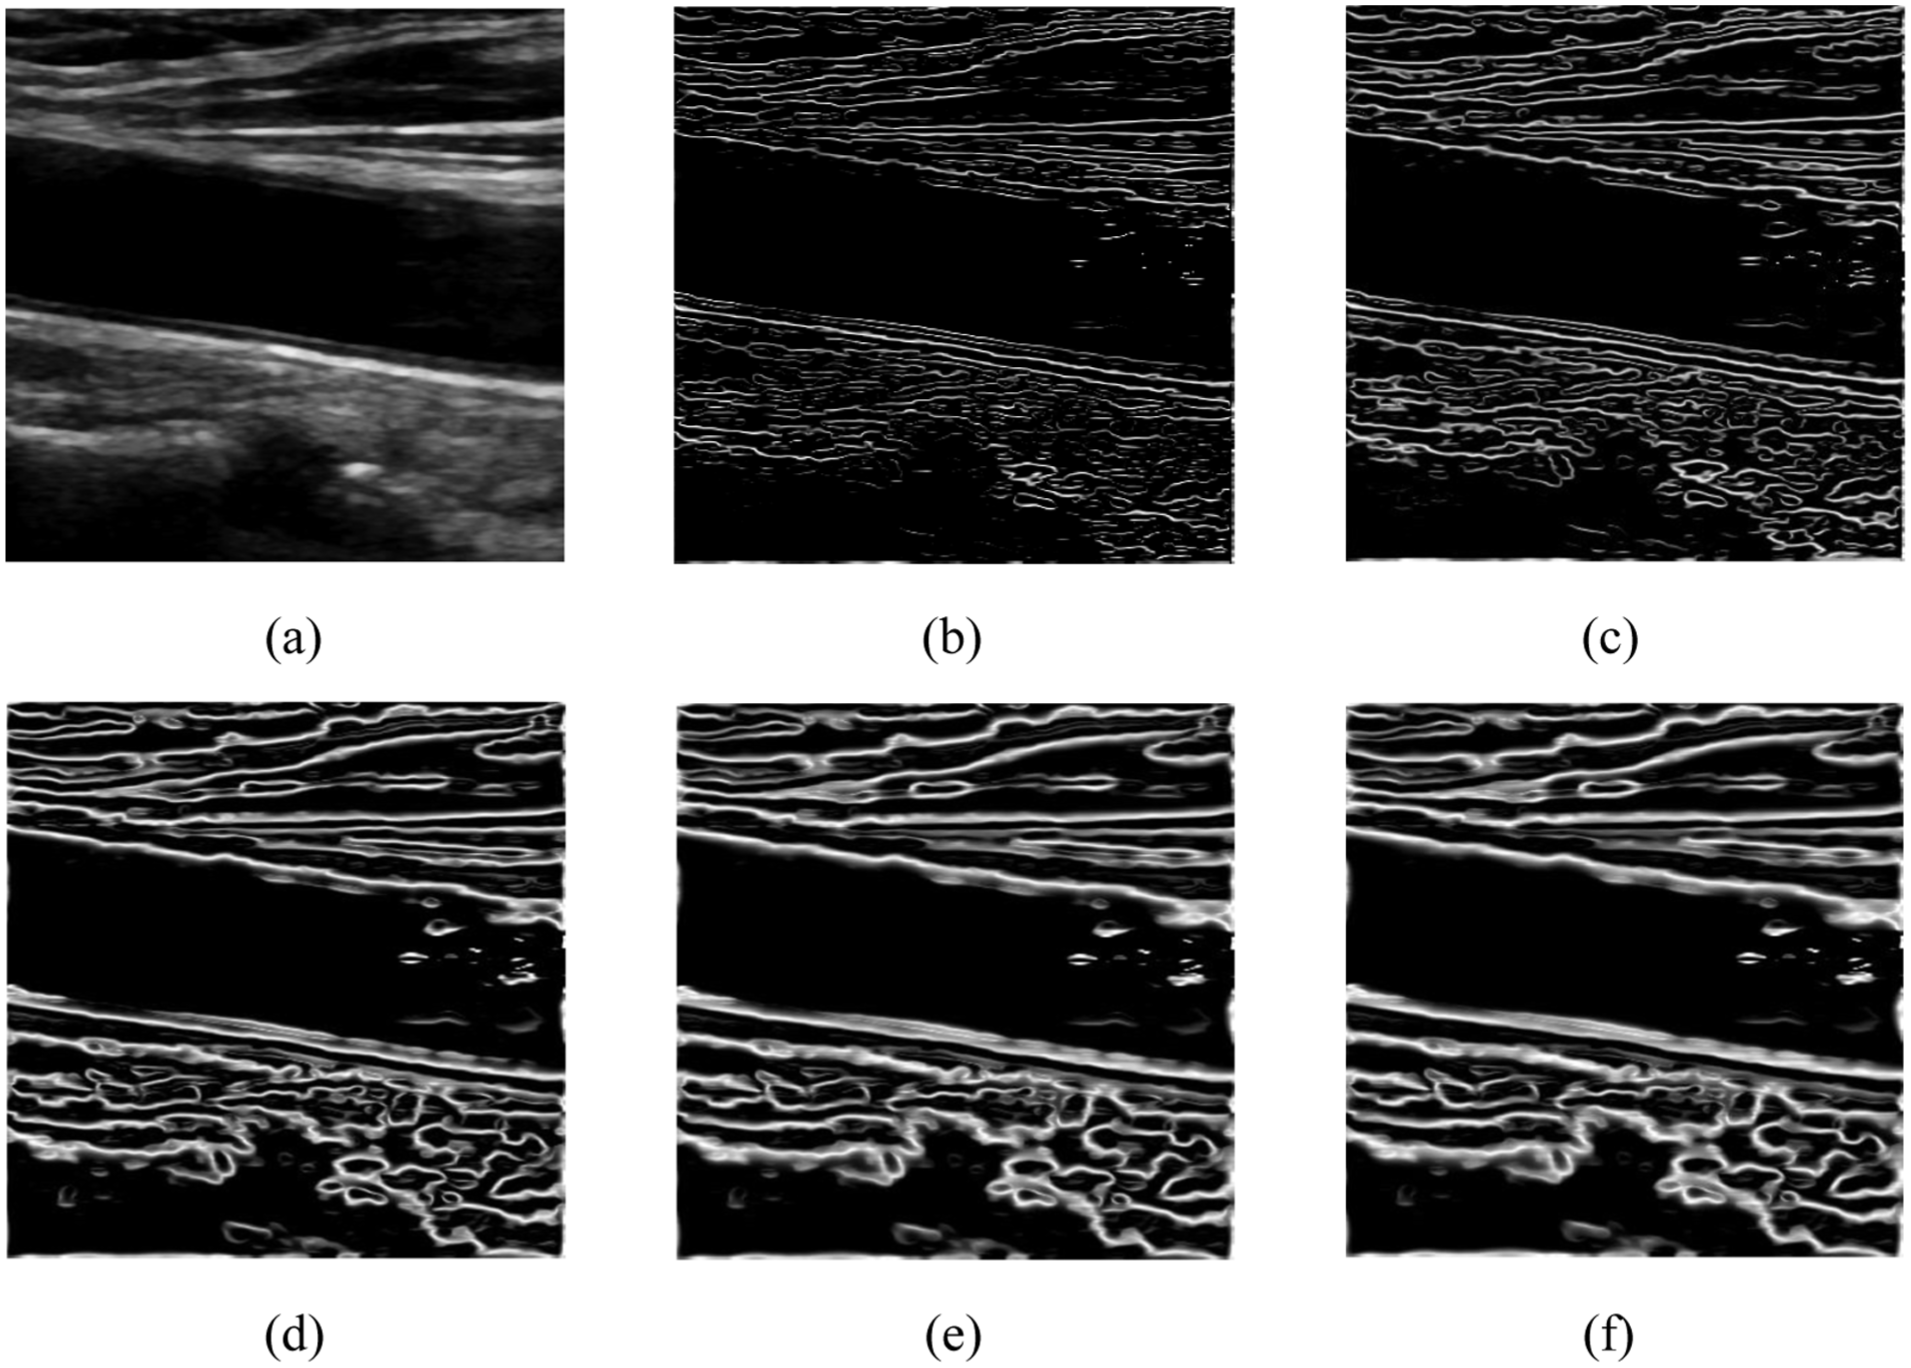
A CCA ultrasound image of PAS measure at different scales. (a) The CCA ultrasound image, the PAS map of: (b) s = 10, (c) s = 20, (d) s = 50, (e) s = 70, (f) s = 80.
Proposed Method
The Enhancement of Low-Frequency Sub-band of the CCA Ultrasound Image
The low-frequency sub-band of the CCA ultrasound image contains main energy of the image and less noisy. The main energy of the image is related to the overall contrast of the image. To accomplish the contrast enhancement of the CCA ultrasound image, the low-frequency sub-band of the image needs to be normalized. In this study, the low-frequency sub-band of the CCA ultrasound image is normalized by mapping the gray levels of CCA ultrasound images into the range

where
Denoising in High-Frequency Sub-band of the CCA Ultrasound Image
The high frequency sub-band images of a CCA ultrasound image after NSST decomposition contains the strong edges, weak edges and noise. To lay the foundation for the IMT measurements, the strong edges need to be preserved, the weak edges need to be enhanced, and the noise needs to be reduced. To suppress the noise and preserve the edges, an adaptive threshold based on Bayes Shrink is used in this study and is as follows 44 :

where


In the above formulas,
The adaptive threshold based on Bayes Shrink is used to reduce the noise:

where
Description of the Proposed Method
Figure 5 shows the process flow of the proposed method.
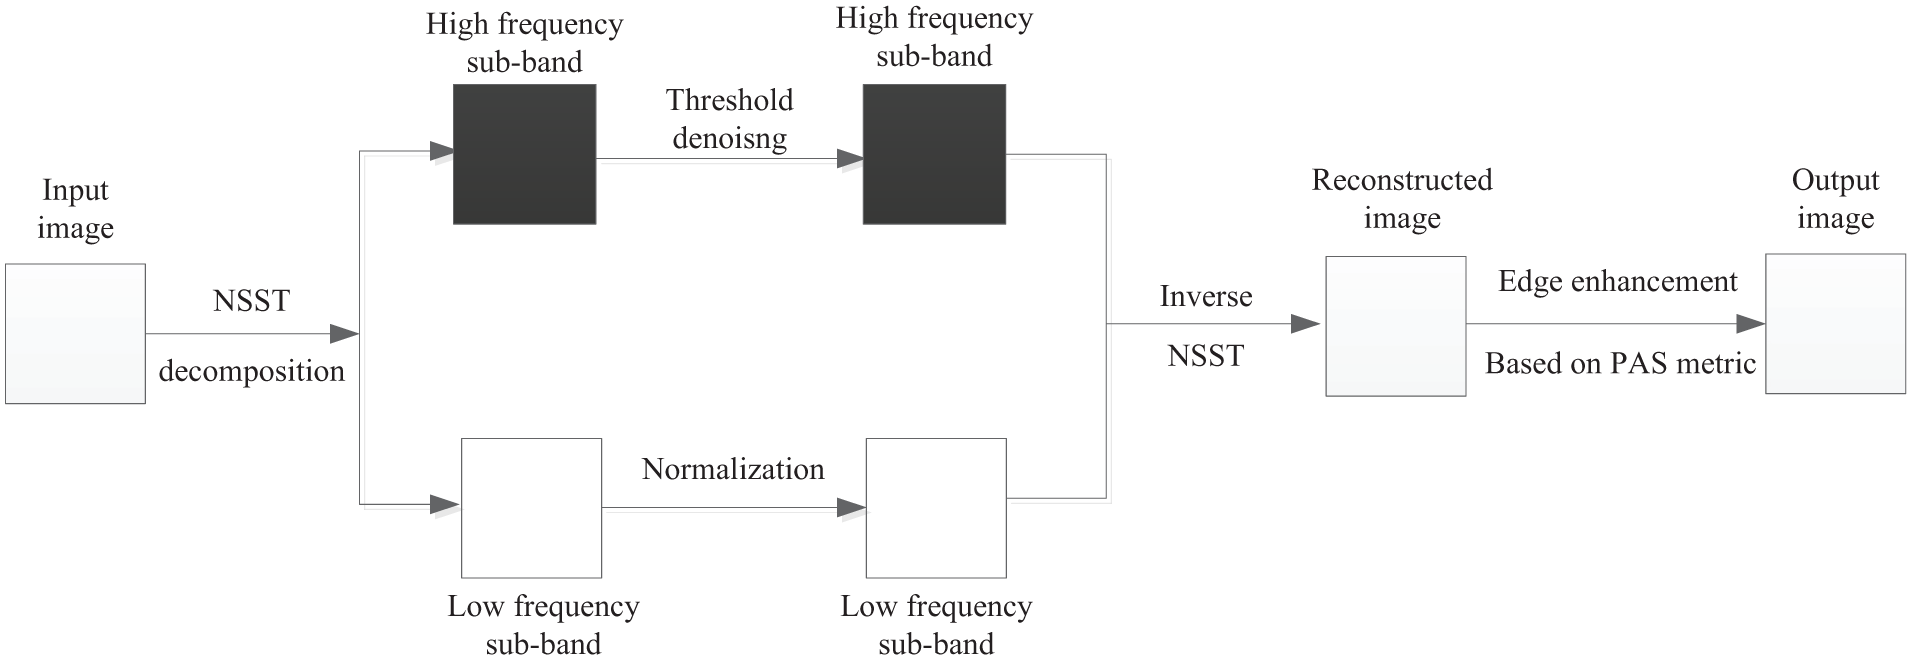
The process flow of the proposed method.
The step-by-step process of the proposed method for CCA ultrasound image enhancement is as follows:
Step 1. The input image is decomposed based on NSST, and the low-frequency sub-band and several high-frequency sub-bands are obtained.
Step 2. The low-frequency sub-band of the image is normalized using a mapping function expressed as in equation (16), and an adaptive threshold based on Bayes Shrink is used to reduce the noise in the high-frequency sub-bands.
Step 3. The inverse NSST transformation is performed on the coefficients of low-frequency sub-band and high-frequency sub-bands to obtain the reconstructed image
Step 4. Finally, an edge enhancement method based on PAS metric is used for CCA ultrasound images in spatial domain:

where
The final enhanced CCA ultrasound images can be obtained by:

The Evaluation Method
The evaluation of the processed ultrasound image quality should be consistent with the purpose of the processing. The IMT is an important parameter for predicting the atherosclerosis risk. For the CCA ultrasound images, the IMC segmentation techniques can be used for IMT measurements. Therefore, the region of the IMC is very important for IMT measurements. Thus, in our research, the purpose of the preprocessing is to enhance the region of IMC, and to suppress the regions of the background with many speckles. The noise free ultrasound image does not exist. Thus, to quantitatively evaluate the performance of the methods, we need an evaluation metric which does not require a noise-free image. Hence, a metric named the contrast-to-noise ratio (CNR) 39 is used to assess the different algorithms. The CNR is calculated as follows:

where
Experimental Results and Discussions
The experiments are tested on ASUS laptop with Intel Core i7 and 16 GB of RAM, and the software used for experiments is MATLAB R2018a. To verify whether proposed method is suitable for CCA ultrasound images, other advanced methods such as SRAD 12 and improved PAL 45 and NLLRF 46 are used to compare with the proposed approach. Many experimental results proved that the four-level NSST decomposition can maintain the balance in preprocessing the CCA ultrasound images and reducing the time-consuming. Thus, in this study, the number of the levels of the NSST decomposition is four. To make full use of the local information, the number of decomposition directions for the first, second, third, and fourth layers is established as 4, 8, 16, and 16, respectively. Moreover, in the process of edge enhancement utilizing the PAS metric, this study selects a value of s = 50 for the detection of edges in real CCA ultrasound images.
Simulated CCA Ultrasound Image Experiments
In simulated CCA ultrasound image experiments, the CCA ultrasound image is simulated based on Filed II47,48 to verify the performance of different preprocessing methods. To simulate the realistic CCA ultrasound image, the envelope signals consistent with those used in clinical application need to be generated. Thus, this study uses the approach proposed in Hu et al. 47 to simulate the CCA ultrasound image. First, the scatterer model of the CCA is simulated based on Field II. Next, the corresponding radio frequency (RF) signals are generated. Then, the final simulated CCA ultrasound image is obtained through envelope extraction, logarithmic compression and interpolation. Furthermore, the ultrasonic simulation parameters used in Field II are presented in Table 1.
The Ultrasonic Simulation Parameters Used in Field II.
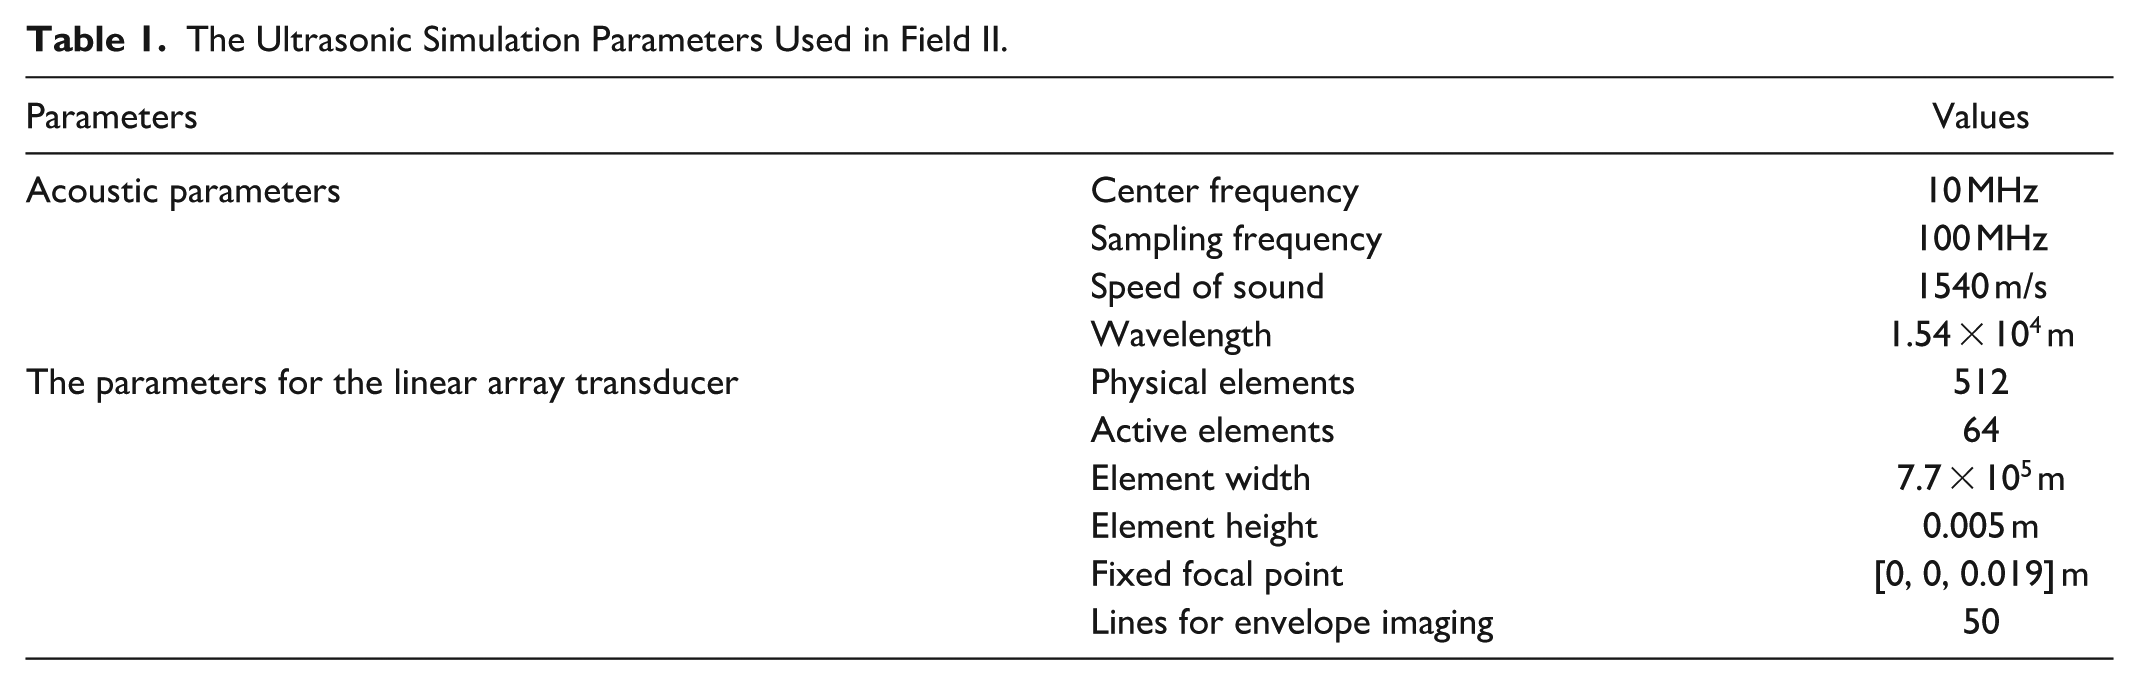
Figure 6 shows the results of different methods for the simulated CCA ultrasound image. Among the results of the different methods, the result of the proposed method has the outstanding performance in enhancing the IMC region. At the same time, the edges in the result of the proposed method are better defined than those in the results of other methods. Thus, the proposed method achieves better performance in enhancing the edges in IMC region compared with other methods, which can lay the foundation for IMT measurement.
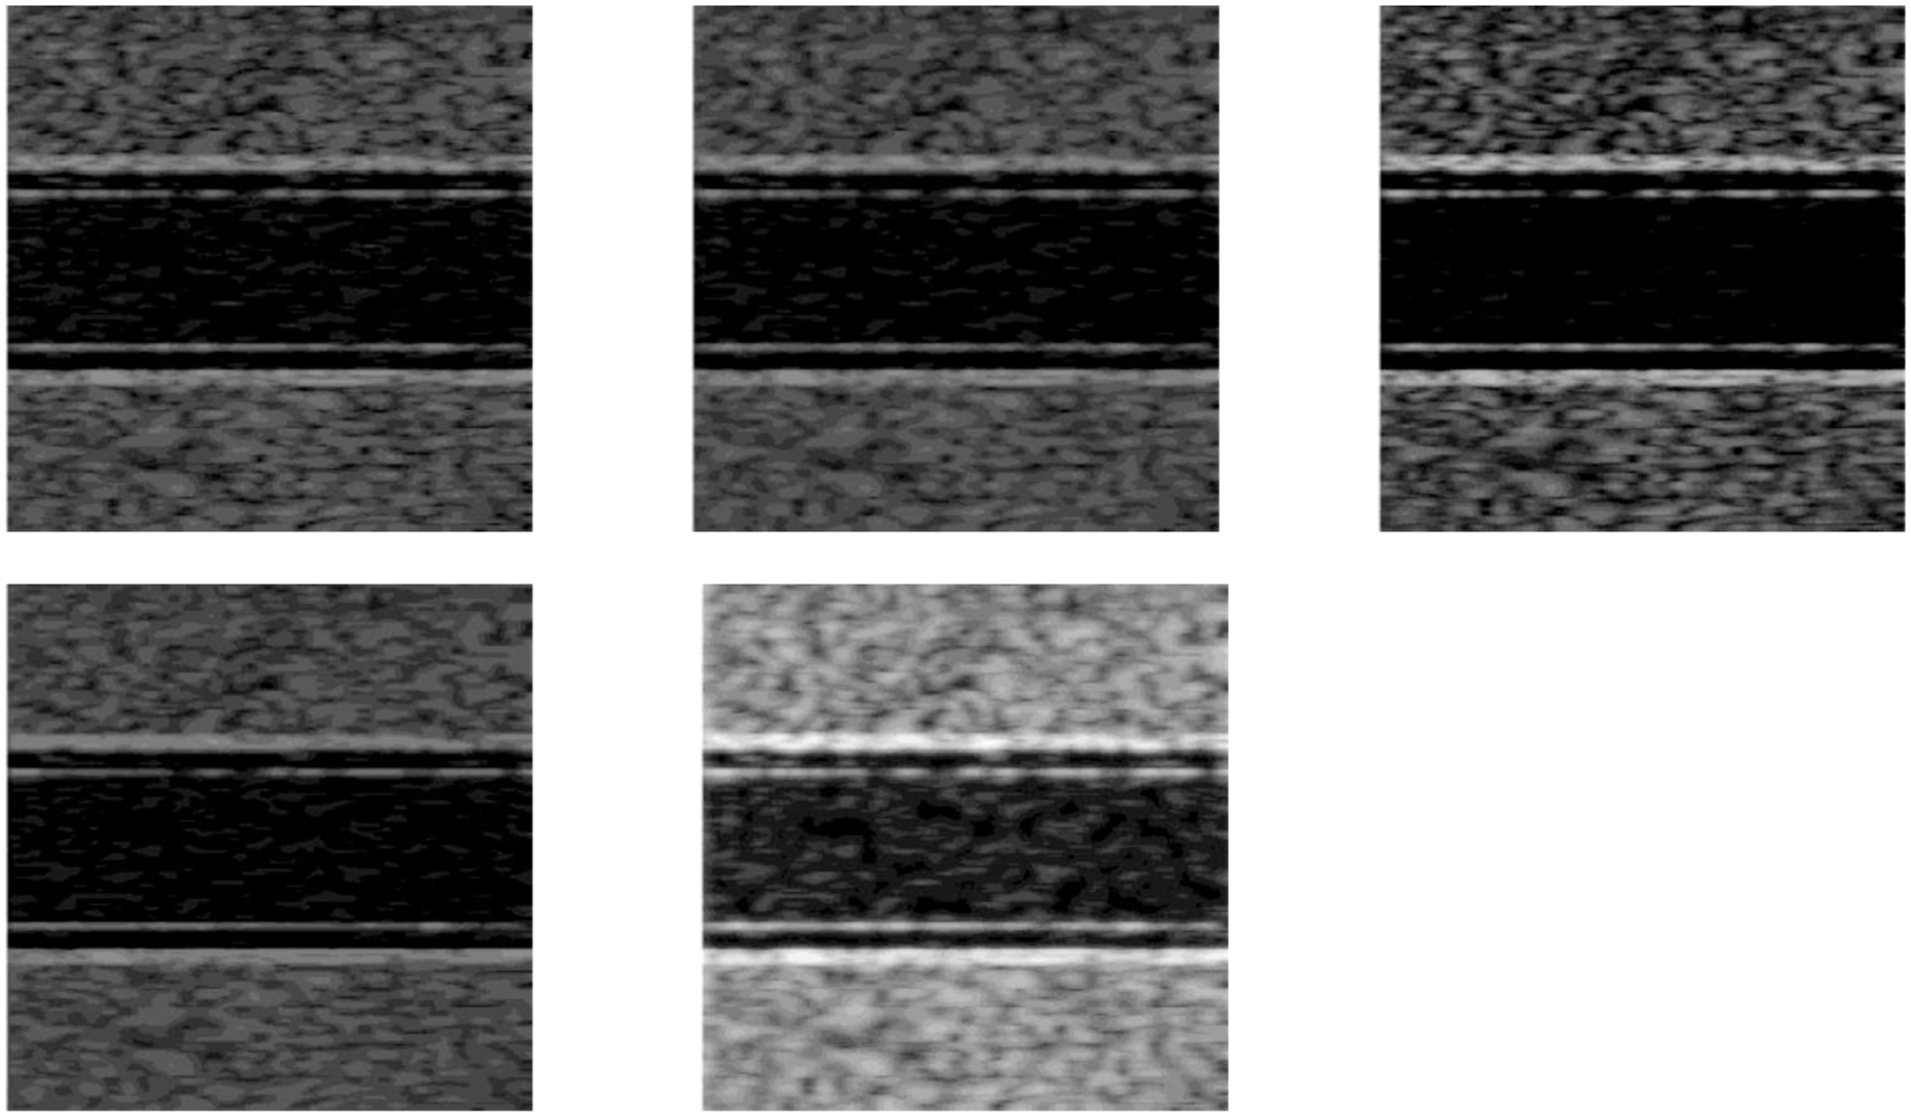
Results of different methods for the simulated CCA ultrasound image. (a) Original simulated CCA ultrasound image. (b) SRAD. (c) Improved PAL. (d) NLLRF. (e) Proposed method.
The original simulated CCA ultrasound image contains the speckle noise. However, the traditional evaluation metrics such as PSNR and SNR need a reference image. Thus, these evaluation metrics can’t be used for quantitative evaluation in simulated CCA ultrasound image experiments. To quantitatively evaluate the performance of the different methods, the non-reference evaluation metric, CNR, is used for the evaluation.
ROIs and BKGs in Figure 7 indicate the IMC and background regions in equation (24), respectively. In our research, the IMC need to be enhanced, and the background regions which contain many speckles need to be suppressed. Thus, IMC regions are selected for ROIs and background regions are chosen for BKGs. Furthermore, for each image, the extractions of ROIs and BKGs are identical for processed results obtained by different approaches. The average of nine CNR values from the combinations of three ROIs and three BKGs is used to assessment the performance of different approaches.
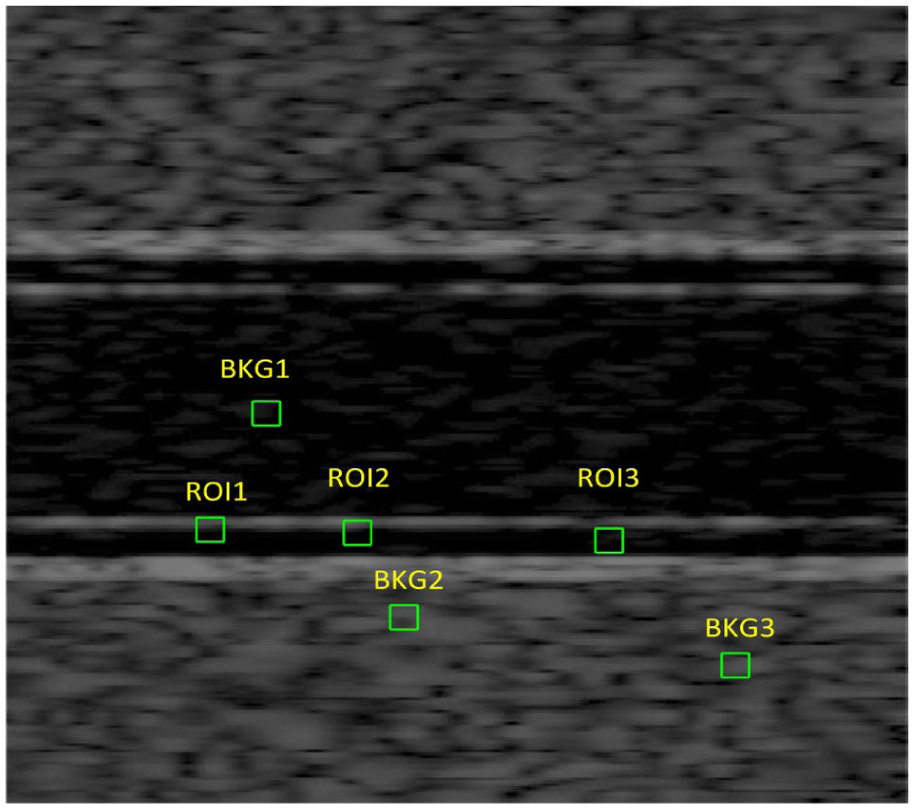
A simulated CCA ultrasound image corresponding to Figure 6(a), which including ROIs and BKGs.
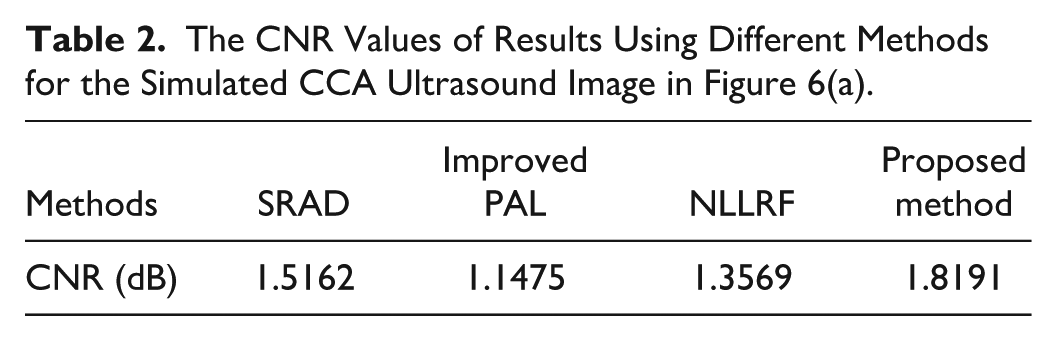
Table 2 presents the CNR values of different methods for the simulated CCA ultrasound image. The proposed method achieves the highest CNR values. The highest CNR values reflect the proposed method has the best performance in suppressing the speckle noise and preserving the feature.
The CNR Values of Results Using Different Methods for the Simulated CCA Ultrasound Image in Figure 6(a).
Clinical CCA Ultrasound Image Experiments
In clinical CCA ultrasound image experiments, there are a total of 102 common carotid artery ultrasound images are used to verify the performance of the different methods. These images are all collected from the Tumor Hospital of Yunnan (Yunnan province cancer center). There are 32 CCA ultrasound images are acquired using the Hitachi-Aloka ultrasound machine. The range of the spatial resolution of the images is 14.4–23.0 pixels/mm. There are 25 CCA ultrasound images are acquired using the LOGIQ E9 ultrasound machine, and their spatial resolution is 13.2 pixels/mm. There are 39 CCA ultrasound images are acquired using the Mindray Resona 7 ultrasound machine. The spatial resolution of these images is 16.45–20.1 pixels/mm. There are six CCA ultrasound images are acquired using the Toshiba Aplio500 ultrasound machine. The spatial resolution of these images is 24.8 pixels/mm.
Figure 8 shows the processed results obtained by different methods. Figure 8(b) shows the result of SRAD. Although SRAD reduces the speckle noise in ultrasound image, it results in blurred edges. Figure 8(c) shows the result of improved PAL. This method enhances the edges in ultrasound image, but it hasn’t good performance in suppressing the speckle noise. As shown in Figure 8(d), NLLRF can suppress speckle noise significantly. However, it can’t perform well in preserving edges. At the same time, as shown in Figure 8(e), as compared with other methods, the proposed method has outstanding performance in preserving the edges and suppressing the speckle noise.
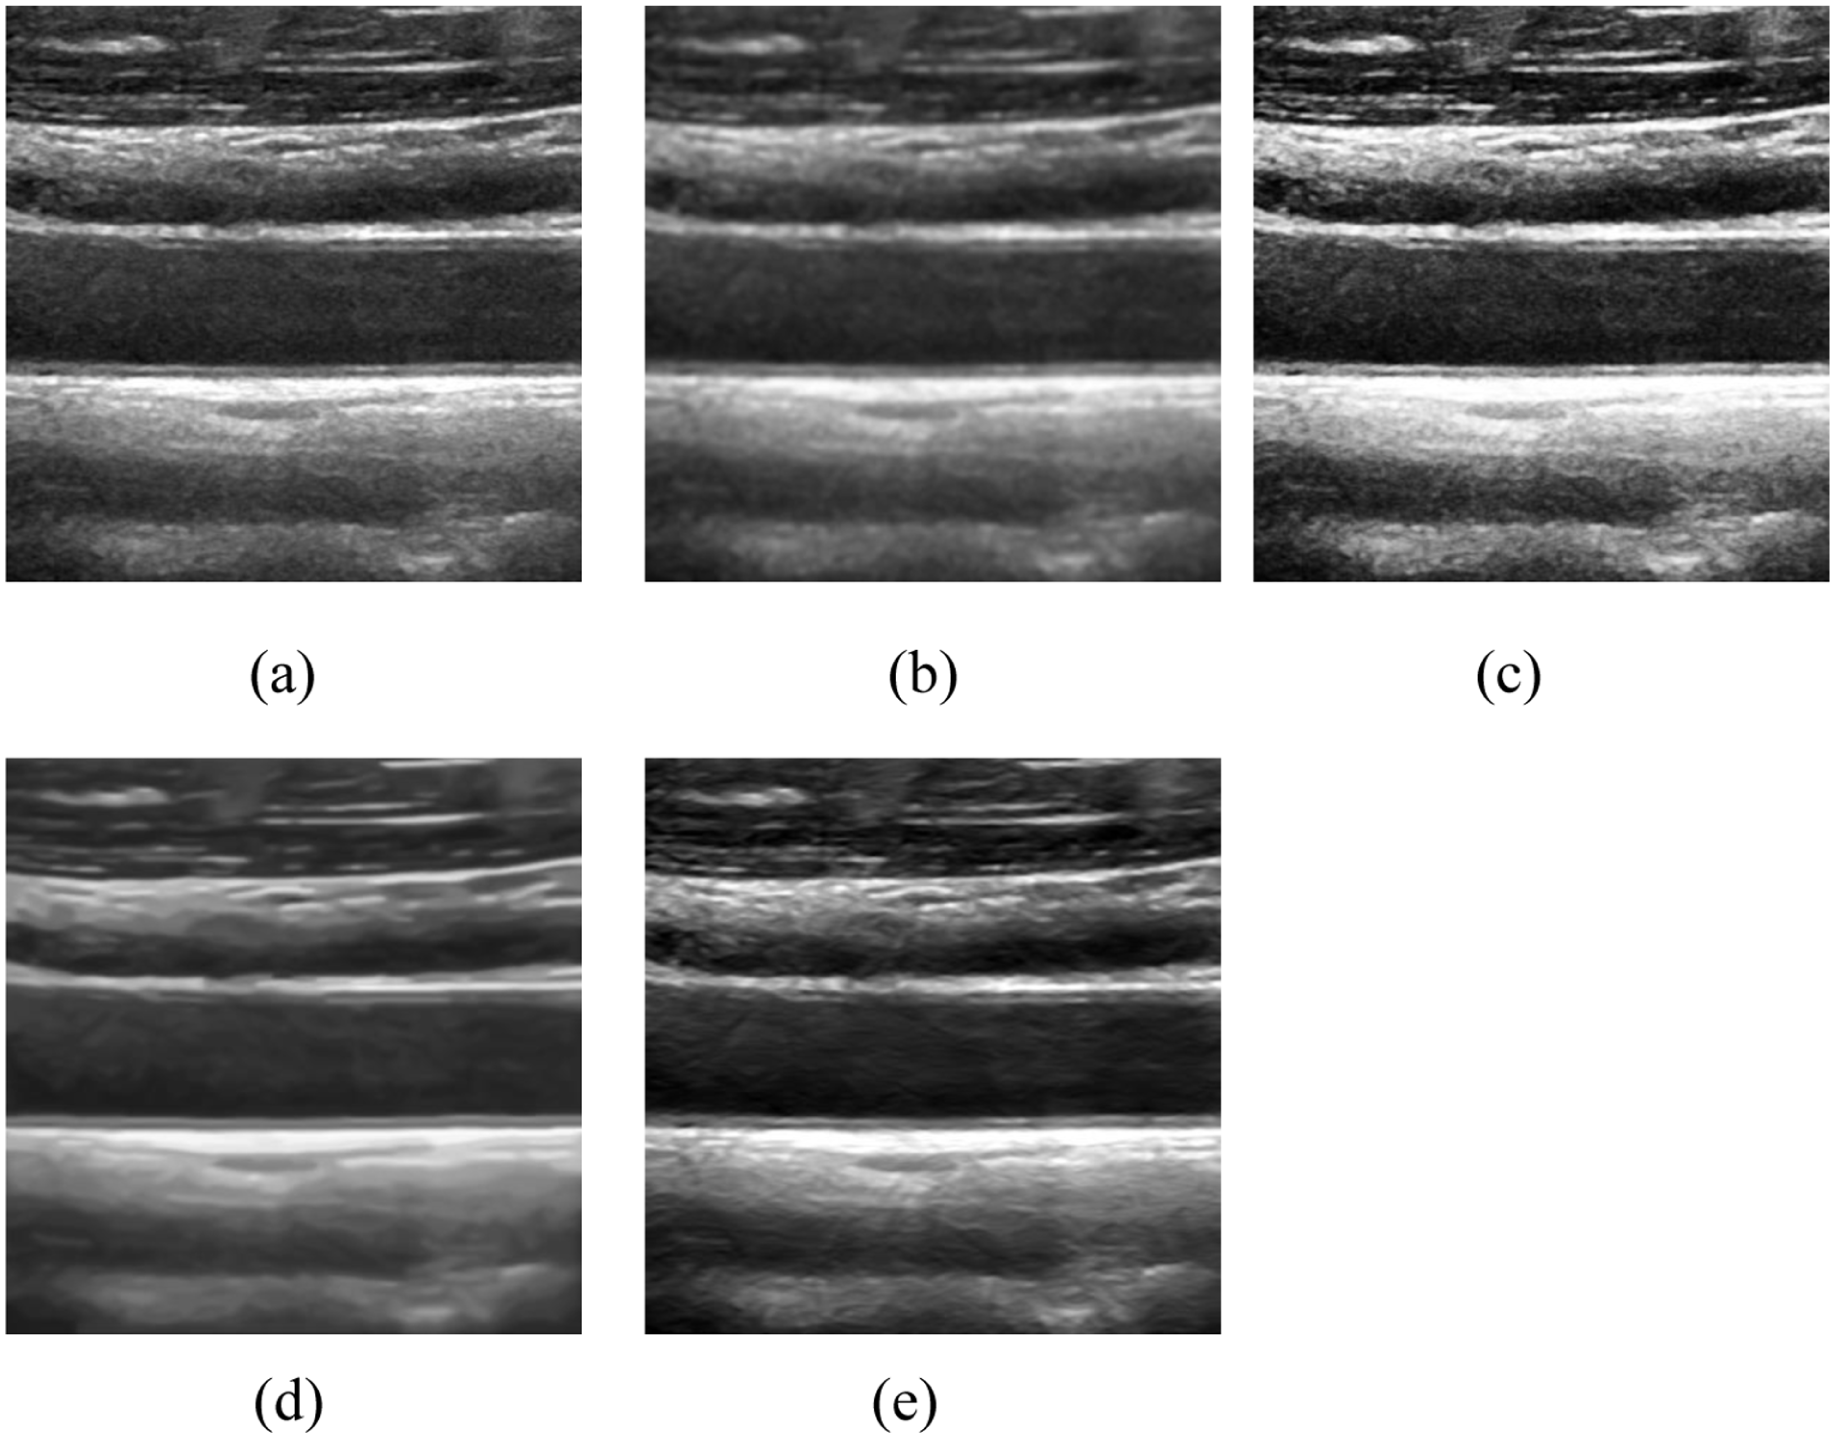
Comparisons of results obtained by different methods. (a) Original CCA ultrasound image. (b) SRAD. (c) Improved PAL. (d) NLLRF. (e) Proposed method.
Figure 9 shows a CCA ultrasound image corresponding to Figure 8(a), the ROIs and BKGs in Figure 9 indicate the IMC and background regions in equation (24), respectively.
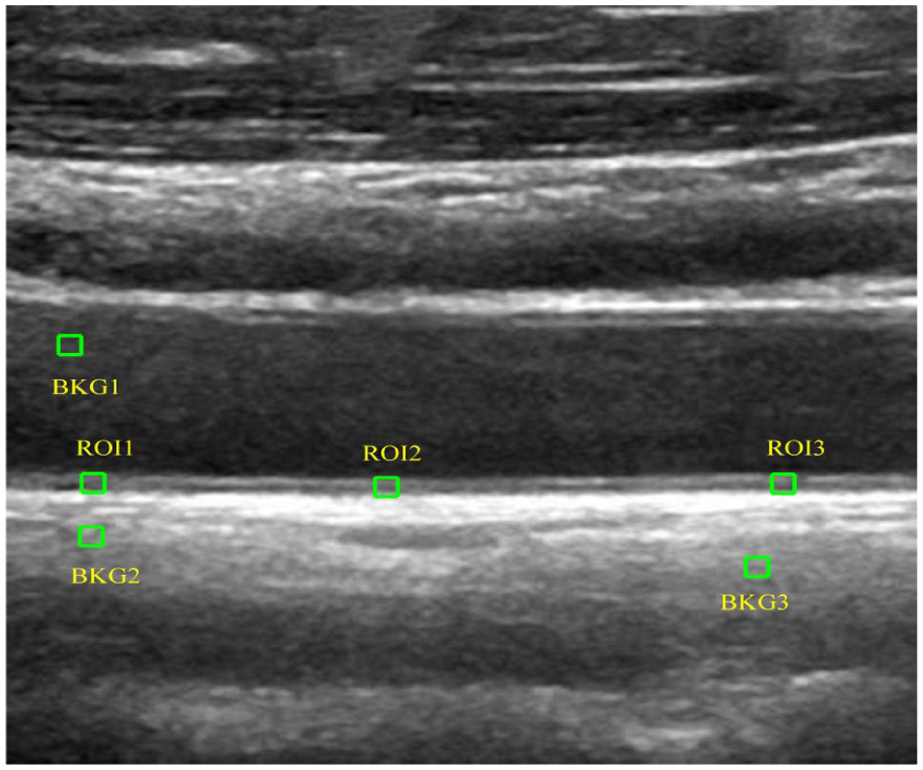
A CCA ultrasound image corresponding to Figure 8(a), which including ROIs and BKGs.
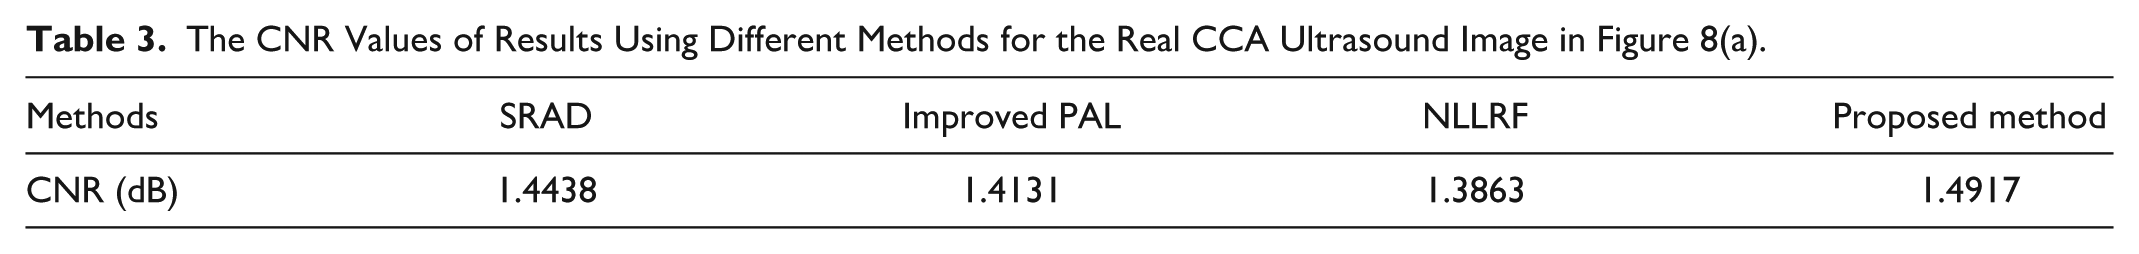
Table 3 presents the results of different methods. Among the four methods, the proposed method achieves highest CNR values. Moreover, Table 4 lists the average CNR values of different methods for 102 CCA ultrasound images, the proposed method achieves best mean CNR values. Thus, the proposed method has outstanding performance in suppressing the speckle noise and enhancing the regions of IMC, and it can lay the foundation for the IMT measurements.
The CNR Values of Results Using Different Methods for the Real CCA Ultrasound Image in Figure 8(a).
Average CNR Values (Mean ± std in dB) of Different Methods for 102 CCA Ultrasound Images.
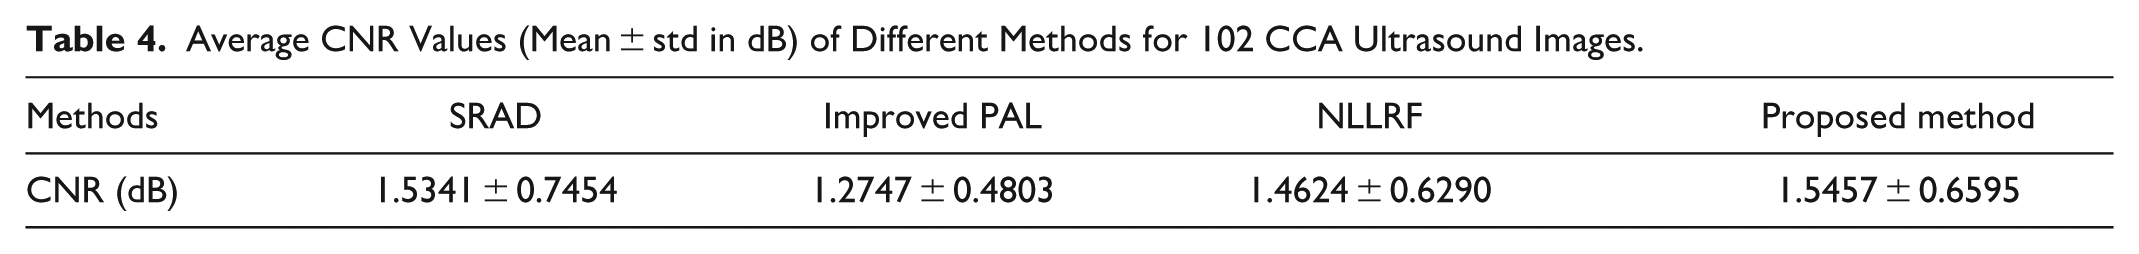
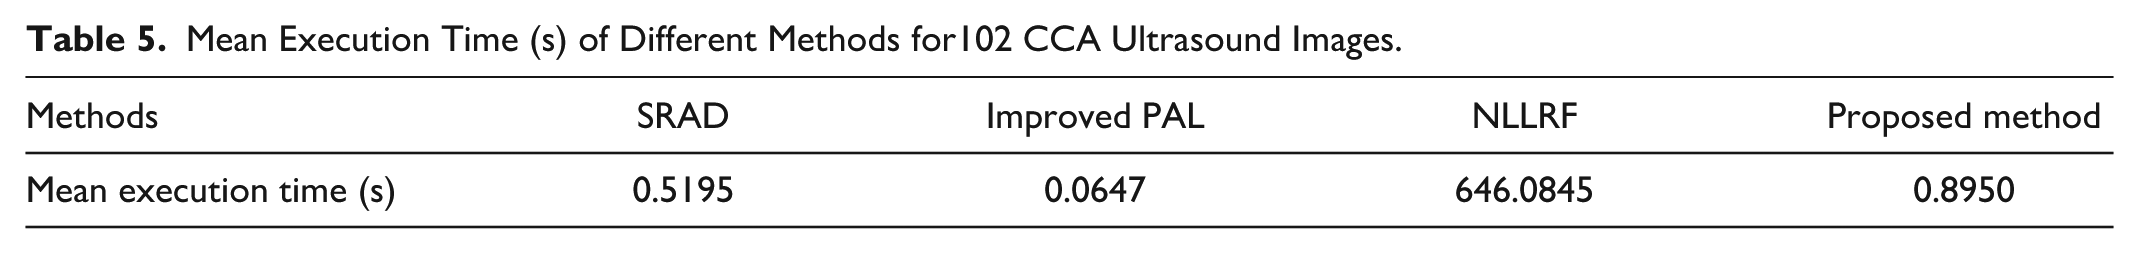
Table 5 presents the mean execution time of different methods for 102 CCA ultrasound images. Although the mean execution time of the proposed method is slightly longer than that of SRAD and Improved PAL, the average running time of the proposed approach is significantly shorter than that of NLLRF. Thus, the proposed method can meet the requirement of the real time in clinical application.
Mean Execution Time (s) of Different Methods for102 CCA Ultrasound Images.
Application to IMT Measurements
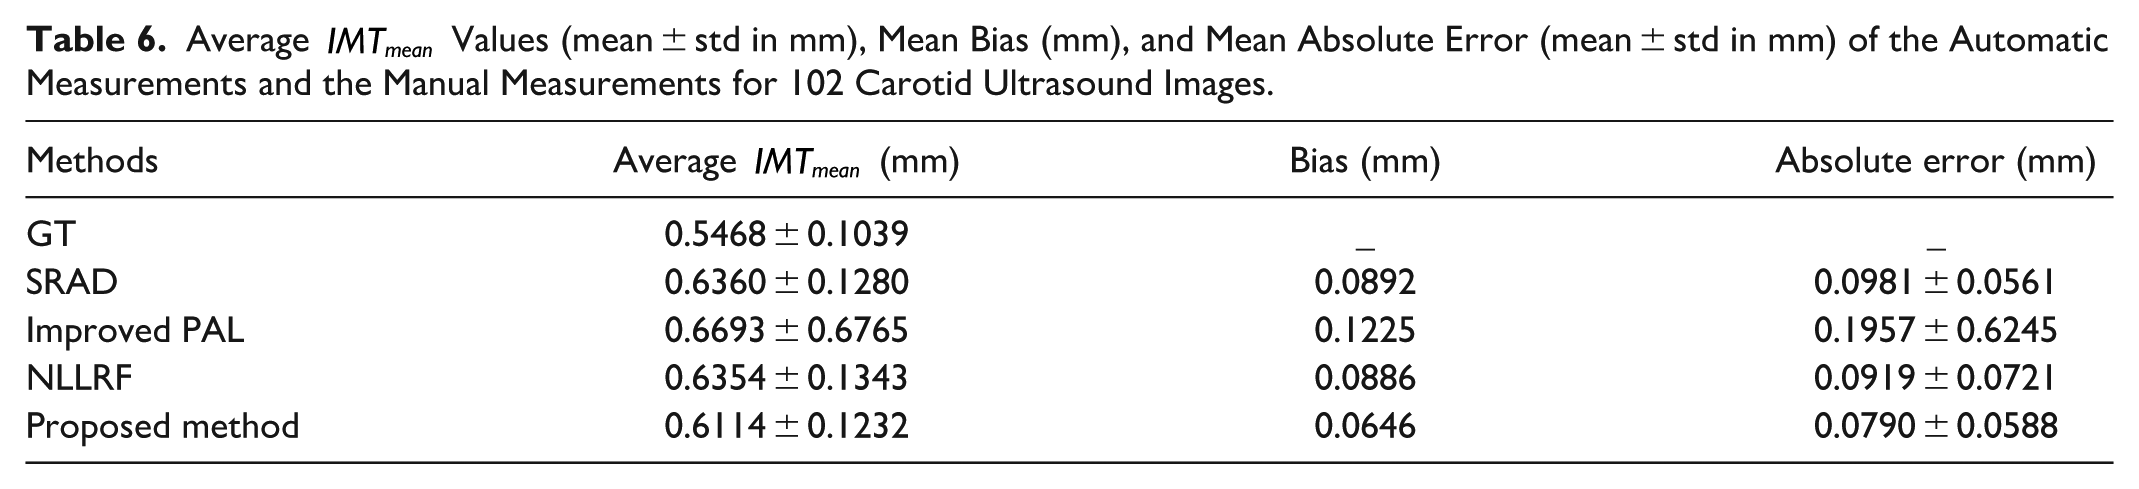
The preprocessing for the carotid ultrasound images can lay the foundation for the IMT measurements. To further evaluate the performance of methods, an advanced automatic segmentation algorithm based on the Otsu’s method and adaptive wind driven optimization 49 is used to measure the IMT in processed CCA ultrasound images obtained by different preprocessing methods. Moreover, the average of the experts’ manual measurements is used as the ground truth (GT) for clinical evaluation of the IMT measurements. 50 Thus, two vascular experts performed the manual measurements for the IMT. Each expert (Ex1 and Ex2) made two manual measurements for every image from 102 CCA ultrasound images spaced at least 20 days apart, implying 408 measurements. Each expert’s result was obtained by averaging the two manual measurements calculated by the expert. A GT was obtained by computing the average of the two experts’ results.
Furthermore, in the clinical application, the commonly used metric for IMT measurements is the mean absolute distance (MAD). In MAD metric, the

where
To validate the accuracy of the automated IMT measurements in processed CCA ultrasound images obtained by different methods, we need to obtain the bias between the measured
Average
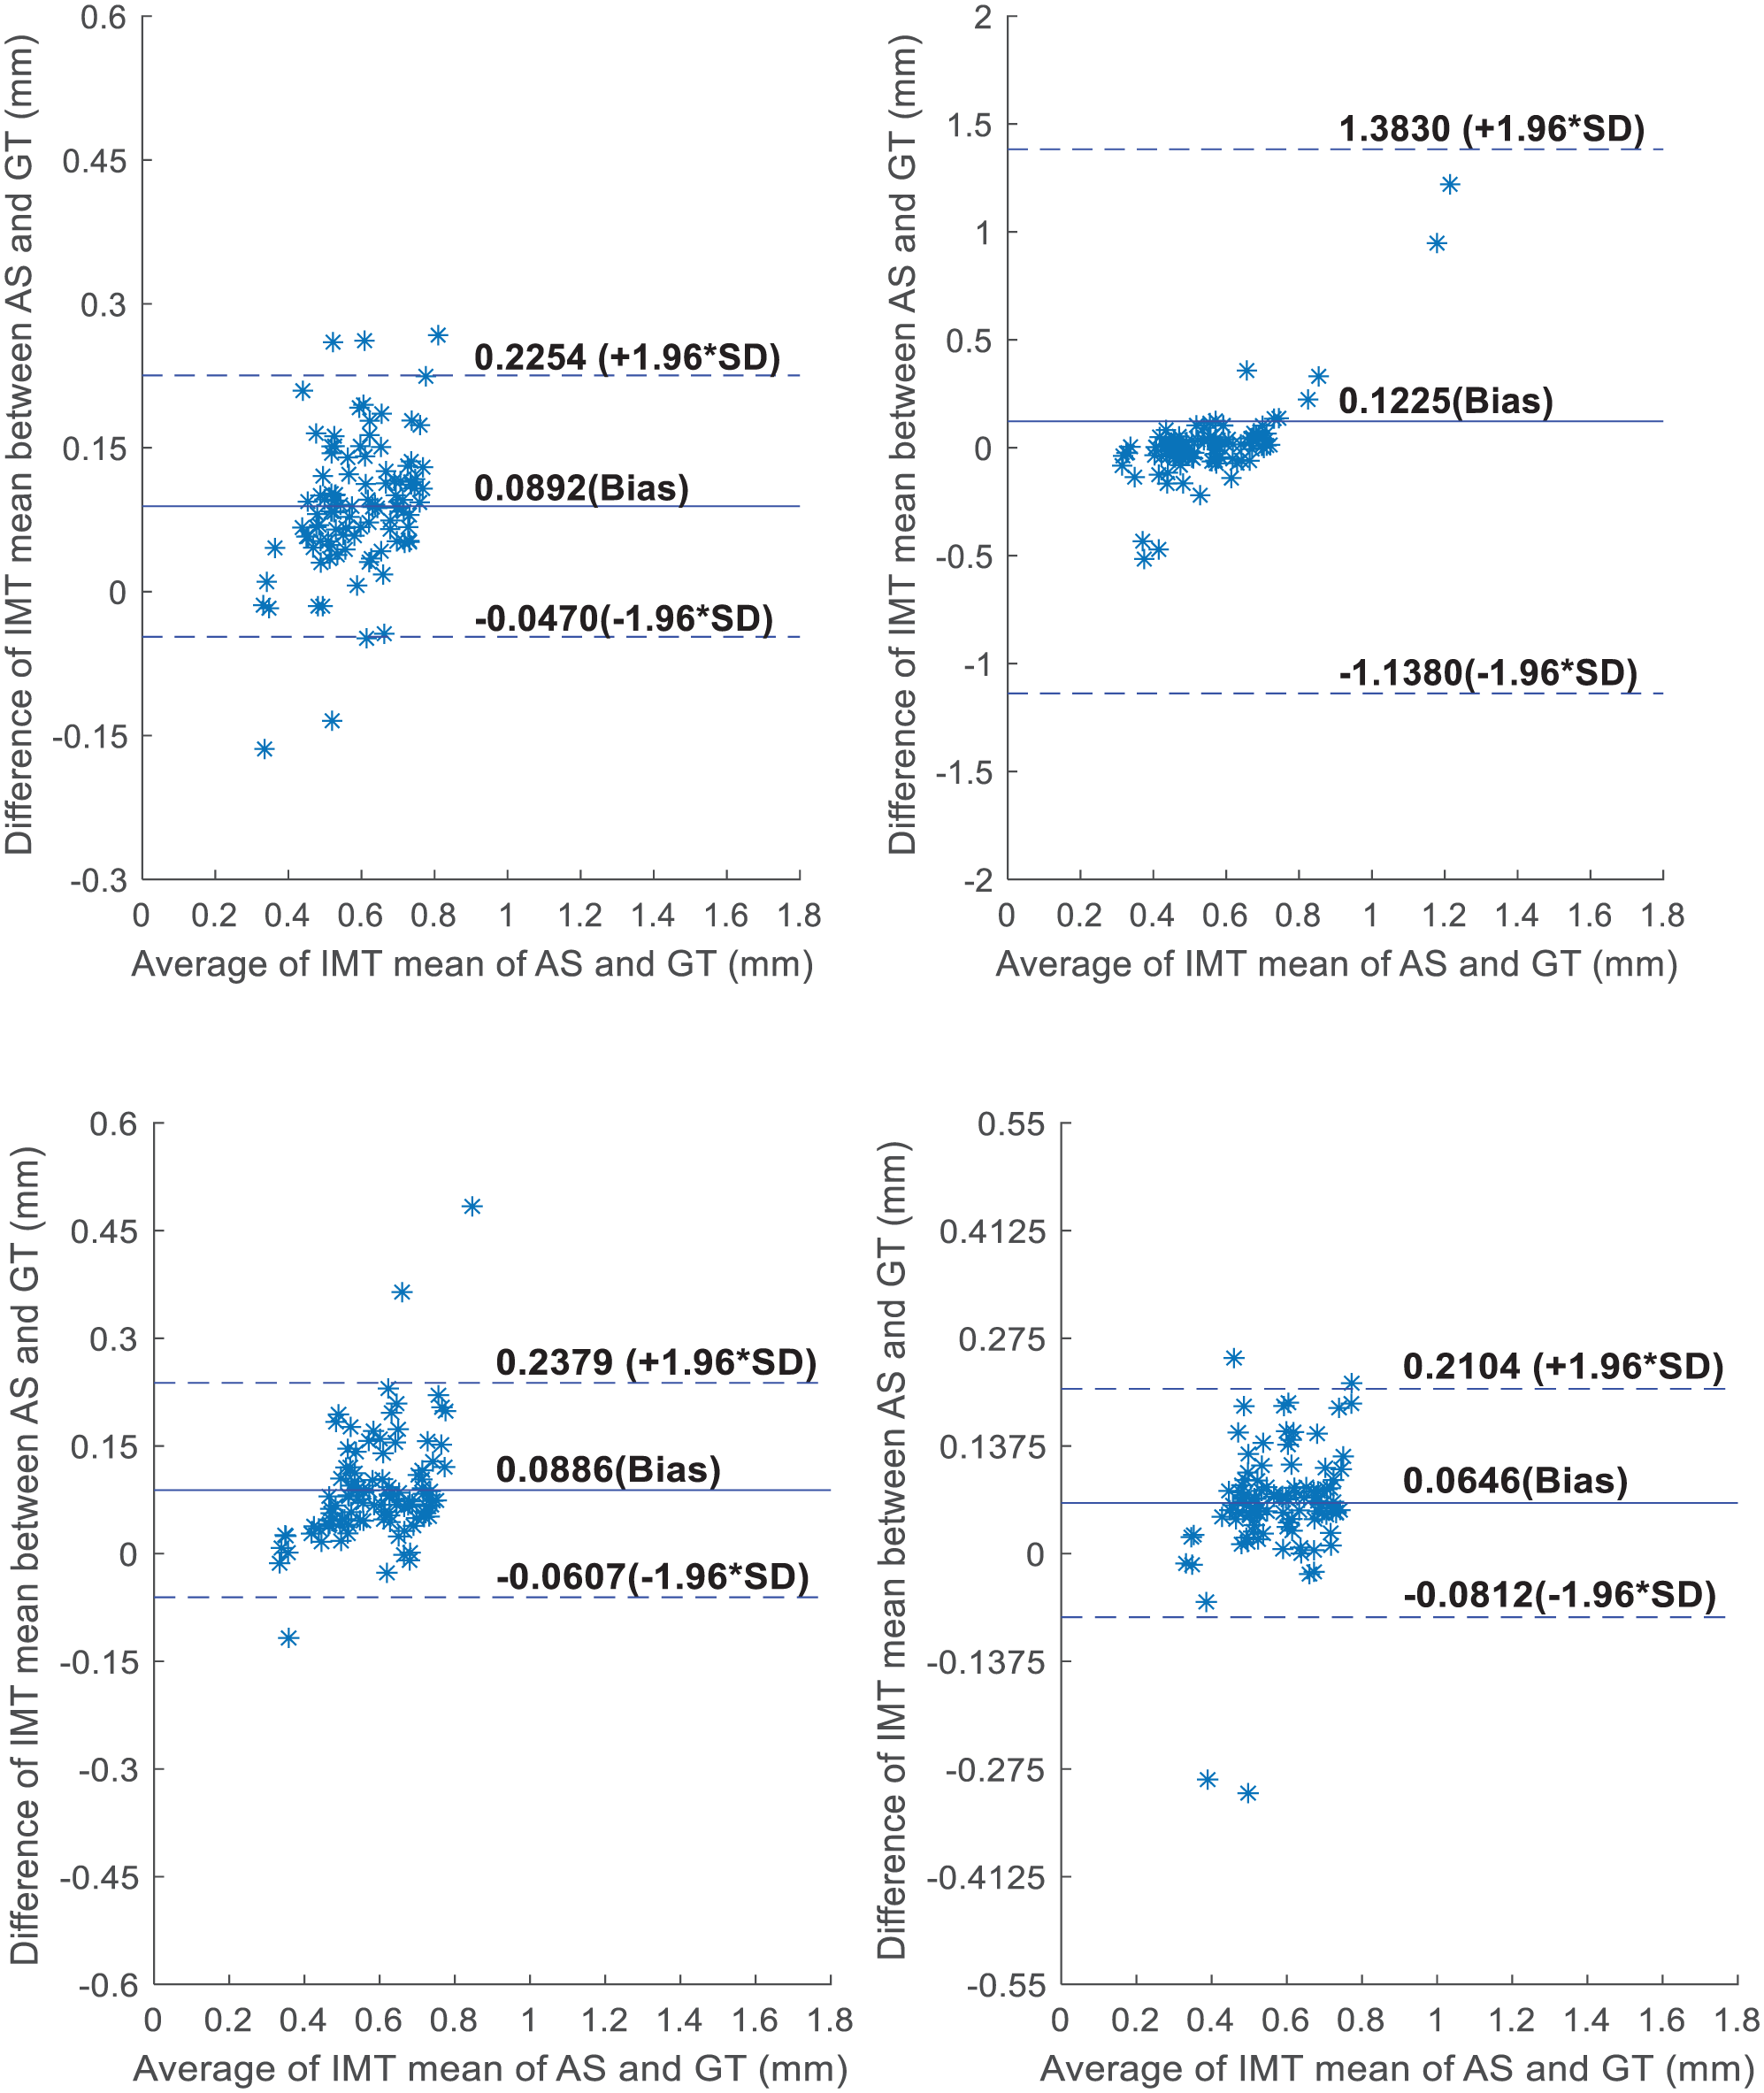
Bland-Altman plots comparing GT measurements with automated segmentation (AS) in 102 processed CCA ultrasound images obtained by SRAD, Improved PAL, NLLRF, and Proposed method (GT corresponding to the AS). (a) SRAD. (b) Improved PAL. (c) NLLRF. (d) Proposed method.
Conclusions
The objective of this study is to develop an advanced preprocessing technique for CCA ultrasound images. It has been always a difficult issue for maintaining the balance between the contrast enhancement and despeckling. To achieve a good performance in enhancing the IMC regions and suppressing the speckle noise in CCA ultrasound images, in this paper, we proposed a preprocessing method that makes full use of the advantages of NSST and PAS metric. First, the CCA ultrasound images are decomposed into the NSST domain with a low-frequency sub-band and several high-frequency sub-bands. Next, an adaptive threshold method is used to suppress the speckle noise in the high frequency sub-band image. Then, the inverse NSST transformation is used to reconstruct the processed image. Finally, an edge enhancement method based on PAS metric is used for enhancing the edges in the reconstructed CCA ultrasound images.
The proposed approach was tested using 102 CCA ultrasound images. The results of proposed method were compared with other state-of-the-art methods such as SRAD, Improved PAL and NLLRF. Objective evaluation metrics such as average CNR values, average
In the future, we will focus on developing a novel adaptive preprocessing method that does not increase time complexity. Additionally, a broader range of ultrasound images from various human organs should be tested to validate the performance of the proposed method.
Footnotes
Declaration of Conflicting Interests
The authors declared no potential conflicts of interest with respect to the research, authorship, and/or publication of this article.
Funding
The authors disclosed receipt of the following financial support for the research, authorship, and/or publication of this article: This work was supported by the Yunnan Fundamental Research Projects (grant No. 202501AT070456) and the Talent Introduction Project of Scientific Research Foundation of Yunnan University of Finance and Economics (grant No.2023D49).