






Abstract
Research shows that many academically accomplished students from disadvantaged backgrounds are not identified for gifted and talented programs. This study investigates a large sample of more than 10,000 students that took both the Cognitive Abilities Test (CogAT) and the American College Testing (ACT) Aspire test. We examined test similarities and differences with an eye to widen the net for gifted identification in practice. This study demonstrates that the ACT Aspire and CogAT have a significant overall correlation of r = .59. However, the correlation varies across cohorts noticeably from r = .72 to r = .46. This variation in correlations and inconsistency in the predictive nature of diversity of both tests across cohorts suggests greater caution in the interchangeable use of the ACT Aspire and CogAT as gifted indicators. Our findings support the practice of using more than one test as part of the identification process.
There is a growing body of literature showing a noticeable disparity in the identification of students for gifted and talented (GT) services across the United States (e.g., Hoxby & Avery, 2013; Plucker & Peters, 2016; Wai & Worrell, 2020). A recent study in Arkansas showed that around 30% of students among the top 5% of scorers on statewide achievement tests were not identified for GT programs (Tran et al., 2021). Across different states, there are different policies to identify GT students with varying effectiveness. Using universal screening (Card & Giuliano, 2016) by leveraging a state standardized achievement test can improve the identification of talented and high-achieving students from low-income backgrounds (Tran et al., 2021). When coupled with local norms for selecting the highest achieving students relative to their opportunity to learn (e.g., comparing students at a similar level of family income or local context), this might lead to a wider and more inclusive group of talented students (Peters et al., 2021).
Moreover, as all achievement and reasoning tests that measure verbal and mathematical abilities tend to be highly correlated (e.g., Gómez-Veiga et al., 2018; Naglieri & Ford, 2003; Peng & Kievit, 2020; Wai et al., 2018), schools can use either achievement or reasoning test scores as an objective indicator for GT identification. And, in practice, schools often need to incorporate any additional data already available. However, Lohman (2005) presciently warned about the potential loss of a significant number of academically talented students in GT programs if schools only consider achievement or ability test score identification tools in isolation. Moreover, if schools intend to widen the pool of talented learners from diverse backgrounds, they should use scores from more than one test as objective indicators to ensure a more universal screening process (Lakin, 2019). Additionally, ability tests are expensive, and states may already administer achievement tests. The use of achievement test scores for initial screening of GT placement makes sense, as this is a lower cost option for universal screening that is implemented frequently. This practice was the focus of this study.
We examined the overall correlation between the ACT Aspire and CogAT tests in a sample of approximately 10,000 students in Arkansas to understand the suitability of interchanging use of these assessments. Further, we investigated how each test varies in identification by students’ gender, race/ethnicity, free and reduced lunch (FRL) status, and English Language Learner (ELL) status. This investigation also explored the results of GT identification under both assessments on different patterns of diversity. The overarching goal of this study was to explore if the tests differed in predicting diversity and inclusiveness and what happened if the two measures were considered together.
Underrepresentation of Students in GT Programs
GT programs are advanced educational opportunities offered for students typically with high cognitive abilities and potential for high performance (Assouline et al., 2015; Lubinski & Benbow, 2000; Peters et al., 2022), with the broad aim to ensure that students are appropriately placed where their current learning rate and academic preparation is matched to the rigor and pace of coursework. GT programs typically offer accelerated and/or academic enrichment coursework (Subotnik et al., 2011). According to 2017–2018 data from the U.S. Department of Education’s Office for Civil Rights (2018), 6.54% of the total U.S. student population were placed in GT programs. Researchers often focus on how gifted education addresses the learning needs of GT students, which can lead to the attainment of optimal educational outcomes (Assouline et al., 2015; Gentry, 2009; Lubinski & Benbow, 2006). This education may happen in many forms, including acceleration, curriculum compacting, or enrichment programs (Assouline et al., 2015; Gentry, 2009; Reis & Renzulli, 1991; Wai et al., 2010). To achieve these gifted education objectives, researchers have consistently emphasized the importance of a transparent, research-based, and purposeful identification process (Hodges et al., 2018).
Based on typically suboptimal identification methods in practice, fairness and equity of identification for GT programs are sometimes questioned. Yoon and Gentry (2009) expressed concerns about inequitable representation in GT programs. Additionally, Card and Giuliano (2016) along with many other scholars, noted that students in the U.S. from low-income families and historically marginalized groups are significantly underrepresented in gifted education programs (Gentry et al., 2019). Recent studies demonstrated that gifted and talented children from low-income families and traditionally underrepresented communities were less likely to reach their full potential when compared to their peers with similar talents, higher income backgrounds, and other racial/ethnic backgrounds (e.g., Hoxby & Avery, 2013; Plucker & Peters, 2016; Wai & Worrell, 2020). Grissom and Redding (2016), applying a conditional probability approach, found that even among students with high standardized test scores, Black students were less likely to be assigned to gifted services. These authors documented that approximately 7% of White students and 14% of Asian Americans were identified as gifted by third grade compared to only 2% of Black and 5% of Hispanic students. According to 2017–2018 school year enrollment data, gifted programs in public schools throughout the U.S. consisted of 58.4% White students, 18.3% Hispanic students, 9.9% of Asian students and 8.2% of Black students, whereas White students represent 47.3%, Hispanic students 27.2%, Asian students 5.2% and African American students 15.1% of total students enrolled in public schools across the country (Office for Civil Rights, 2018).
Additionally, Representation Indices (RI) are used to assess GT identification equity. The indices allow comparisons among student subgroup’s proportion among the identified students to the proportion in the overall population (Peters et al., 2019). Usually, an RI value of 1.0 indicates proportional representation, whereas values below 1.0 suggest underrepresentation, and values above 1.0 indicate overrepresentation. Many studies (e.g., Card & Giuliano, 2016; Peters et al., 2019) have demonstrated underrepresentation of students from disadvantaged backgrounds in GT identification using RI models. Beyond the basic RI, researchers have also used relative risks, odds ratios, and regression-based techniques to investigate disproportionality.
Identification Policies
The Cognitive Abilities Test (CogAT) is one of the most widely used assessment tools used to identify GT students (Kurtz et al., 2019; Lohman & Hagen, 2002; Warne, 2015). Other assessments include teacher rating scales (Alodat & Zumberg, 2018), the SAT (Patterson et al., 2012), the Naglieri Nonverbal Abilities Test (NNAT; Marchesini, 2020), or the Raven’s Coloured Progressive Matrices (Bildiren & Kiziltepe, 2018). These identification tools have significant variation in their correlation with the CogAT (Ozen et al., 2024), thus necessitating the use of more than one instrument if the aim is to widen the net of identification. However, apart from the use of these instruments, there are long-standing debates around the approaches of GT identification, typically around the topics of universal screening, local norms, and nomination.
Local Norms
Local norms refer to the identification of students for GT programs based on norm-referenced interpretations, aligning the selection criteria with the desired level of service (Peters et al., 2021). In contrast to national comparisons or norms produced by test developers, local normative criteria tend to compare students to their immediate peers (e.g., similarity in age, experience, background, learning environment) and nature of the intervention to be provided (Peters et al., 2021; Warne & Larsen, 2022). As local students sometimes do not meet the thresholds of national or other norms, by using local norms teachers can more easily identify the most advanced students with a high likelihood of requiring additional intervention to be challenged when compared to their grade-level peers in the same school (Peters et al., 2021).
On the other hand, national norms suggest using cut scores based on national performance metrics (e.g., Arizona and Georgia refer to nationally normed test scores in GT identification; Peters et al., 2019). National norms are convenient to use because of the nationally representative sample and reference groups. However, Peters et al. (2019) noted two specific issues regarding their use. First, national norms may lead to inequitable identification because schools are often segregated by factors like income and race/ethnicity. Second, there may be a possible conflict with the U.S. federal definition of giftedness, which focuses on comparisons based on experience and environment rather than age-based norms.
Recent research supports the use of local norms in conjunction with universal screening methods to identify gifted learners to help provide greater representation of disadvantaged student populations in gifted programs (Peters et al., 2019). Peters et al. (2021) showed a 213% increase of African American students and a 270% increase of Hispanic students in a district’s GT program when local norms were used instead of national norms. In another study of 10 U.S. states, Peters et al. (2019) showed a significant improvement of Hispanic and Black students’ representation in GT programs using local norms. Additionally, Carman et al. (2018) found that Hispanic and Black students qualified for gifted programs at the highest rate when they were tested based on school-level norms and at the lowest rate when national norms were used.
However, use of local norms in school districts may also create disparities, whereby high-performing students in competitive schools may not qualify and lower scoring students in less competitive schools are identified. According to Carman et al. (2018), disparaties in the quality of services provided and appropriate challenges based on students’ developed abilities can be an unintended result of using local norms. Ultimately, the primary aim of local norms is to aid students’ eventual performance at state or national levels as they move through K–12 education and beyond (Wai & Worrell, 2019).
Reasoning Versus Achievement Tests
Achievement tests are commonly used to measure grade-level proficiency in subjects such as math or science (Sussman & Wilson, 2019). According to May et al. (2009), standardized achievement tests may be suitable for evaluating the impacts of interventions where the goal is to increase grade-level proficiency. For example, some use the ACT Aspire, which is described as a summative assessment of student achievement in English, reading, writing, math, and science, as an achievement test (Williamson, 2019). The ACT Aspire includes a vertically scaled battery of achievement tests designed to measure student growth in a longitudinal assessment system for Grades 3–10 (ACT Aspire, n.d).
All achievement and reasoning tests that measure developed verbal and mathematical skills tend to be highly correlated (Peng & Kievit, 2020; Wai et al., 2018; Zins & Barnett, 1983). According to Anastasi (1984), both ability (or aptitude) and achievement tests can be considered as tests of developed ability, and they occupy adjacent positions on an assessment continuum. She also observed that the source of debates that frame ability versus achievement as adversarial is an “indestructible strawperson,” a misleading but persistent dichotomy between ability and achievement tests.
Regarding empirical evidence, Lohman (2005) demonstrated a correlation of r = .60 between a nonverbal ability test and a concurrently administered math achievement test. Naglieri and Ronning (2000) found a correlation of r = .56 between the NNAT and measures of reading in the Stanford Achievement Test (9th ed).
Still, none of these correlations are perfect. This is also true for academic achievement tests such as the Trends in International Mathematics and Science Physics (TIMSS) assessment (Jarvis, 2009) and the SAT-10 (Kong, 2013), intelligence tests (e.g., Naglieri NNAT-2; Lindsey, 2012), as well as alternative measures (e.g., Devereux Student Strengths Assessment; Perham, 2012), which appear to have noticeably weak correlations with reasoning tests such as CogAT. Such contrasting scenarios create an assumption that there is also likely variation at the local level, and this variation is important to help GT coordinators make more effective GT placement decisions. Therefore, we investigated test similarities and differences as well as their prediction of diversity and inclusiveness with an eye to widen the net of GT identification. We sought to answer the following research questions using a sample of more than 10,000 students in the state of Arkansas:
What is the correlation between the ACT Aspire and CogAT? How does this relationship vary by student demographics (e.g., gender, race/ethnicity, FRL, ELL, GT status)?
How does diversity in GT identification differ when using the ACT Aspire versus the CogAT?
Methods
Data and Sample
Anonymized student-level assessment and demographic data were used and provided by the Arkansas Department of Education. Publicly available district-level characteristics were then matched with student-level data. Including data from 15 school districts, we examined two cohorts of students assessed during the years 2018 through 2022. Cohort 1 (2018–2019 school year) students took the ACT Aspire in Grade 3 and the CogAT in Grade 4 in the 2019–2020 school year. Cohort 2 students took the ACT Aspire and CogAT in the 2021–2022 school year during Grade 4. Notably, the Cohort 2 data was collected during a period of educational disruptions due to the COVID-19 pandemic.
Student Demographic Characteristics
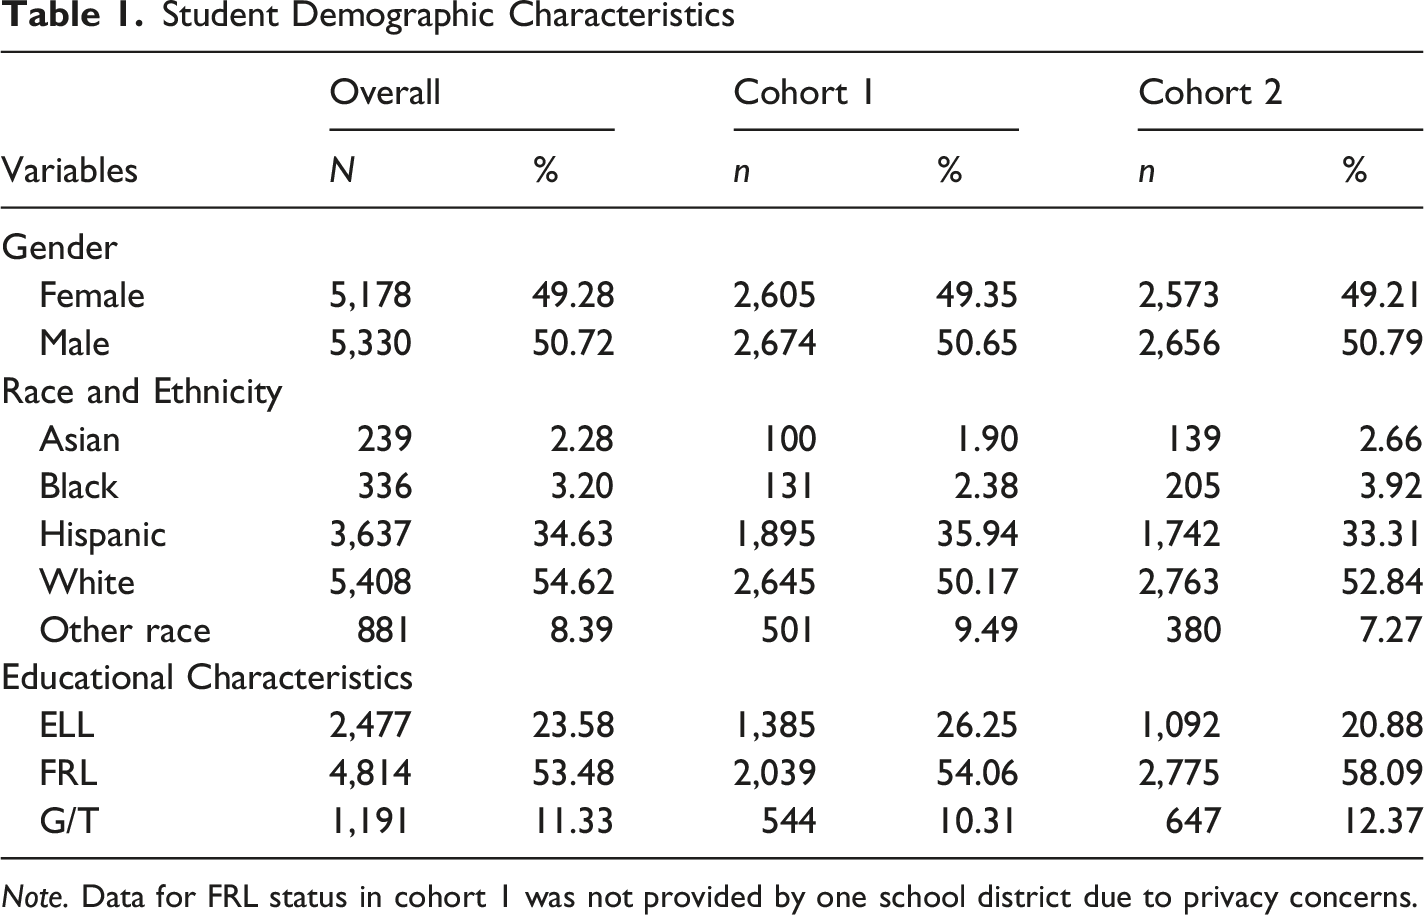
Note. Data for FRL status in cohort 1 was not provided by one school district due to privacy concerns.
Instruments
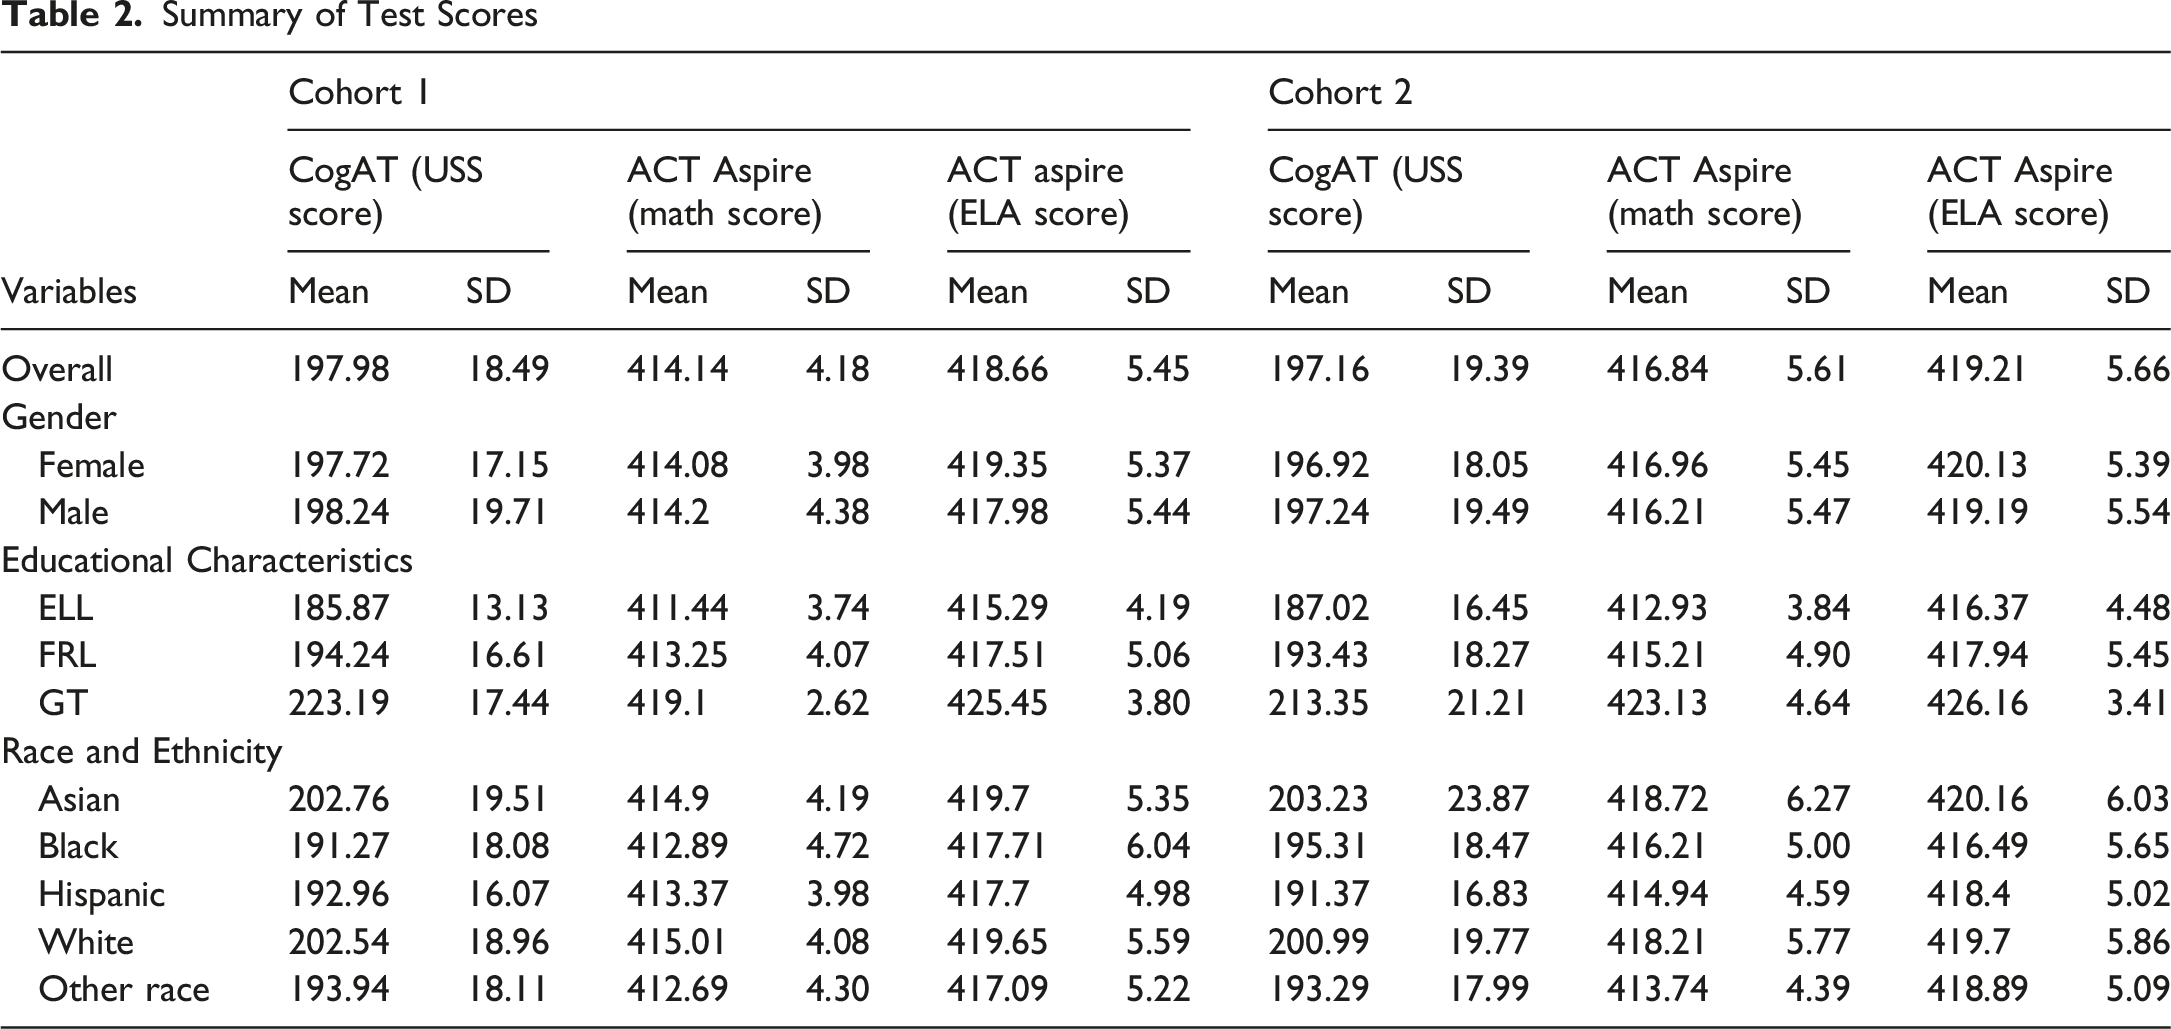
This study used ACT Aspire and CogAT scores, with the former considered an achievement test and the latter an ability test. ACT Aspire is used as a summative assessment of student achievement. The ACT Aspire, as outlined by Williamson (2019), evaluates grade and curriculum related mastery in English, reading, writing, math, and science. The ACT Aspire measures student growth from Grade 3–10 in a longitudinal assessment process (ACT Aspire, n.d). For this study, we used the scale scores shared by the state and standardized them within grade and cohort.
The CogAT measures verbal, quantitative, and nonverbal reasoning skills among K–12 students (Lohman & Lakin, 2010). These components estimate basic reasoning processes that support academic learning. In this study, we used the Universal Scale Score (USS). Even though students completed the full CogAT battery, we only have the USS score, which we consider a limitation of our analysis.
Empirical Approach
Pearson correlations were used to determine the associations between the ACT Aspire and CogAT tests. In addition to testing the correlation between the two tests overall, we inquired how the subtest components of the ACT Aspire, such as math and English language arts (ELA), were associated with CogAT scores. Still, we could not observe the relationship of individual battery or subtest scores of the CogAT with the corresponding ACT Aspire components because of data unavailability. Additionally, we employed Ordinary Least Squares (OLS) regressions to examine whether the correlations between tests remained invariant when controlling for demographics (i.e., students gender, race, FRL, ELL, student academic status, GT status). The following model was used:
The subscript i represents each student who took both the ACT Aspire and CogAT tests in the data from 2018 to 2022. Y i denotes the standardized (within grade and cohort) ACT Aspire scores based on ELA and math scale scores, whereas β 1 refers to the standardized (within grade and cohort) CogAT scores. X i represents student demographic characteristics, including gender, race, FRL, and ELL status. µ tg represents grade level and cohort level fixed effects.
To address the second research question, Linear Probability Models (LPM) were used to examine the likelihood of students scoring above the 90th and 95th percentiles on the CogAT or ACT Aspire tests. LPM is a suitable method to use in this context as linear regression models are applied to binary outcomes (Chatla & Shmueli, 2016). Additionally, in rare-event contexts (e.g., those situations where the outcome is limited, by using fixed effects) the LPM avoids the incidental parameters bias of nonlinear models, keeping all school districts in the analysis (Timoneda, 2021). The results produced from LPM models are easier to interpret (Angrist & Pischke, 2009) as coefficients directly correspond with percentage changes.
The 90th and 95th percentile thresholds were chosen because students who scored in the top 5% of state standardized tests were considered high achievers and could be considered academically talented (e.g., Lakin & Wai, 2020; Wai et al., 2018). Additional studies examining identification scenarios used the 90th percentile to identify students who are advanced learners (see Peters et al., 2019). Therefore, standardized ACT Aspire and CogAT scores were examined separately within each cohort and grade and a local percentile across cohorts was created. Based on this percentile, two new pools of students who scored above the 90th and 95th percentiles on the CogAT and ACT Aspire tests were constructed. As many students may share the same standardized scores near the upper end of distribution, the actual number of students can be slightly more than exactly 5% or 10%. We then examined which test—CogAT or ACT Aspire—more effectively promoted inclusiveness and diversity among students scoring above the 90th and 95th percentiles. The following simplified LPM model was used:
The outcome variable Y it is a binary variable that takes the value 1 if student i in year t scored above the 90th or 95th percentile of the CogAT test or 0 if otherwise. Likewise, to examine inclusiveness of the achievement test, variable Y it takes the value 1 if student i in year t scored at or above the 95th percentile on the ACT Aspire test or 0 if otherwise. The variable X it is a matrix that represents students’ demographic characteristics, such as student ELL and FRL status, gender, or race/ethnicity.
Findings
Summary of Test Scores
Top 5% and Top 10% of the ACT Aspire and CogAT
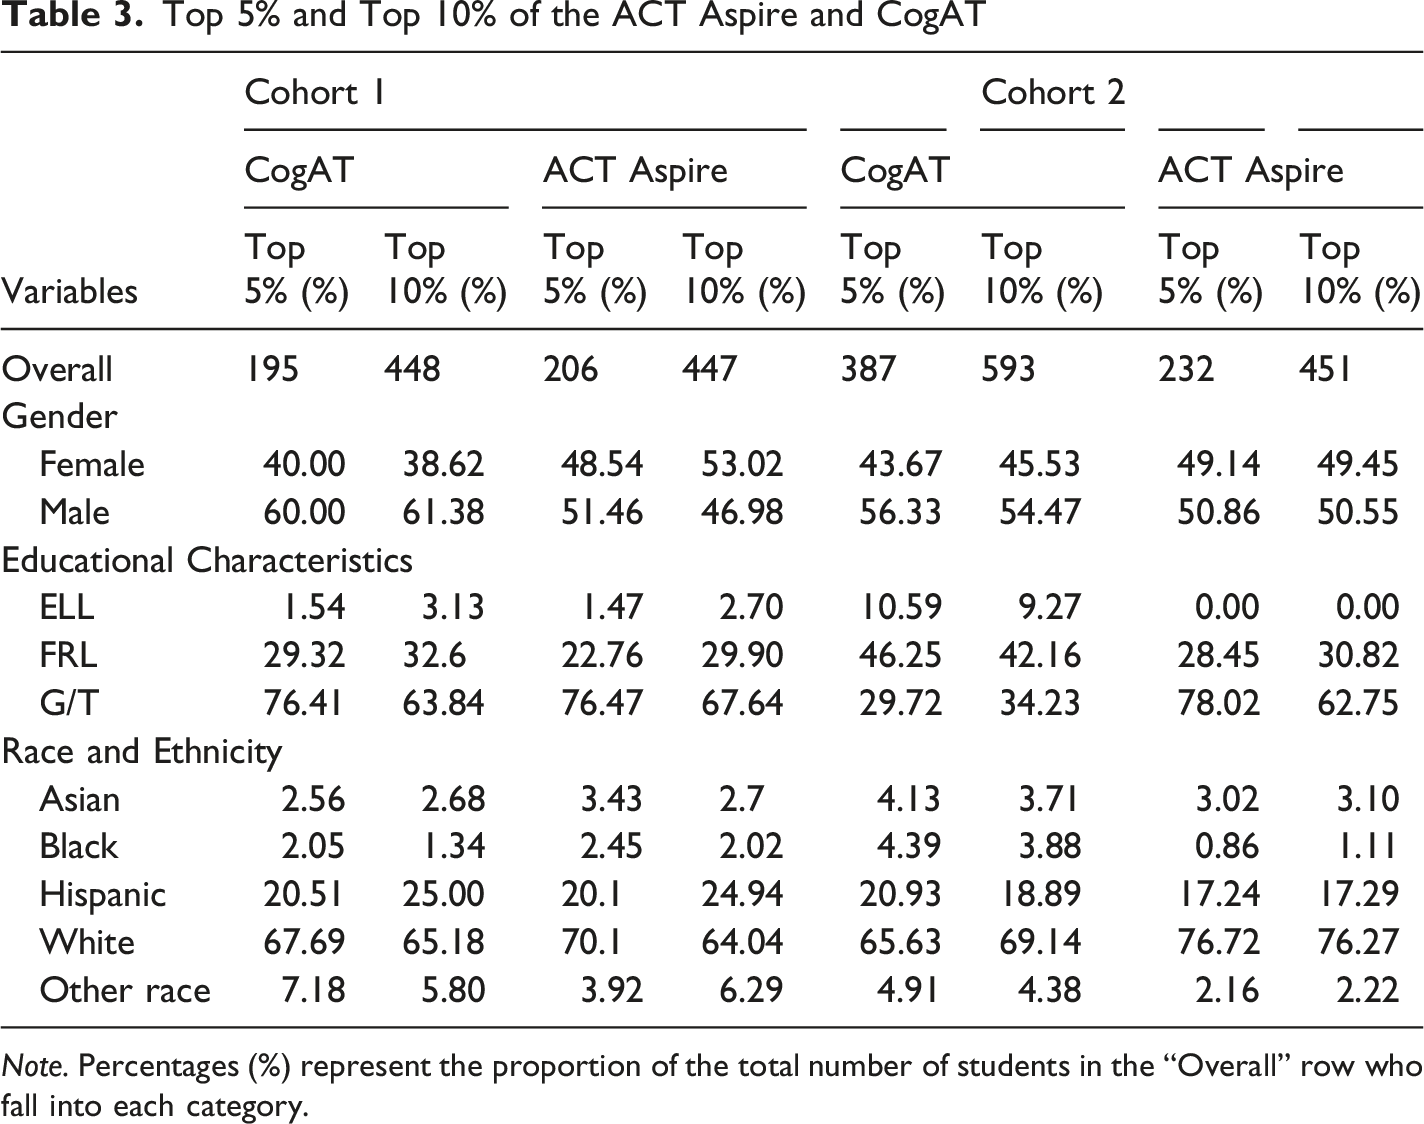
Note. Percentages (%) represent the proportion of the total number of students in the “Overall” row who fall into each category.
Research Question 1: Association Between CogAT and ACT Aspire Scores
Correlation Coefficients Between ACT Aspire and CogAT
*p < 0.05, **p < 0.01, ***p < 0.001
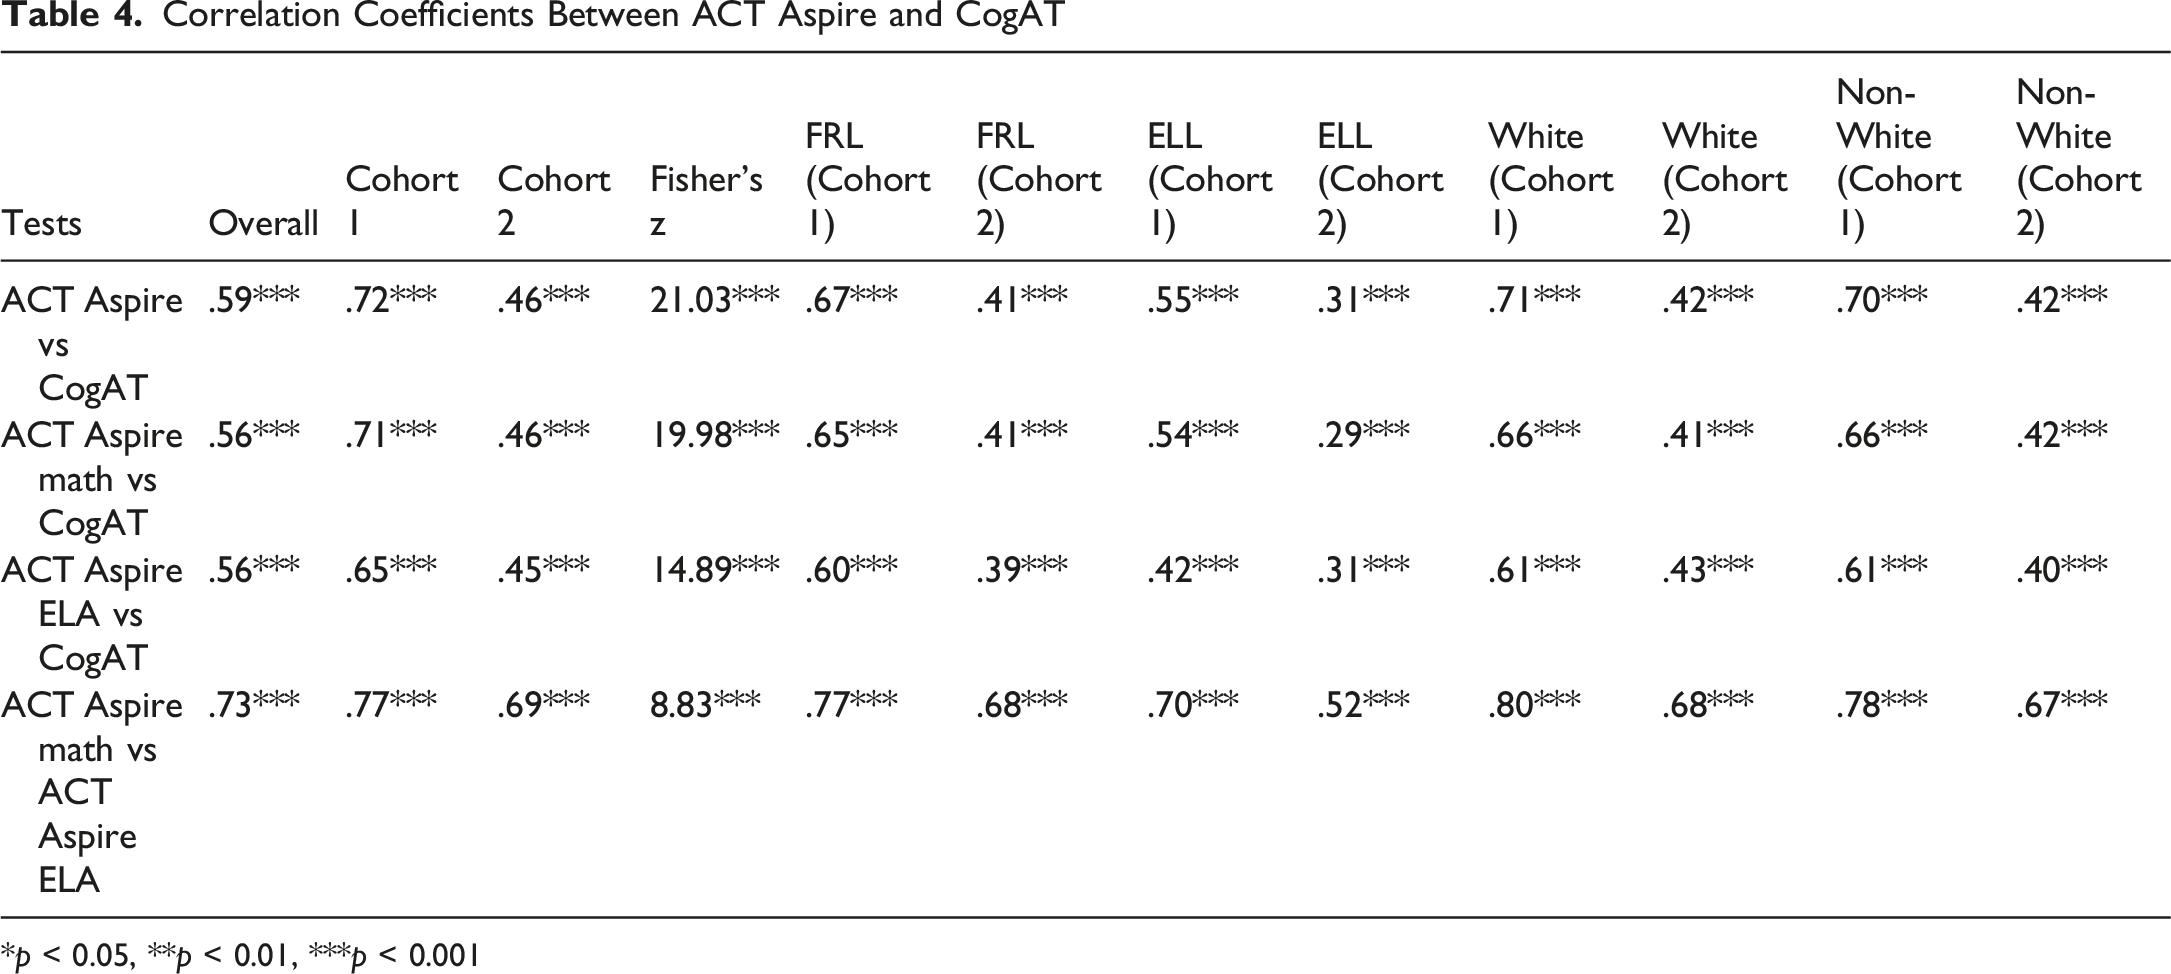
Regarding subgroups, Table 4 demonstrates a consistent trend of correlations across all the metrics for FRL, ELL, White, and non-White students. For example, correlations for FRL students were consistently lower compared to the overall population, whereas ELL students exhibited the lowest correlations across all correlation categories. We found all correlations to be statistically significant.
Results of Linear Regressions for Associations Between the ACT Aspire and CogAT Tests
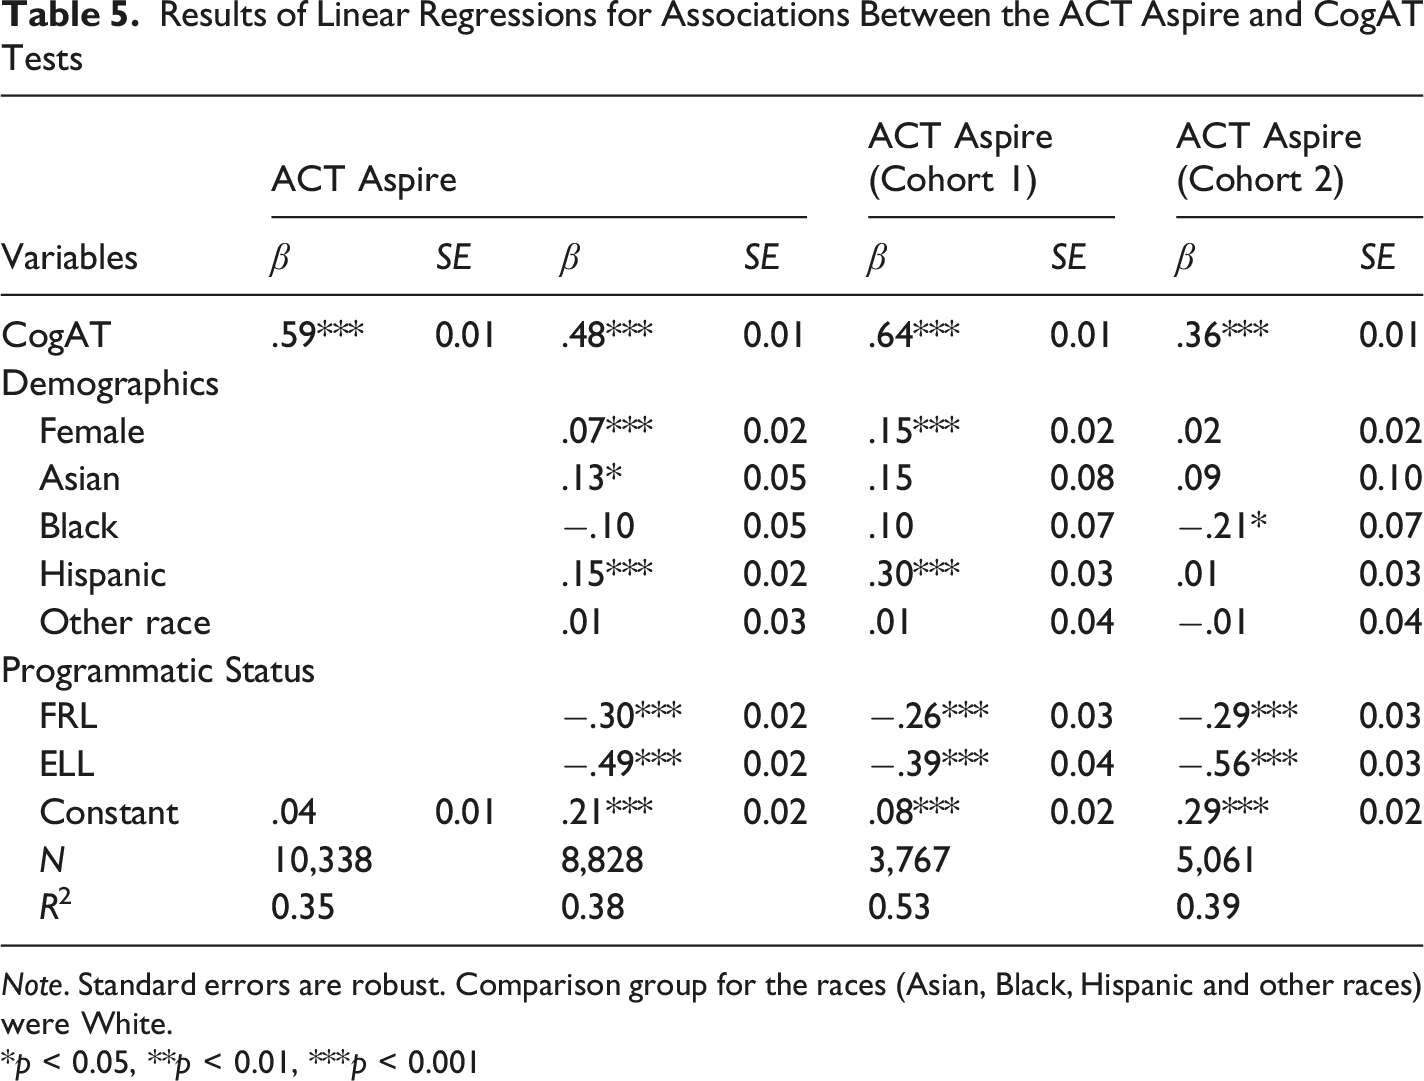
Note. Standard errors are robust. Comparison group for the races (Asian, Black, Hispanic and other races) were White.
*p < 0.05, **p < 0.01, ***p < 0.001
However, the association lessened once control variables were introduced to the regression. Demographic and academic variables were controlled for (i.e., gender, race, FRL, ELL, and GT status). These control variables were included to estimate conditional associations between CogAT and ACT Aspire scores, after adjusting for demographic variables. The inclusion of these controls resulted in a moderated association between the two test scores. A one SD increase in CogAT scores was associated with an increase of 0.39 SD in ACT Aspire scores (p < .001), holding all else equal. Factors like FRL, ELL, GT status, and gender explained significant variations in the relationship between these two tests (p < .001), suggesting that the scores on achievement tests and ability tests may vary depending on student demographic and socioeconomic status.
Next, the analysis was extended to examine the association between these two tests across different cohorts, revealing notable variations as we saw in the correlation results (see Table 4). For Cohort 1, a one SD increase in CogAT scores was associated with an increase of 0.57 SD in ACT Aspire scores (p < .001), holding all else equal. In contrast, Cohort 2 exhibited a weaker association, with a one SD increase in CogAT scores associated with an increase of 0.27 SD in ACT Aspire scores (p < .001), holding all else equal. These cohort-specific findings underscore the potential variability in the relationship between cognitive ability and academic achievement measures across different student groups within the study sample.
Research Question 2: Predictors of Greater Diversity and Inclusiveness
Next, aspects of diversity and inclusiveness under both the ACT Aspire and CogAT tests were examined. Using a conservative approach to identification, students’ likelihood of scoring above the 90th and 95th percentiles of the ACT Aspire and CogAT tests were examined based on their FRL and ELL status, race and gender. For race, we used “White” as the reference category.
We first considered the students who scored above the 95th percentile on the ACT Aspire and CogAT. The analysis revealed intriguing patterns across cohorts. In Cohort 1, we observed no statistically significant differences based on gender and race/ethnicity for either test (see Figure 1). However, FRL and ELL students demonstrated a lower likelihood of achieving top 5% scores compared to their non-FRL and non-ELL counterparts. For example, in Cohort 1, the LPM results indicated that FRL students compared to non-FRL students were four percentage points (pp) and three pp less likely to score above the 95th percentile of the ACT Aspire and CogAT, respectively (p < .001). Similarly, ELL students, compared to non-ELL students, in Cohort 1, were four pp less likely to achieve this benchmark on both tests (p < .001), holding all else equal. Likelihood of Cohort 1 Subgroups to Score in the Top 5% on the CogAT and ACT Aspire Tests. Note. Robust standard errors are in parentheses. Coefficients of Black, Hispanic, Asian, and other races are drawn compared to White as the base or reference category. Bold paths indicate a significant association, while gray paths indicate a path that was not significantly different between the groups. *p < 0.05, **p < 0.01, ***p < 0.001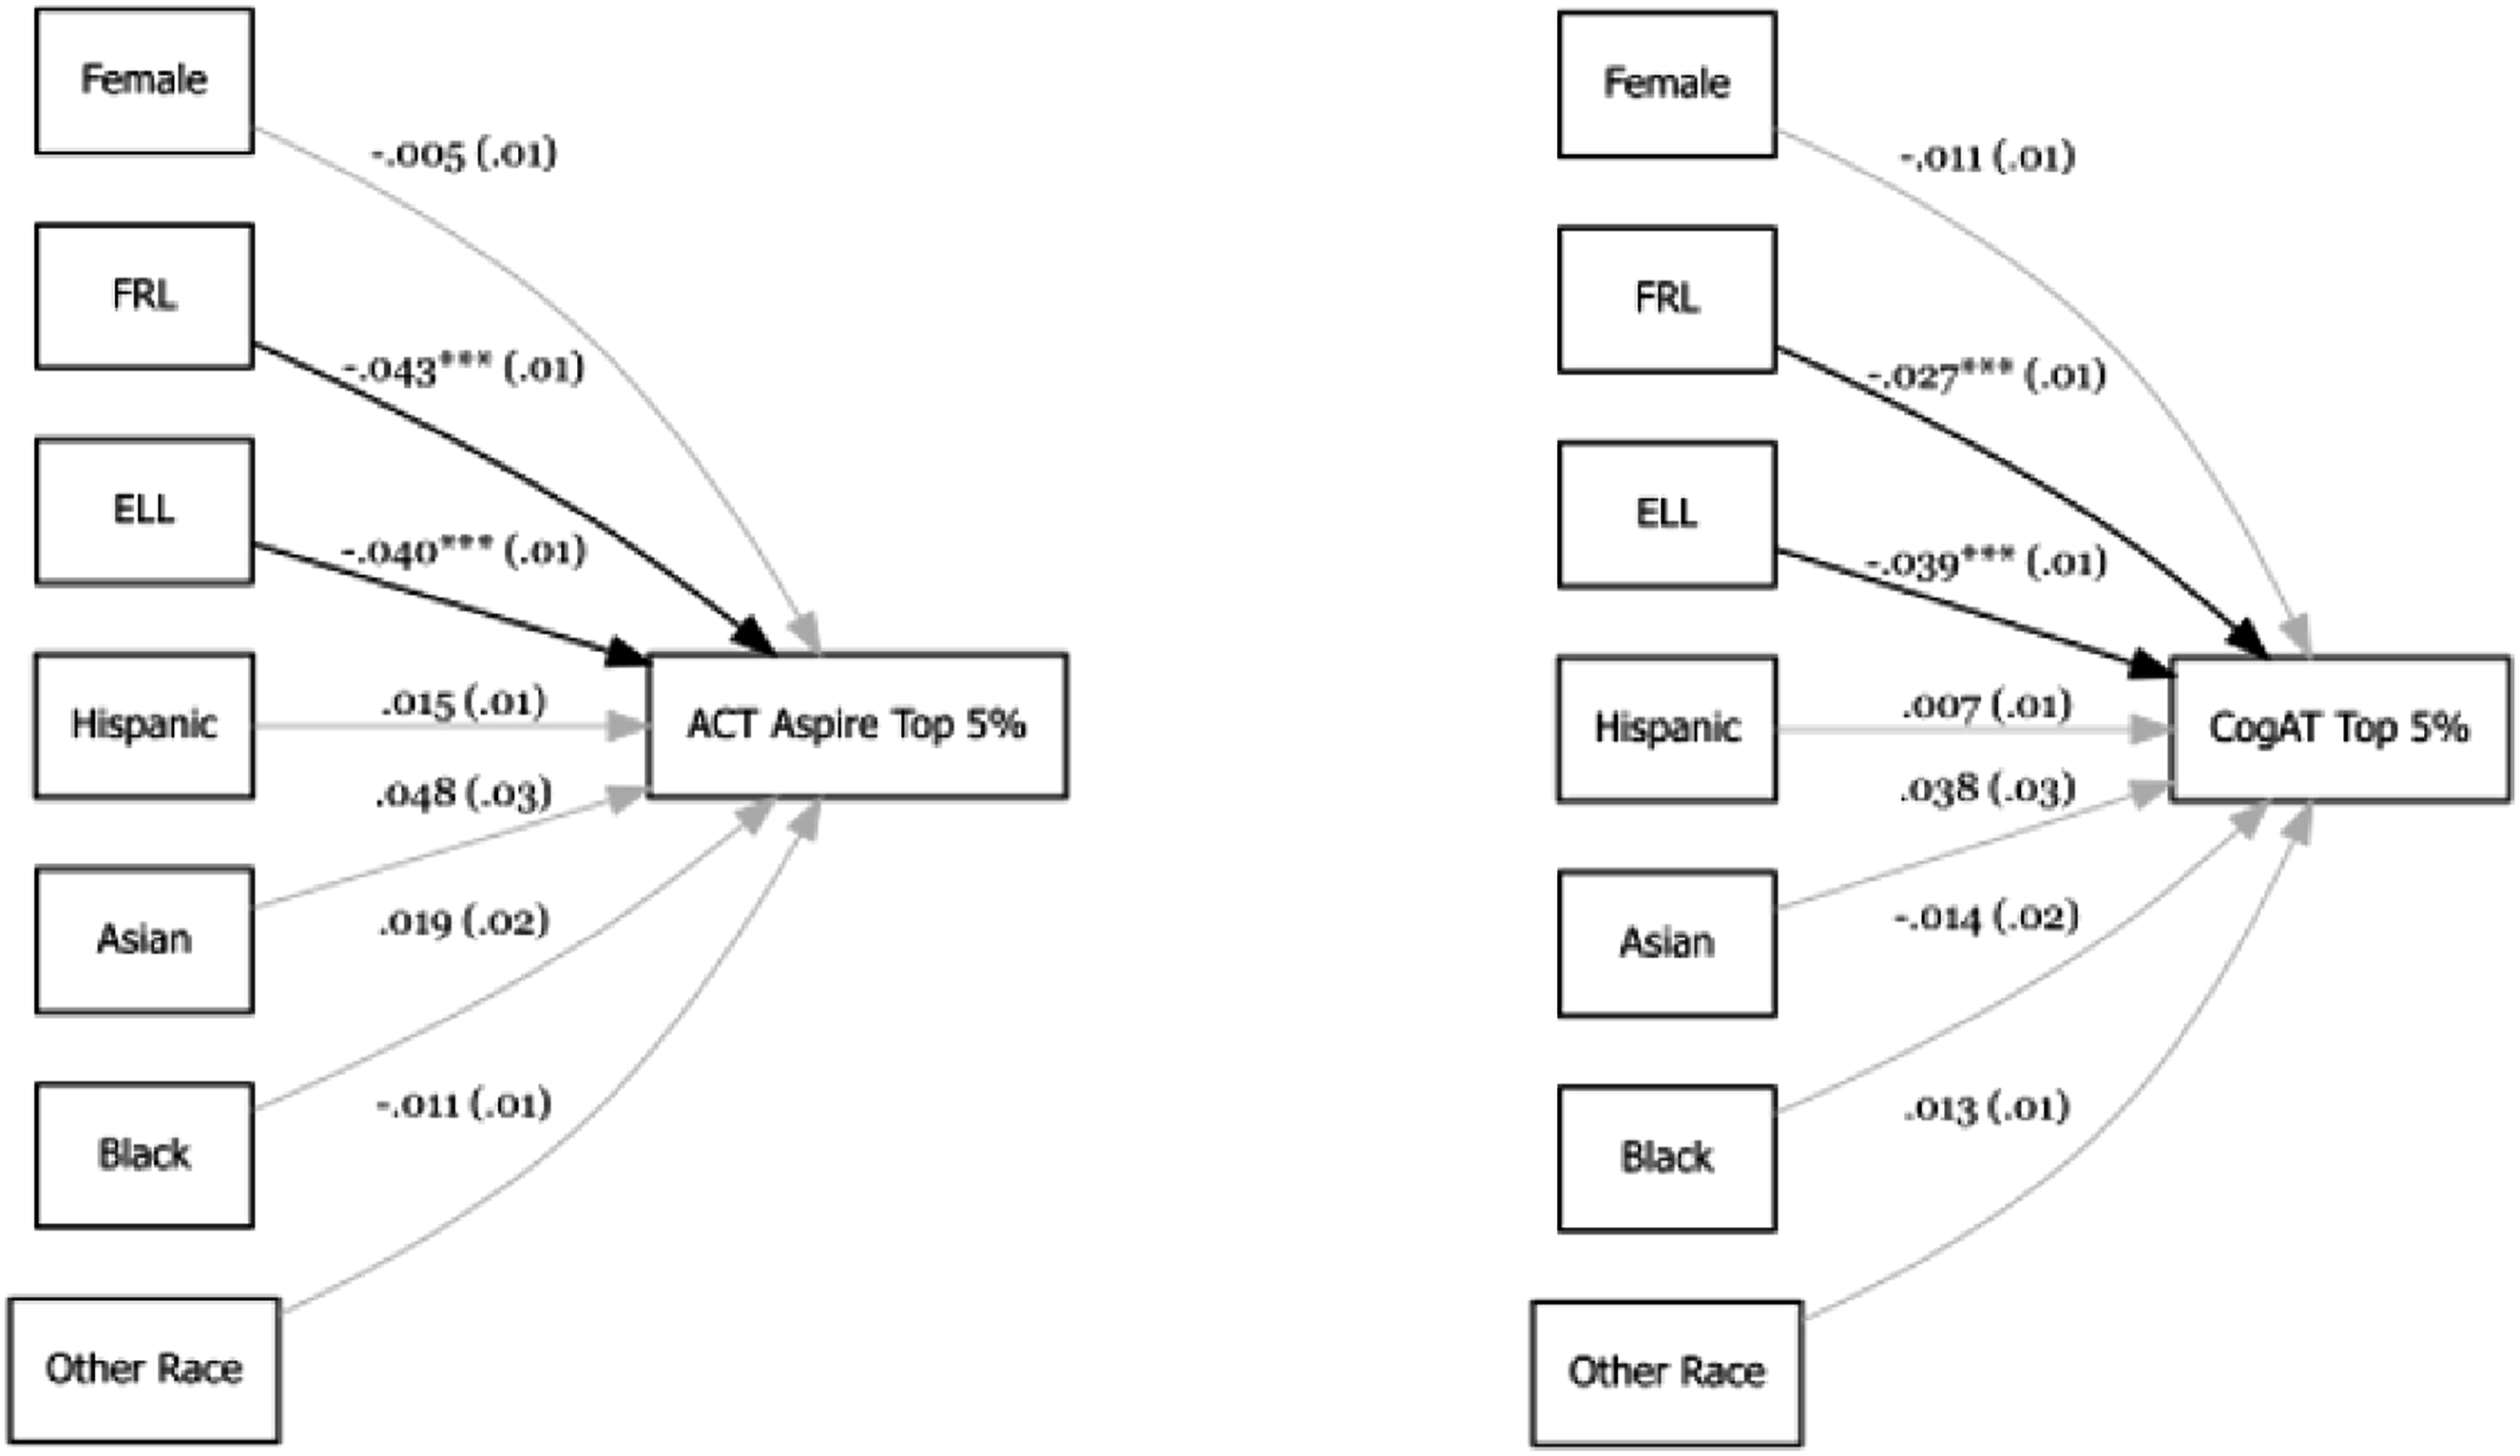
Cohort 2 presented a more nuanced picture. For the ACT Aspire top 5%, in addition to the disparities observed for FRL and ELL students, Figure 2 demonstrated that Black students were four pp less likely than White students to score above the 95th percentile (p < .001). The CogAT top 5% results for Cohort 2 revealed further disparities, with female students, Hispanic students, and students of other races/ethnicities showing a lower likelihood to score in the top 5% of the CogAT (see Figure 2) compared to their respective counterparts. The significance level for these results ranged from 95% to 99%. Likelihood of Cohort 2 Subgroups to Score in the Top 5% on the CogAT and ACT Aspire Tests. Note. Robust standard errors are in parentheses. Coefficients of Black, Hispanic, Asian, and other races are drawn compared to White as base or reference category. Bold paths indicate a significant association, while gray paths indicate a path that was not significantly different between the groups. *p < 0.05, **p < 0.01, ***p < 0.001.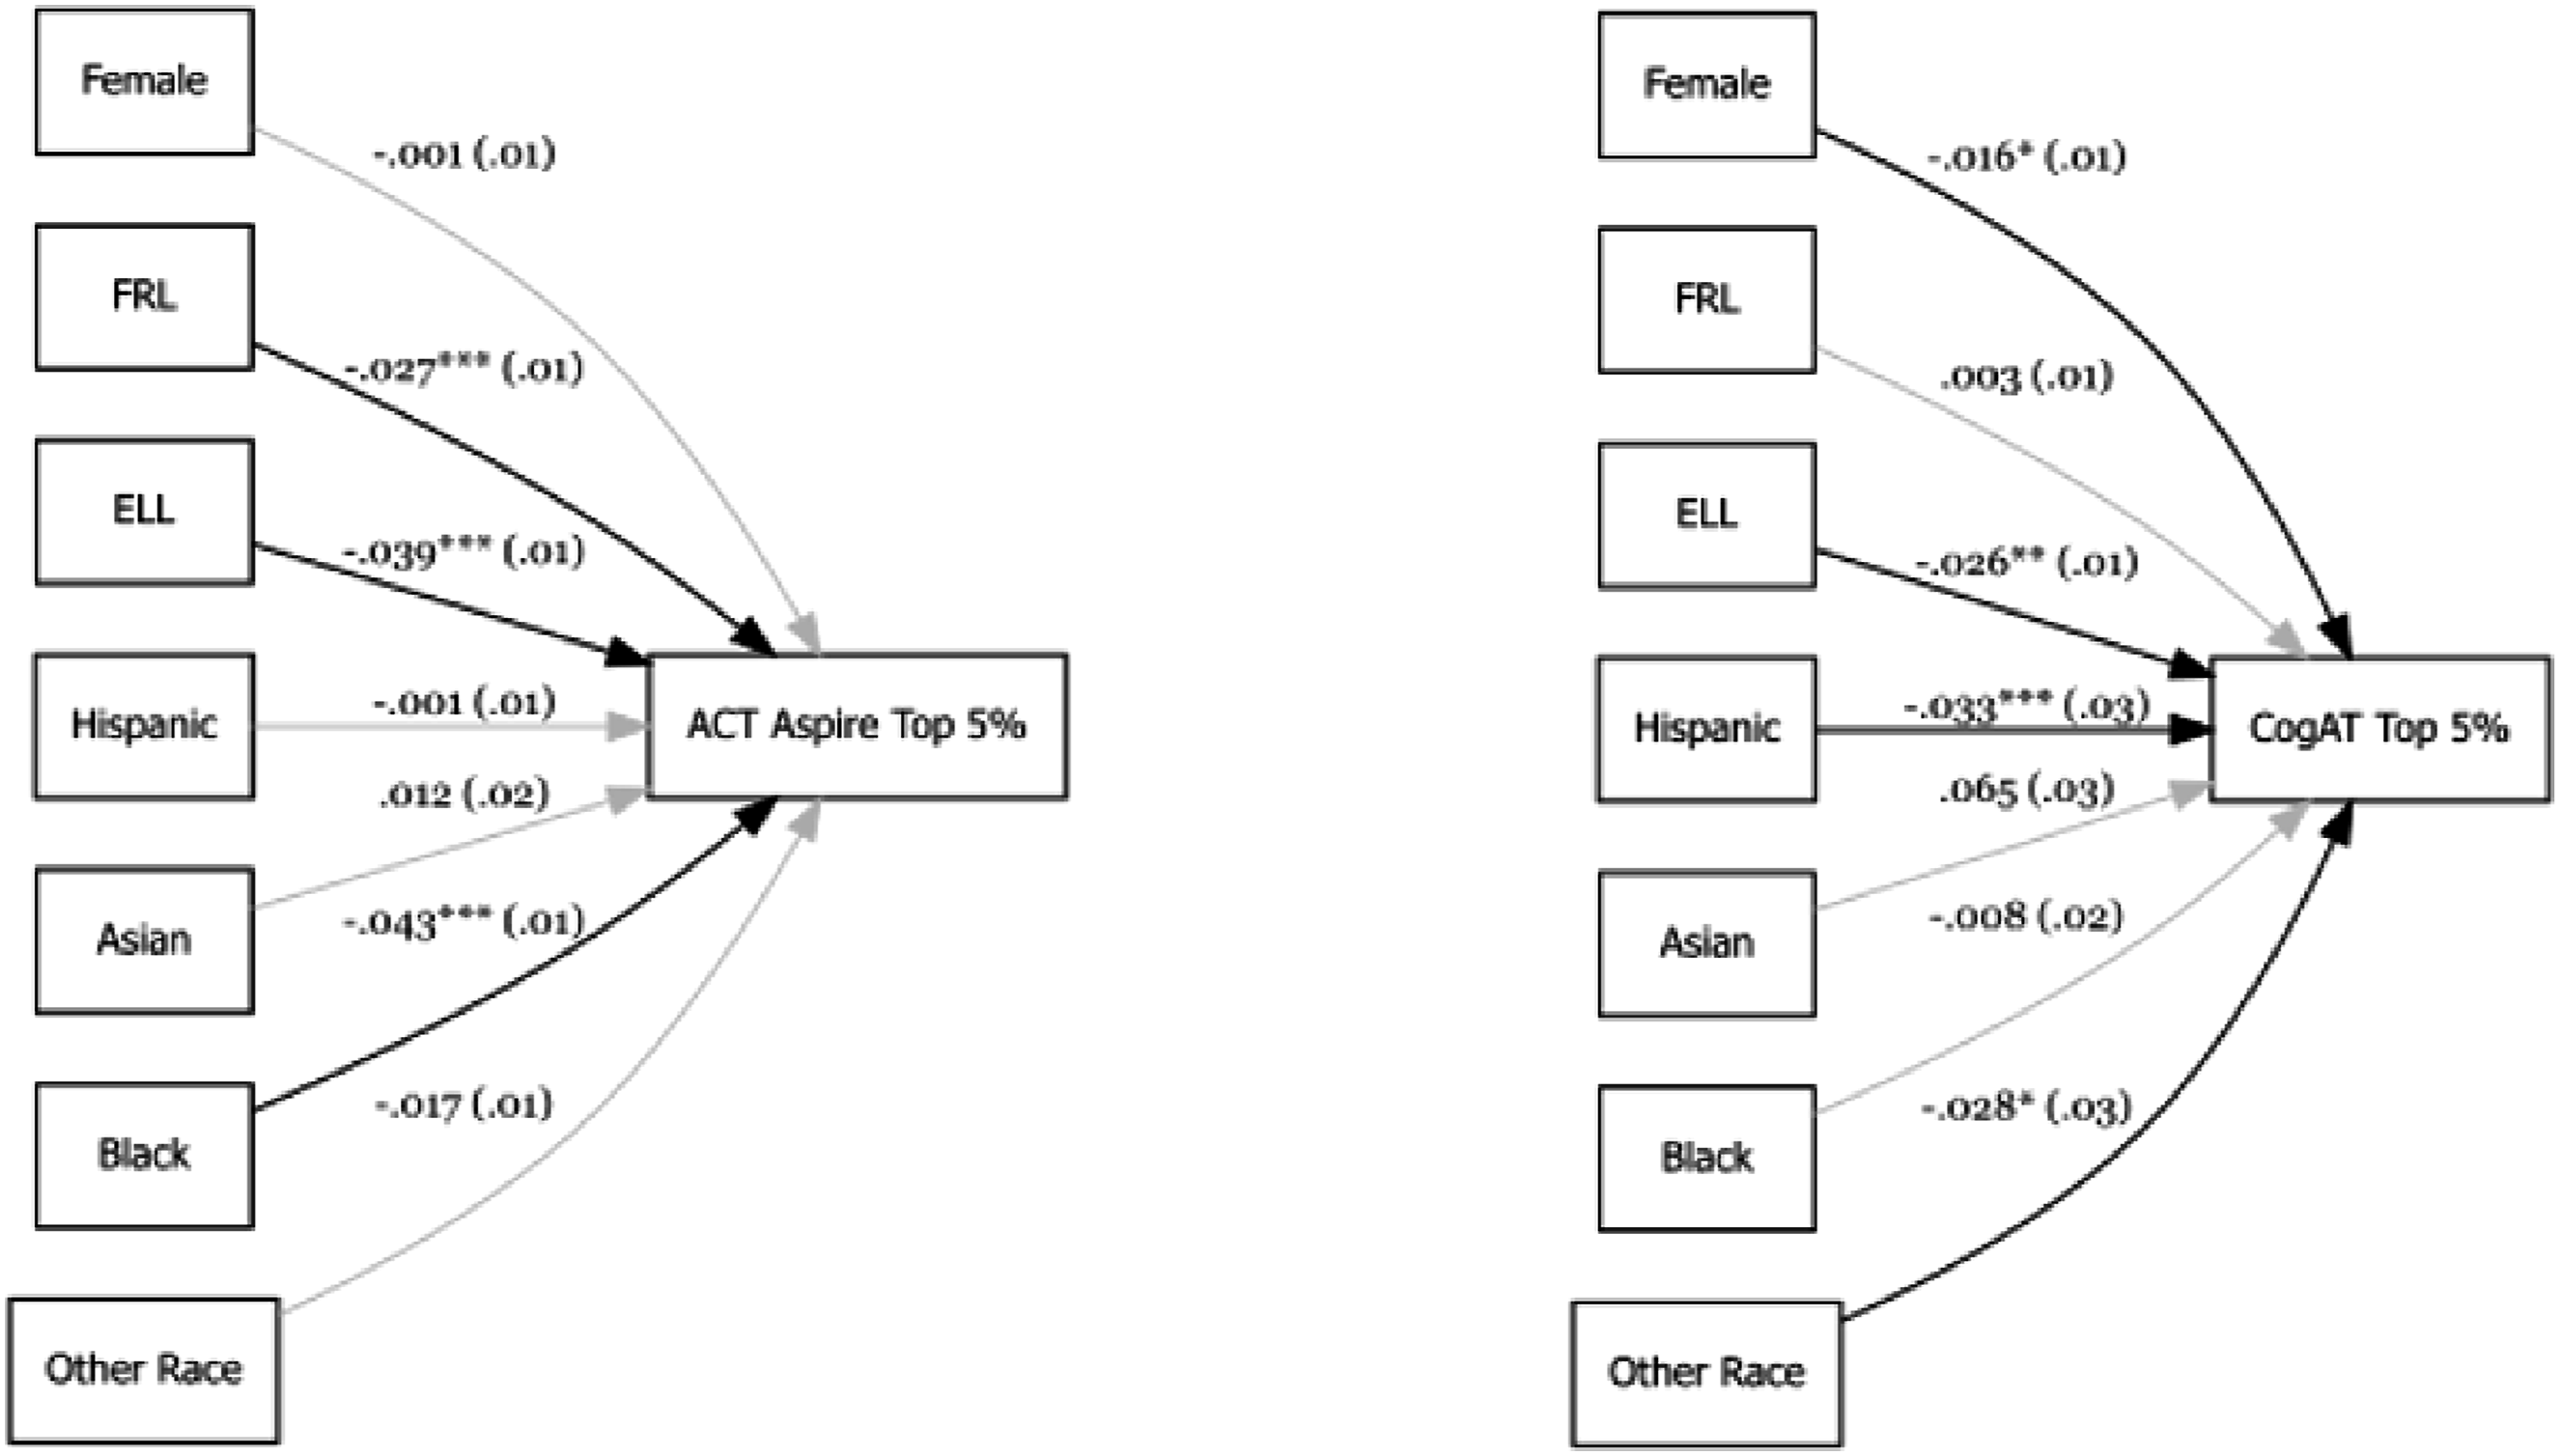
Next, considering the students who scored above the 90th percentile on the ACT Aspire and CogAT tests, almost identical results (as shown in Figures 1 and 2) were observed. In Cohort 1, the ACT Aspire showed statistically significant differences only for FRL, ELL, and Hispanic students. FRL and ELL students were less likely to score above the 90th percentile on the ACT Aspire relative to non-FRL and non-ELL peers (p < .001), whereas Hispanic students showed a higher likelihood of doing so relative to White students (p < .001).
The CogAT results for Cohort 1’s top 10% revealed more widespread disparities. All the subgroups, except for students from “other races” showed statistically significant group differences. Female, FRL, ELL, and Black students appeared to be less likely to score above the 90th percentile on the CogAT test, compared to their respective counterparts. Interestingly, Hispanic students were more likely to score above the 90th percentile compared to White students, mirroring the ACT Aspire results (see Figure 3). Likelihood of Cohort 1 Subgroups to Score in the Top 10% on the CogAT and ACT Aspire Tests. Note. Robust standard errors are in parentheses. Coefficients of Black, Hispanic, Asian and other races are drawn compared to White as base or reference category. Bold paths indicate a significant association, while gray paths indicate a path that was not significantly different between the groups. *p < 0.05, **p < 0.01, ***p < 0.001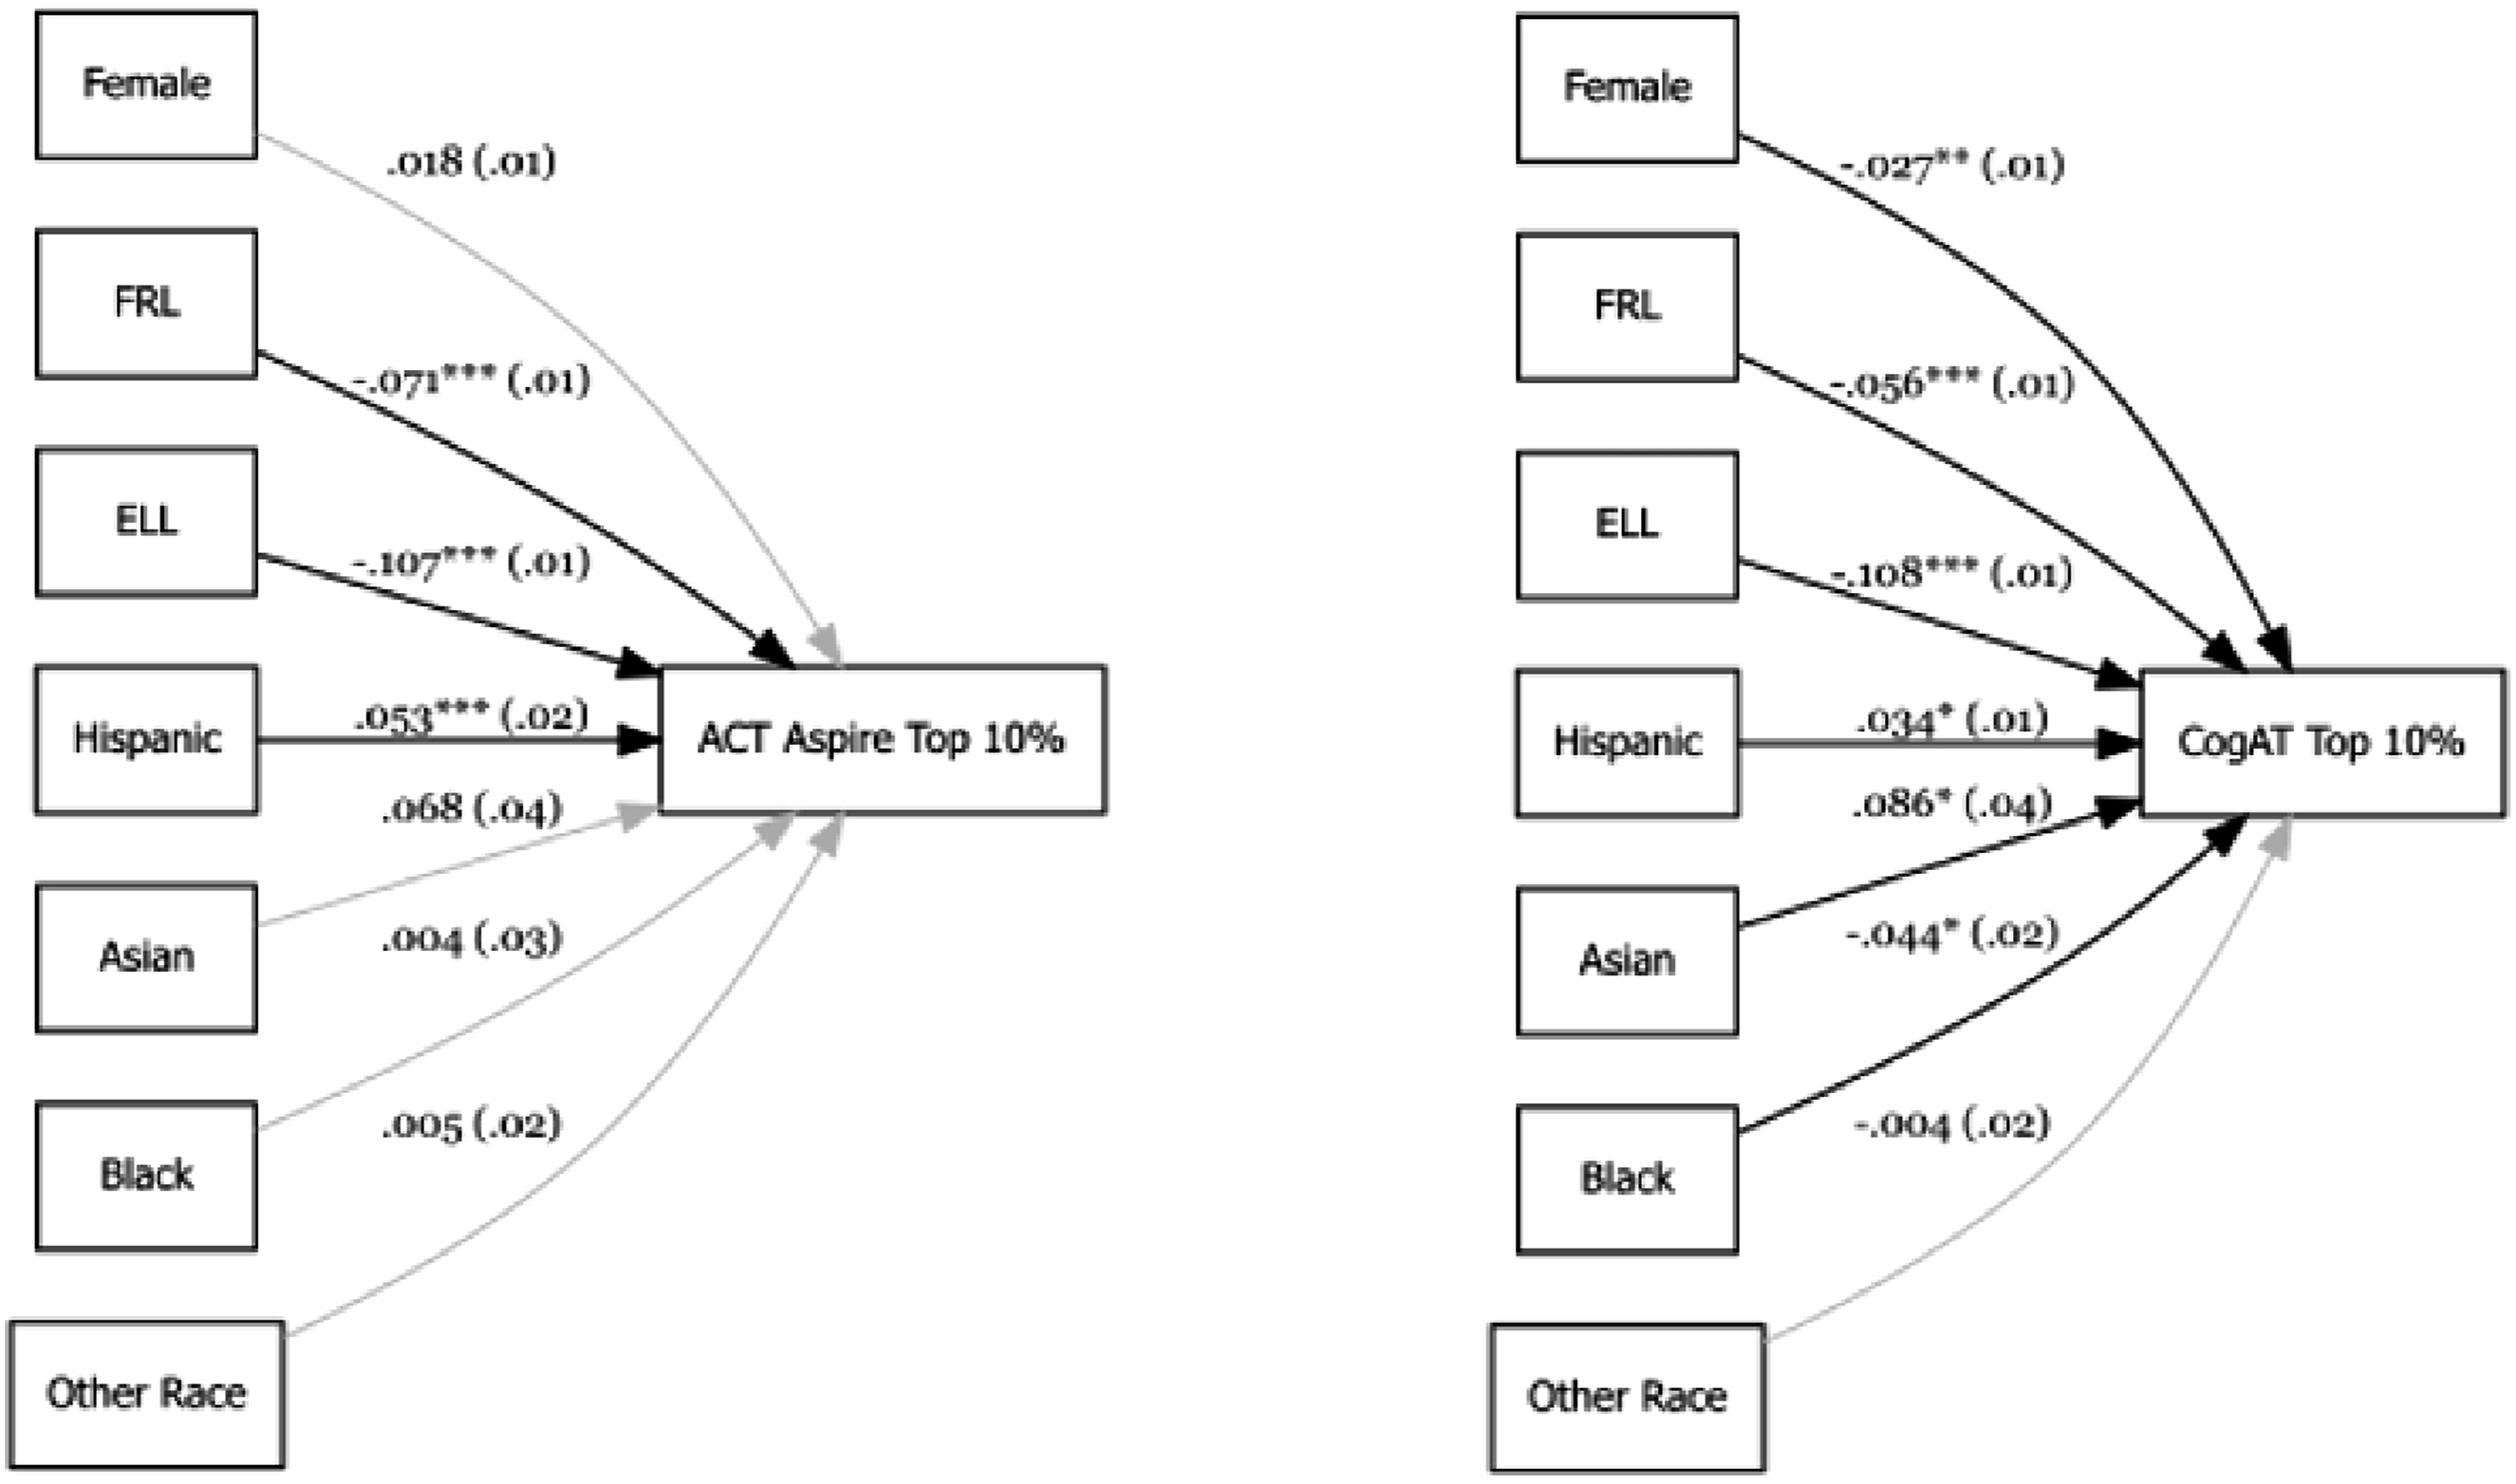
Cohort 2 presented a noticeably different landscape for top 10% scorers (see Figure 4). For the ACT Aspire, all subgroups except Asian and female students showed statistically significant differences, with FRL, ELL, Hispanic, Black, and other race/ethnicity students less likely to score above the 90th percentile on the ACT Aspire. In contrast, CogAT results for this cohort showed a statistically significant difference only for ELL and Hispanic students (Figure 5–7). Likelihood of Cohort 2 Subgroups to Score in the Top 10% on the CogAT and ACT Aspire Tests. Note. Robust standard errors are in parentheses. Coefficients of Black, Hispanic, Asian, and other races are drawn compared to White as base or reference category. Bold paths indicate a significant association, while gray paths indicate a path that was not significantly different between the groups. *p < 0.05, **p < 0.01, ***p < 0.001 Scatterplot of the Relationship Between ACT Aspire and CogAT Test Scores of Cohort 2. Note. To rule out distributional artifacts, we examined scatterplots and histograms of Cohort 2 scores. The Figures (see 5 through 7) suggest that the observed lower correlations in Cohort 2 are unlikely to be explained by outliers or severe non-normality. Distribution of ACT Aspire Scores of Cohorts 1 and 2. Note. To rule out distributional artifacts, we examined scatterplots and histograms of Cohort 2 scores. The Figures (see 5 through 7) suggest that the observed lower correlations in Cohort 2 are unlikely to be explained by outliers or severe non-normality. Distribution of CogAT Scores of Cohorts 1 and 2. Note. To rule out distributional artifacts, we examined scatterplots and histograms of Cohort 2 scores. The Figures (see 5 through 7) suggest that the observed lower correlations in Cohort 2 are unlikely to be explained by outliers or severe non-normality.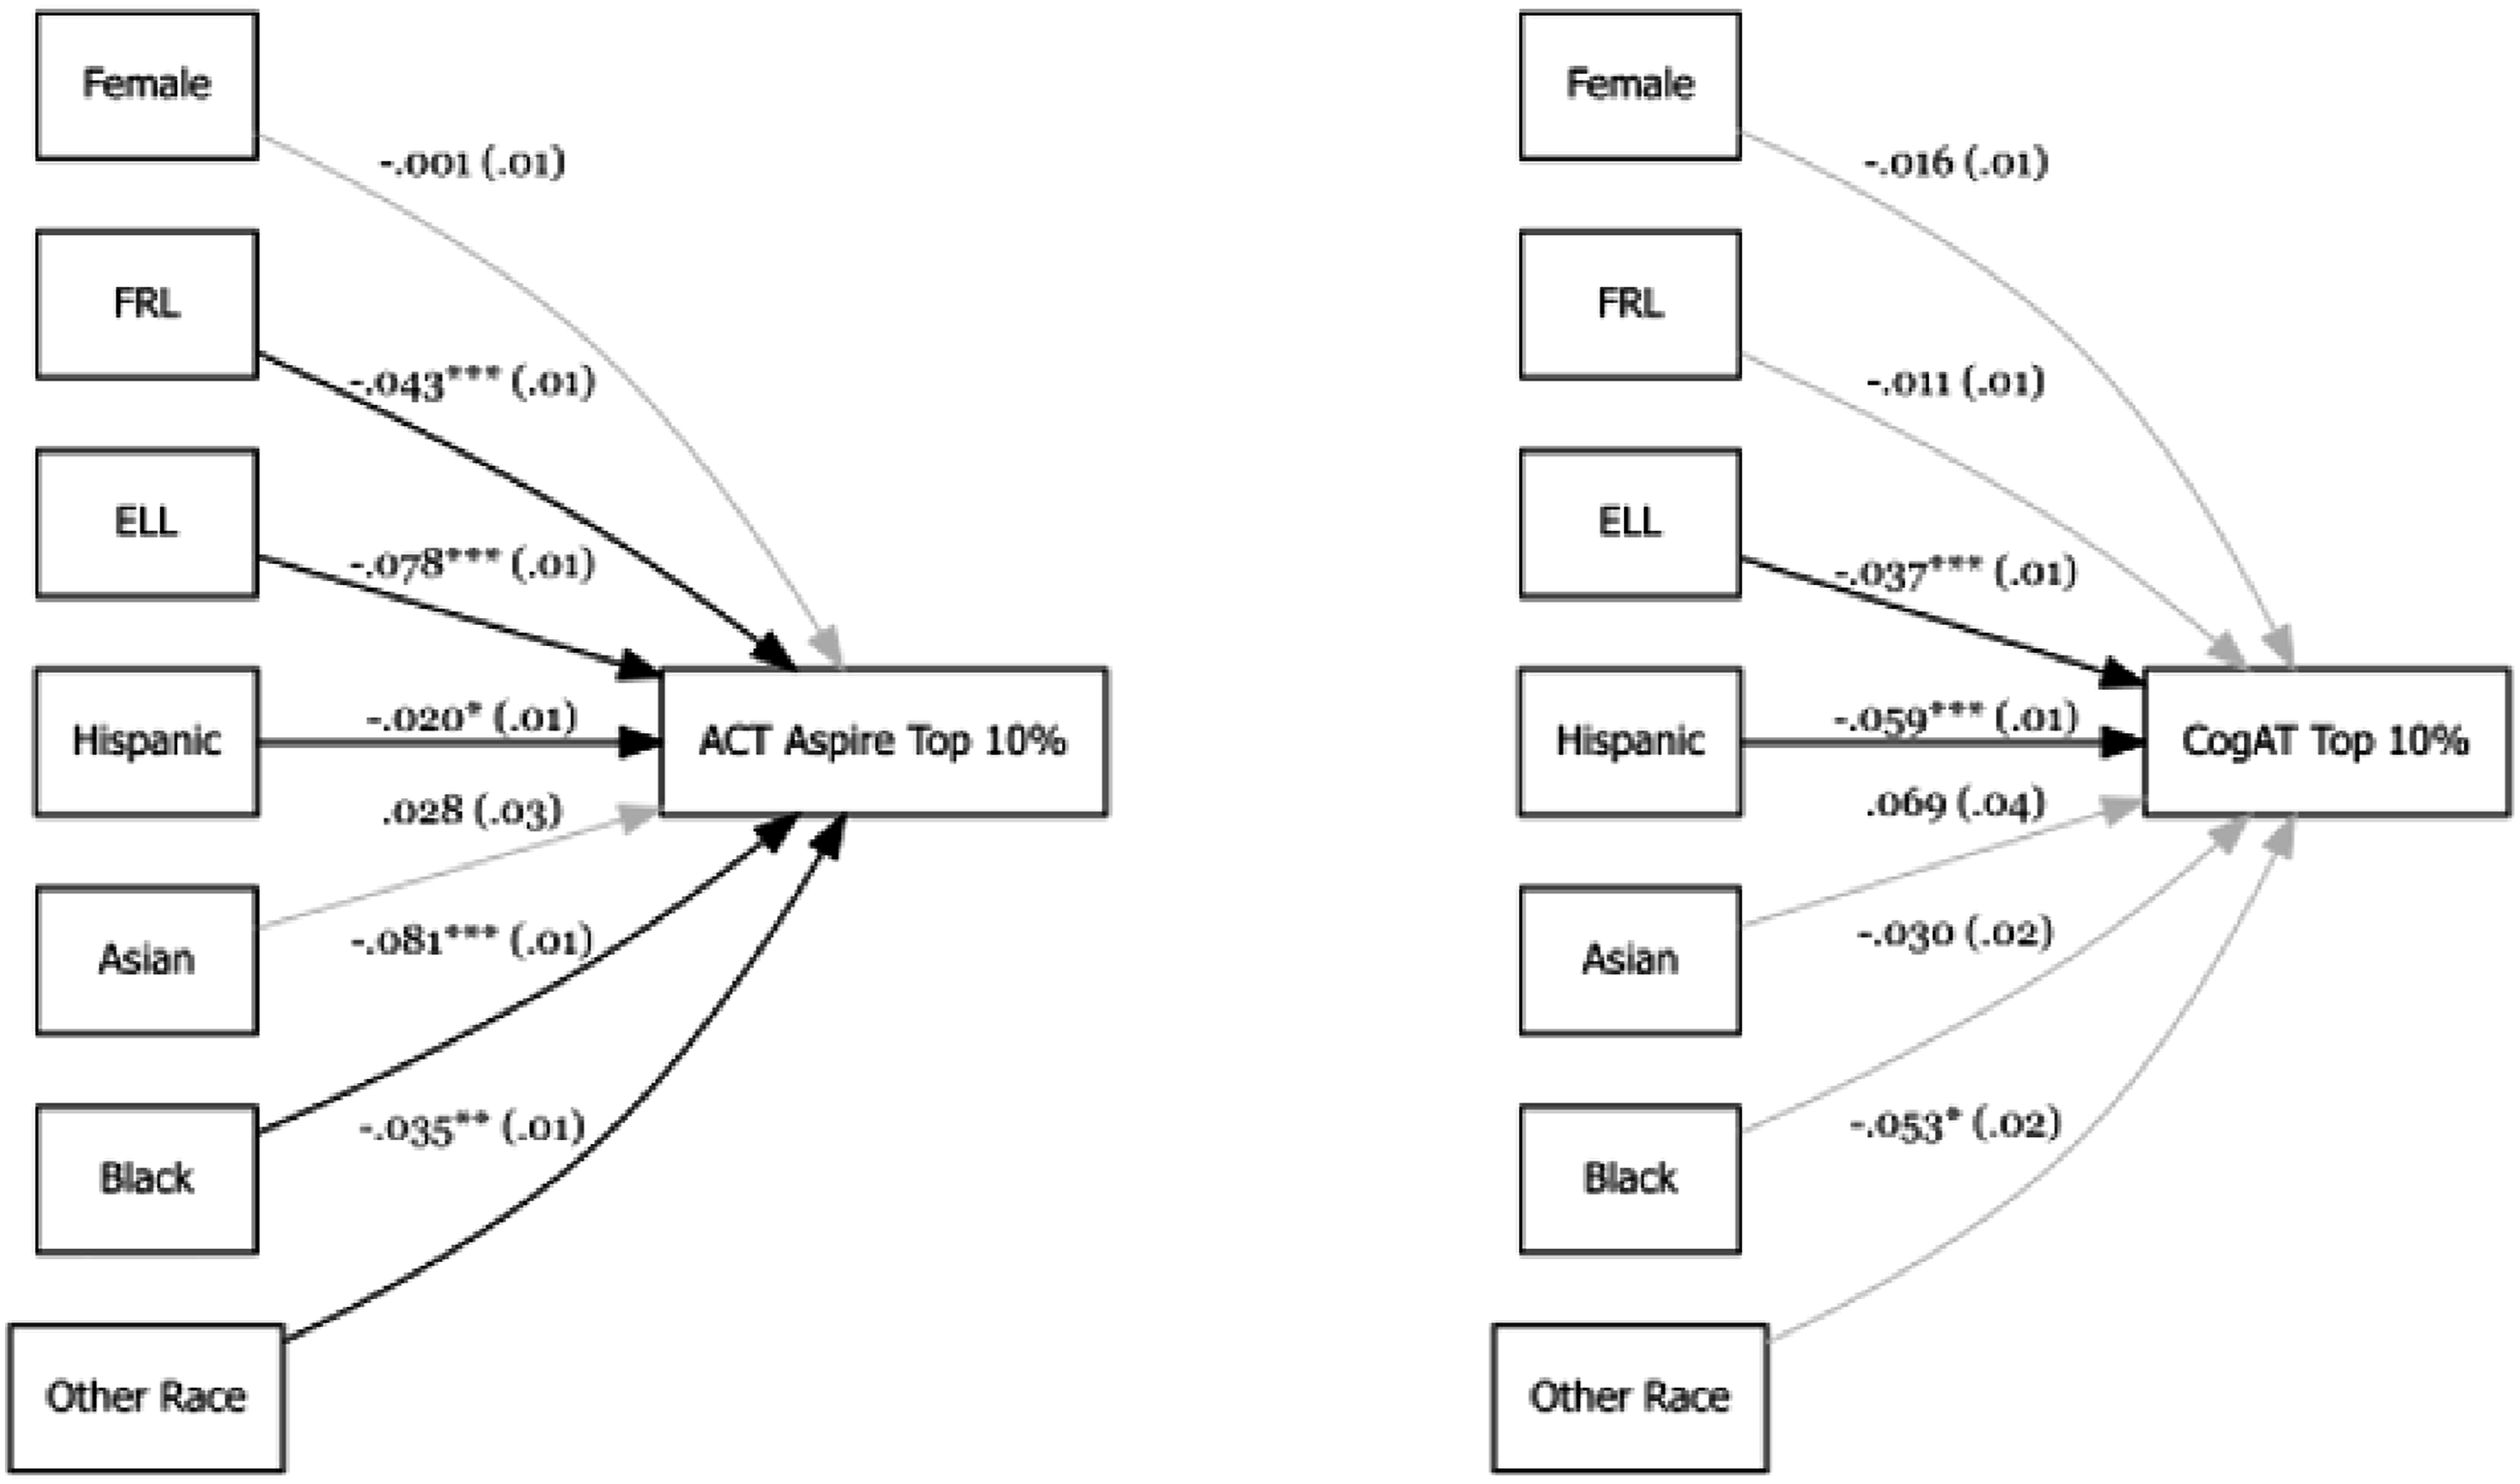
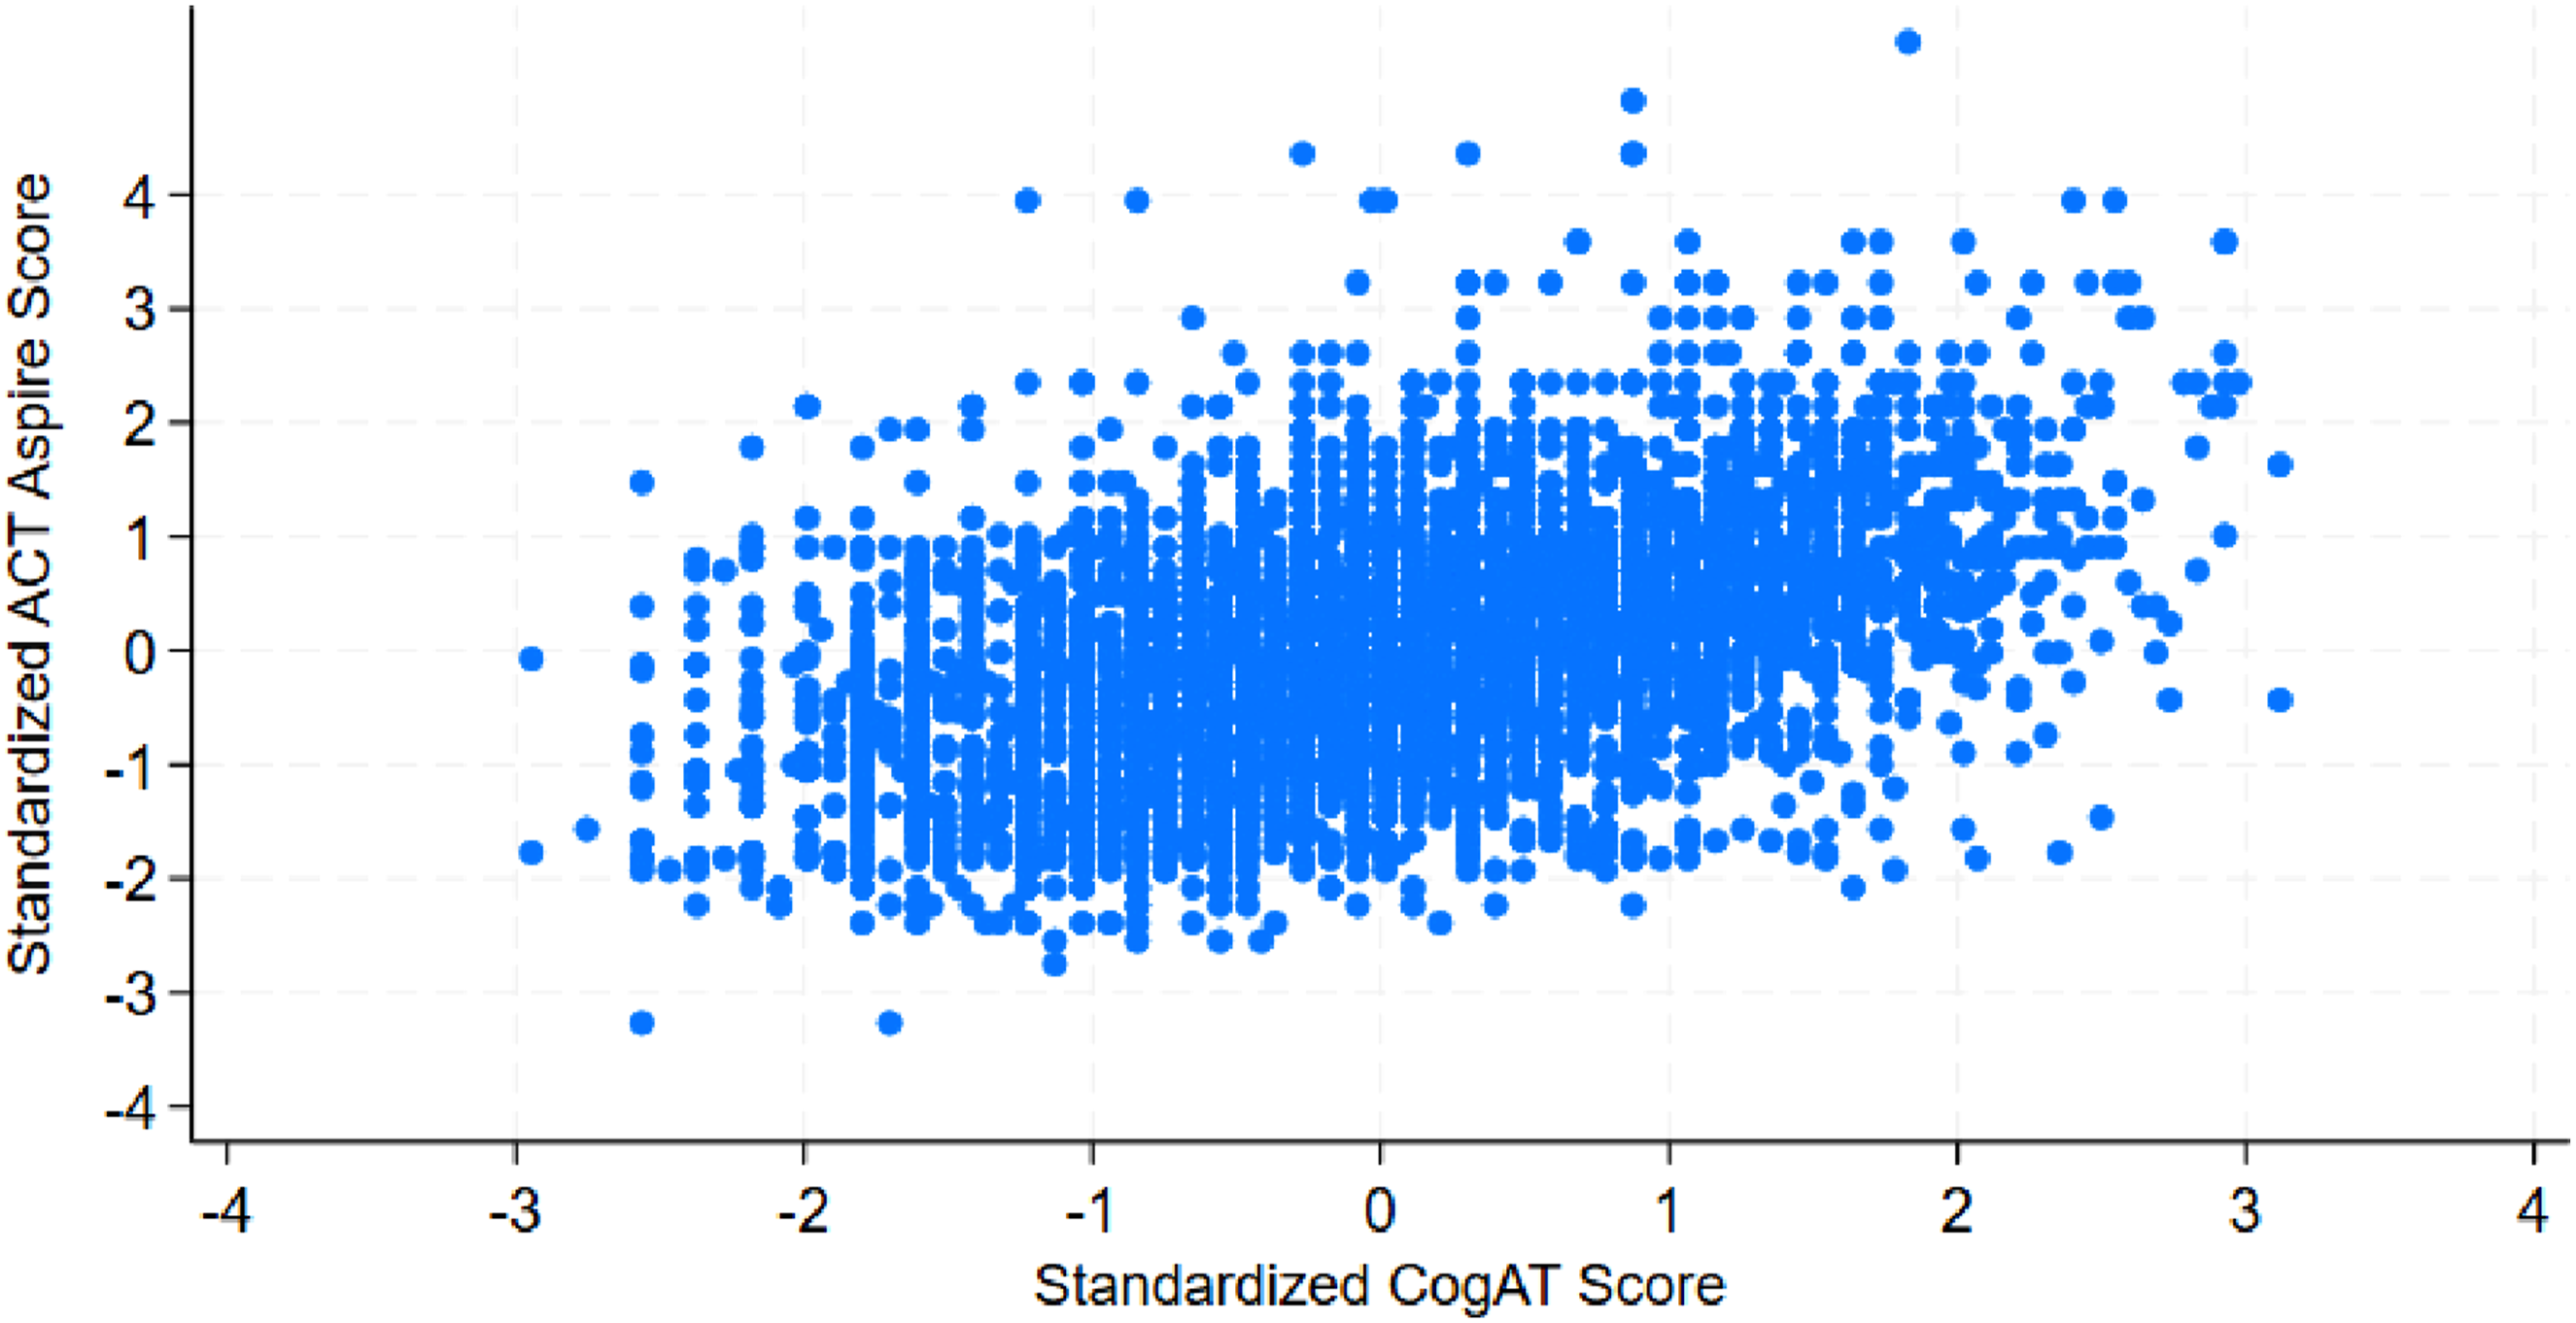
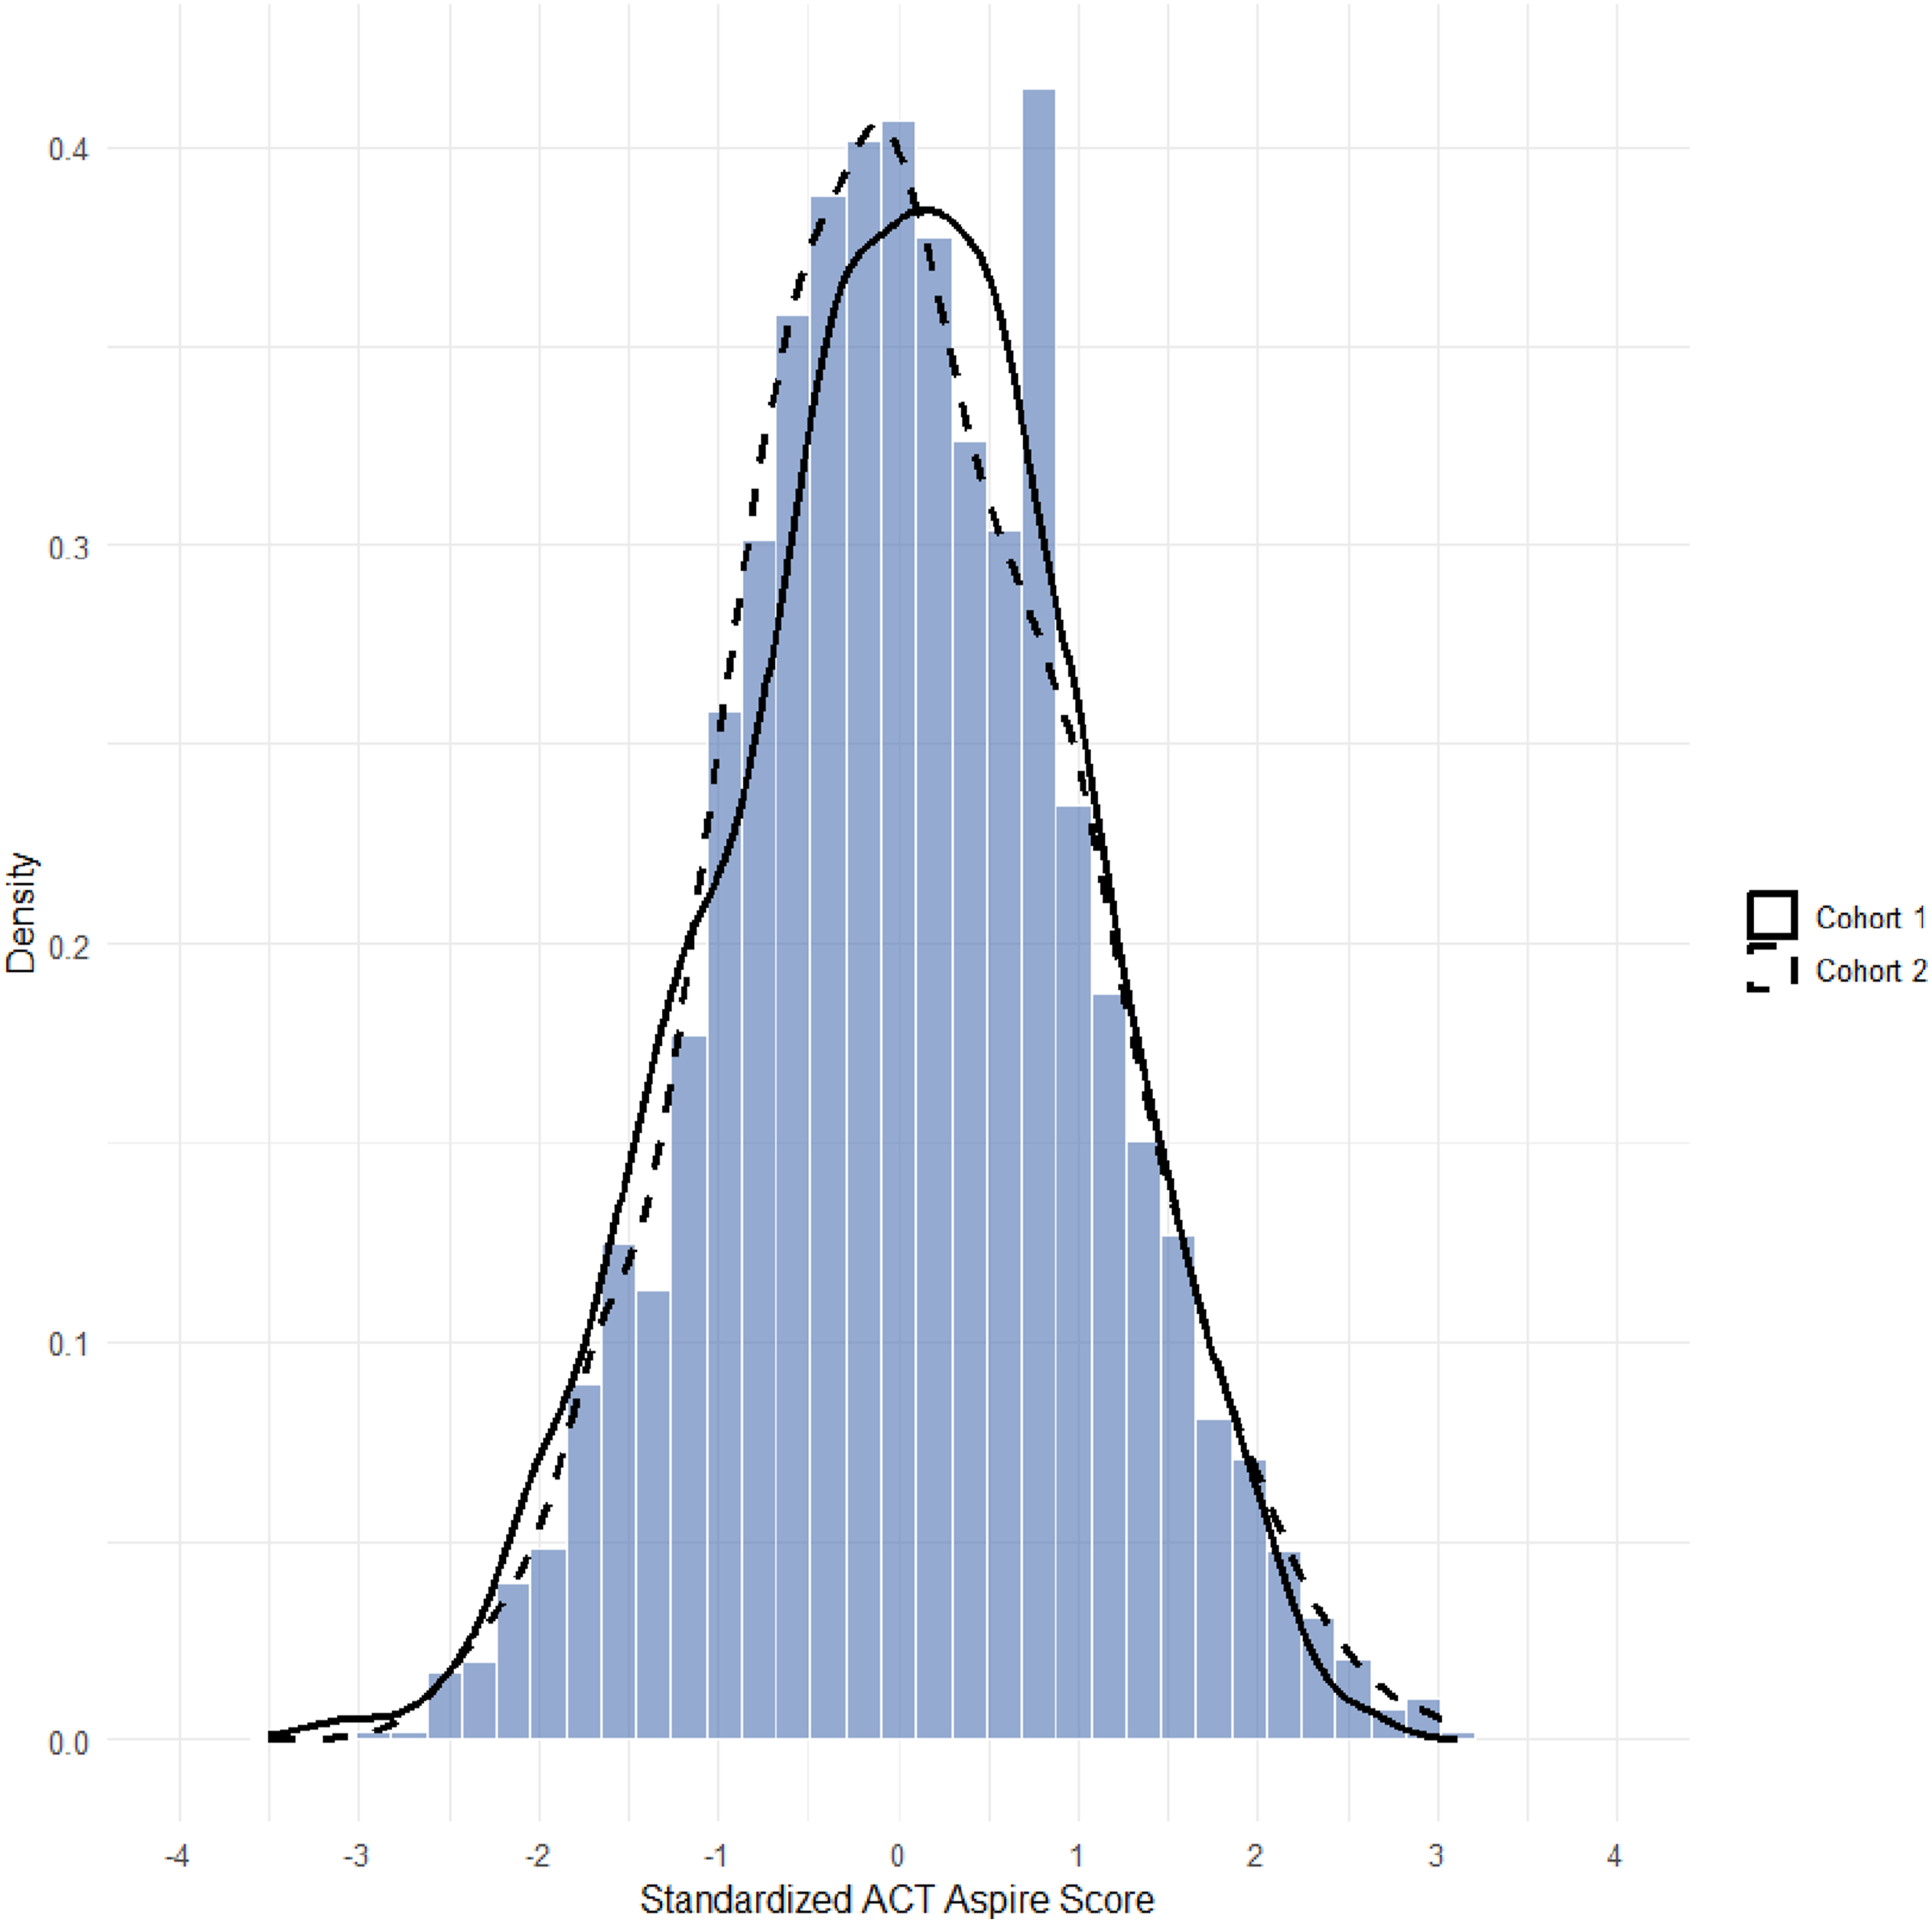
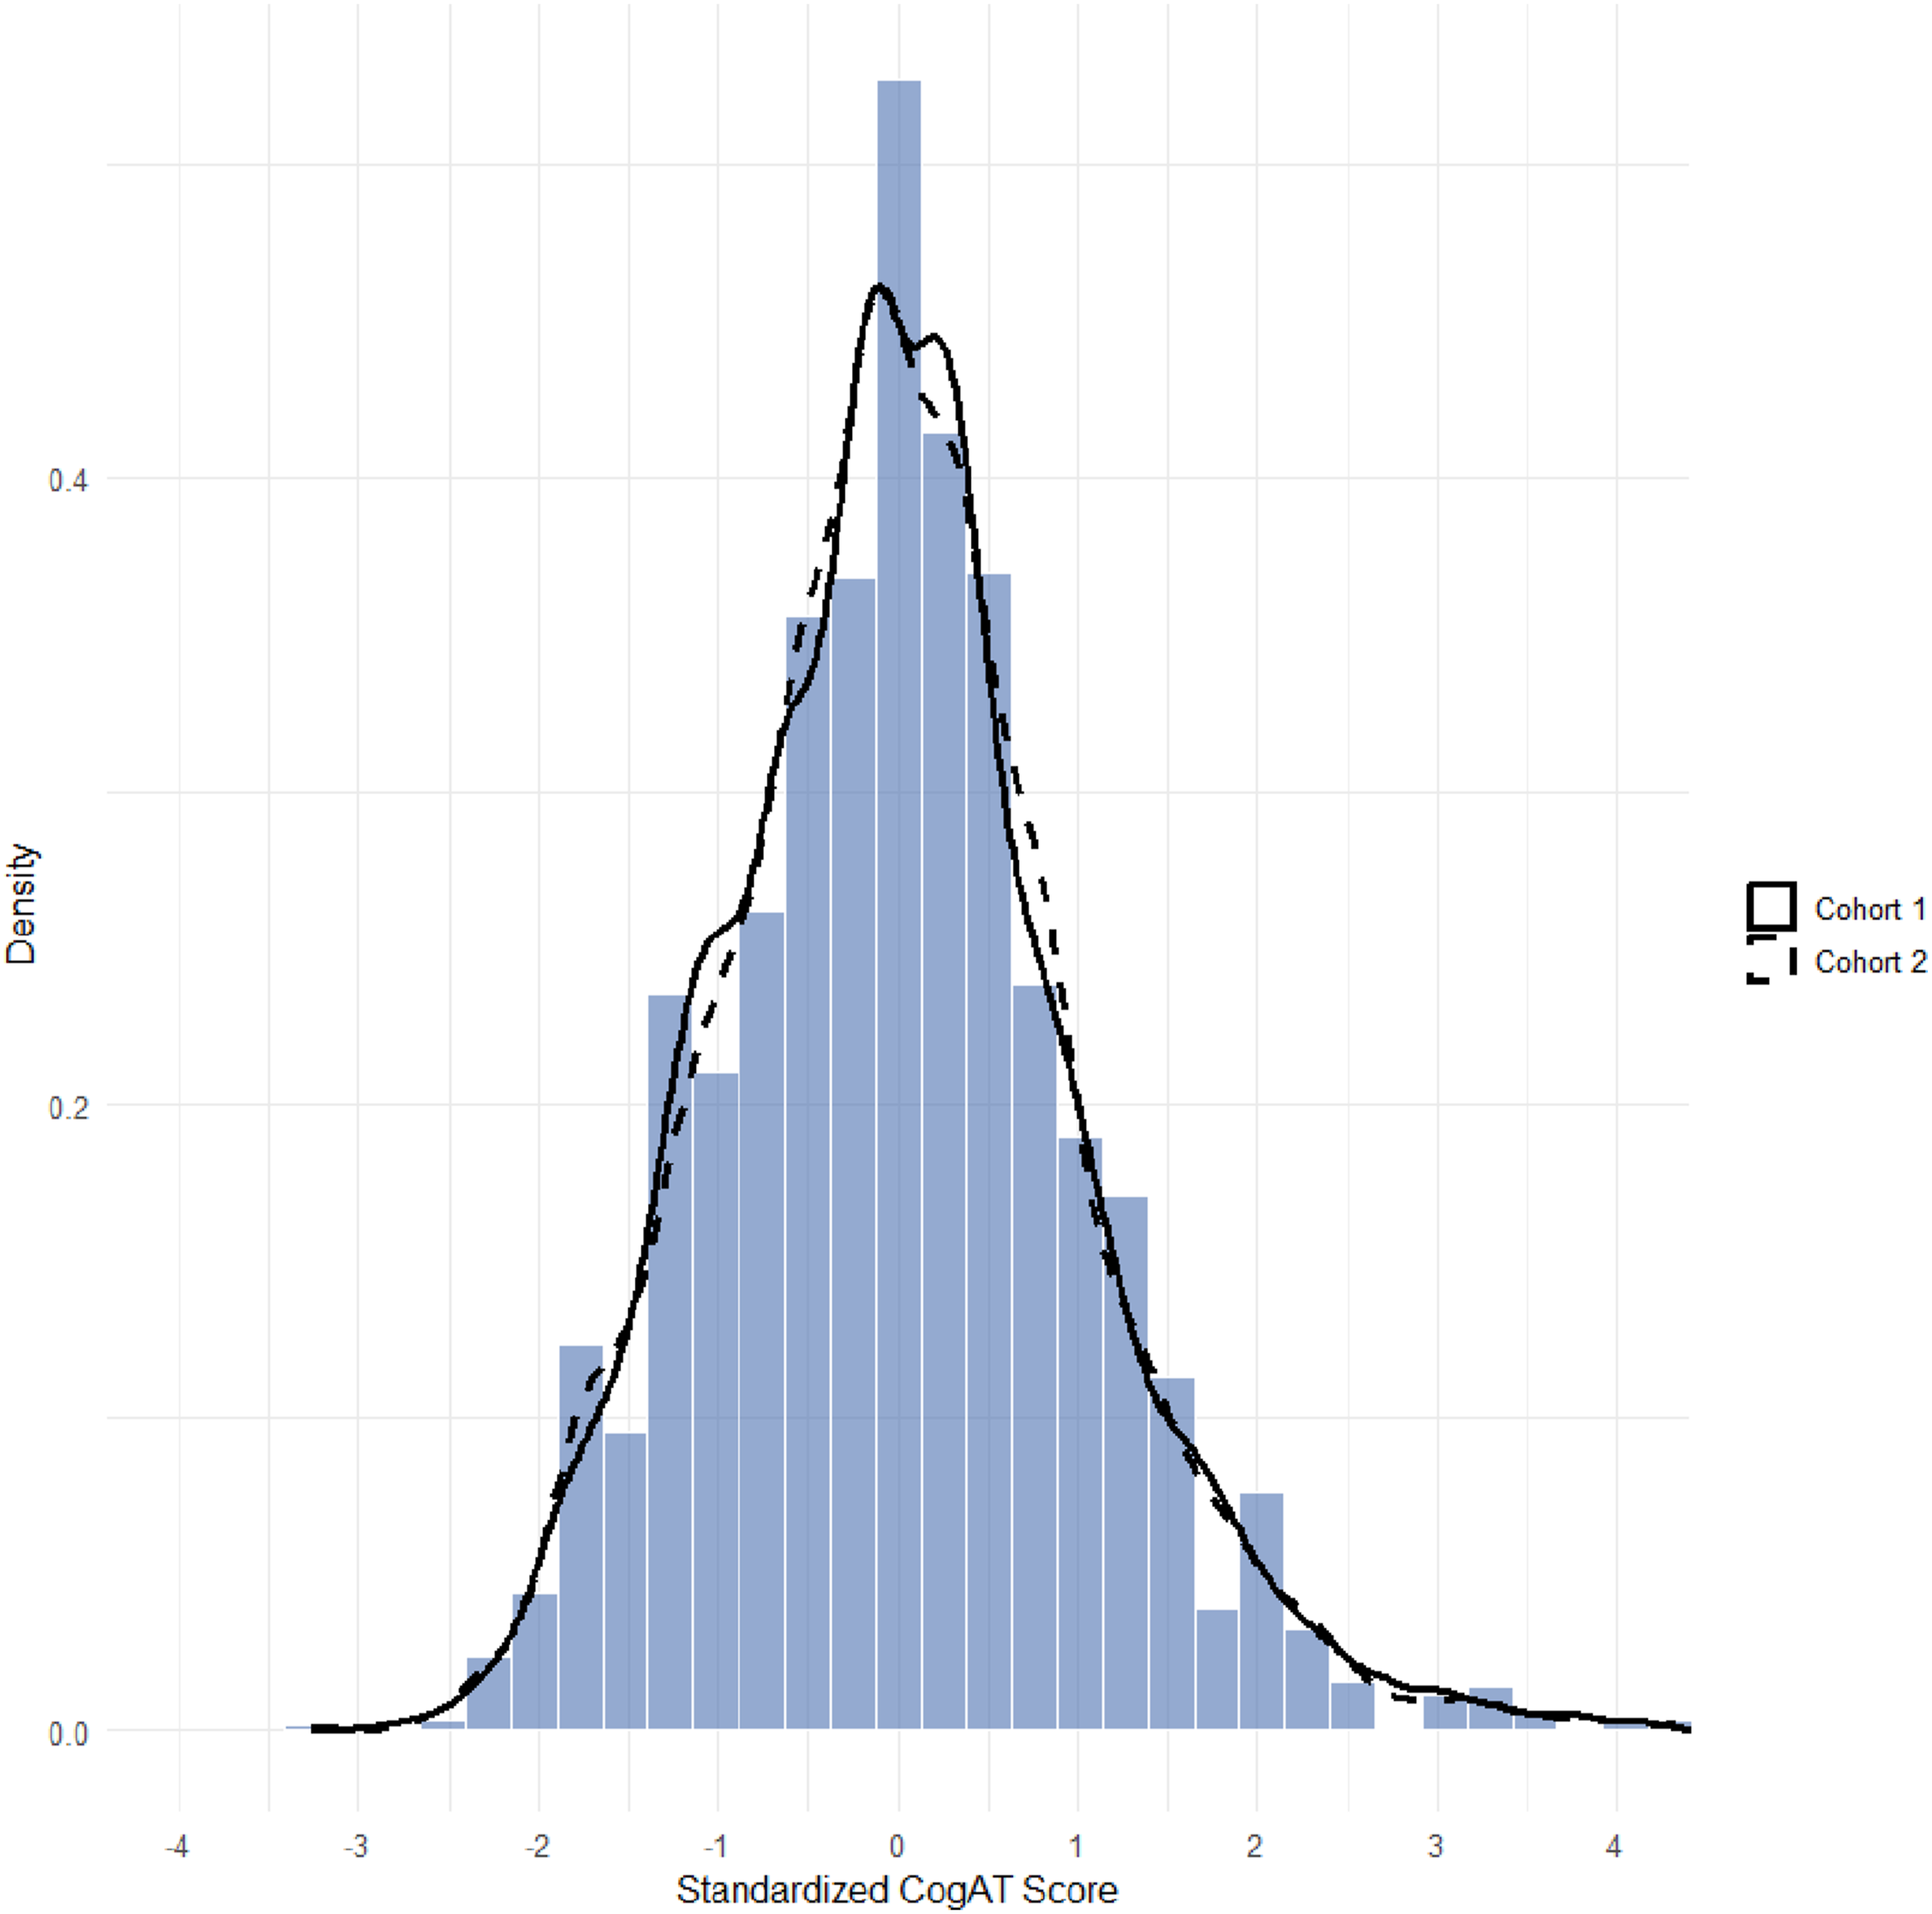
In sum, the findings suggest consistent inequities for the students from low-income backgrounds and English learners regarding access to the highest performance levels for both tests. Other subgroup differences, such as race/ethnicity, appeared more variable across assessments and cohorts. Whereas our analyses did not formally test coefficient differences across assessments, the within-test patterns provided clear evidence of differential representation in high achievement.
Representation Ratios of Students Subgroups in Top 10 Percentile of CogAT and ACT Aspire (Cohort 1)
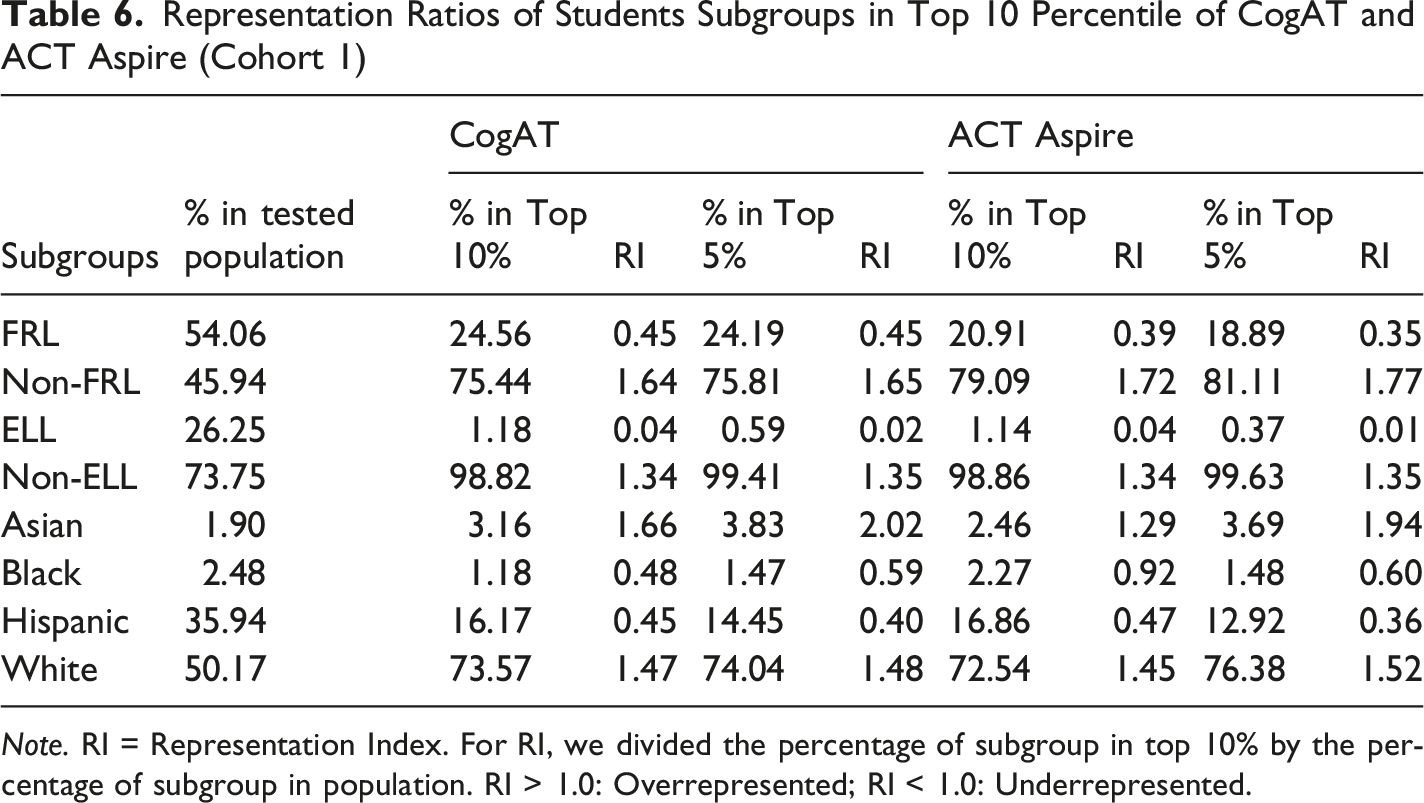
Note. RI = Representation Index. For RI, we divided the percentage of subgroup in top 10% by the percentage of subgroup in population. RI > 1.0: Overrepresented; RI < 1.0: Underrepresented.
Representation Ratios of Students Subgroups in the Top 10 Percentile of CogAT and ACT Aspire (Cohort 2)
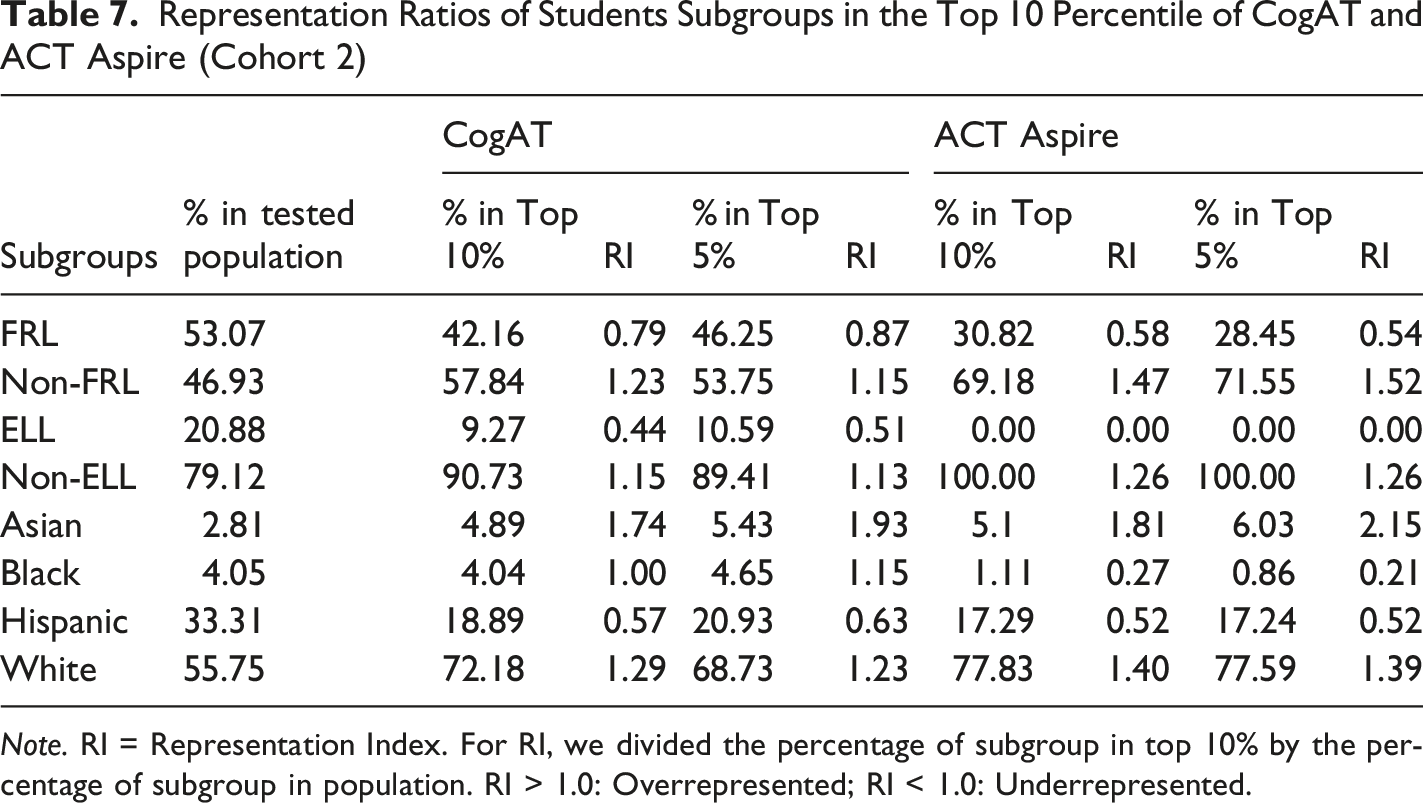
Note. RI = Representation Index. For RI, we divided the percentage of subgroup in top 10% by the percentage of subgroup in population. RI > 1.0: Overrepresented; RI < 1.0: Underrepresented.
School District Variation of Correlations Between the ACT Aspire and CogAT
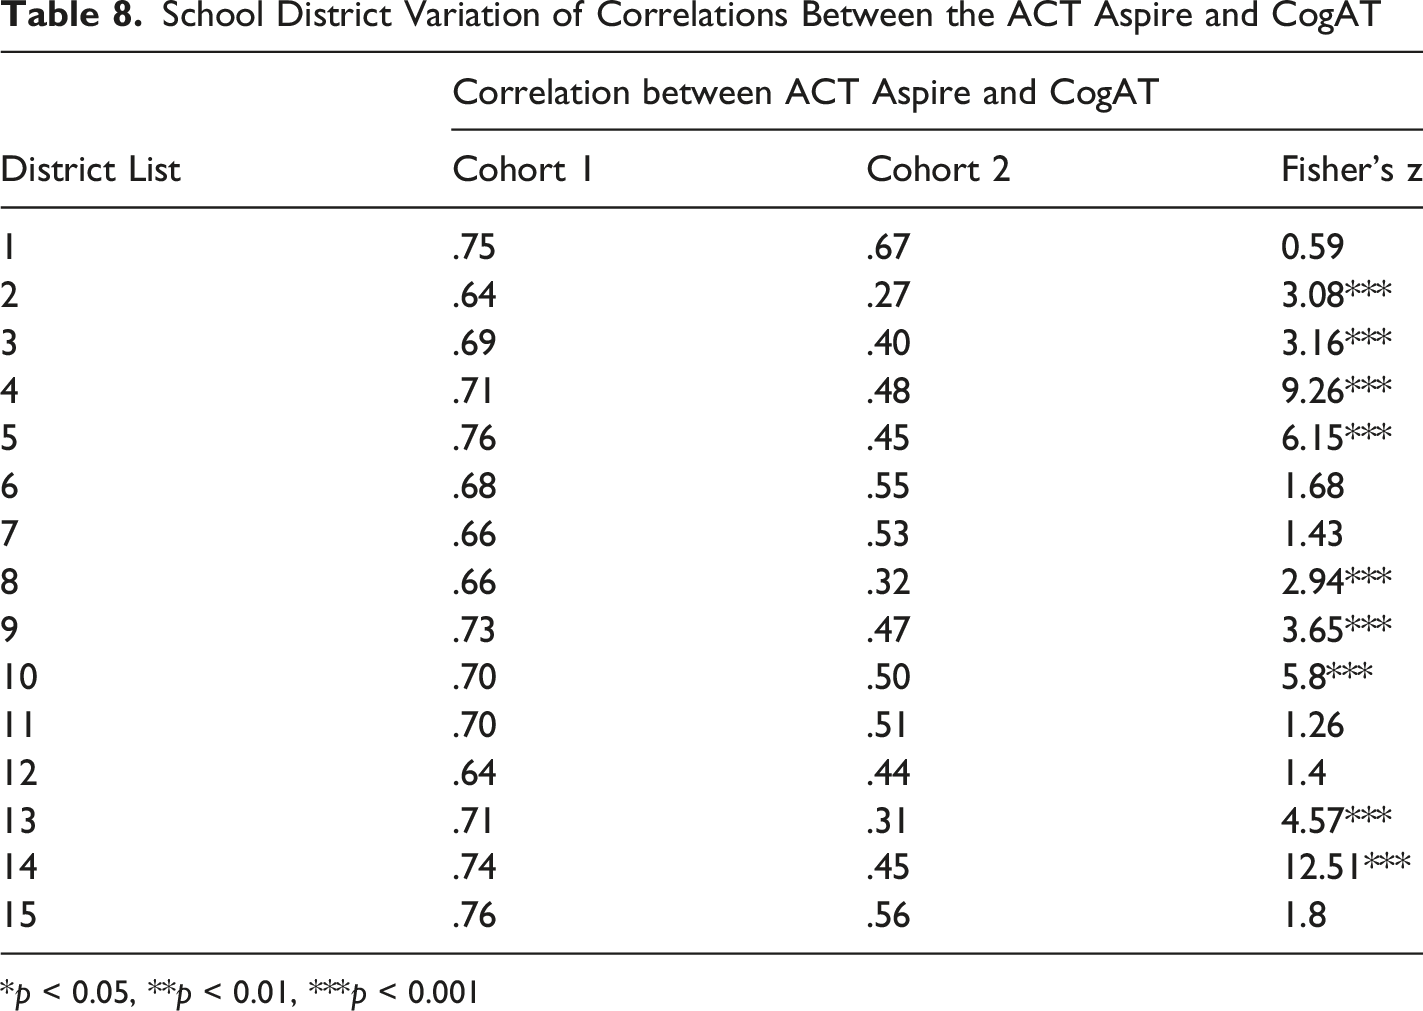
*p < 0.05, **p < 0.01, ***p < 0.001
Discussion and Conclusion
This study examined the extent to which CogAT and ACT Aspire scores were associated and the nature of diversity and inclusiveness for GT identification that both tests offered in the two cohorts of roughly 5,000 students each in Arkansas that were examined and drawn from the years 2018 to 2022. Although this study does not demonstrate any causal claims, it offers useful descriptive/correlational information and insights to stakeholders such as state policymakers, education researchers, GT counselors, GT teachers, and school leaders, especially those in Arkansas.
Use of the ACT Aspire and CogAT
The findings of this study demonstrate that there was a considerable association between the ACT Aspire and CogAT tests, which confirms the long history of all cognitive and achievement tests showing substantial positive correlations (Wai et al., 2018). This result confirms findings from earlier studies (Peng & Kievit, 2020; Zins & Barnett, 1983) that achievement and reasoning tests tend to be highly correlated. Our finding about the significant correlation between these two tests suggested that it is reasonable to use the CogAT or ACT Aspire tests interchangeably as an objective indicator to identify GT learners.
However, there are two notable concerns raised from the findings that pose alternative interpretations and related policy considerations. First, our results demonstrated a noticeable variation of correlations across cohorts; Cohort 1 showed a correlation of r = .72 (n = 5,279) whereas Cohort 2’s correlation was r = .46 (n = 5,229)—a difference of r = .25. We used Fisher’s z test and found that z = 21.03 (p < .001), suggesting that this difference in correlations between the two cohorts was statistically significant. Similar differences arose in the OLS regressions as well. For our second research question, we found significant differences between cohorts in predicting diversity among the students scoring above the 90th and 95th percentiles.
This discrepancy between these two cohorts warrants further investigation, particularly for Cohort 2. Given the likely effects of the COVID-19 pandemic on education and testing conditions (e.g., Donnelly & Patrinos, 2022; Kuhfeld et al., 2020), it is necessary to contextualize the Cohort 2 findings as potentially influenced by pandemic-era disruptions. Moreover, Table 4 highlights a consistent pattern of correlations between ACT Aspire math and ACT Aspire ELA scores across cohorts (overall r = .73, Cohort 1 r = .77, Cohort 2 r = 0.69). This consistency aligns with the findings of Wai et al. (2009) as well as other studies of math and verbal achievement/ability tests, which reported a widely replicated math–verbal correlation of approximately r = .76 found in population-representative samples, such as Project Talent. This alignment suggests that the observed results in Cohort 2 sample are not entirely anomalous, although the lowered correlation between math and verbal test scores suggests that these results may be atypical and Cohort 1 findings may be more robust and aligned with prior research.
These variations and inconsistencies across cohorts also do suggest more caution surrounding the idea of the interchangeable use of achievement tests and ability tests. However, we cannot rule out that this may also reflect the unique variation in our samples studied, rather than generalizable findings for policy.
Second, the OLS regression results (see Table 5) showed that the coefficients of association between the two tests reduced significantly when we added control variables. The coefficient was .59 without any control variables but reduced to .39 once controls were added. Still, these variations due to controls were predictable, as the correlation coefficients for subgroups (see Table 4) demonstrated variability. This finding is also consistent with Wai et al. (2009) who observed stable associations of correlations between low SES and math, verbal, or spatial scores in population-level samples. These variations of association between the two tests due to control variables suggest that the scores on achievement tests and ability tests and their potential correlations may vary depending on students’ demographic and socioeconomic status. Therefore, GT coordinators and teachers may need to be more careful in their use of achievement test scores and ability test scores. But again, using what is available in a universal screening context may be better than not using a universally applied objective indicator at all. Thus, a counterargument would be that using one of these tests in practice as a first universal screener (typically the achievement test) is a reasonable step, but that also including another ability test or additional tests would be even better.
Additionally, given the differences in objectives and content areas between achievement and ability tests, choosing between the CogAT and ACT Aspire tests, despite both tests having established reliability and validity, offers trade-offs. Cognitive ability tests often involve additional costs and time, whereas achievement tests like the ACT Aspire are usually already administered in state assessment systems to all students and likely involve lower costs. In many cases, underresourced school districts may not be able to afford using expensive measures that can capture unique cognitive abilities that achievement tests may overlook and thereby increase inequity in GT identification (e.g., they may miss spatial reasoning; Lakin & Wai, 2020). All these factors matter when considering how to enhance equitable GT identification.
Diversity and Inclusion
The LPM results (see Figures 1–4) underscore the complex interplay of demographic factors in standardized test performance in our samples. The likelihood of high achievement on the ACT Aspire and CogAT tests varies across cohorts and tests for students from different socioeconomic and racial/ethnic backgrounds. This consistent variability between cohorts and tests suggests that the relationships between student characteristics and test performance is influenced by factors beyond individual student attributes. These results call for a nuanced approach to GT program identification, one that considers multiple measures and accounts for the diverse backgrounds and experiences of students.
The recommendation of considering scores from multiple tests as an objective indicator, which is universally used, reiterates the findings of Ozen et al. (2024), and is ideal in an optimal situation, but is not the typical situation in practice. Moreover, the benefits of universal screening are already known with past findings in the tests/selection literature and the more recent findings of Card and Giuliano (2016) have revealed that testing all students can lead to a significant increase in the representation of low-income and historically underserved students in gifted programs. Also, universal screening can help address, at least in part, the systemic failure to recognize the potential of financially disadvantaged students and also enhance diversity in gifted programs (Callahan et al., 2013; Lakin & Wai, 2020).
Additionally, results showed that Cohort 2 included a larger number of students categorized in the top 5% and 10% but does not indicate higher overall performance. Cohort 2 appeared to have lower mean CogAT scores and weaker correlations between tests, suggesting greater dispersion. Given the timing of Cohort 2, this pattern may have reflected greater heterogeneity in testing conditions, instructional quality, or student engagement. Moreover, variations in the pathways to the top 5% and 10% for different subgroups of students across the tests and cohorts suggested that opting to select only the students above the 95th percentile on the ability test (CogAT) would exclude a considerable number of students with the highest scores on the achievement test (ACT Aspire). Using both tests in considering students for GT programs would offer more high-achieving students a unique opportunity to receive the benefits of GT services. This example aligns with what Lohman (2005) has long discussed, so in a way it is not new. Lohman (2005), using samples from Naglieri and Ronning (2000), showed that selecting the top 5% on the ability test in the GT program would identify only 31% of the students in the top 5% of the math achievement test, excluding 69% of the students with the best mathematics achievement, suggesting the importance of using more than one test score in GT identification, in addition to using multiple factors in the identification process to help identify more diverse talent.
Given the existing identification policy in Arkansas that begins with nomination and is followed by the collection of student data on at least two objective and two subjective measures with at least one being a creativity assessment (Tran et al., 2022), our findings suggest practitioners should consider the test scores of both the ACT Aspire and CogAT, or other existing test scores, especially those systematically administered to all students. Even though ability tests and achievement tests appear to be highly correlated (Peng & Kievit, 2020; Zins & Barnett, 1983), taking more than one test score into account may expand the net of identification (Lohman, 2005). Moreover, the noticeable variation in correlations between ability tests and other GT identification tools in many states underscores the need for considering more than one test score in the GT identification process (Ozen et al., 2024).
Limitations and Future Research
According to Tran et al. (2022), as much as 30% of the students in top 5% on both third-grade literacy and math were not identified as gifted in the Arkansas sample they studied. The Office for Civil Rights (2018) report and findings of Gentry et al. (2019) reiterated these findings regarding the underrepresentation of students from disadvantaged communities. We believe that the findings of this study: use of multiple test scores—achievement and/or ability measures—as a universal screener to widen the net of GT identification can be useful potential tools to address the existing disparity in the GT identification process. However, the unique demographic nature of the school districts studied may attenuate the external validity of this study. This study also used samples that were assessed before and after the pandemic, thus there may have been learning loss related attenuation of typical correlations between measures due to this important historical event. Also, since we did not use school or district-level modeling, perhaps parts of our suggestions about using local norms are not robustly supported by our analysis. Therefore, future research might include richer data, more robust models and newer exam formats to see if the findings of this study replicate to ensure universal and local norm-based screening for the GT identification process. When connected with other studies, perhaps a larger more consistent and replicated set of findings for policy may emerge.
Additionally, we do not know what the exact objective and subjective measures are that GT coordinators use when they consider GT placement and how these practices vary across schools and school districts, not only within the state across districts, but more broadly in all kinds of GT identification procedures. For example, in the state of Arkansas, one of the objective indicators used in identification must be a creativity measure, and we were not able to assess that in our study (e.g., see Lee et al., 2024). Future studies that explore the unique perceptions and practices of the practitioners in identifying GT learners in our local context (or other locales) could provide valuable insights for policymakers and researchers.
Moreover, small deviations from the exact top 5% and top 10% cutoffs due to score clustering slightly affected the pool size, and, in turn, may have affected the observed representation as well as findings in RQ2, as noted by Lakin (2018). Furthermore, our data has additional limitations, as it does not include information on student scores for individual CogAT subtest batteries. Access to this detailed data would enable a more precise comparison between corresponding components of the CogAT and ACT Aspire tests. Future research investigating the associations between similar test components could significantly enhance the literature in this area. Finally, we reiterate that our findings are based on relatively smaller samples of data in Arkansas and may not necessarily generalize to other states or contexts regarding policy decisions, such as at a different point in time.
Footnotes

Funding
The authors disclosed receipt of the following financial support for the research, authorship, and/or publication of this article: The authors received funding from the Walton Family Foundation.
Declaration of conflicting interests
The authors declared no potential conflicts of interest with respect to the research, authorship, and/or publication of this article.