






Abstract
This study aims to examine the extent to which older adults’ perceptions of environmental age-friendliness are associated with their life satisfaction. We used a national representative sample (N = 9,965) with elders aged 60 and above from urban China and structural equation modeling to analyze the relationship among community characteristics, socioeconomic status (SES), and life satisfaction. Results showed that older people’s perceptions of housing conditions, local amenities, and social inclusion were significantly associated with general life satisfaction. Multigroup comparison tests indicated that no disparities in the aforementioned relationships among SES subgroups. However, the socioeconomically disadvantaged elderly population was shown to have the lowest assessment of community age-friendliness. Findings emphasized the potential role of age-friendly communities as having an influential force on older adults’ subjective well-being, regardless of their SES. Meanwhile, policy makers and practitioners should pay special attentions to improve the living environments of disadvantaged elders.
Life satisfaction is a subjective assessment of one’s life (Bowling, 1990). It is one of the most important indicators of subjective well-being (Gana et al., 2013) as well as a general assessment of the quality of life (Han & Hong, 2011). Many studies have found that a lower level of life satisfaction in old age is associated with higher risks of mental health problems, mortality (Koivumaa-Honkanen et al., 2000), and suicide (Koivumaa-Honkanen et al., 2001). Others found that life satisfaction is positively associated with successful aging in regard to functional status, affective status, cognitive status, and productive status (Caspi & Elder, 1986; Chou & Chi, 1999; Tate, Leedine, & Cuddy, 2003).
Given that life satisfaction is predictive of an older person’s sense of well-being, there have been extensive studies focusing on factors associated with this. For instance, previous studies have discovered factors from several dimensions including demographic characteristics such as age (Kim & Sok, 2012; Meléndez, Tomás, Oliver, & Navarro, 2009) and marital status (Barger, Donoho, & Wayment, 2009; Hsu, 2012), educational attainment (Lee & Lee, 2013; Li, Chi, & Xu, 2013), income (Barger et al., 2009; Li et al., 2015), physical and psychological health (Gutiérrez, Tomás, Galiana, Sancho, & Cebrià, 2013; Hsu, 2012; Li & Liang, 2007), intergenerational support (Kim & Sok, 2012; Li et al., 2013), and family relationships (Huang, 2012; Silverstein, Cong, & Li, 2006). Nevertheless, many of these studies are limited at the individual or family level, yet very few have involved factors from a broader perspective. According to the person–environment (P-E) fit perspective, personal characteristics, environmental features, and the P-E fit are each important to predict community-dwelling elders’ well-being (Kahana, Lovegreen, Kahana, & Kahana, 2003). This perspective suggests that physical and social environments are vital to individuals’ well-being. Not only that, interactions between subjective needs and the objective environment is a dynamic process. When people get older, they will encounter physical, psychological, and social changes. A safe, convenient, and barrier-free living environment can help them adapt to age-related changes and contribute to their well-being (Kahana et al., 2003); otherwise, they may experience maladjustment and their subjective well-being could be compromised (Ding & Jiang, 2014).
Age-friendly communities are characterized as places where “older adults are actively involved, valued, and supported with infrastructure and services that effectively accommodate their needs” (Alley, Liebig, Pynoos, Benerjee, & Choi, 2007, p. 4). Over the last decade, the growing number of the elderly has fostered an increased interest in making our communities more age-friendly and livable. The basic goal is to help residents to continue to live in their homes and communities rather than letting them become vulnerable to involuntary relocation (Fitzgerald & Caro, 2014; Scharlach, 2012; Scharlach & Lehning, 2013). Therefore, a large number of age-friendly community initiatives are being promoted worldwide. For instance, the World Health Organization [WHO] launched a Global Age-Friendly Cities Project in 2005 and identified the characteristics of such cities in eight domains including outdoor spaces and buildings, transportation, housing, social participation, respect and social inclusion, civic participation and employment, communication and information, and community support and health services (WHO, 2007). Subsequently, WHO nurtured and developed a Global Network for Age-Friendly Cities and Communities in 2010 through which member cities and communities exchange experiences with each other in developing age-friendly programs with diverse cultural and socioeconomic contexts (WHO, 2013). Other examples of age-friendly community initiatives include livable communities in the United States (American Association of Retired Persons, 2013), age-friendly environments in Europe (Fitzgerald & Caro, 2014), the elder friendly communities program in Canada (Austin, McClelland, Perrault, & Sieppert, 2009), and so on. Despite these initiatives to improve age-friendliness of communities, there is a scarcity of empirical research exploring their roles in older people’s well-being (Golant, 2003; Park & Lee, 2017). Most previous studies have targeted at home environment with respect to disability-related outcomes (Lord, Menz, & Sherrington, 2006; Wahl, Fänge, Oswald, Gitlin, & Iwarsson, 2009). Few researchers have extended this to a broader context. Park and Lee (2017) studied the impact of physical, social, and service environments on Korean older adults’ life satisfaction. They found that supportive physical and social environments were positively related to life satisfaction among those who lived alone and were poor. Existing studies have shed light on the protective function of age-friendly communities for increasing the life satisfaction of the elderly. However, research in this field is rare including how different dimensions of age-friendly communities are related to older people’s subjective well-being.
Along with the scarcity of research on associations between age-friendly environments and life satisfaction, there is little published research on differences from the perspective of socioeconomic status (SES; Lehning, Smith, & Dunkle, 2014; Park & Lee, 2017). According to resource theory, SES, which is usually indicated by income, educational attainment, and occupational status, is a vital resource for acquiring a higher quality of life (Abbott & Sapsford, 2006; Pinquart & Sörensen, 2000). Older adults in low-SES groups may lack the resources to utilize available services or support in their living environment (Scharlach, 2012). They are more likely to experience social exclusion (Scharlach & Lehning, 2013). Among older people in the same regions, those who were poor were more likely to feel disrespect and exclusion by others (Park & Lee, 2017). Based on these studies, it is reasonable to assume that elders with different SESs may have varying perceptions regarding the age-friendliness of their communities.
Furthermore, in the P-E fit perspective, environmental docility hypothesis suggests that less competent individuals are more likely to be affected by environmental features (Lawton, 1989). Based on this hypothesis, age-friendliness of communities may be more significant for socioeconomically vulnerable elders’ well-being. Empirical analyses of SES, age-friendly communities, and life satisfaction can advance our understanding of the P-E fit process and guide policies and interventions for older people’s well-being, particularly for the disadvantaged older population.
China is one of the fastest aging countries in the world. According to updated data, the total population of people aged 60 and above was more than 230 million at the end of 2016, accounting for 16.7% of the total population (National Bureau of Statistics of China, 2017). In China’s 12th Five-Year Plan, a “9073” old-age care pattern was proposed by the government, of which 90% of older adults would be cared at home, 7% would be cared in communities, and 3% would be cared in institutions (Du & Wang, 2016). Based on this policy, it is conceivable that up to 97% of Chinese older people will reside in their homes and communities. Thus, building age-friendly communities is closely related to most Chinese older people’s quality of life.
The concept of age-friendly environments was first introduced in China in 2007 and became the priority of the government since 2009. A nationwide campaign called age-livable community was launched to create a positive living environment for older people in urban China (National Working Commission on Aging, 2016). Moreover, livable environment was written as a separate chapter in the revised Law of the People’s Republic of China on Protection of the Rights and Interest of the Elderly (Old-Age Law) in 2012, which fosters the legal foundation for further promotions of age-friendly environments (Du & Xie, 2015). Given the importance of policies of age-friendly communities in China, it is surprising that systematic evaluations of their impact on older people’s quality of life are rare. To our knowledge, there has not been a comprehensive study assessing age-friendly communities and their impact on older adults’ subjective well-being in a Chinese context.
In light of the literature on the significance of age-friendly communities and the quality of life of older people, our study aims to use the P-E fit perspective as a theoretical framework to examine the extent to which SES, age-friendly community environment, and the interaction between SES and age-friendly community environment are associated with life satisfaction, after adjusting for covariates based on previous studies. In particular, we assess three research hypotheses. First, we examine the extent to which older adults’ perceptions of various dimensions of age-friendly communities are associated with their life satisfaction. We expect that older adults with positive perceptions of these environments are more likely to have greater life satisfaction. Second, we examine whether perceptions of age-friendliness of communities vary for older adults from different socioeconomic groups. We hypothesize that elders with lower SES are likely to have more negative perceptions of these communities. Third, we determine whether SES moderates the relationship between older adults’ perceptions of age-friendly communities and life satisfaction. We expect to find that age-friendly communities are more important in predicting life satisfaction in the socioeconomically vulnerable group.
Method
Sample
This study uses secondary data from the urban and rural elderly population aging survey conducted by the China Research Center on Aging in 2010. The survey employed a multistage sampling method. One hundred and sixty counties were selected from 20 provinces as the primary sampling unit, from which 1,000 communities (in urban China) and 1,000 villages (in rural China) were randomly chosen as the secondary sampling unit (SSU). In the last stage, a simple random sampling was used to select participants from each SSU who were then combined into a single sample. Via face-to-face interviews, 19,986 residential participants aged 60 or above answered the questionnaire. Since the discrepancies in economic and social development in urban and rural China are huge, and most of the age-friendly environment programs have been piloted in urban areas, we only employed data from 1,000 communities in urban China with a sample of 10,032 participants in the current study.
Measures
Life satisfaction
This was measured by a single item: “Overall, how satisfied are you with your present life?” Participants were asked to choose 1 (very dissatisfied) to 5 (very satisfied) to describe their situations (Li et al., 2013, 2015).
Age-friendly communities
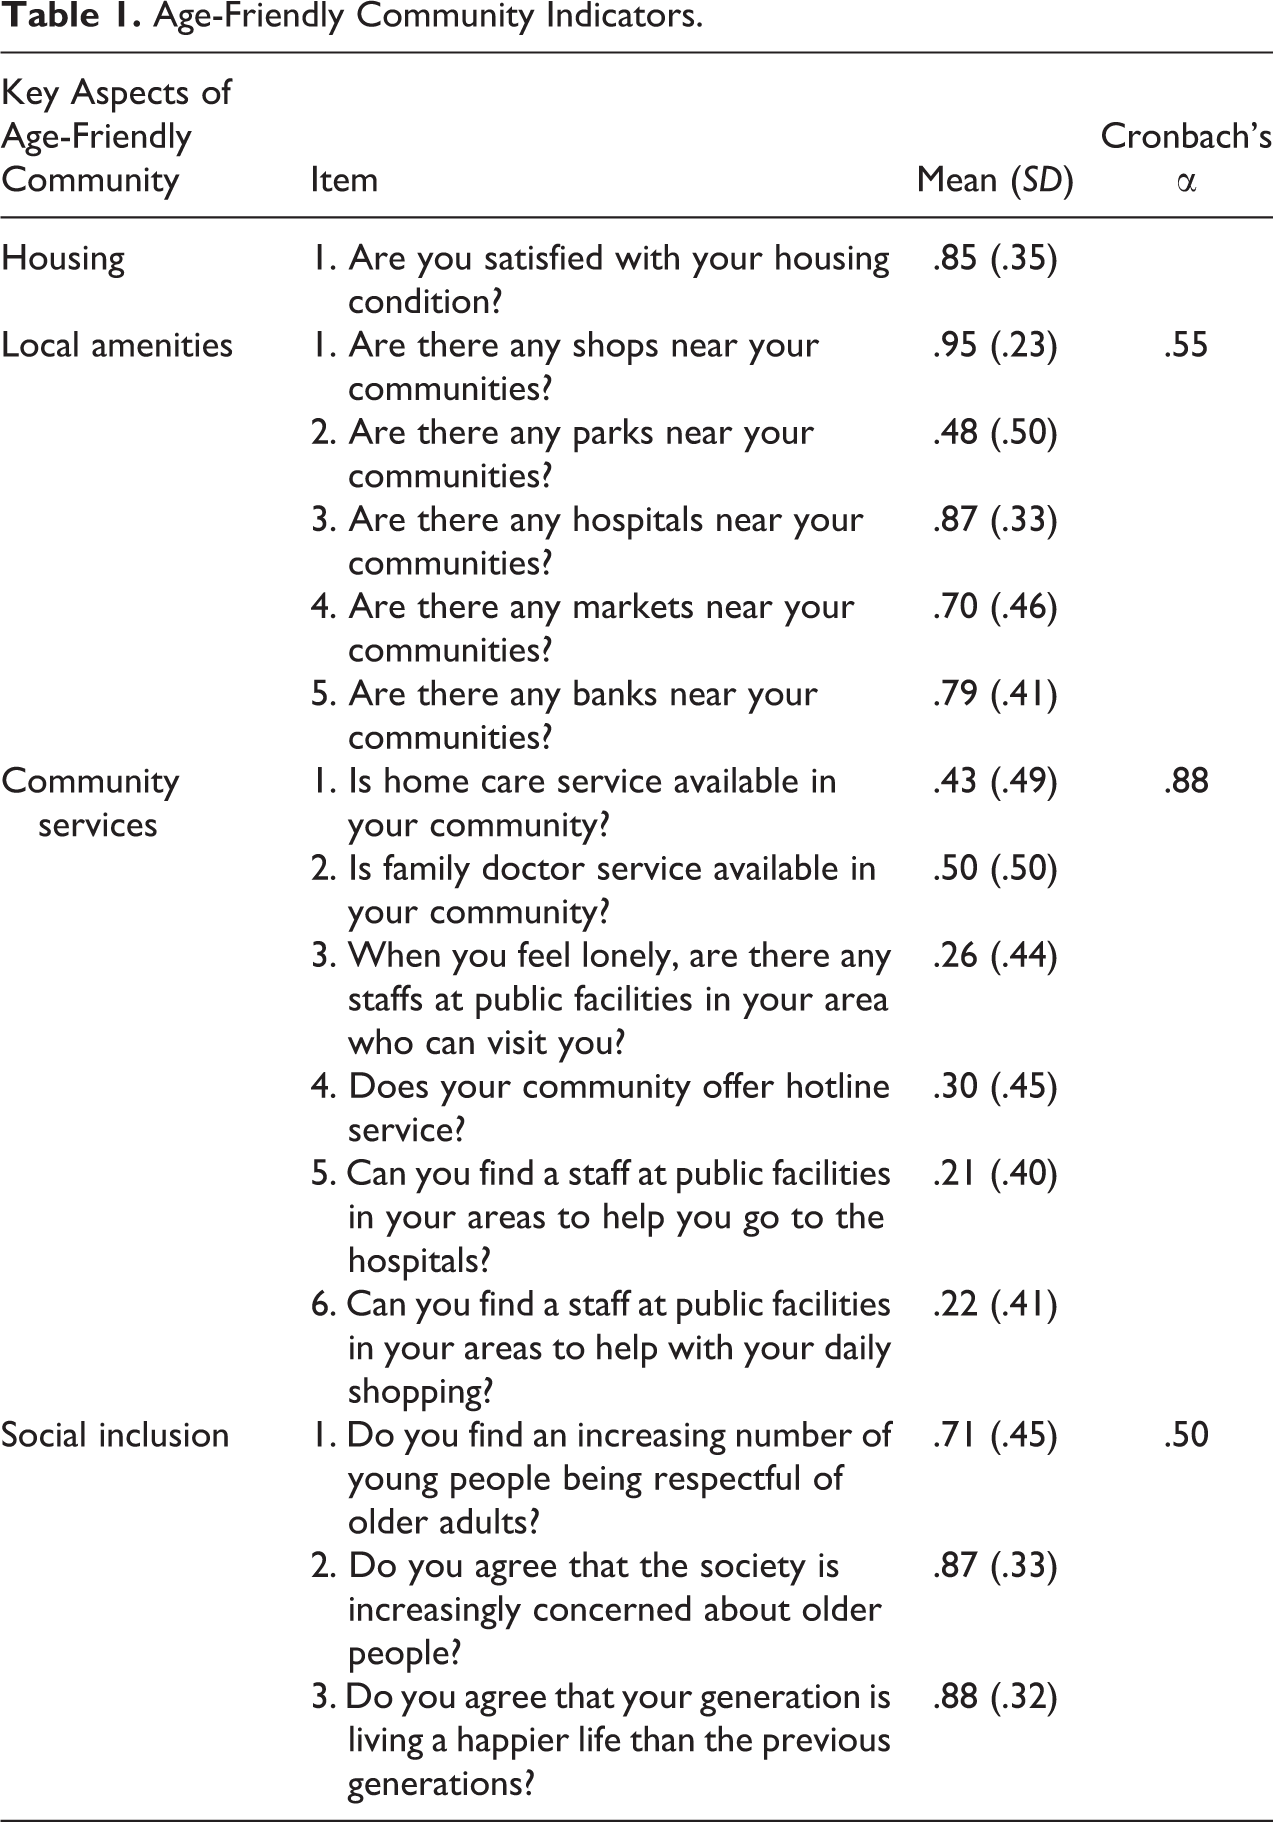
These communities’ characteristics were gauged by older people’s perceptions of their environment. We measured four aspects of community environment including housing, local amenities, community services, and social inclusion. Housing was measured by a binary indicator. Participants were asked to assess if their housing conditions were satisfactory. Local amenities were measured by 5 items, focusing on the convenience of older people’s daily life. Participants answered if there were shops, parks, hospitals, markets, and banks near their communities. Community services included 6 items on the availability of social care services for older residents. A sample item is: “Is home care service available in your community?” Social inclusion was measured by 3 items on perceptions of social attitudes toward the older population. A sample item is: “Do you find an increasing number of young people being respectful of older adults?” The response for all items was 0 = no and 1 = yes. Cronbach’s αs for local amenities, community services, and social inclusion variables were .55, .88, and .50, respectively (see Table 1).
Age-Friendly Community Indicators.
SES
As previous research suggests, income and education are two important indicators of SES, such that income reflects a resource for securing the necessities of life (Welzel & Inglehart, 2010), while educational attainment indicates an individual’s capacity to acquire resources and meet their needs (Katteyn, Smith, & van Soest, 2010). To assess income, participants were asked to rate the extent to which their household income was sufficient to meet the essential needs of the family on a 5-point scale (from 1 = very insufficient to 5 = very sufficient). Following the criteria employed by Park and Lee (2017), we defined the bottom 20% as poor. The final income variable was recoded into two categories: 1 and 2 = poor and 3–5 = nonpoor. For education, since most participants (50.48%) had years of schooling less than or equal to the sixth grade, we followed the criteria used by Lee and Lee (2013) and recoded the original variable with two categories: below the sixth grade = less educated and above the sixth grade = better educated. To better identify vulnerable elderly subgroups under the Chinese context, we used income and education to create a composite SES indicators. Older people who were both finacially poor and less educated were considered the most volunerable and marginalized group. Older adults who either lack money to meet their essential needs or lack abilitities to acquire resources to meet their needs were catergorized as the middle-SES group. The final SES indicaator had three categories: (1) low-SES group (poor and less educated), (2) middle-SES group (poor and better educated or nonpoor and less educated), and (3) high-SES group (nonpoor and better educated).
Covariates
Based on the previous studies, age, gender, marital status, and health are included as covariates (Hsu, 2012; Kim & Sok, 2012; Li & Liang, 2007; Meléndez et al., 2009). Age is a continuous variable ranging from 60 to 98 years (mean age = 72.3 years, SD = 7.2). Gender (0 = female, 1 = male) and marital status (0 = no spouse, 1 = spouse) are binary variables. Health condition was measured on a 5-point scale from 1 (very unhealthy) to 5 (very healthy).
Analyses
We first used Stata 14.0 to conduct one-way analysis of variance and χ2 tests to analyze differences among three SES groups in life satisfaction, perceptions of age-friendly communities, and sociodemographic characteristics. In these analyses, community variables were treated as composite scores. Three structural equation models (SEMs) examined influential factors of life satisfaction with the total sample using Mplus 7.4. Model 1 examined the effects of age-friendly communities on life satisfaction. In Model 2, we added SES variables. Model 3 included all covariates. To assess moderation effects of SES, we estimated influential factors of life satisfaction for low, middle, and high socioeconomic groups separately. To enhance research findings, we tested invariance hypotheses across three SES groups by a series of multigroup comparison tests. In SEM analyses, community variables were treated as latent variables, except for housing, while demographic and health covariates were controlled in Models 3–10.
Before running SEMs, we conducted a series of analyses to investigate whether the data set met basic assumptions. No outlier, collinearity, or ill-scaled problems were found. Continuous variables met the normality assumption. There were 0.7% of participants who did not complete all items, so we considered data as missing completely at random and used default listwise deletion in Mplus 7.4. After excluding participants with incomplete items, the final sample was 9,965. Due to the binary nature of item response scales, we applied the mean- and variance-adjusted weighted least squares (WLSMV) estimator to conduct SEMs. As described in the sample section, participants were nested in communities. To address nonindependent observations, we used the Sandwich estimator to adjust for standard errors of clustering (Muthen & Satorra, 1995) and included the community as the strata variable. Since the χ2 test is sensitive to large sample size, we used alternative indices to assess the goodness of fit of models including the root mean square error of approximation (RMSEA), the comparative fit index (CFI), and the Tucker–Lewis index (TLI), which offer a more appropriate model fit for our data set. The recommended criteria are as follows: RMSEA < .05 (Hu & Bentler, 1999), CFI > .90 (Bentler, 1990), and TLI > .90 (Wang, Wang, & Jiang, 2011). For invariance testing, we used Satorra–Bentler χ2 difference test (TRD), changes in comparative fit index (ΔCFI), and changes in root mean square error of approximation (ΔRMSEA) for invariance hypotheses. The nonsignificant results of the χ2 difference test (p > .01, McLarnon & Carswell, 2013), |ΔCFI| < .01 (Cheung & Rensvold, 2002), and |ΔRMSEA| < .015 (Chen, 2007) show invariance across groups.
Results
Characteristics of Respondents and Perceptions of Age-Friendly Communities by SES Groups
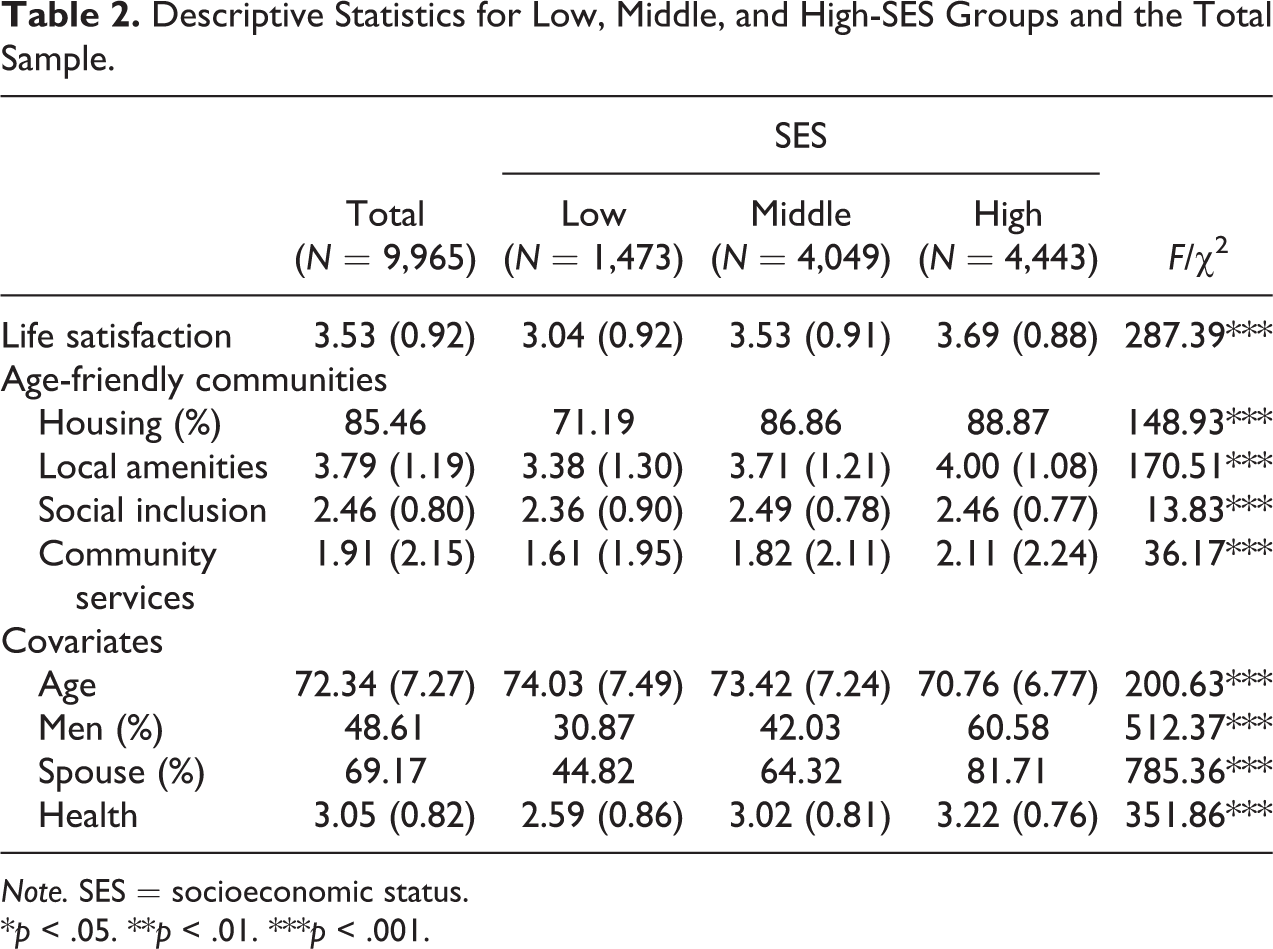
Table 2 presents the results of descriptive analyses of life satisfaction, perceptions of age-friendly community environments, and sociodemographic characteristics for the total sample and each SES subgroup. The mean age of the total sample was 72.34 years (SD = 7.27), with 49% male respondents and 51% female. Among the respondents, 69% lived with a spouse, while about one third had either lost or divorced them. A common pattern emerged between SES and background characteristics. The low-SES group turned out to be the oldest group (mean age = 74.03 years; SD = 7.49). They had significantly higher proportions of women (69%) and no spouse (55%) and a lower level of self-reported health (mean = 2.59) than middle and high-SES groups. These findings are consistent with previous studies (e.g., Beydoun & Popkin, 2005; Miao & Wu, 2016), indicating how the connection of education and economic status could indicate social stratification in urban China. We also found disparities in life satisfaction among three groups of older people (p < .001). Those with better SES reported a higher level of life satisfaction.
Descriptive Statistics for Low, Middle, and High-SES Groups and the Total Sample.
Note. SES = socioeconomic status.
*p < .05. **p < .01. ***p < .001.
In terms of age-friendly community characteristics, significant differentiations in perceptions of four aspects of them were found in three groups. Older people with higher SES were more likely to be satisfied with their housing conditions (p < .001). Those of higher SES had better awareness of local amenities (p < .001) and community services (p < .001) near their living areas. As to social inclusion, older adults in the low-SES group rated the lowest level of social inclusiveness compared to elders in the other two groups (p < .001).
Influences of SES and Age-Friendly Communities on Life Satisfaction
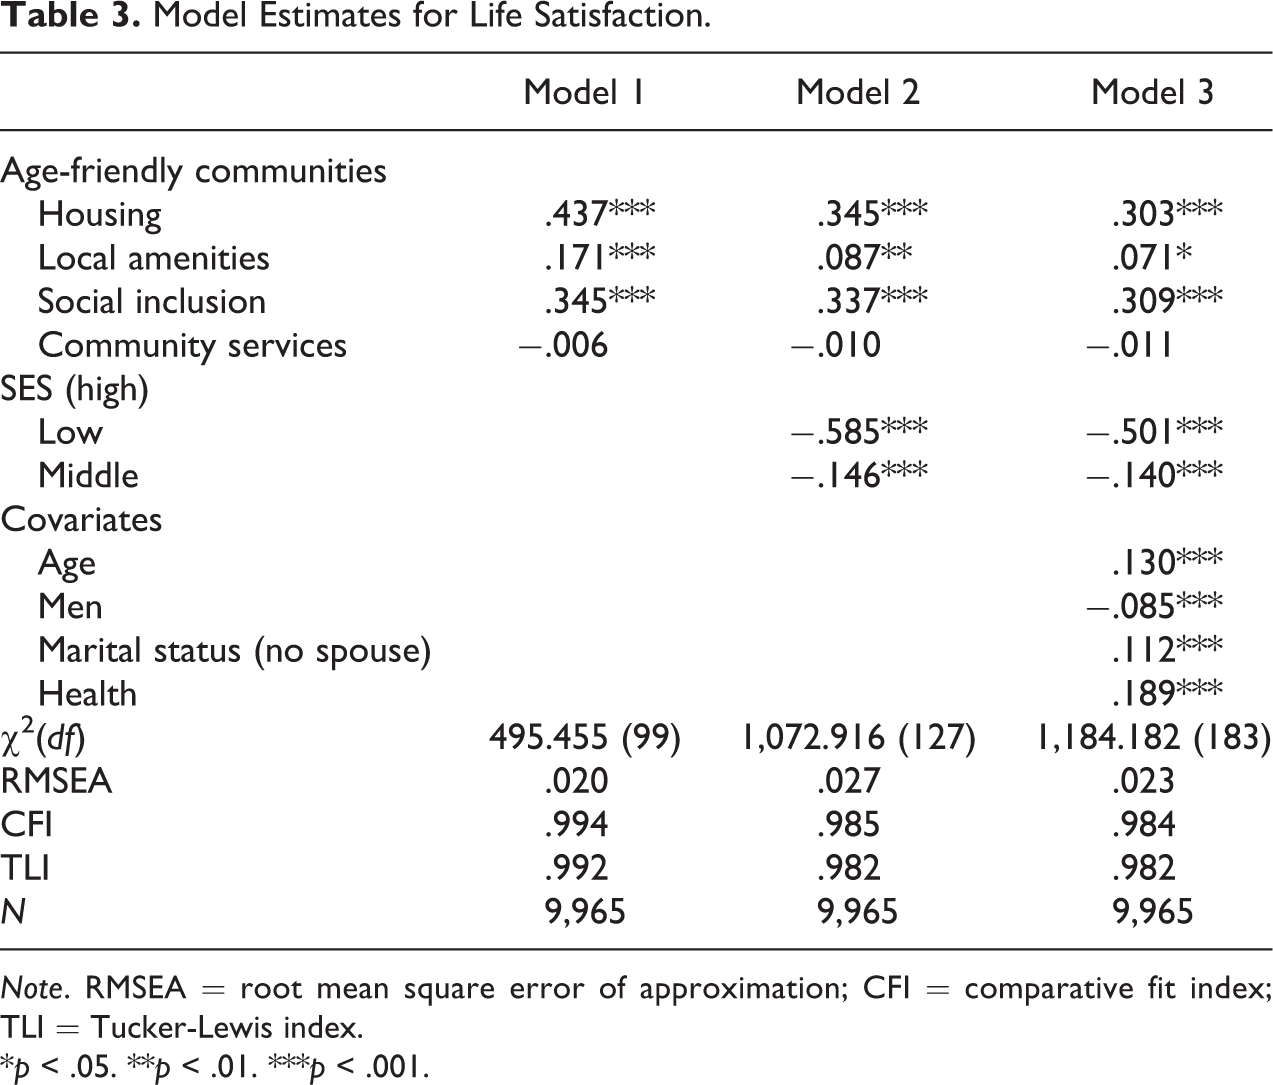
Table 3 displays three hierarchical models. Indices for Models 1–3 met our threshold criteria (RMSEA = .020, CFI = .994, and TLI = .992 for Model 1; RMSEA = .027, CFI = .985, and TLI = .98 for Model 2; RMSEA = .023, CFI = .984, and TLI = .982 for Model 3), demonstrating that the data appropriately fit our models.
Model Estimates for Life Satisfaction.
Note. RMSEA = root mean square error of approximation; CFI = comparative fit index; TLI = Tucker-Lewis index.
*p < .05. **p < .01. ***p < .001.
In Model 1, we analyzed the extent to which older people’s perceptions of different aspects of age-friendly communities were associated with life satisfaction. Except for community services, all other environmental characteristics were significantly related to life satisfaction. Older people who were satisfied with their housing conditions were more likely to have a higher level of life satisfaction compared to those who felt unsatisfied (γ = .437, p < .001). Local amenities were also positively associated with life satisfaction (γ = .171, p < .001). Elders with better perceptions of a socially inclusive environment were likely to have a higher level of life satisfaction as well (γ = .345, p < .001). Positive relationships persisted in Models 2 and 3 when SES and other covariates were taken into account.
We entered SES variables into Model 2 and reestimated life satisfaction. As compared to high-SES group, older people with lower SES were less likely to be satisfied (γ = −.585, p < .001 for low-SES group; γ = −.146, p < .001 for middle-SES group). These relationships sustained in Model 3.
Regarding demographic characteristics and health conditions, all covariates were associated with life satisfaction. Elders with older age were more likely to be satisfied with their lives than younger elders (γ = .130, p < .001). Men were less satisfied with their lives compared to women (γ = −.085, p < .001). Older people with a spouse scored higher life satisfaction than counterparts without a spouse (γ = .112, p < .001). Better self-rated health was positively associated with higher life satisfaction (γ = .189, p < .001).
Toward an Examination of the Moderating Effect of SES
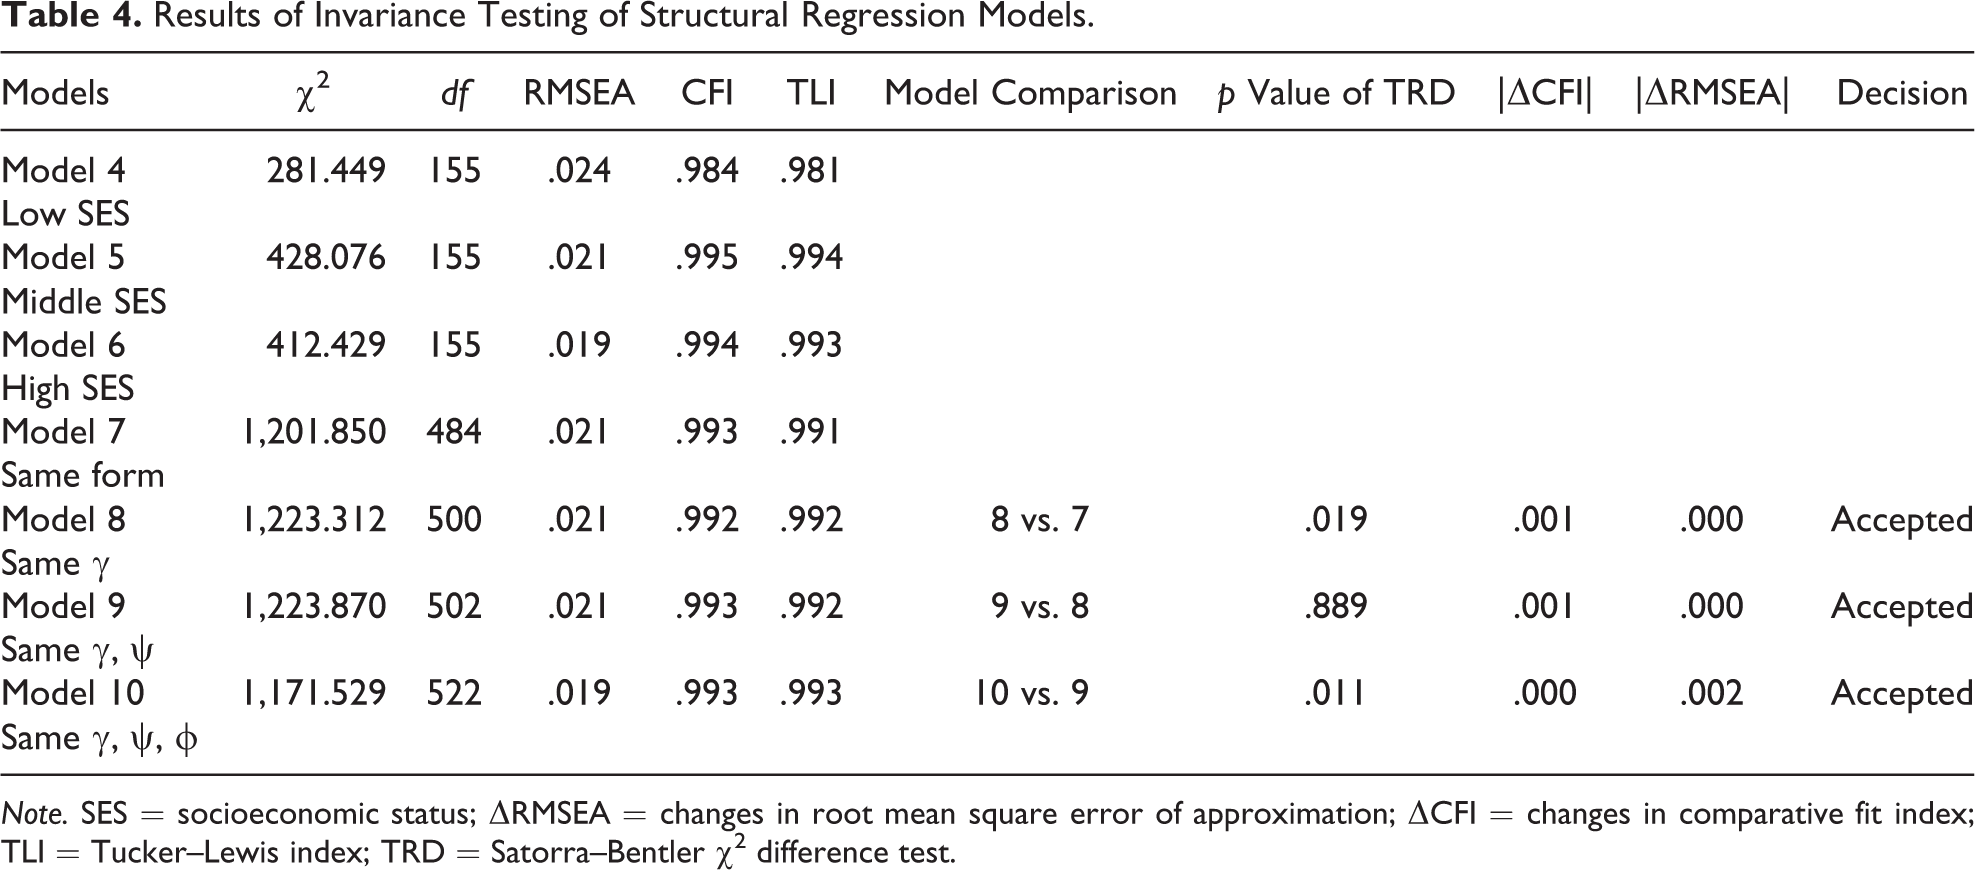
We employed multigroup SEM to test structural invariance across three SES groups. We estimated life satisfaction separately for low, middle, and high socioeconomic groups to obtain baseline models (Models 4–6). As shown in Table 4, three baseline models received sufficient model fits. Therefore, we continued to analyze the same form model (Model 7), in which factor loadings of all latent variables were fixed to be the same across groups. Results show that we can accept the “same form” hypothesis with RMSEA = .021, CFI = .993, and TLI = .991. In Model 8, we equalized the coefficients between exogenous variables and life satisfaction across groups. Since we used WLSMV estimator, TRD was performed to compare Model 8 with Model 7. The nonsignificant result of TRD (p = .019) and changes in CFI (ΔCFI = −.001) and RMSEA (ΔRMSEA = .000) suggests that we cannot reject the “same γ” hypothesis. We constrained the variance of structural disturbance terms to be equal across groups in Model 9 and compared it with Model 8. TRD between these two models was nonsignificant (p = .889), ΔCFI = .001, and ΔRMSEA = .000, suggesting that we can further constrain the variance and covariance of exogenous variables to be equal across groups (Model 10). The χ2 difference between Models 9 and 10 was not significant (p = .011), ΔCFI = .000, and ΔRMSEA = −.002, suggesting that we cannot reject the same γ, ψ, and φ hypothesis. The results of multigroup comparison tests supported structural invariance across groups, indicating that SES does not moderate relationships between age-friendly communities and older people’s life satisfaction; older people from low, middle, and high socioeconomic groups follow the same pattern as age-friendly communities for life satisfaction, so we accepted Model 3 as the final one.
Results of Invariance Testing of Structural Regression Models.
Note. SES = socioeconomic status; ΔRMSEA = changes in root mean square error of approximation; ΔCFI = changes in comparative fit index; TLI = Tucker–Lewis index; TRD = Satorra–Bentler χ2 difference test.
Discussion
The main goal of this study is to fill gaps in knowledge about the potential influence of age-friendly communities in older people’s life satisfaction in a Chinese context. The findings supported positive relationships between specific aspects of age-friendly communities and older people’s life satisfaction. Empirical evidence showed that although disparities in the aforementioned relationships did not exist among low, middle, and high socioeconomic groups of older people in urban China, perceptions of age-friendliness of the communities varied by SES groups. Socioeconomically vulnerable elders had a relatively negative perception toward supportive communities compared to their counterparts, who had higher SES.
To the best of our knowledge, this is the first study examining the associations between older people’s perceptions regarding age-friendly communities and their life satisfaction in China. Results of SEMs partially supported our hypothesis that age-friendly communities were positively associated with Chinese older people’s life satisfaction. After controlling for SES and demographic covariates, we found that age-friendly characteristics of housing, local amenities, and social inclusion subdomains were significantly related to life satisfaction. Older people who were satisfied with their housing conditions were likely to have a higher level of life satisfaction than those who were not. This echoes previous studies that demonstrated positive associations between housing conditions and older people’s well-being (Lord et al., 2006; Park & Lee, 2017; Wahl et al., 2009). Housing conditions play a fundamental role in elders’ safety and well-being that allow them to age comfortably and safely within the community (WHO, 2007). The mandatory retirement age in urban China is 55 for women and 60 for men. According to the Global AgeWatch Index 2015 (HelpAge International, 2015), the average person aged 60 in China is expected to live another 19 years, and houses are where older Chinese adults prefer to spend most of their time after retirement due to the deeply rooted filial piety culture and family-care traditions. This may explain why community-dwelling elders’ perception of housing conditions was significantly associated with their life satisfaction. The evidence we found sheds light on the importance of ameliorating housing conditions to meet older residents’ needs.
Local amenities were found to be positively associated with life satisfaction. Physical infrastructure that supports older people’s daily activities is one of the essential characteristics of an age-friendly environment (Scharlach & Lehning, 2013). Proximally located leisure and living amenities such as shops, hospitals, banks, and parks facilitate aging-in-place (Hillcoat-Nallétamby & Ogg, 2014). It may also reduce potential risks associated with long-distance transportation. Previous studies found that those who live within a reasonable walking distance to living amenities were more likely to participate in physical activity and had lower odds of being obese (Frank et al., 2006; King et al., 2005), all of which are related to older people’s quality of life.
In addition to physical environment, social inclusion was strongly associated with life satisfaction according to our study. This finding is consistent with previous studies that demonstrated the importance of social inclusion on older people’s subjective well-being. Park and Lee (2017) found that older Korean adults who perceived themselves as socially included were more likely to be satisfied with life. Thomas and Blanchard (2009) advocated that “aging-in-community” should replace “aging-in-place” as a policy goal, indicating that a socially inclusive environment and interpersonal bonds are essential to older people in addition to independent living. Unlike our hypothesis, community services were not necessarily associated with life satisfaction, which concurred with previous studies that demonstrated no significant association between services and older people’s subjective well-being (Lehning et al., 2014; Subramanian, Kubzansky, Berkman, Fay, & Kawachi, 2006). One possible explanation is the low level of acceptance and uptake of community care services by older Chinese adults. As shown in Table 2, awareness of community services is quite low regardless of SES levels. Although the Chinese government has put great efforts into developing community care systems in recent years, family members are still the first choice of caregivers for most older people. Their indifferent attitude toward community services may account for the nonsignificant relationship of such services with life satisfaction. However, one study found age-friendliness in the service environment was positively associated with life satisfaction among Korean elders (Park & Lee, 2017). These mixed findings suggest a need for further studies on the influence of community services for older people’s subjective well-being.
Our findings confirmed the hypothesis that disparities lie in perceptions of age-friendliness of the communities for older people with different SESs. Socioeconomically disadvantaged older adults generally have lower perceptions of a community’s age-friendliness. Particularly, low-SES elders were less likely to feel satisfied with housing conditions. This finding concurred with Park and Lee’s study (2017) which found that poor older adults were likely to experience housing problems (e.g., leaking roofs and broken equipment) that would lead to unsafe and uncomfortable living conditions. Although it has been 2 years since livable environment was written in the revised Old-Age Law in China, in which “providing guidance and support for age-friendly housing development” was clearly stated as part of the governmental responsibilities, no follow-up direction and guidance has been developed so far. It is urgent that the government should provide guidance and economic support for housing modifications and renovations to create a safe and barrier-free living environment for older adults who lack the resources to make the desired infrastructure changes. Perceived availabilities of local amenities and community services were found to be significantly lower in the socioeconomically vulnerable group. This may be explained by limited social networks, resulting in a lack of service- and amenity-related information (Tang & Lee, 2011). In other words, low-SES elders may not have sufficient informational support, which in turn limits their awareness of and accessibility to resources for aging-in-place. This finding implies that in addition to the adequate supply of community services and amenities, accessibility and availability of those services and amenities should be ensured when building up community care systems. Especially for individuals who have great needs but are likely to be constrained by their limited resources and social networks, community staffs may visit their home occasionally to get them updated about the related information. In addition to disparities in the physical and service environment, low-SES groups were more likely to have a lower rate of social inclusion. This result was in line with WHO’s findings from 33 cities that older people with lower SES were less likely to be respected and included by others (WHO, 2007). One possible way to increase the social inclusion of the disadvantaged older population is to actively engage them in community activities (e.g., volunteer services). These activities may contribute to older adults’ esteem in the community. As discussed, housing, local amenities, and social inclusion may be vital determinants linked to life satisfaction. Thus, it is indispensable to improve age-friendliness in these aspects to increase elders’ subjective well-being, especially for disadvantaged elders.
For our last hypothesis, the results of multigroup comparison tests demonstrate that no moderating effects of SES were found in the relationships between age-friendly communities and life satisfaction. These findings do not support previous research that elders with low SES are more likely to have higher life satisfaction when they perceive higher levels of age-friendliness in the physical and social environment (Park & Lee, 2017). One possible explanation for this contradictory result is due to the measurement of SES. In the study by Park and Lee (2017), SES indicators were defined by living arrangements and income. Older adults who were living alone and poor were classified in the lowest SES group. Although the authors stated that living alone is a manifestation of social stratification in Korea, since those individuals are generally older women, with lower education attainment in their sample, careful attention must factor into the logic of interpreting such relationships. For instance, it is known that Chinese older people who live alone are more likely to be older women and have a lower educational level. However, socioeconomically vulnerable older adults do not necessarily live on their own. Those who have not completed primary school and those with no income are more likely to live with their children (Chen & Chen, 2016). In other words, using living arrangements and income as indicators of SES may exclude some socially disadvantaged elders from the low-SES group in China. Studies from Western countries demonstrated that elders who live alone were found to be better off in education and income than their counterparts with other living arrangements (Wiemers, Slanchev, McGarry, & Hotz, 2017). Therefore, the moderating effects should be analyzed with caution when using living arrangements as an SES indicator, especially when attempting to extend the results to other cultural contexts. In the current study, we follow the widely accepted method to gauge SES through a combination of educational attainment and income. These indicators are more related to an individual’s capability and access to resources, which may influence their perceptions of the environment, rather than necessarily alter the relationship between environment and subjective well-being. According to the P-E fit perspective, the match between one’s needs and environments may influence people’s subjective well-being. Having grown up in the collectivism culture that emphasizes sharing and a concern for group welfare, many older Chinese people got used to suppressing their personal needs. Although low-SES elders faced worse living conditions, their subjective needs are likely to be at a lower level as well. Low-SES elders’ perceptions of the fit between needs and conditions may be the same as high-SES elders. This finding might differ in a Western context where low-SES elders might have a higher level of subjective needs under the effect of an individualistic culture. However, empirical analysis of older adults’ perception of fit is beyond the scope of the current study. Given mixed results, more empirical cross-cultural studies with a rigorous measure of SES and further measures of P-E fit are needed to better understand the process of aging-in-place.
There are several limitations worth noting. First, we measured life satisfaction with a single item rather than a scale. It is possible that the assessment of life satisfaction may have been affected by the mood of respondents during the survey. Using a well-established scale to measure life satisfaction may enhance research results. Second, we only analyzed age-friendly communities in housing, local amenities, community services, and social inclusion due to data limitations. Modest internal validity (e.g., low αs) of some age-friendly dimensions prompts concerns about the integrity of measures in the current study. Improved measures and further data collection are required to comprehensively examine multidimensional characteristics of age-friendly environments and their associations with subjective well-being. In addition, we used older adults’ perceptions to assess age-friendliness of the environment. It would be interesting if we could compare results between self-report measures and observation methods in future studies. Third, the current study was cross-sectional, preventing the establishment of true cause and effect. The hypothesized direction of findings is likely to be one of many potential explanations. In future studies, the longitudinal design could be used to determine the causal relationships between potential factors and older people’s subjective well-being. However, despite these limitations, our findings provide suggestive evidence of significant relationships between age-friendly environments and older people’s life satisfaction. Moreover, the disparities in perceptions of age-friendliness provide valuable evidence for developing and implementing policies and programs that will benefit vulnerable subgroups of older adults in China.
Conclusion
The current study is a first step in examining the relationships between older adult’s perceptions of age-friendly communities and their life satisfaction in China. Older people’s perceptions of housing conditions, local amenities, and social inclusion were associated with their life satisfaction. No moderation effect was found regarding disparities in relationships between age-friendly communities and life satisfaction among three SES groups, demonstrating the importance of the environment to older people regardless of their SES. The perception of age-friendliness was found to vary due to different SESs. Socioeconomically vulnerable elders were apt to have a lower assessment of age-friendly communities than those with higher SES. Findings emphasize the potential role of age-friendly communities as an influential force on older adults’ subjective well-being, which provides implications for policy and practice. Changes in the environments, by reducing barriers or enhancing their supportive function, may significantly increase older people’s life satisfaction. In particular, interventions must be focused on socioeconomically disadvantaged older people who need more supports and resources to age well in their communities.
Footnotes
Declaration of Conflicting Interests
The author(s) declared no potential conflicts of interest with respect to the research, authorship, and/or publication of this article.
Funding
The author(s) received no financial support for the research, authorship, and/or publication of this article.
