
Abstract
The impact of sustainable mobility may be considered through the mode of non-motorization, which may vary by spatial environmental conditions, especially accessibility by active mobility in a necessarily safe, comfortable, and pleasant atmosphere. Sustainable mobility comprises willingness to allow commuting behaviors on non-motorized travel for safety and green ethics. These chiefly participate to create livable places, improve health and well-being, and promote quality of life and economic growth. By contrast, an impoverished street environment decreases the possibility of active mobility and relies on motorization. It is essential to explore the perception of road users through diverse environmental features of street networks and sidewalks directly affecting road user behavior and preferences about motorization and non-motorization. This study evaluated multi-indicators of sustainable urban mobility (SUM) for a group of road users, with data gathered by questionnaire-based survey. 1,998 Pathum Thani Province inhabitants in Thailand were asked to evaluate their neighborhood characteristics by SUM indicators. In addition to different social dimensions and socioeconomic backgrounds, transportation characteristics among diverse trip makers and different perceptions of mobility indicators were classified by factor analysis using principal components and spatial visualization. Results were that traffic management, including intersection controls and signage, as well as information, sidewalk, management, and personal mobility choices, is a key strategy to improve sustainable mobility. This is achieved by tailoring solutions to achieve a modal shift prioritized over other supportive facilities.
Introduction
For several decades, an urbanization trend has been driven by urban-rural migration and population growth, resulting in an unregulated increase in the urbanization process (Sultan et al., 2021). Urban transformations depend on current urban forms and infrastructure allocation; however, some regions face demographic changes through population decline and other peri-urbanization patterns (Ani et al., 2022). Interconnected urban mobility has rapidly evolved and addressed environmental, economic, and social challenges by increasing auto dependence, speed, comfort, and reliability (Suélen et al., 2021). Sustainability has become a directing objective concept for challenging urban mobility, essential to decision makers in public and private agencies for understanding public perceptions of urban mobility (Suélen et al., 2021; Sultan et al., 2021). Mobility patterns significantly contribute to altering modal shifts to sustainable travel modes by focusing on efficient urban functioning, including safe, green, accessible, and efficient connectivity (Francisco et al., 2022). The growth in urban motorization and traffic congestion have become common problems, negatively affecting quality of life (QoL) for individual daily activities and causing commuter physical and mental health issues. In this way, mobility problems critically threaten urban sustainability (Dragan et al., 2022; Sultan et al., 2021). The sustainability concept remains central in an argument increasingly focused on managing urban and transport problems simultaneously. Sustainability has become a motivating goal, inspiring substantial transformation in urban mobility (Francisco et al., 2022; Iamtrakul & Klaylee, 2023; Klaylee et al., 2023). The challenge of integrating sustainable multidimensional mobility in urban planning includes accessibility, safe transport options, and active mobility with friendly street environments constituting critical aspects of QoL (Cervero, 2013; Klaylee et al., 2023). Urban planning has long been associated with urban mobility, and urban expansion, influenced by alternative mobility modes offered to residents (Suélen et al., 2021). To achieve long-term societal sustainability benefits, urban mobility solutions should be underlined as a critical direction for local and regional governmental strategic agendas (Klaylee et al., 2023; Maximilian et al., 2022). Urban mobility comprises technical adoption and comprehensive understanding of urban morphological, social, and political elements that impede incorporating sustainability in real world solutions (Acheampong et al., 2021; Ferrero et al., 2018; Fishman et al., 2013; Klaylee et al., 2023). Recently, different alternative mobility models have been developed internationally, based on diverse urban contexts and population characteristics. Another step towards sustainable mobility is meeting climate change commitments by reducing greenhouse gas emissions and creating livable communities by integrating green, sustainable public transport systems and active mobility with environmentally friendly streets and vehicle design and planning (Ferrero et al., 2018; Fishman et al., 2013).
Pathum Thani Province has been affected by rapid urban and transport development amidst multifaceted-related problems (Haider & Iamtrakul, 2022; Iamtrakul & Chayphong, 2021). Mass transit must still be connected to diverse informal transport and paratransit, complementing public transport for local accessibility or as an efficient feeder system. For instance, in the high density residential zones of Rangsit market and Rattanakosin 200 villages, featuring heavy traffic volume and mass transit service availability, a feeder system was needed to support connectivity to attraction areas near the station (Phun & Yai, 2016). Current transport system availability modes encounter problems in first and last mile connectivity among different urban transport chains. These connectivity issues not yet received attention or policy support from relevant authorities. Other concerns exist about service quality, road safety, environmental impact, and public transport as well as mass transit system integration (Gudmundsson & Regmi, 2017; Iamtrakul, Chayphong, Makó, & Phetoudom, 2023). Appropriate policies for promoting sustainable transport may be prioritized through comprehensive and holistic planning for all road users. Yet additional economic and social challenges remain, requiring alternative approaches to planning and solving sustainable transportation problems to create a social, economic, and environmental development balance in Pathum Thani Province. The goal is to cope with rapid urban expansion and transportation network development from the capital region of Thailand. Establishing sustainable urban mobility (SUM) among diverse road users should be a mandatory contribution to the Pathum Thani Province and suburban context. This paper evaluates opinion levels about creating solutions for SUM among diverse motorized and non-motorized transport road users by assessing multiple indicators. Indicators are designated by focusing on future technologies and environmental issues such as creating green sustainable urban mobility, comprising accessibility, walkability, transit and road safety, attractiveness and environmental quality, driver infrastructure and technology, as well as transportation service, and alternative transportation configurations (Ferrero et al., 2018; Fishman et al., 2013; Klaylee et al., 2023; Suélen et al., 2021). Resident perceptions in suburban areas may effectively identify issues as well as measurement and strategic potential for improving urban infrastructure and mobility services. In addition to clarifying user perception of urban mobility, opinion levels of key residential stakeholders may help pertinent authorities and decision-makers act appropriately to achieve sustainable urban mobility (Iamtrakul et al., 2020; Klaylee et al., 2021).
Literature Review
The World Bank defined urban mobility as “moving people from one location to another location within or between urban areas.” (United Nations, 2017). The concept is based on the sum of individual movements in accessing different destinations. It may be defined based on societal functions with dual principles: required access to housing, work, education and entertainment in addition to a preference for motorized mobility for economic reasons. Several studies investigate urban mobility indicators to create SUM: the European Commission (The European Commission, 2023) developed a comprehensive set of indicators supporting urban standardized evaluation of mobility systems. Similarly, the World Business Council for Sustainable Development collaborated with six pilot cities to test the validity and practicality of indicators, with Bangkok as a pilot city (World Business Council for Sustainable Development, 2015). However, each area has different situations, with considerations of issues or indicators duly adjusted to fit local contexts. Some commuters expressed a preference for motorized mobility due to individual socioeconomic constraints and availability of mode choices. Cost-energy efficiency might be a lesser priority in individual perception. This finding suggests that the gap among diverse road users should be further explored. Using SUM, this study applies seven groups of assessment indicators designed for data collection: (1) walkability; (2) transit safety; (3) road safety; (4) attractiveness and environmental quality; (5) infrastructure and technology; (6) transportation infrastructure and services; and (7) alternative transportation infrastructure (Gasparini & Guidicini, 1990; Klaylee et al., 2023).
• Walkability: Potentially presented by general neighborhood environmental pedestrian characteristics in terms of built environmental features, such as urban density, street network and connectivity, and land use characteristics in distributing infrastructure and amenities. Sidewalk features may pertain to paving width, obstacles, street furniture, tree shading, and ground surface quality. Pedestrian-friendliness evaluated by urban street environment concerns effects on pedestrian experiences, impacting preference for non-motorized transport (Wenxiu et al., 2022).
• Transit Safety: Street design concept allows flexibility to enhance transit safety. In considering urban mobility planning, major thoroughfare elements include amenities for vulnerable road users: sidewalks, bicycle lanes, and shared-use paths. These should allow for multi-modal connectivity with designated bus lanes, safe and accessible transit stops, and frequent, safe pedestrian, and cyclist crossings (Smith et al., 2010).
• Road Safety: Street networks should be designed to offer accessible, affordable, safe, and sustainable mobility systems for all, including resilient infrastructure with particular attention to the needs of vulnerable groups in special situations (Suélen et al., 2021).
• Attractiveness and Environmental Quality: This concept involves creating an attractive environment for motorized and non-motorized commuters with alluring tree-shaded environments as well as maintained roads for more user comfort (Smith et al., 2010).
• Infrastructure and Technology: Considering alternative technology may help design and planning strategy for stakeholders in the critical challenge of adaptability to achieve long-term urban mobility advantages. Technology may comprise smart guidance traffic lights and real-time parking space data to assist drivers (Smith et al., 2010; Wenxiu et al., 2022).
• Transportation Infrastructure and Services: These focus on service quality: public transportation frequency and stops, the integrated fare system, and bus service and Wi-Fi data (Smith et al., 2010).
• Alternative Transportation Infrastructure: To create options for public transport users, pedestrians, and cyclists in environmental elements and street facilities meeting the needs of commuters and residents (Wenxiu et al., 2022).
Methodology and Data
Study Area
Suburban areas of Pathum Thani Province were selected for this case study due to site characteristics presenting rapid urban expansion as seen in Figure 1. Urbanization rates tend to be based on developmental influence of infrastructure and services in the study region. However, greater connectivity mostly refers to road-based expressway and road network transportation, facilitating links to Bangkok (Office of the Permanent Secretary Ministry of Transport Thailand, 2016). This especially pertains to extending the State Railway of Thailand (SRT) Dark Red Line (Bang Sue–Thammasat Station) mass transit network as well as enlarging student dormitory and condominium housing estate residences (State Railway of Thailand, 2017). The impact of rapid growth in surrounding areas without controllable comprehensive planning has led to an inability to plan residential quality of life and livelihoods or efficient public transport networks connecting to other suburban areas (Iamtrakul & Chayphong, 2023; Iamtrakul, Padon, & Klaylee, 2022). Nevertheless, traffic congestion has become a main challenge in exurban Bangkok, creating associated issues (Bureau of Highway Safety Department of Highway, 2019; Wandani et al., 2018). Road safety issues also present a critical problem with highest regional fatality rates from road accidents in Pathum Thani Province (9.628 per 100,000 population) (Accident Data Center of Thailand: Thai Rsc, 2019; Iamtrakul, Chayphong, Makó, & Phetoudom, 2023). Air pollution as an environmental health threat presents an average of 2.5 fine particulate matter (PM) in 2019, over 160 μg per cubic meter (M3). 10 PM in 2019 measured over 141 μg per M3 (Thailand Pollution Control Department (PCD), 2021; Air Quality and Noise Management Bureau Pollution Control Department (PCD) Ministry of Natural Resources and Environment, 2018). The related problem of burning garbage and rice fields for agricultural work has dramatically affected resident health. Long-term exposure to air pollution presents may be carcinogenic, damaging the respiratory system, and causing fatalities (Danutawat & Nguyen, 2007). Study area: Pathum Thani Province, Thailand.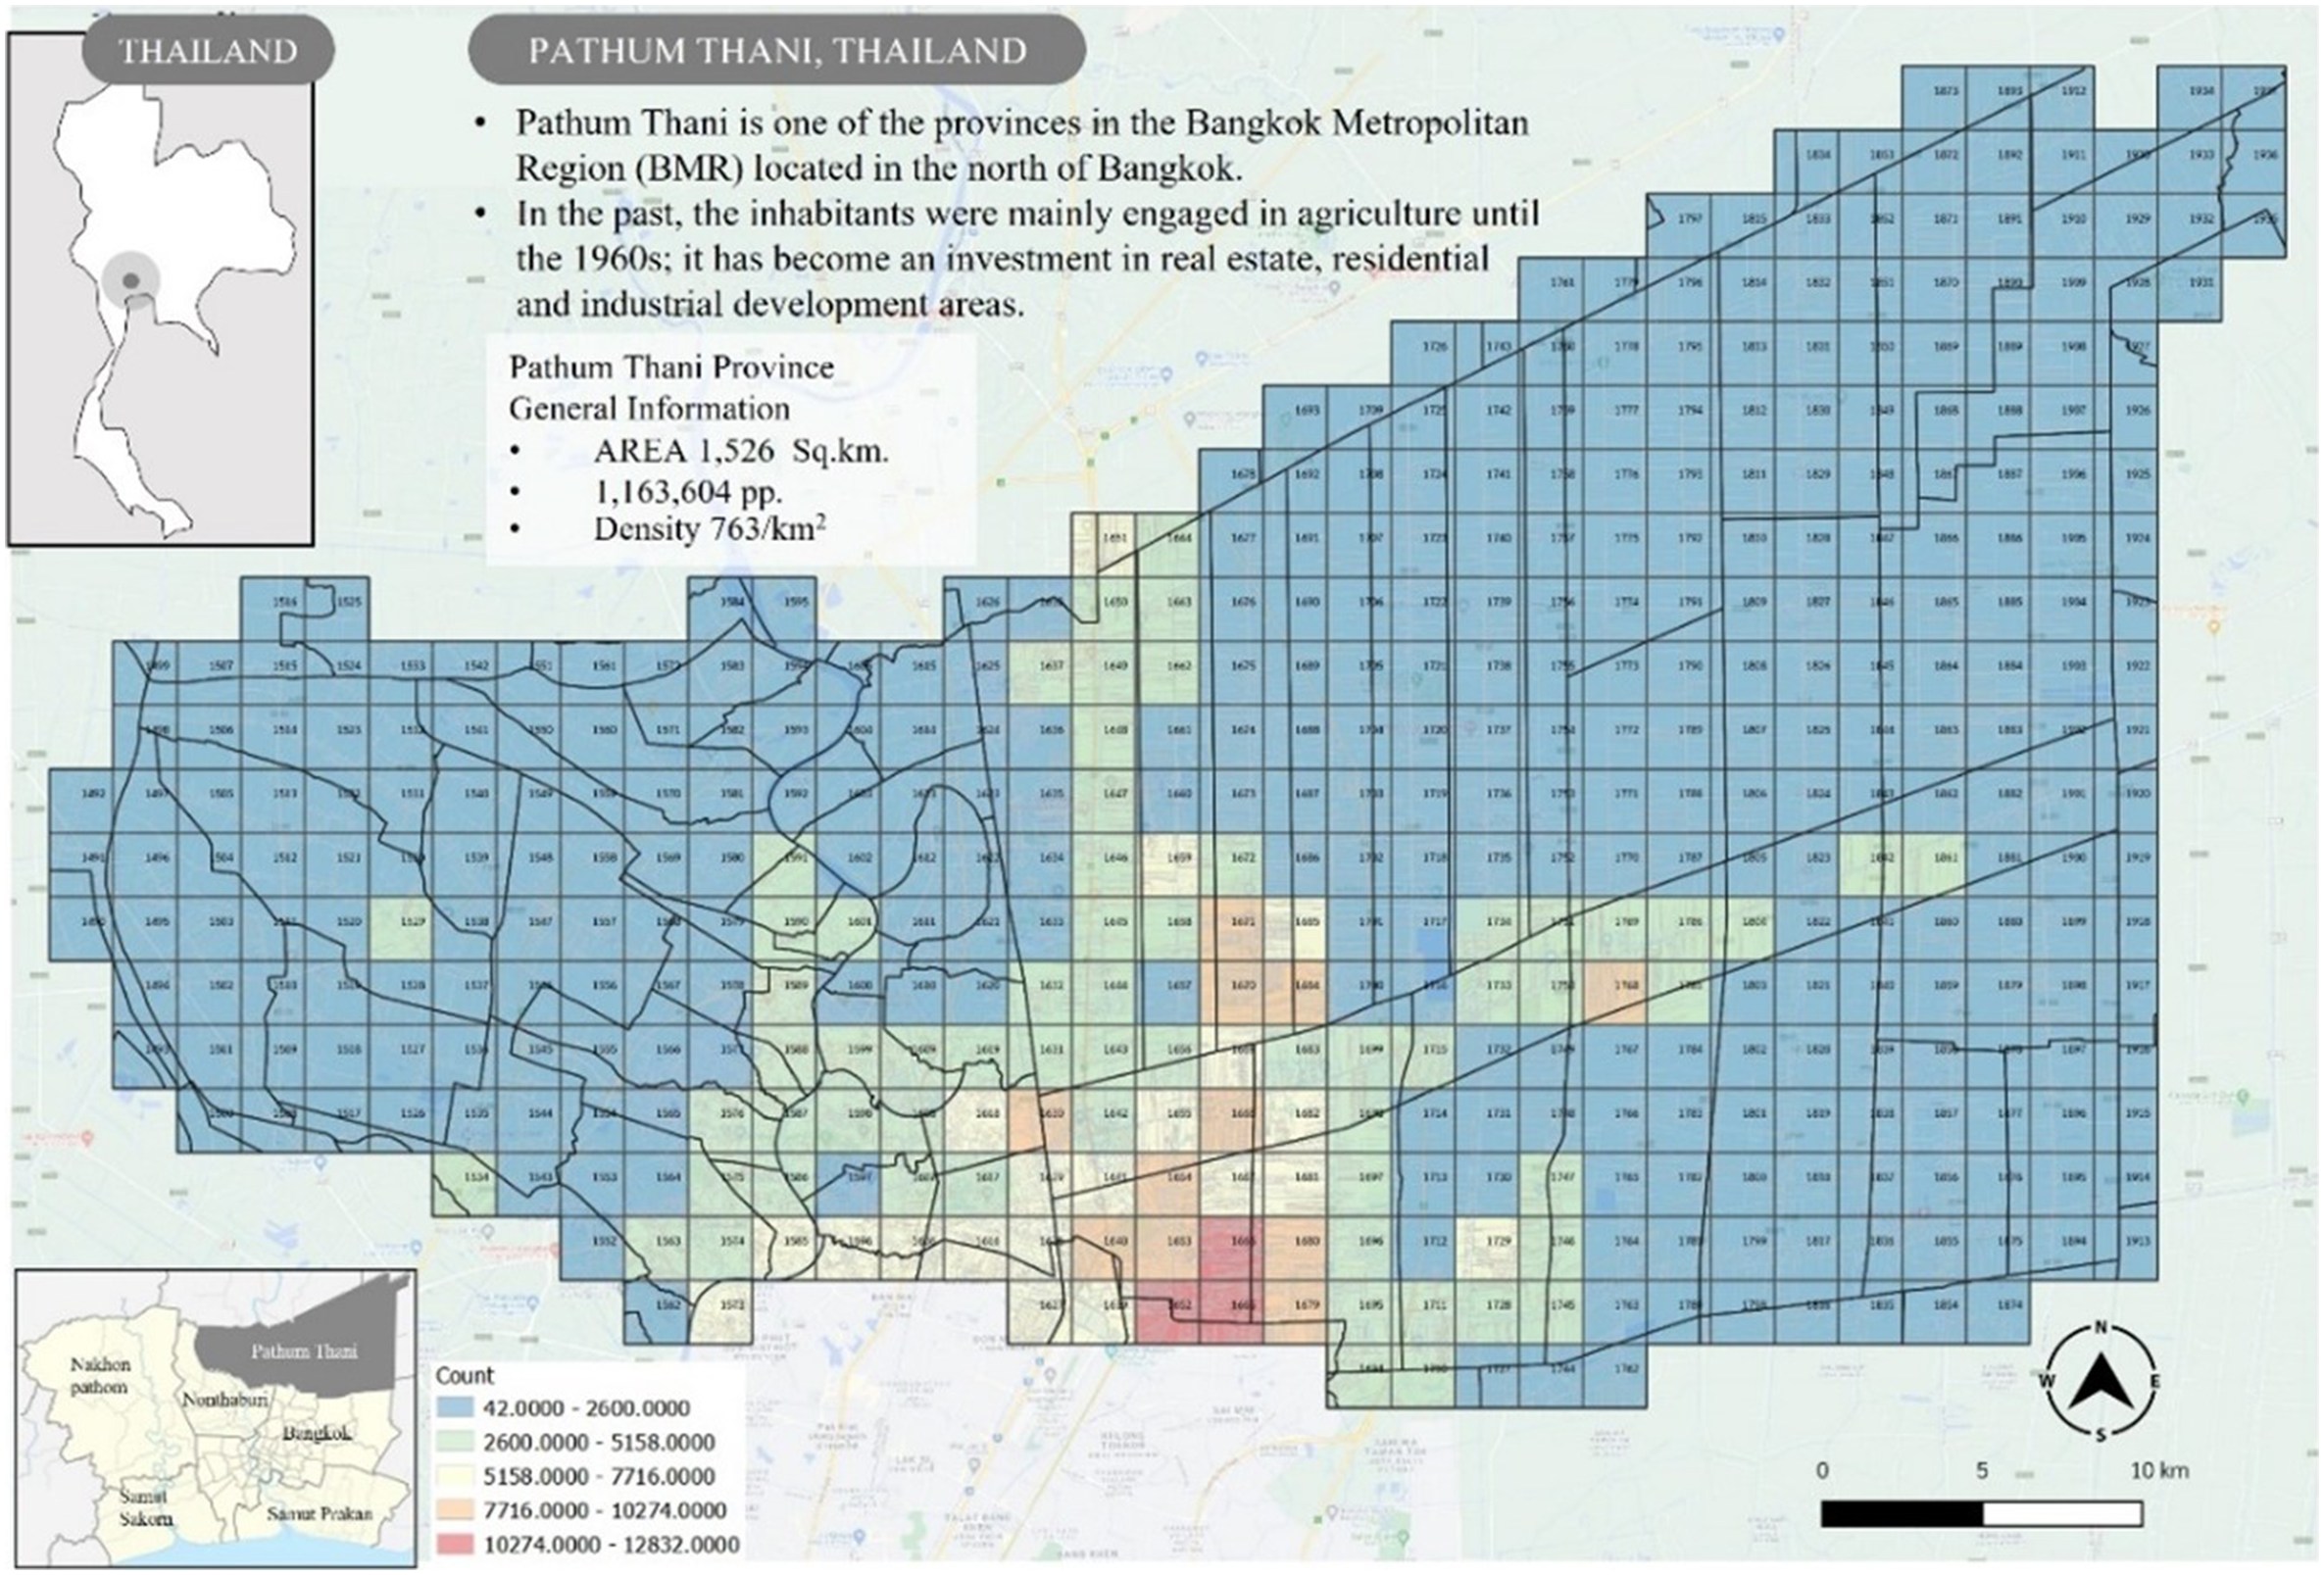
Data Collection and Research Design
The sample size was based on Krejcie and Morgan (1970) with degree of accuracy expressed as 2.5% of the 1,500 data sets (Krejcie & Morgan, 1970). However, total data collection was filtered to obtain information on 1,998 samples. Data was collected from Pathum Thani residents, focusing on opinion levels for resolving SUM challenges. The survey questionnaire asked motorized and non-motorized road users to express attitudes, evaluated by multiple indicators. Questionnaires were distributed according to population density in each study area grid based on spatial analysis. All districts were covered by distributing questionnaires to samples in spatial areas for all grids of 2,000*2,000 square meters (427 grids) as shown in Figure 1. Questionnaires included 40 questions to characterize respondent profile and evaluate socioeconomic attributes assessed by six metric evaluation levels. Analysis scale ranged from one to six, from total disagreement to total agreement (see Figure 2) (Janjamlah & Kaewlai, 2021). Analytic concept.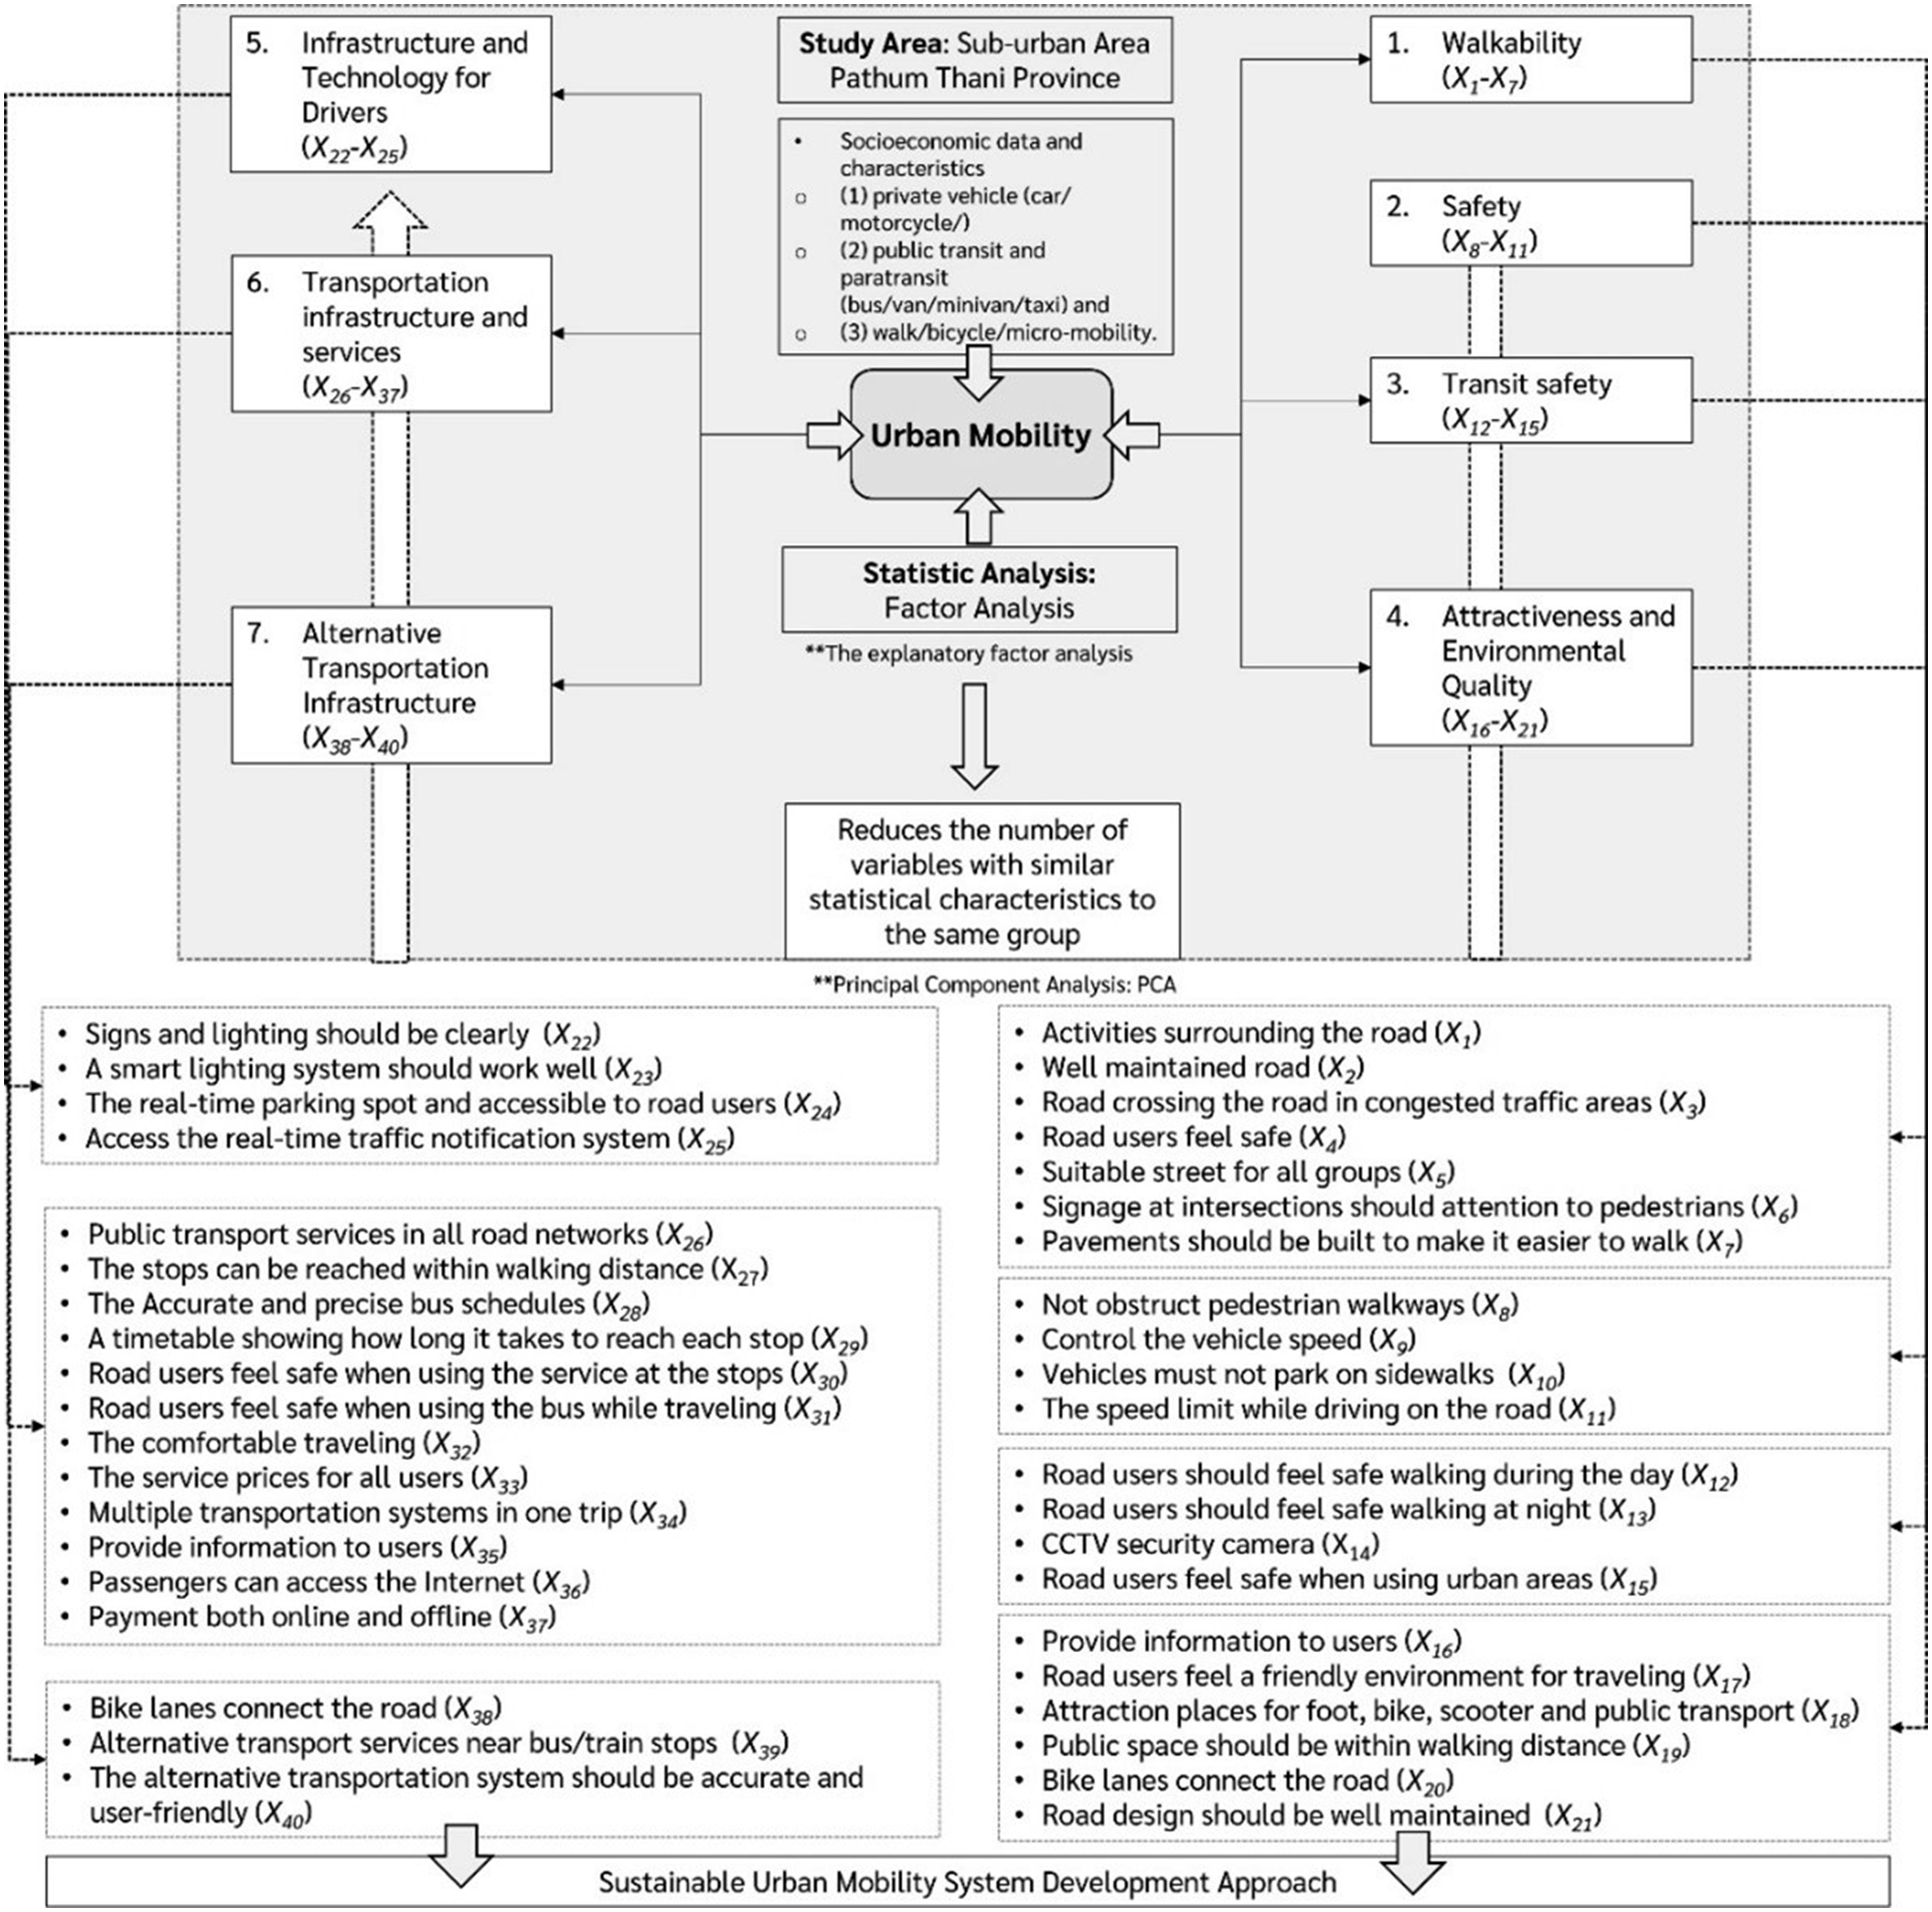
Analysis
This study applies factor analysis (FA) with principal component analysis (PCA), classified by urban mobility indicators. These instruments are often classed together as multivariate statistics with the multidimensional potential. PCA allows for reducing the number of factors adopted by FA in this study to classify all factors and identify latent variables for clear data interpretation. Finally, spatial visualization based on geographical analysis was applied, allowing for further discussion about urban mobility indicator groups with diverse characteristics in the study area.
Results and Discussion
Socioeconomic Characteristics and Respondent Travel Patterns
Respondent Demographic and Socioeconomic Profile.
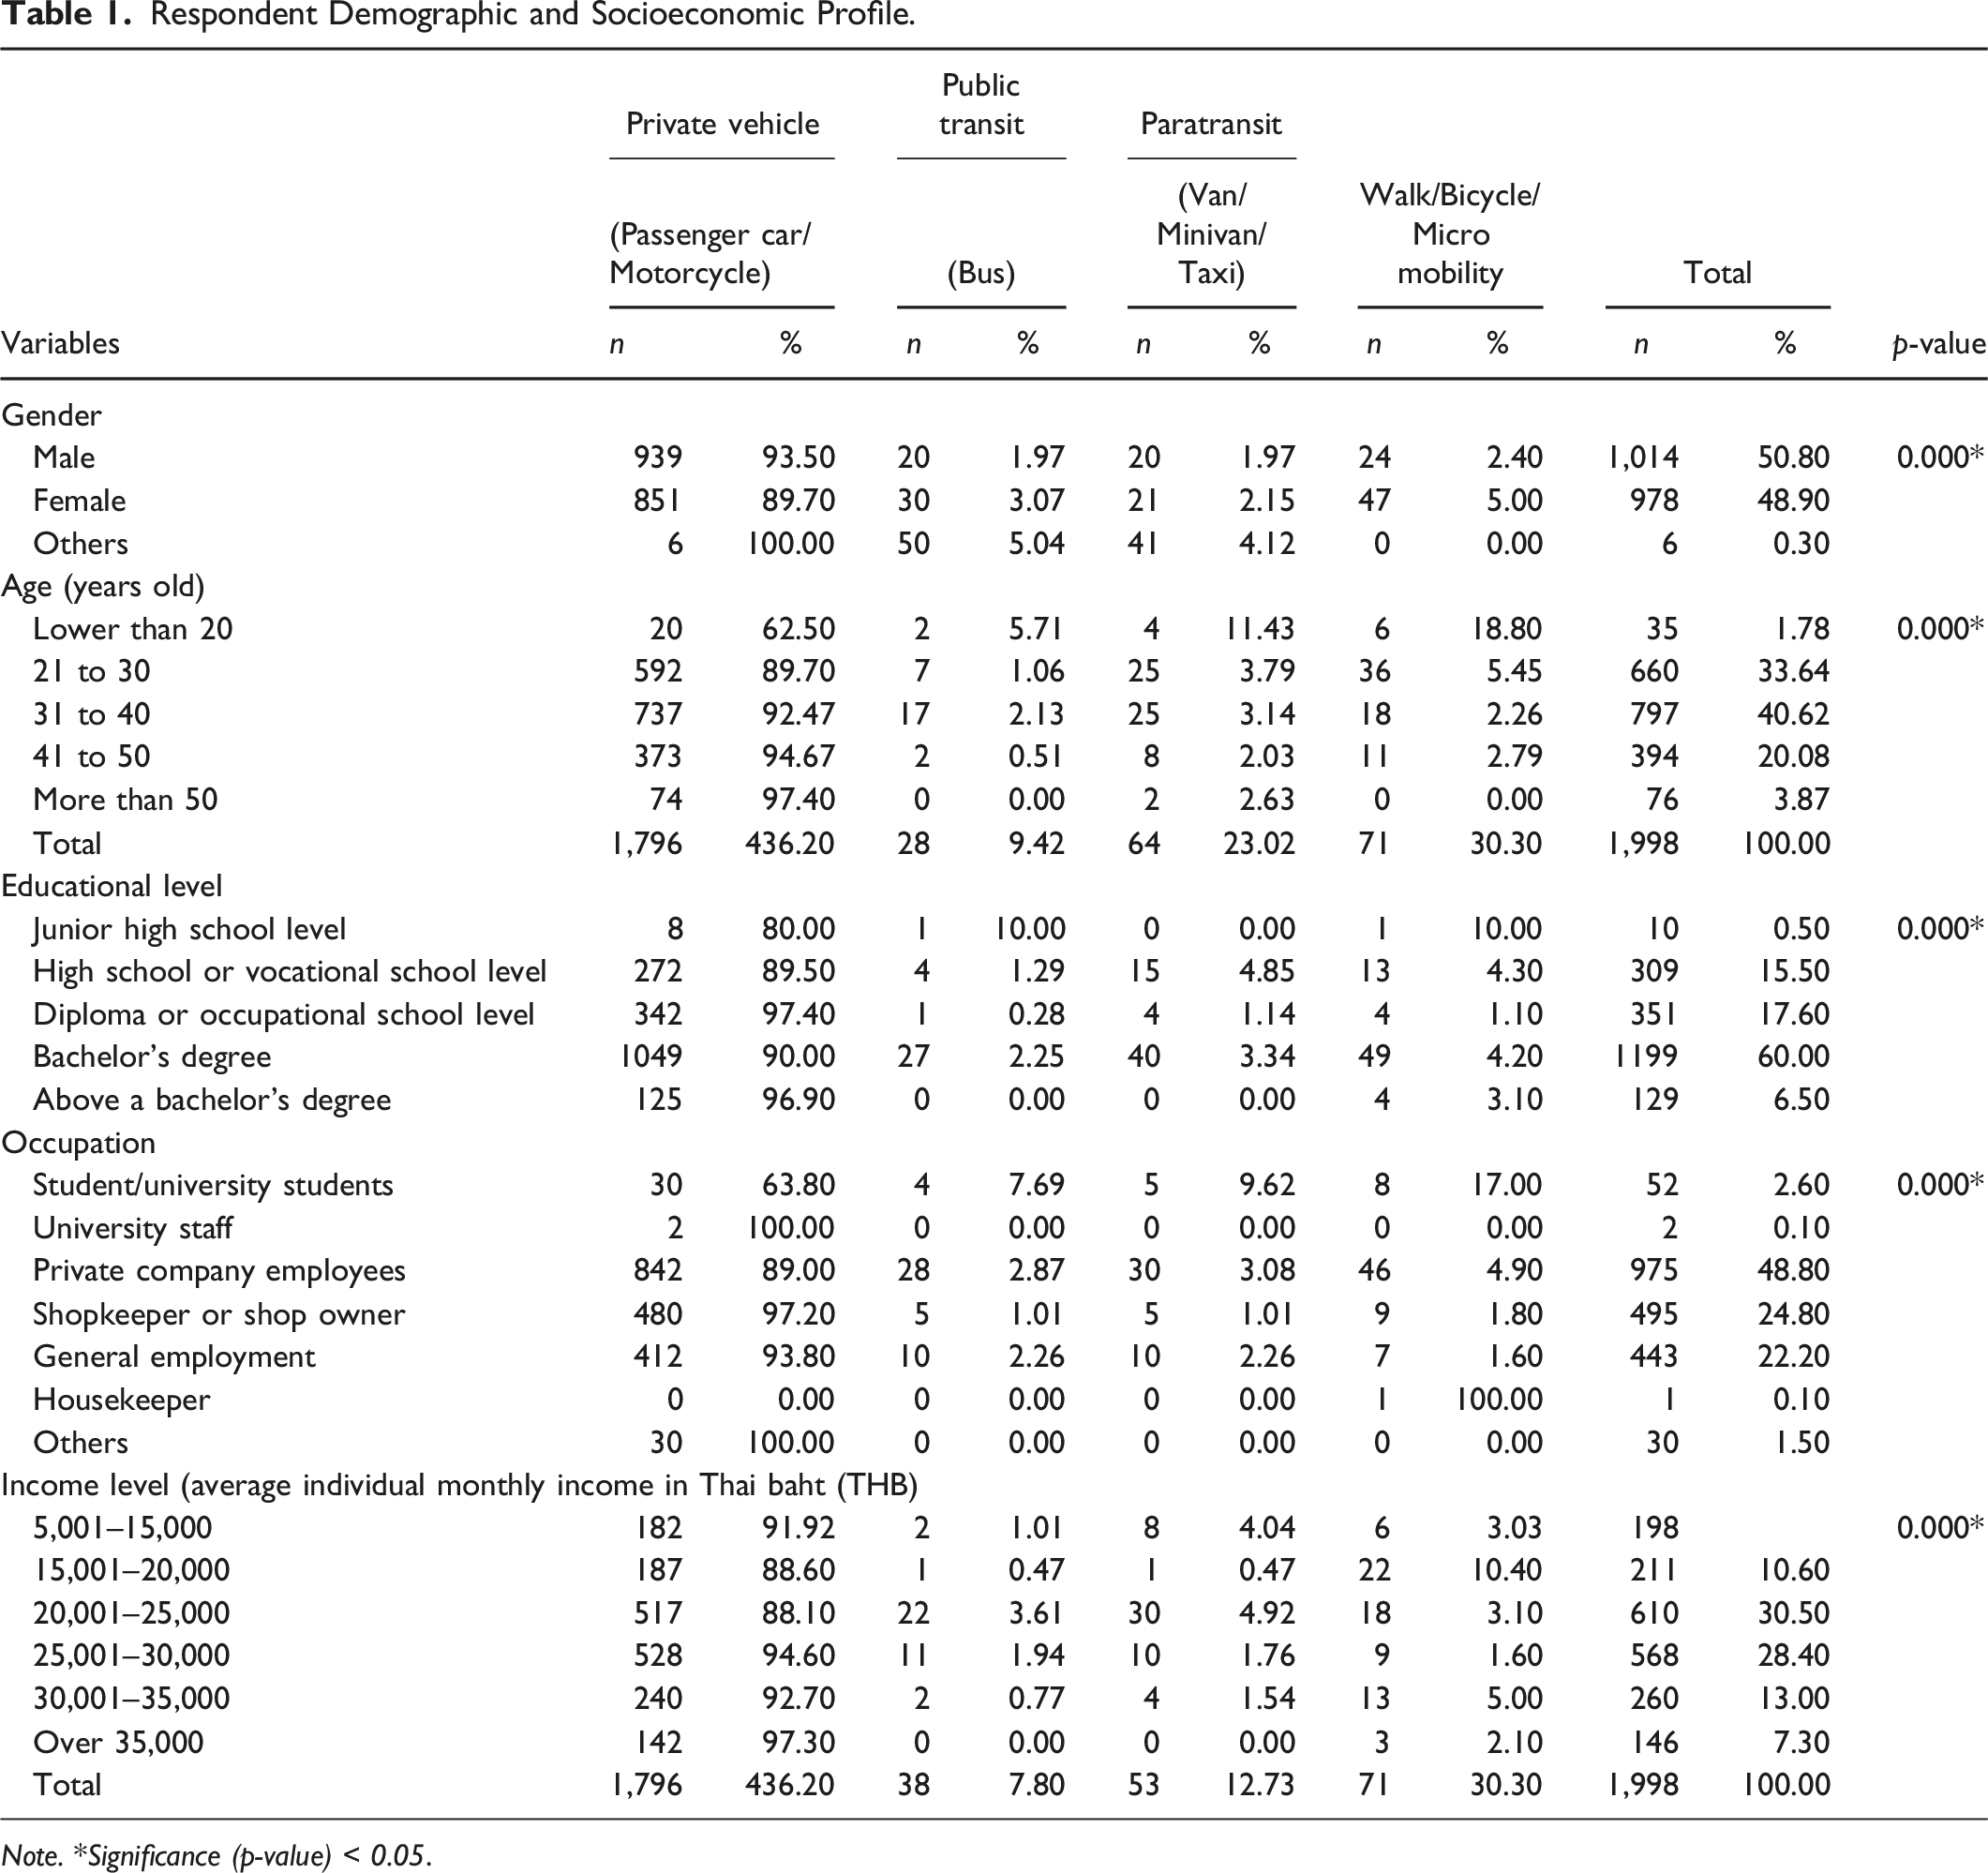
Note. *Significance (p-value) < 0.05.
Respondent Transportation Characteristics.
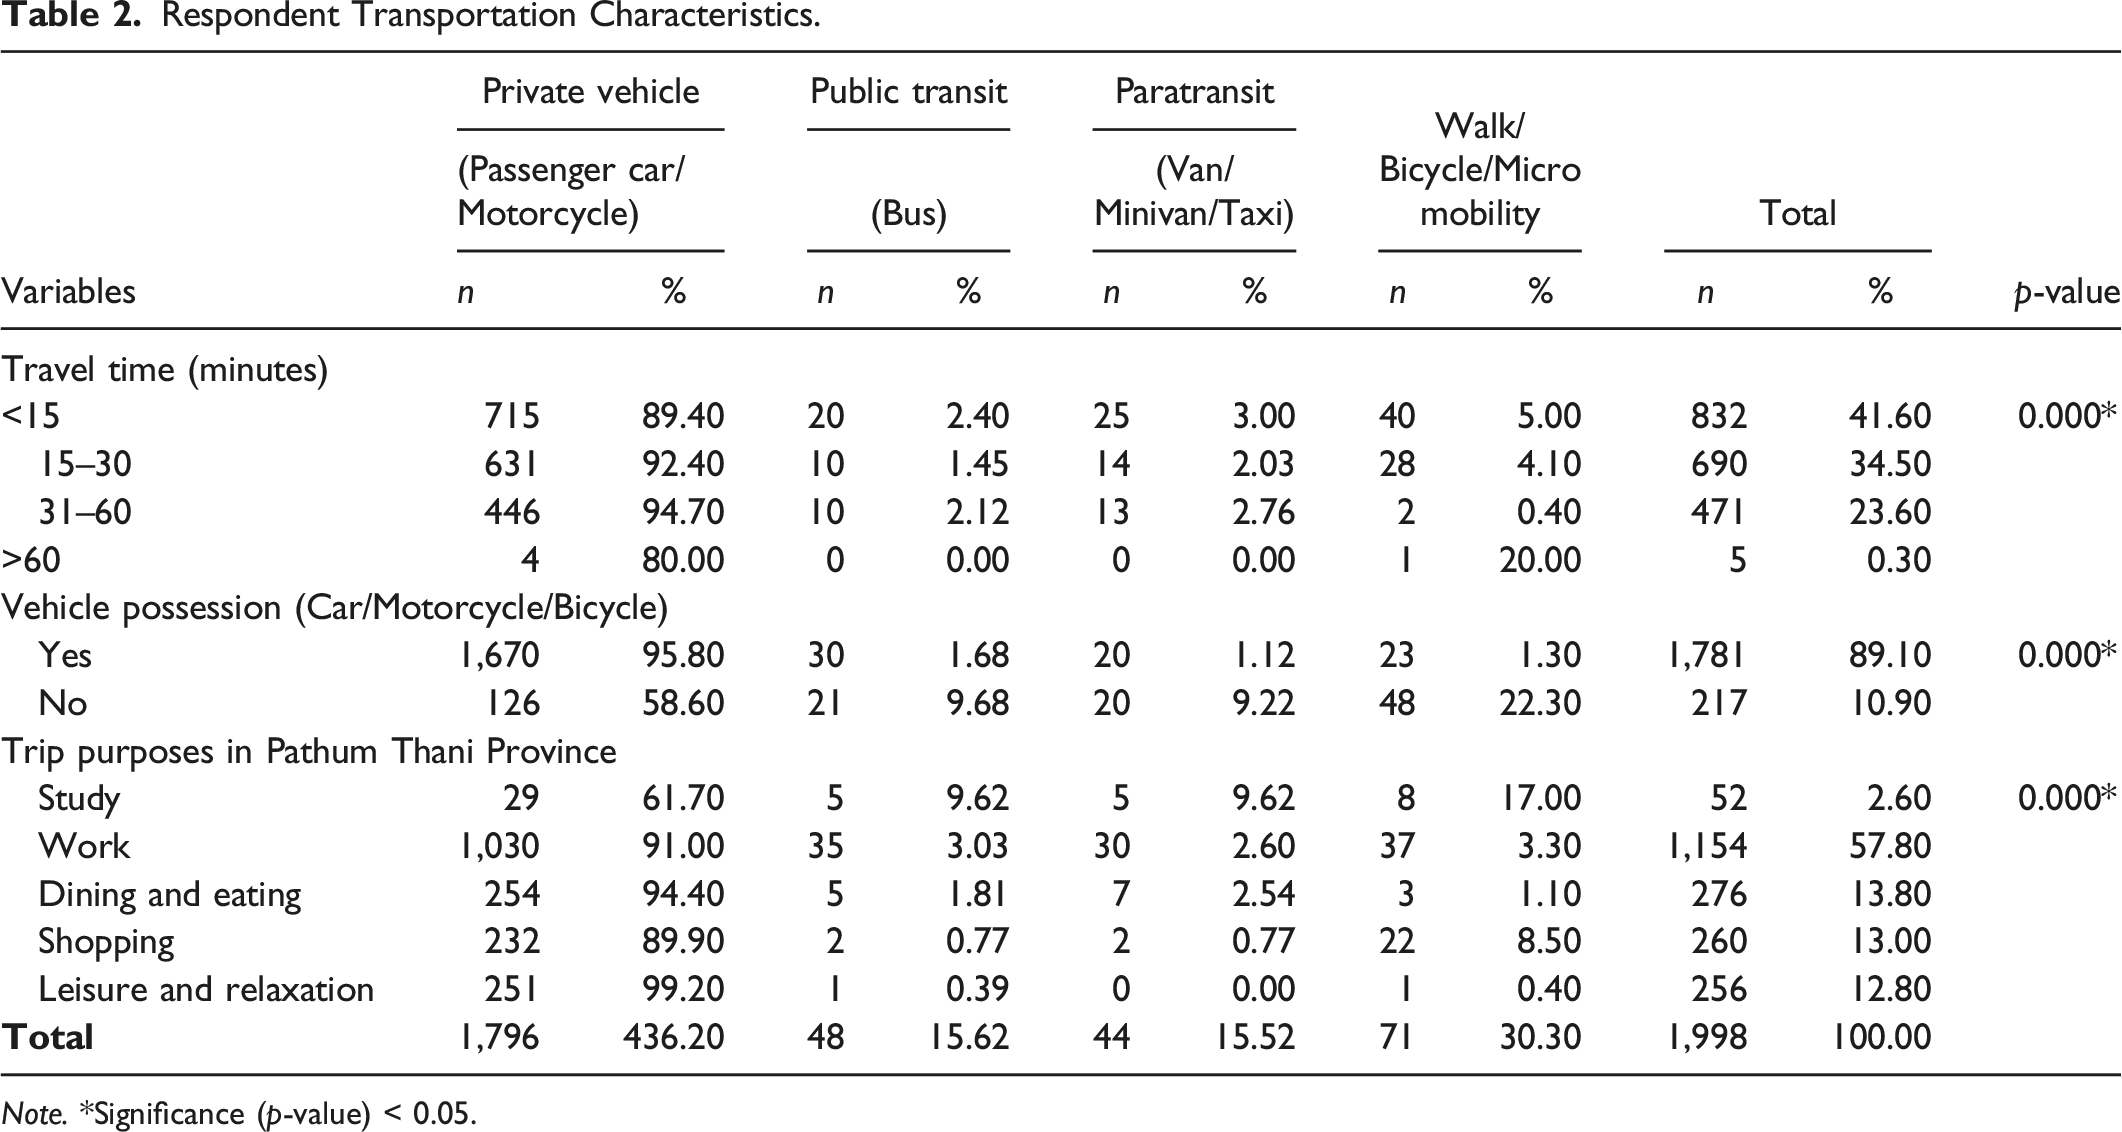
Note. *Significance (p-value) < 0.05.
In addition, when considering the nature of travel as shown in Table 2, the travel distance for commuting in suburban areas was 15–30 minutes (34.50%), with 57.80% commuting to work.
Respondent Opinions on SUM in Suburban Areas Based on Factor Analysis
Contributing factor groups were analyzed by factor analysis with exploratory factor analysis applied to determine categorizations among different factors to reduce the number of variables with similar statistical characteristics to an identical group of factors. The 40 factors were imported to reduce variable redundancy as seen in Figure 2.
Input variables were checked to avoid heteroscedasticity interference before proceeding to further analytic steps. Figure 3 demonstrates results of descriptive statistical analysis of main variables analyzed by PCA. Analytic results indicated that among 40 input factors, seven groups were extracted based on eigenvalue determination. Statistical testing presented a value exceeding 1.0, and rotation sums of squared loadings were considered in which the cumulative percentage (%) presented the final group among all seven group factors retaining the (accumulated) percentage of explained variance (67.58%) for a good component solution fit. Results as seen in Figure 3 were that the most critical factors included activities surrounding the road network (X
1
= 5.67) and road users feeling safe in urban areas (X
15
= 5.67), followed by the speed limit for drivers (X
11
= 5.62). The alternative transportation system should be precise and user-friendly (X
40
= 5.61), and road users should feel safe walking at night (X
13
= 5.60), followed by a timetable indicating how long it takes to reach each stop (X
29
= 5.59) and accessing a real-time traffic notification system (X
25
= 5.58), respectively. The analysis demonstrated that Pathum Thani Province residents were aware of activities near the road area, such as street food and voyage safety. This also includes creating a travel-friendly environment with visible options and most respondents moving on foot and public transport being students. Descriptive statistical analysis of main variables.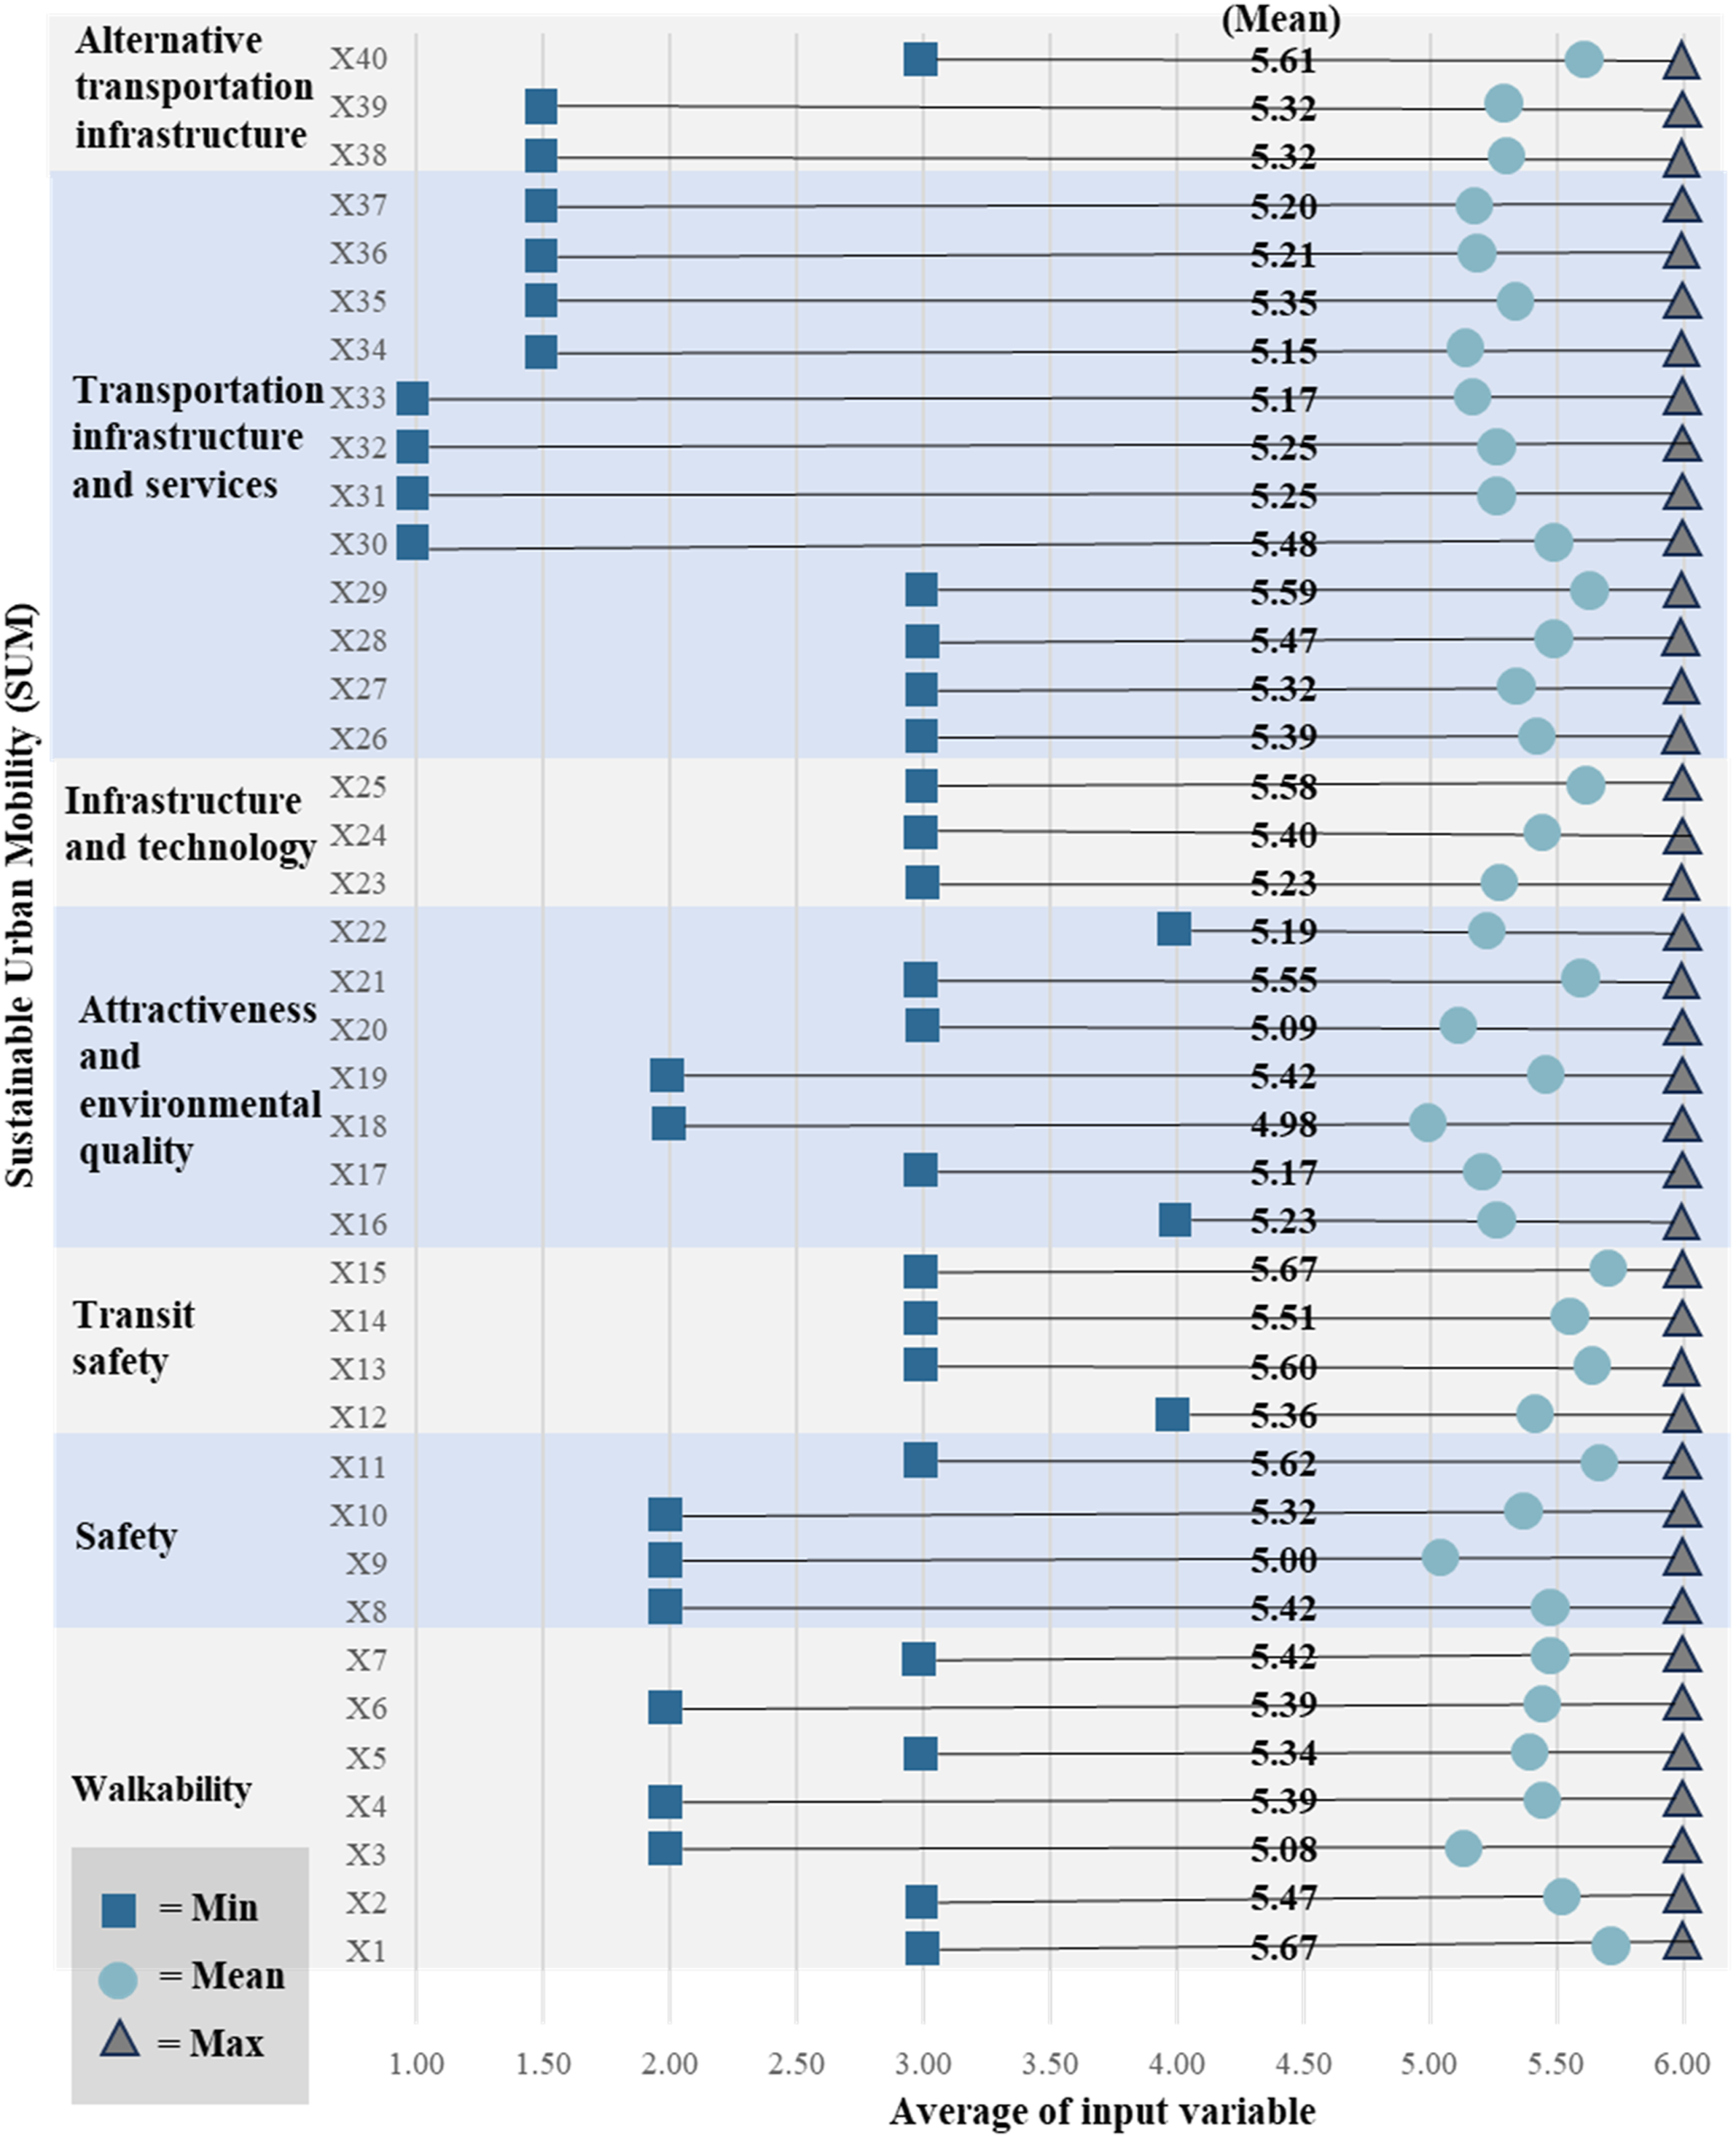
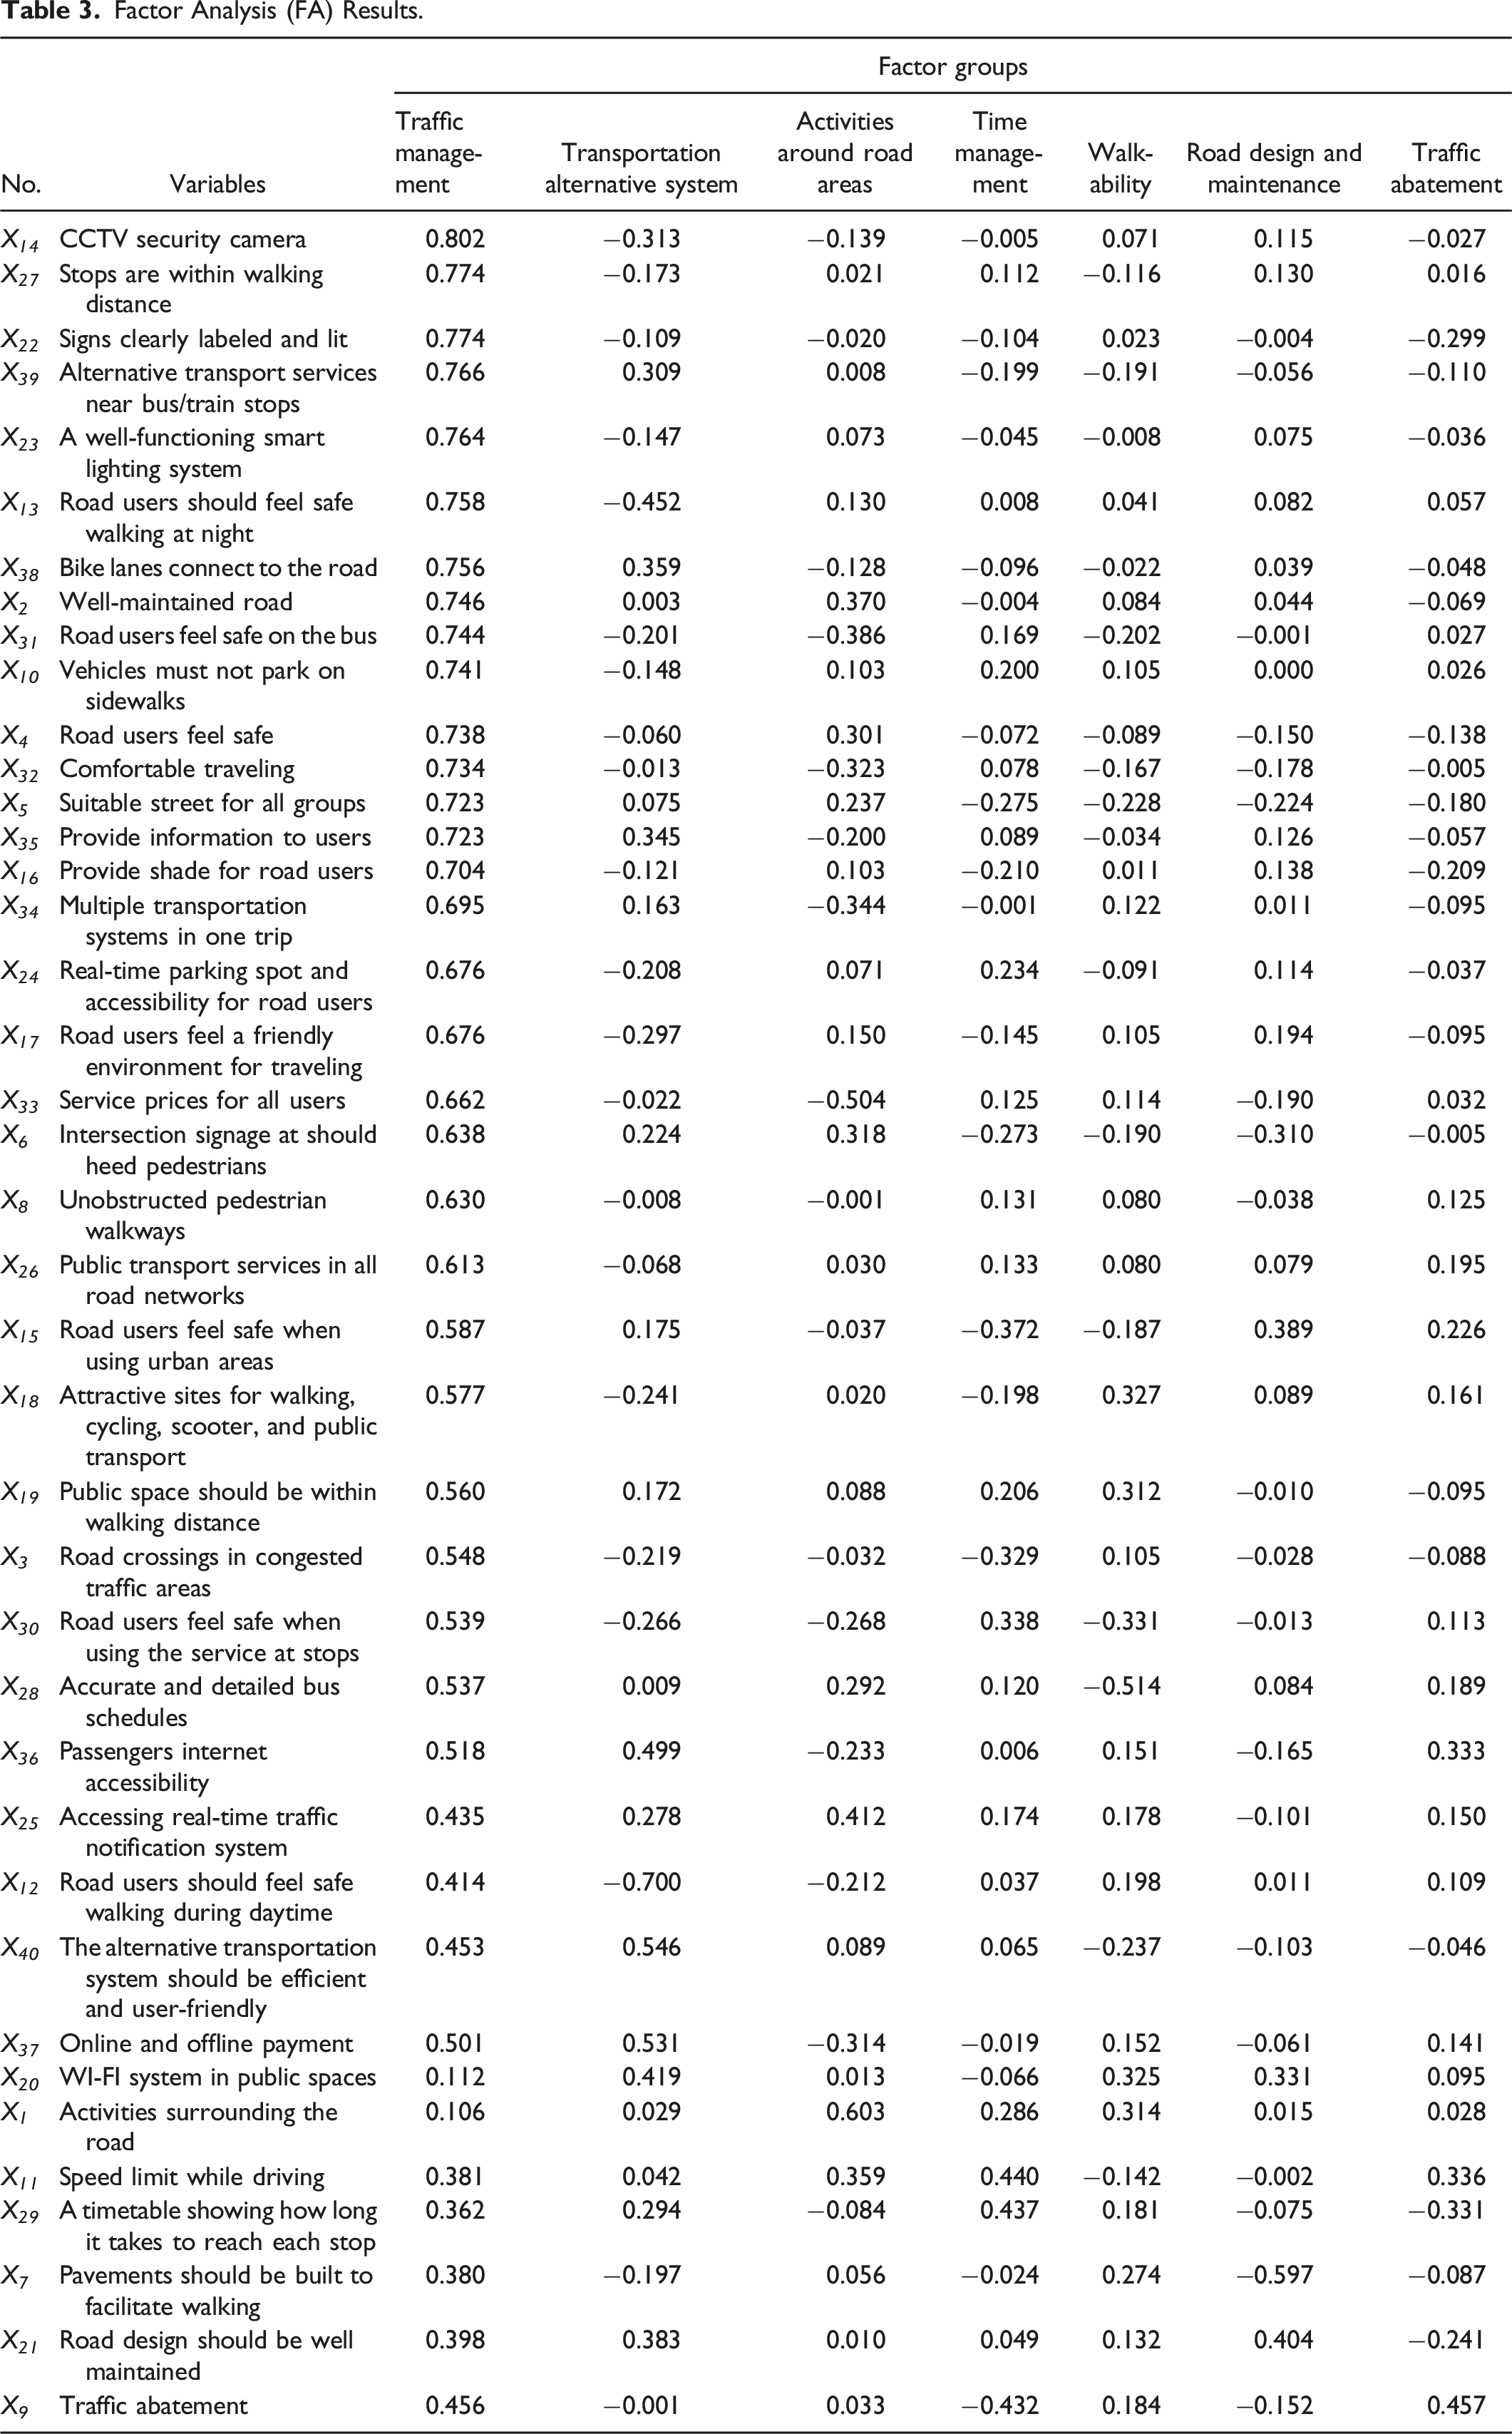
Factor Analysis (FA) Results.
Based on classification results of the seven factors, SUM guidelines may be recommended (see Figure 4). Data analytic results revealed that seven groups of factors presented reduced variables. Three issues may be summarized as suggestions for sustainable urban mobility system development: Respondent opinions on SUM in suburban areas based on FA.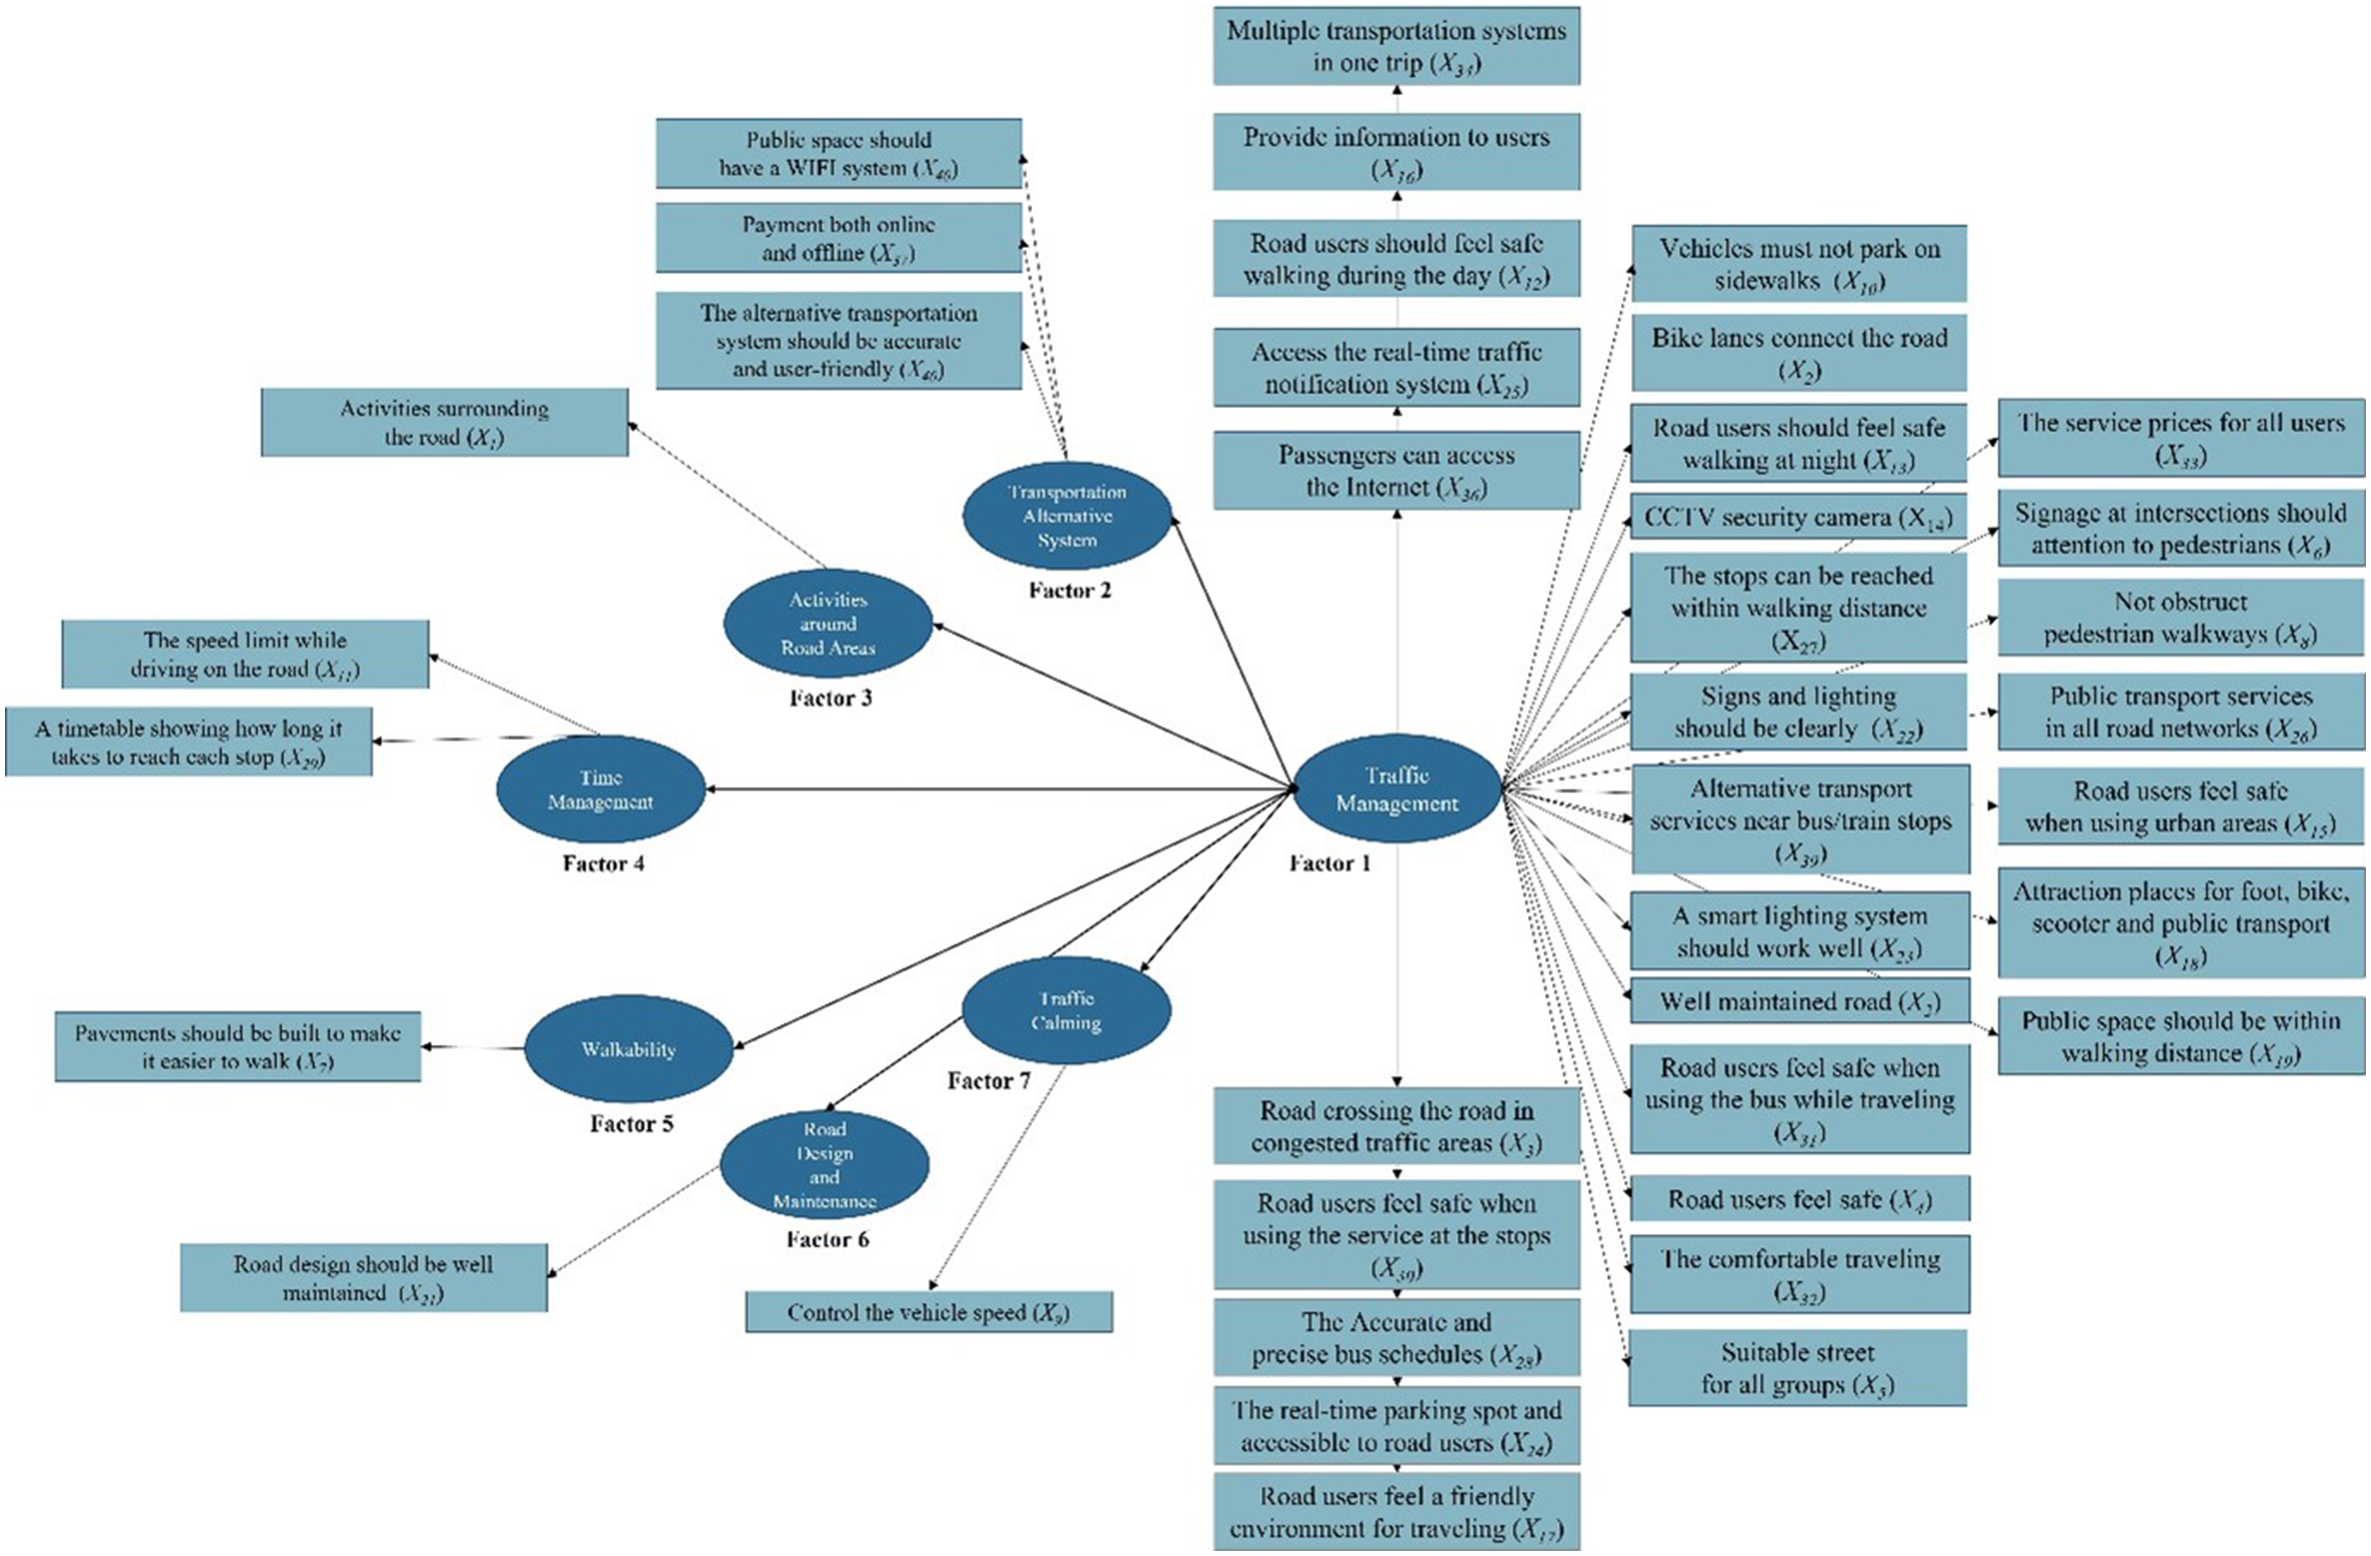
Road Environment Design
Relevant to defining the built environment and land use type, Rodrigue (2020) stated that activity types and their associated mobility requirement levels affect spatial economic development and create a risk of accidents if planning transcends the road hierarchy (Rodrigue, 2020). Road design should be included to provide a good quality environment to promote walking and cycling as active mobility to reduce emissions and boost physical activity. This also allows for reduced speed usage, including Factors 3 (activities around road areas); 5: walkability; 6: road design and maintenance; and 7: traffic abatement.
Traffic Management
Consists of a group of factors: 2) alternative transportation systems and 4) time management. Creating alternative transportation options reduces personal vehicle use and promotes public transport, allowing road users to manage their time and plan trips by public transport. Mode shifts may be achieved for effective transport demand management widely adopted as preferred choices for all road users. Duo and Joan (2022) observed that public transport system use in urban areas could reduce carbon emissions by up to 20% (Duo & Joan, 2022).
Traffic Control and Management
For easy-to-understand, communicative symbols for diverse road environments in different neighborhood contexts. The 1: traffic management group may be confirmed by Wang et al. (2022) who found that if drivers understand warning signs at a highway entrance, they make good lane departure decisions, significantly reducing the number of road accidents (Wang et al., 2022). To sustain road safety for all mobility formats, all road user modes must be prioritized, especially vulnerable activity mobility, to ensure high safety standards and service quality with accessibility and connectivity for all users.
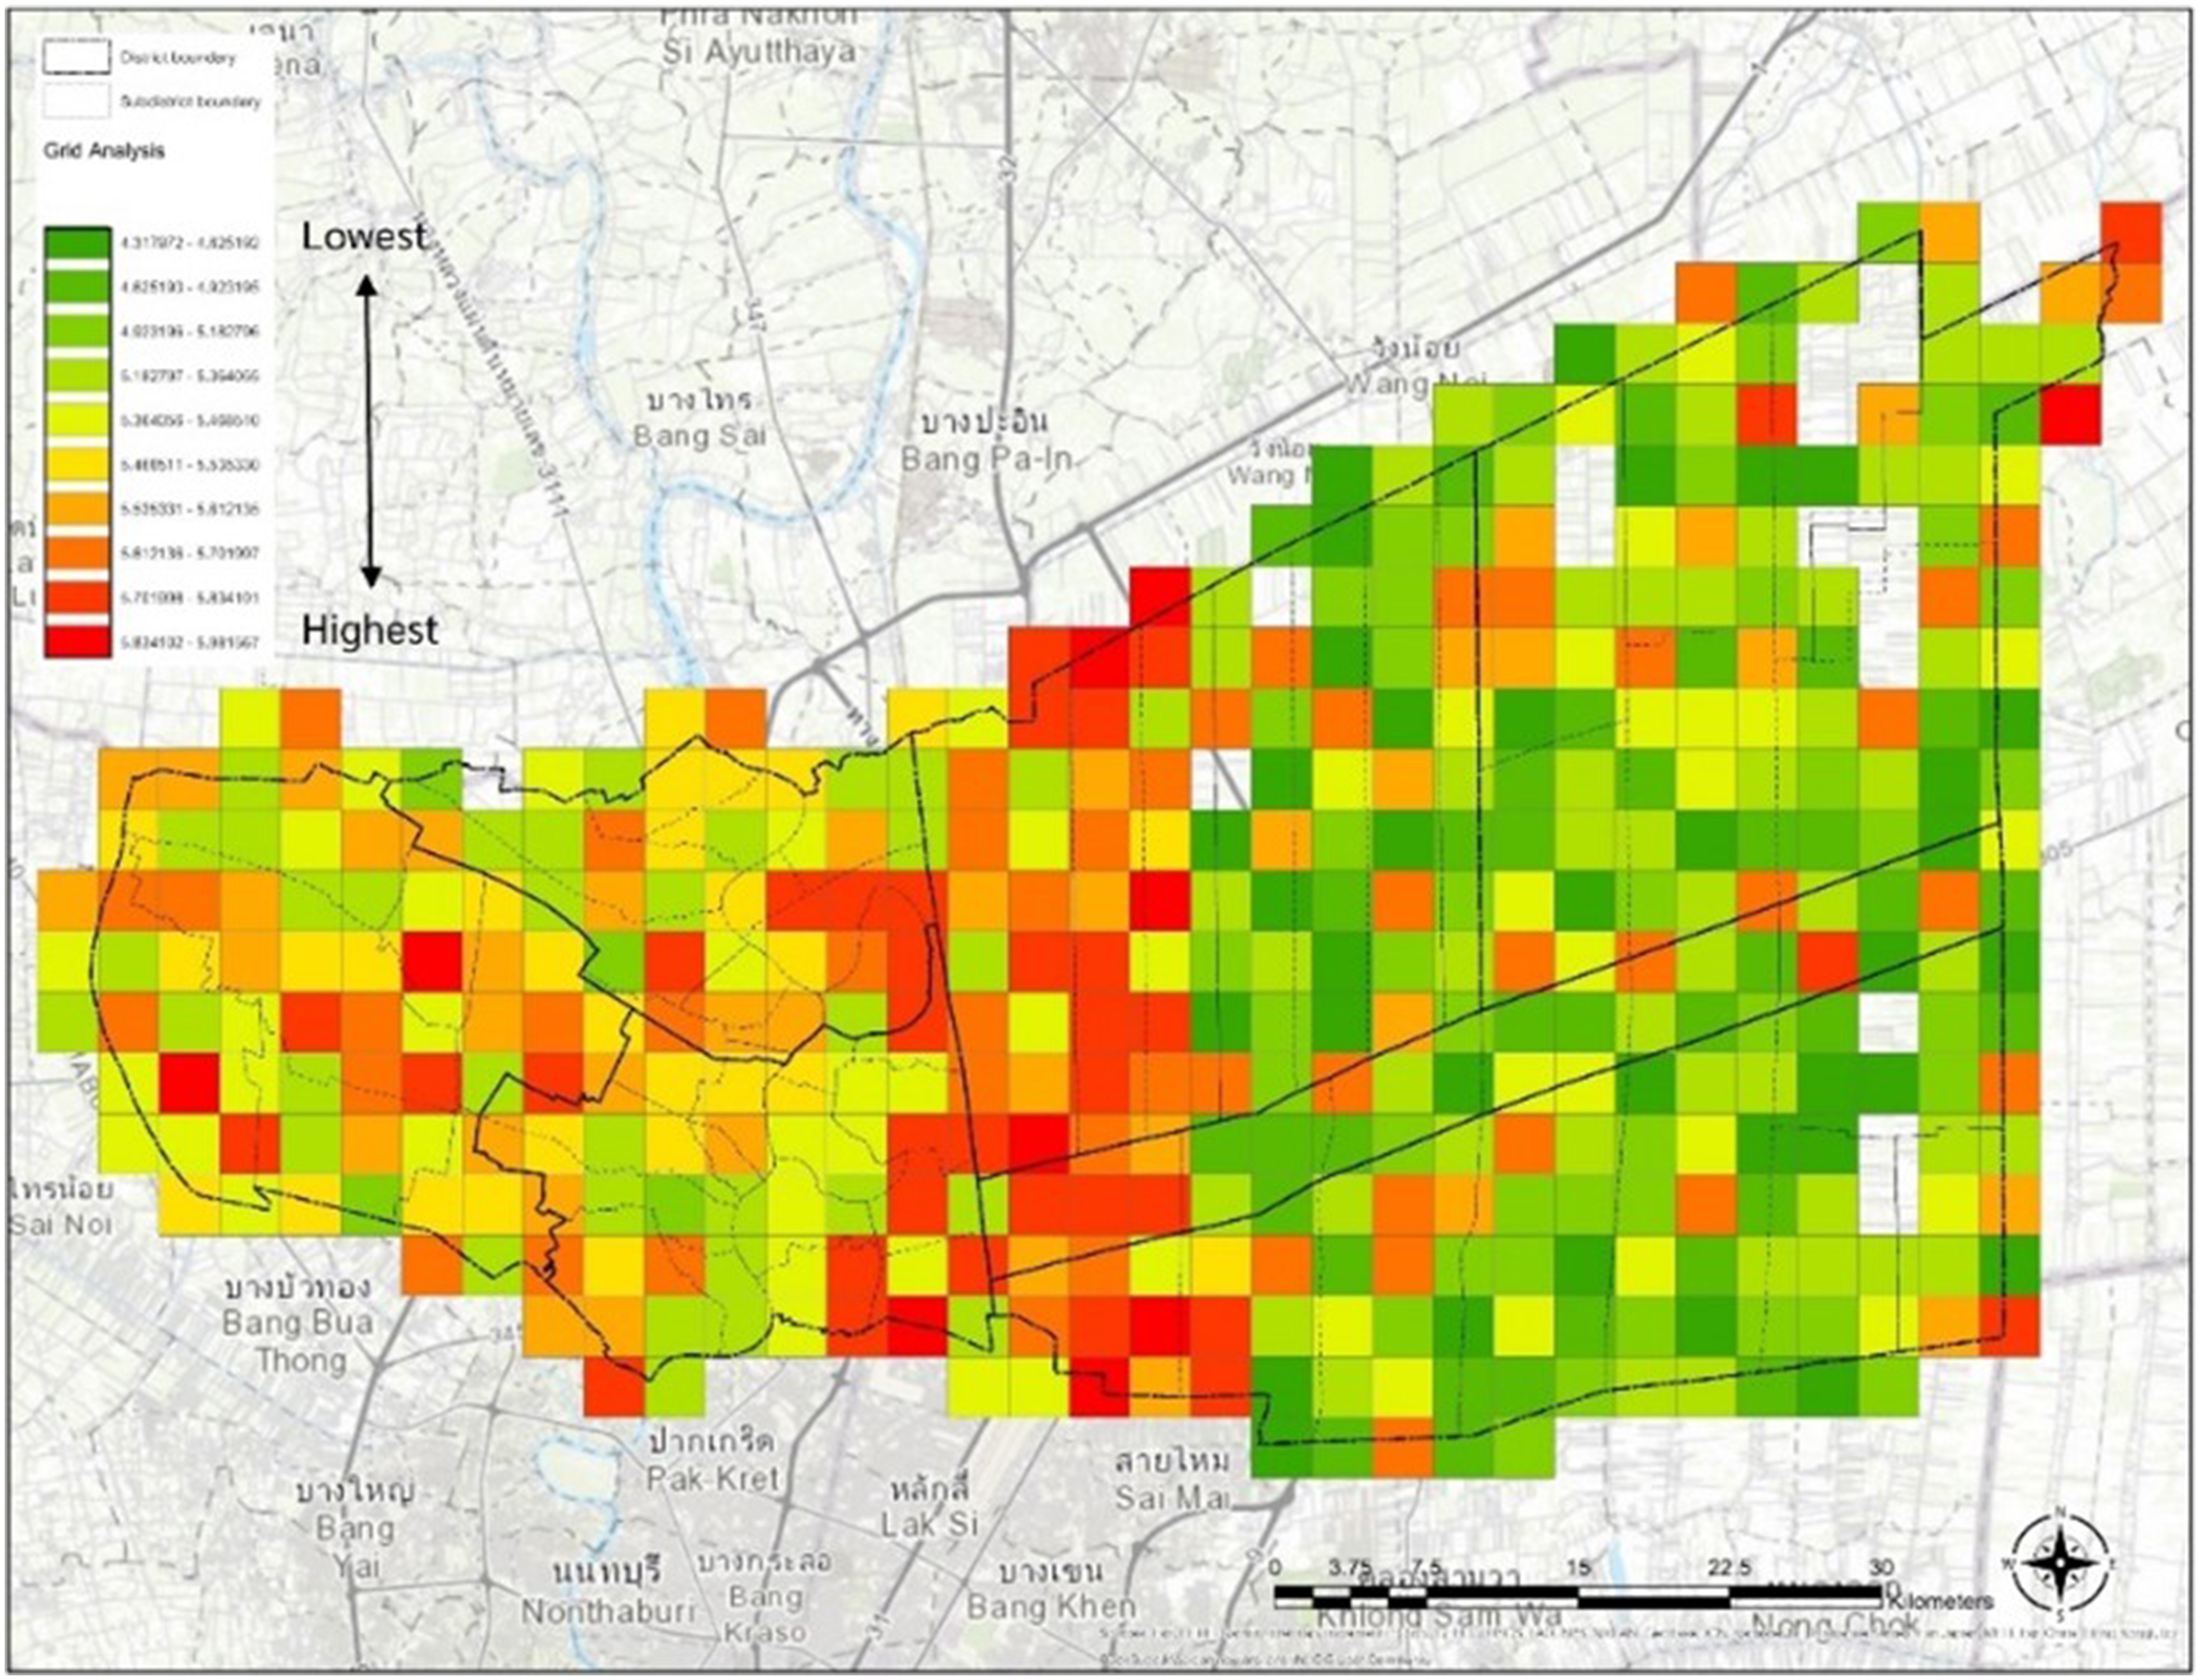
SUM and Spatial Visualization
In terms of respondent opinions levels on the grid for different land use characteristics, especially for residential buildings, commercial buildings, and industrial buildings (see Figure 5), it was found that areas developed for residential and infrastructure investment would elicit higher opinion levels on transport system development than undeveloped ones. Due to dense residential concentration of developed areas as shown in Figures 6 and 7, trip generators provide more attractions than elsewhere. Most (over 90%) respondents clearly prefer to use their personal vehicles. Therefore, analysis results cohere with the approach for developing sustainable transport systems to resolve issues in high traffic and accident risk areas, as most travel accidents are caused by private automobile and motorcycle users. Building density in Pathum Thani Province. (a) Land use characteristics, (b) residential density, (c) commercial density, and (d) industrial density. Summary of SUM through resident opinions by spatial visualization. Transportation network and road hierarchy of Pathum Thani Province.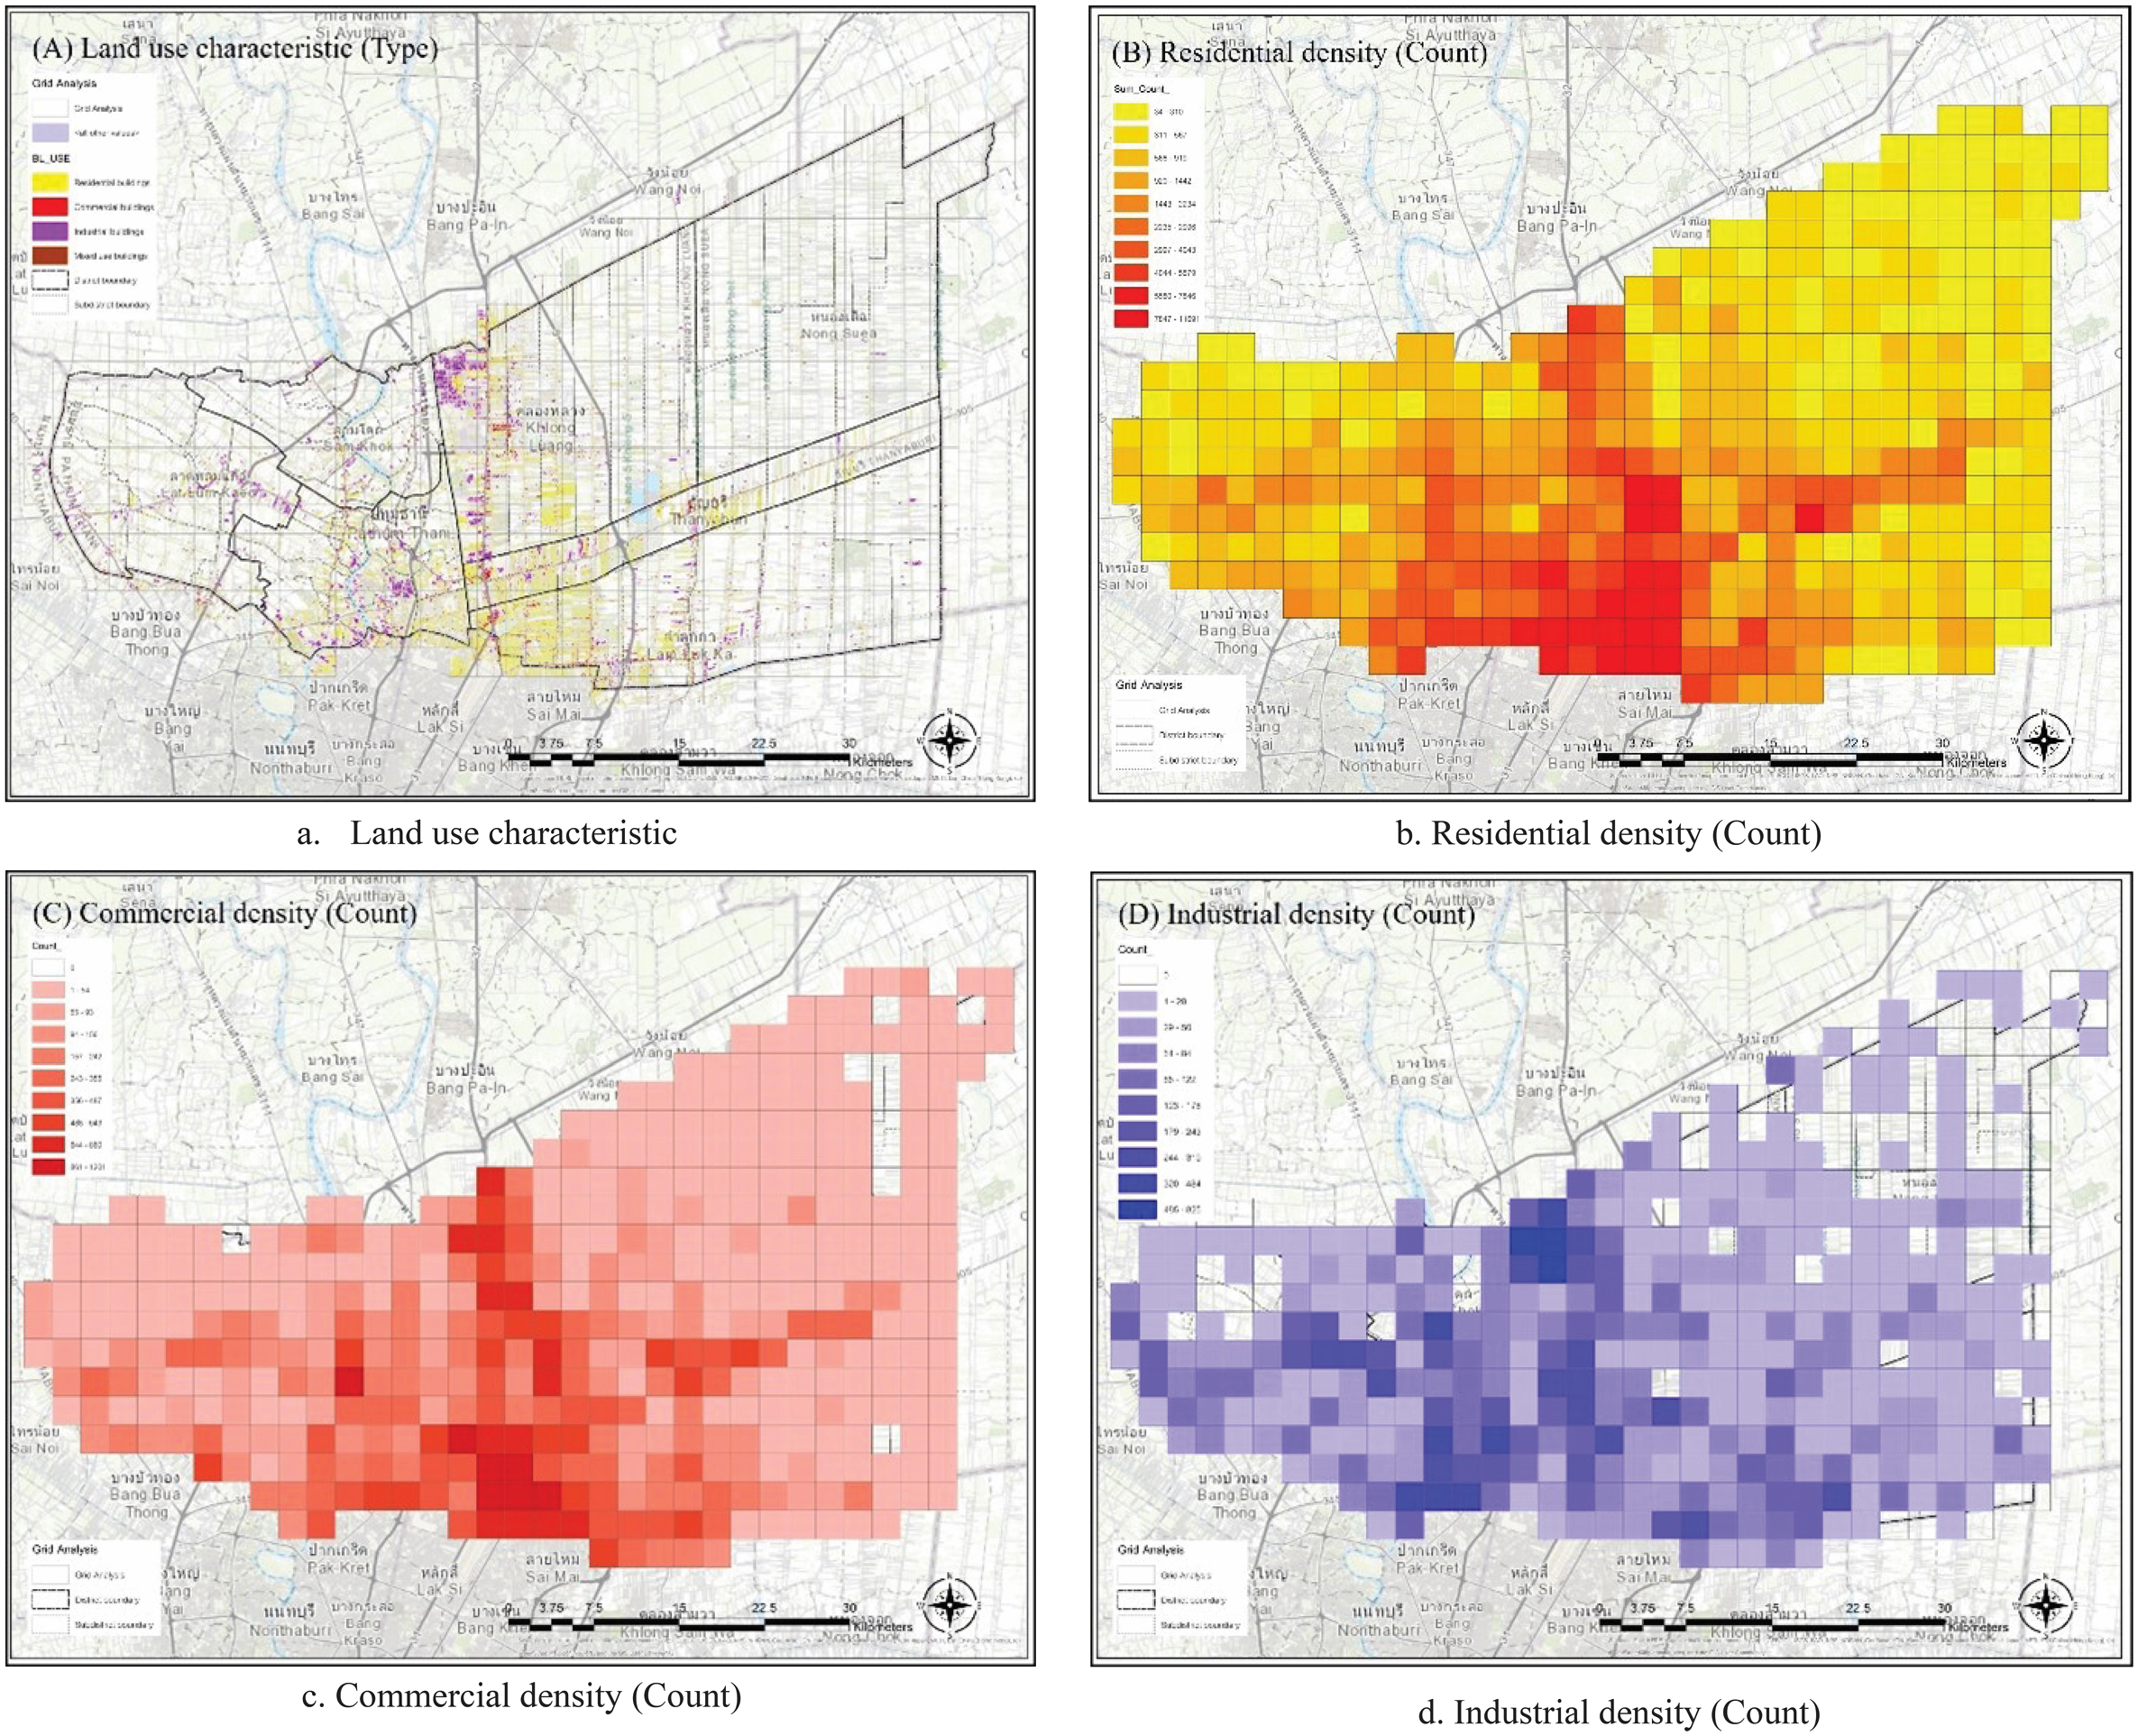
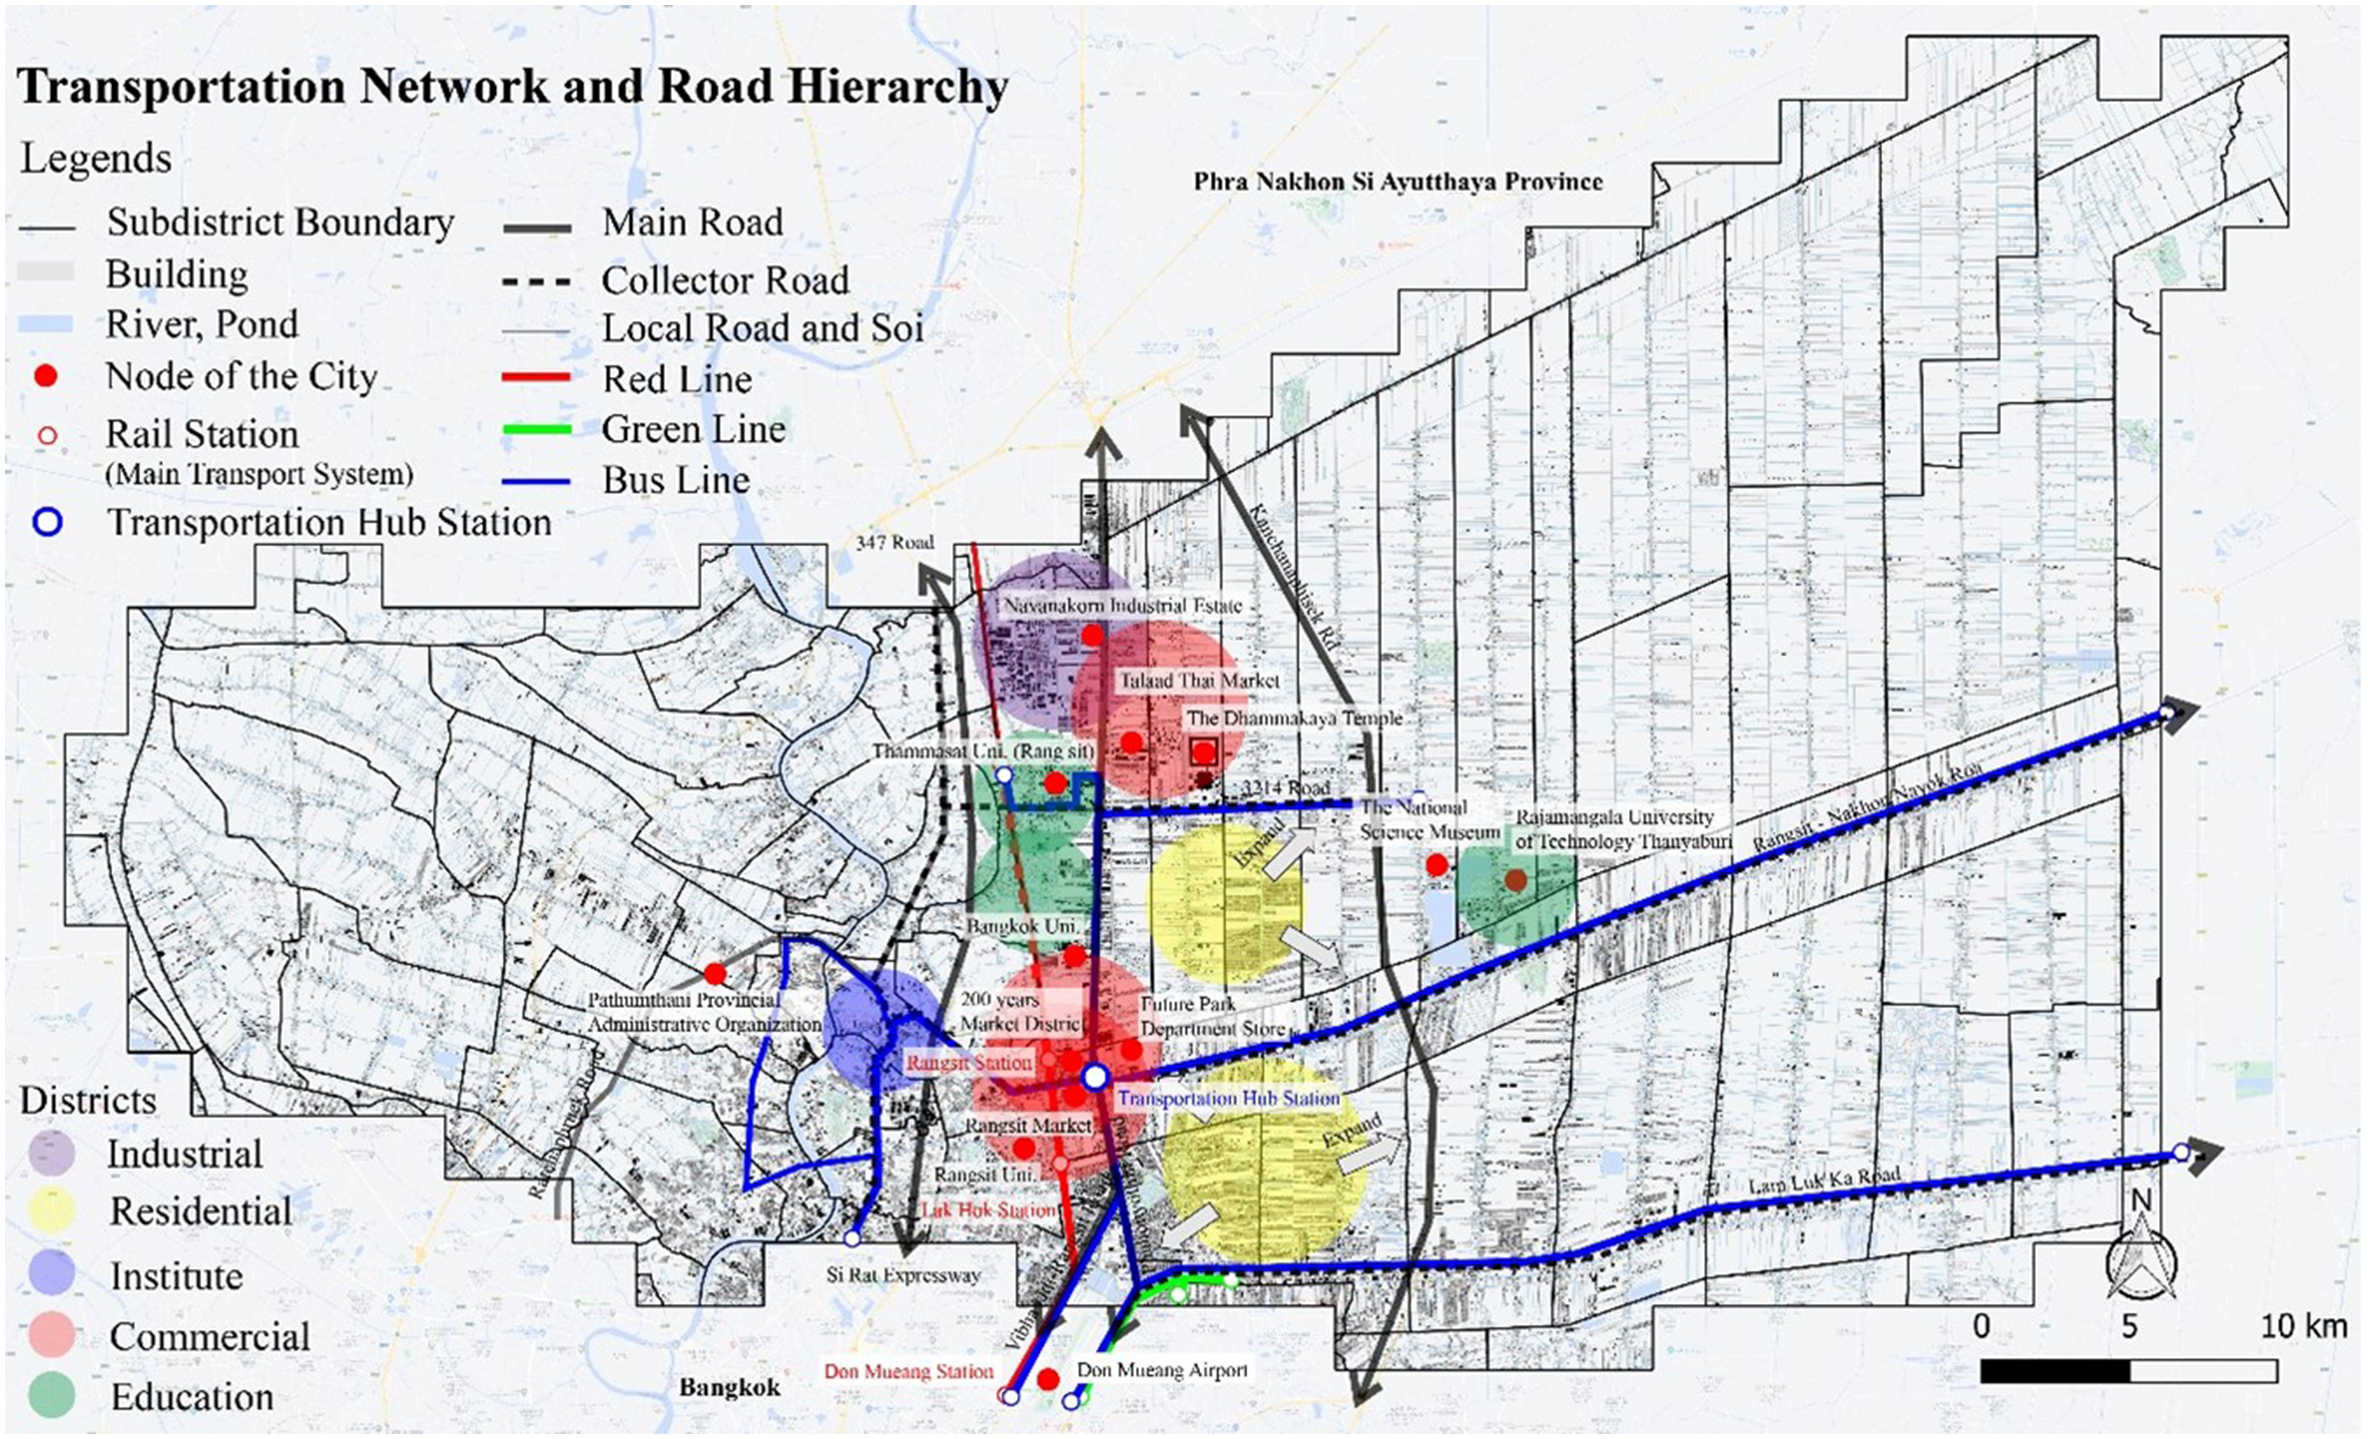
For Pathum Thani province transport policy, the emerging transportation-related issue is about promoting public transport usage, including connectivity to an extension of the mass transit system to the Bangkok Metropolitan Area (BMA). Previously, the government continuously accelerated rail transportation system development. This may be seen from the development of Red and Green mass transit system lines through the study area which should abate traffic from the nearby area to Bangkok. However, with limited coverage and poor connectivity with the feeder system, motorized commuters of diverse socioeconomic levels are rarely permitted to ride the new extension system to their destinations. In addition, many municipalities attempt to apply technology such as closed circuit television (CCTV) systems to facilitate traffic management. However, such developments mainly focus on physical and general infrastructure development, lacking data management linkage for deployment, with no association between motorized and non-motorized systems, especially to promote walking and cycling. These findings indicate that sustainability indicator components are significantly related to several dimensions in technology, infrastructure, service, alternative transport modes, and environmental quality, including road safety. Therefore, in addition to recommending necessary infrastructures and improving current transportation services, travel behavior change should be encouraged among automobile-dependent groups that significantly impact commuter travel adaptation to public choices.
Conclusion
In conclusion, seven main indicators are presented as SUM guidelines in suburban areas of Pathum Thani Province: traffic management; alternative transportation system; activities around road areas; time management; walkability; road design and maintenance; and traffic abatement. Urban planning and mobility systems must be well designed, since urban infrastructures play a key role in challenging users to change their travel behavior. With a friendly environment for all, determining land use zones for suitable road hierarchy must be well-integrated and designed to promote a greater share of sustainable modes while enhancing improved living standards in urban environments. These are essential elements for creating perspectives in mobility solutions to promote energy efficiency and traffic fatalities in increasingly livable places. This emerging issue is seen as a challenge for dealing with road accidents in Pathum Thani Province, as road accident fatalities and injuries continue to rise. Creating a friendly environment should likewise be considered for relevant solutions arising for multidimensional urban problems where integrated mobility solutions offer better results in managing diverse problems. The transportation system recommended in this study was analyzed by FA to formulate policy guideline variables among road environment design, traffic management, and technological adaptation.
In addition to urban transportation planning, community linkages in urban areas and city spaces must also be consistently planned and designed by using spaces to their full potential by adding vitality and promoting daily commuting among local residents. Balancing activity and employment nodes while improving the extant Pathum Thani public transport system should represent a well-designed modal shift to boost usability and access for all through the current rail transportation system development. Convenient access and travel time reliability resulting from public transport network expansion must be seen as an alternative solution for improving and managing available mass transit and public bus systems with active mobility. This consideration should accompany promoting appropriate public transport systems for different activity nodes and local community contexts. Such systems are likely to differ in investment areas, construction duration, passenger demands, and urban structure, which must be seamlessly connected at community and regional levels (Iamtrakul, Padon, & Klaylee, 2022, Iamtrakul et al., 2022, Iamtrakul et al., 2022a, 2022b).
Finally, there should be standardized integration among different mode choices (public transport, commuting on foot, and cycling). Creating a suitable environment for commuters and transport systems will enable more efficient travel and sustainable societal transport modes (Iamtrakul, Padon, & Klaylee, 2022). Notably, travel indicator development is based on previous studies developed and adapted to assess SUM in different local contexts. However, these findings note that indicators considered vary according to area, including suitability of indicators used to evaluate or achieve effectiveness. One limitation of this research is that the findings are based on specific local contexts of Pathum Thani Province, Thailand. As a result, application to contexts other than suburban areas requires further study to select appropriate indicators consistent with problem solving and suggesting urban development policy guidelines. The results based on seven classifications of a different set of policy variables than FA may be used as an alternative approach to transportation policy formulation for innovative city preparedness for sustainable mobility and urban development.
Footnotes
Acknowledgments
This research was supported by Faculty of Architecture and Planning Research Fund, Thammasat University Research Fund, and conducted by the Center of Excellence in Urban Mobility Research and Innovation (UMRI), Faculty of Architecture and Planning, Thammasat University, Pathum Thani, Thailand.
Declaration of Conflicting Interests
The author(s) declared no potential conflicts of interest with respect to the research, authorship, and/or publication of this article.
Funding
The author(s) disclosed receipt of the following financial support for the research, authorship, and/or publication of this article: This research received funding from the Faculty of Architecture and Planning in collaboration with ALT Telecom Public Company Limited under the project entitled “Urban Mobility Platform” (TDS09/2564).