
Abstract
Objectives
To determine whether neck:height ratio combined with adenoid and tonsillar size is a good predictive tool for obstructive sleep apnea in obese youth.
Study Design
Cross-sectional study.
Setting
Sleep clinics at the Hospital for Sick Children, Toronto, Canada.
Subjects and Methods
Consented obese individuals aged 8 to 18 years were recruited between 2013 and 2015. Anthropometric measures were obtained by a trained research coordinator in a standardized manner. Otolaryngologists evaluated adenoid and tonsil sizes. Obstructive sleep apnea was diagnosed with an overnight polysomnogram as an obstructive apnea-hypopnea index ≥2. Multivariable logistic regressions investigated the relationship between potential predictors and obstructive sleep apnea. The C-statistic measured the predictive ability.
Results
Of the 53 subjects (median age, 13 years; 55% males), 28 (53%) were diagnosed with obstructive sleep apnea, with a median index of 10.6 per hour. In a logistic regression controlling for adenoid size, enlarged tonsils were significantly associated with the presence of obstructive sleep apnea (P < .01). Adding neck:height ratio into the model improved the model predictive ability (C-index increased from 0.73 to 0.84). Controlling for tonsil and adenoid sizes, an increase in neck:height ratio was significantly associated with the presence of obstructive sleep apnea (P = .01).
Conclusion
Our study suggests that neck:height ratio combined with tonsillar hypertrophy may have a strong predictive ability for obstructive sleep apnea and may be useful in an ambulatory setting to screen obese youth at high risk. These findings should be confirmed in a larger study.
Obstructive sleep apnea (OSA) is characterized by snoring and recurrent partial and/or complete obstruction of the upper airway and is associated with intermittent nocturnal oxyhemoglobin desaturations and sleep disruption. 1 OSA is associated with significant neurocognitive, metabolic, and cardiovascular consequences if left untreated.1-3 The prevalence of OSA is 1% to 4% in otherwise healthy school children but alarmingly reported to occur in 25% of obese youth. 4 The American Academy of Pediatrics recommends a polysomnogram (PSG) for snoring children who may be at risk of OSA. 5 However, due to a lack of pediatric PSG facilities as well as geographic disparities in access to PSGs, screening for OSA with PSGs is neither feasible nor practical. 6 As such, identifying screening tools that will predict OSA in obese youth is a priority.
The commonest etiologic factor for childhood OSA is adenoidal and/or tonsillar hypertrophy, and an adenotonsillectomy has a high cure rate for OSA in otherwise healthy children. 7 However, in obese children, the presence of adenoid and tonsillar hypertrophy alone has not been shown to predict OSA 8 ; furthermore, adenotonsillectomy cures OSA in only 30% of obese subjects. 7 Moreover, an increase in body mass index (BMI) alone has not been shown to predict OSA among adolescents. 9 It is believed that the distribution of fat—especially around the neck, causing an increase in neck circumference—is a good predictor of OSA among adults. 10 There are limited equivalent data for the pediatric population. One study observed that an increase in neck:height ratio (NHr) alone may predict OSA among obese children; however, there was modest predictive ability suggesting than other measurable factors may play a significant role in screening for OSA among obese youth. 11 Specifically, in that study, the authors did not adjust for confounders such as adenoid and tonsillar hypertrophy. 11
The objective of this study was to determine whether anthropometric measurements—NHr combined with tonsillar size—would be able to predict the presence of OSA among obese youth. Tonsillar size was chosen, as it can be easily evaluated in a clinical office setting. We hypothesized that an elevated NHr combined with tonsillar hypertrophy would improve the predictive ability of OSA among obese youth as compared with measures of adenoid and tonsillar hypertrophy alone.
Materials and Methods
Ethics Approval and Consent to Participate
The study protocol was approved by the Research Ethics Board at the Hospital for Sick Children, Toronto, Canada (1000026523). All subjects and parents provided written informed consent and assent as appropriate.
Study Population
In this cross-sectional study, obese subjects aged 8 to 18 years were consecutively recruited from the sleep clinic between 2013 and 2015. Subjects with a history of snoring were referred into the sleep clinic from local weight management clinics and community pediatricians. Exclusion criteria included known genetic or syndromic conditions that may contribute to obesity (eg, Prader-Willi syndrome), use of medications that may significantly affect sleep architecture (eg, antidepressants), youth with known OSA or use of continuous positive airway pressure treatment for OSA, developmental delay, pregnancy, and an inability to speak English.
Study Procedures and Measurements
Anthropometric measurements were undertaken by a trained research coordinator in a standardized manner. Weight and height were measured with a standard calibrated scale and wall-mounted stadiometer, respectively. BMI z score was calculated according to the age- and sex-specific childhood growth curves of the World Health Organization, in which obesity is defined as a BMI z score ≥2. 12 Waist circumference was measured 3 times to the nearest 0.1 cm with a nonelastic fiberglass measuring tape (Tech-Med model 4414; Moore Medical Corp, New Britain, Connecticut) placed at the top of the iliac crest with the subject in a standing position. 13 The waist:height ratio was calculated as waist circumference in centimeters divided by height in centimeters. 14 Neck circumference was measured with a flexible tape, with the subject in the standing position, head held erect, at the level of the thyroid cartilage. 15 Three measurements of the neck circumference were completed, and the mean value was recorded and used in all analyses. NHr was calculated by dividing the mean neck circumference in centimeters by the subject’s height in centimeters. Neck:waist ratio was calculated by dividing the mean neck circumference in centimeters by the subject’s waist circumference in centimeters.
Polysomnogram
Patients underwent a standard overnight PSG according to the American Academy of Sleep Medicine guidelines 16 with Natus Sleepworks data acquisition and analysis systems (Natus Medical Incorporated, San Carlos, California). PSG measurements included electroencephalogram, electro-oculogram, and submental and bilateral anterior tibialis electromyogram. Chest wall and abdominal movements were measured with chest and abdominal respiratory inductance plethysmography. Other respiratory measurements included nasal air pressure transducer by Braebon (Kanata, Canada), oronasal thermal sensor, oxygen saturation (SaO2) with a pulse oximeter (Masimo, Irvine, California), transcutaneous carbon dioxide with a carbon dioxide sensor (Sentec, Therwil, Switzerland), and end-tidal carbon dioxide with a BCI Capnocheck unit (Waukesha, Illinois). Video and audio recordings were obtained as well as body position. Sleep architecture was assessed by standard techniques. 16 All respiratory events were scored according to the American Academy of Sleep Medicine scoring guidelines 17 by a registered certified polysomnographic technician. All sleep studies were reviewed and interpreted by experienced pediatric sleep physicians. OSA was diagnosed according to the obstructive apnea-hypopnea index (OAHI): the number of obstructive apneas, mixed apneas, and obstructive hypopneas per hour during sleep. OSA was diagnosed if the OAHI was ≥2 events per hour. 7 The central apnea index was defined as the number of central apneas during sleep. A central apnea index ≥5.0 was considered clinically significant. 18 The validated Epworth Sleepiness Scale was used as a self-reported measure of sleepiness. 19
Formal Otolaryngologist Assessment
Following an overnight PSG, all subjects were evaluated by pediatric otolaryngologists who were blinded to PSG results. Patients were first screened to ensure that there were no symptoms of adenoid hypertrophy (ie, absence of hyponasal speech, persistent nasal obstruction, persistent rhinorrhea, or allergic rhinitis). Next, the upper airway was systematically examined with direct visualization and flexible nasopharyngolaryngoscopy to identify obstructing lesions, such as deviated nasal septum, turbinate hypertrophy, nasal mucosal edema, tonsil and adenoid hypertrophy, and hypopharyngeal and laryngeal lesions. The adenoids were evaluated on a 4-point scale (1 = no enlargement, 2 = touching torus tubarius, 3 = touching vomer, 4 = touching soft palate at rest). 20
Tonsil size was graded as follows: 0 = removed, 1 = barely seen behind pharyngeal pillars, 2 = extending to pharyngeal pillars, 3 = extending beyond pharyngeal pillars but not to the midline, 4 = extending to the midline. 21 Palate position was graded per visualization: 1 = entire uvula and tonsils/pillars, 2 = uvula but not tonsils, 3 = soft palate but not uvula, 4 = hard palate only. 21 The findings were recorded on a standardized form.
Statistical Analyses
Descriptive statistics were calculated to characterize the entire population of interest and subgroups by the presence of OSA (OAHI, ≥2 vs <2). Spearman rho correlations were calculated between anthropometric measures and OSA severity measures (the OAHI, mean and minimum SaO2 and sleep time spent with SaO2 <90%, and the total arousal index). Characteristics of participants with and without OSA were compared with a chi-square test for categorical variables or a Student’s t test for continuous variables for normally distributed data (Wilcoxon signed-rank test for nonnormally distributed data).
Multivariable logistic regression was used to investigate the relationship between potential predictive factors and the presence of OSA, and the results were expressed as odds ratios (ORs) and 95% CIs. PSG and anthropometric measures were used as continuous variables to avoid choosing arbitrary cut points. If nonlinearity was observed, restricted cubic spline transformations for continuous variables was applied, and the resulting standardized ORs compared the 75th and 25th percentiles of their distribution, allowing comparison of the ORs on a common scale. Additional covariates considered in the statistical model were the age (years), sex, and size of tonsils and adenoids. In anticipation of a relatively small sample size, the number of variables included in our statistical model were limited, and we also decided a priori to test the effect of each anthropometric measure individually, controlling for confounders. To examine if an elevated NHr with measures of adenoid and tonsillar hypertrophy (size of tonsils and adenoids) would predict OSA among obese youth better than measures of adenoid and tonsillar hypertrophy alone, we compared the models with and without NHr with a likelihood ratio test. 22
The C-statistic was used as a measure of the predictive accuracy of a logistic regression model. 22 Values for the C-statistic range from 0.5 to 1.0, with a value of 0.5 indicating that the model is no better than chance at making a prediction and a value of 1.0 indicating that the model perfectly identifies those with and without presence of OSA. Models with a C-statistic value >0.7 are usually considered reasonable, and those with a C-statistic value >0.8 are considered strong. 23 Given our study potential limitations, we anticipated a predictive model overfitting—that is, when the model predicts well among the subjects under study but not among a new sample. As such, we used the bootstrap to correct for overfitting. 22
Analyses were conducted with R version 3.2.5 (R Foundation for Statistical Computing).
Results
Population Characteristics
The study sample included 53 subjects (median age, 13.3 years; 55% males), of which 28 (53%) were diagnosed with OSA (OSA group). Subject anthropometry, demography, and ear, nose, and throat data for the total population and by group (OSA vs no OSA) are shown in Table 1 .
Demographic, Anthropometric, and ENT Data. a
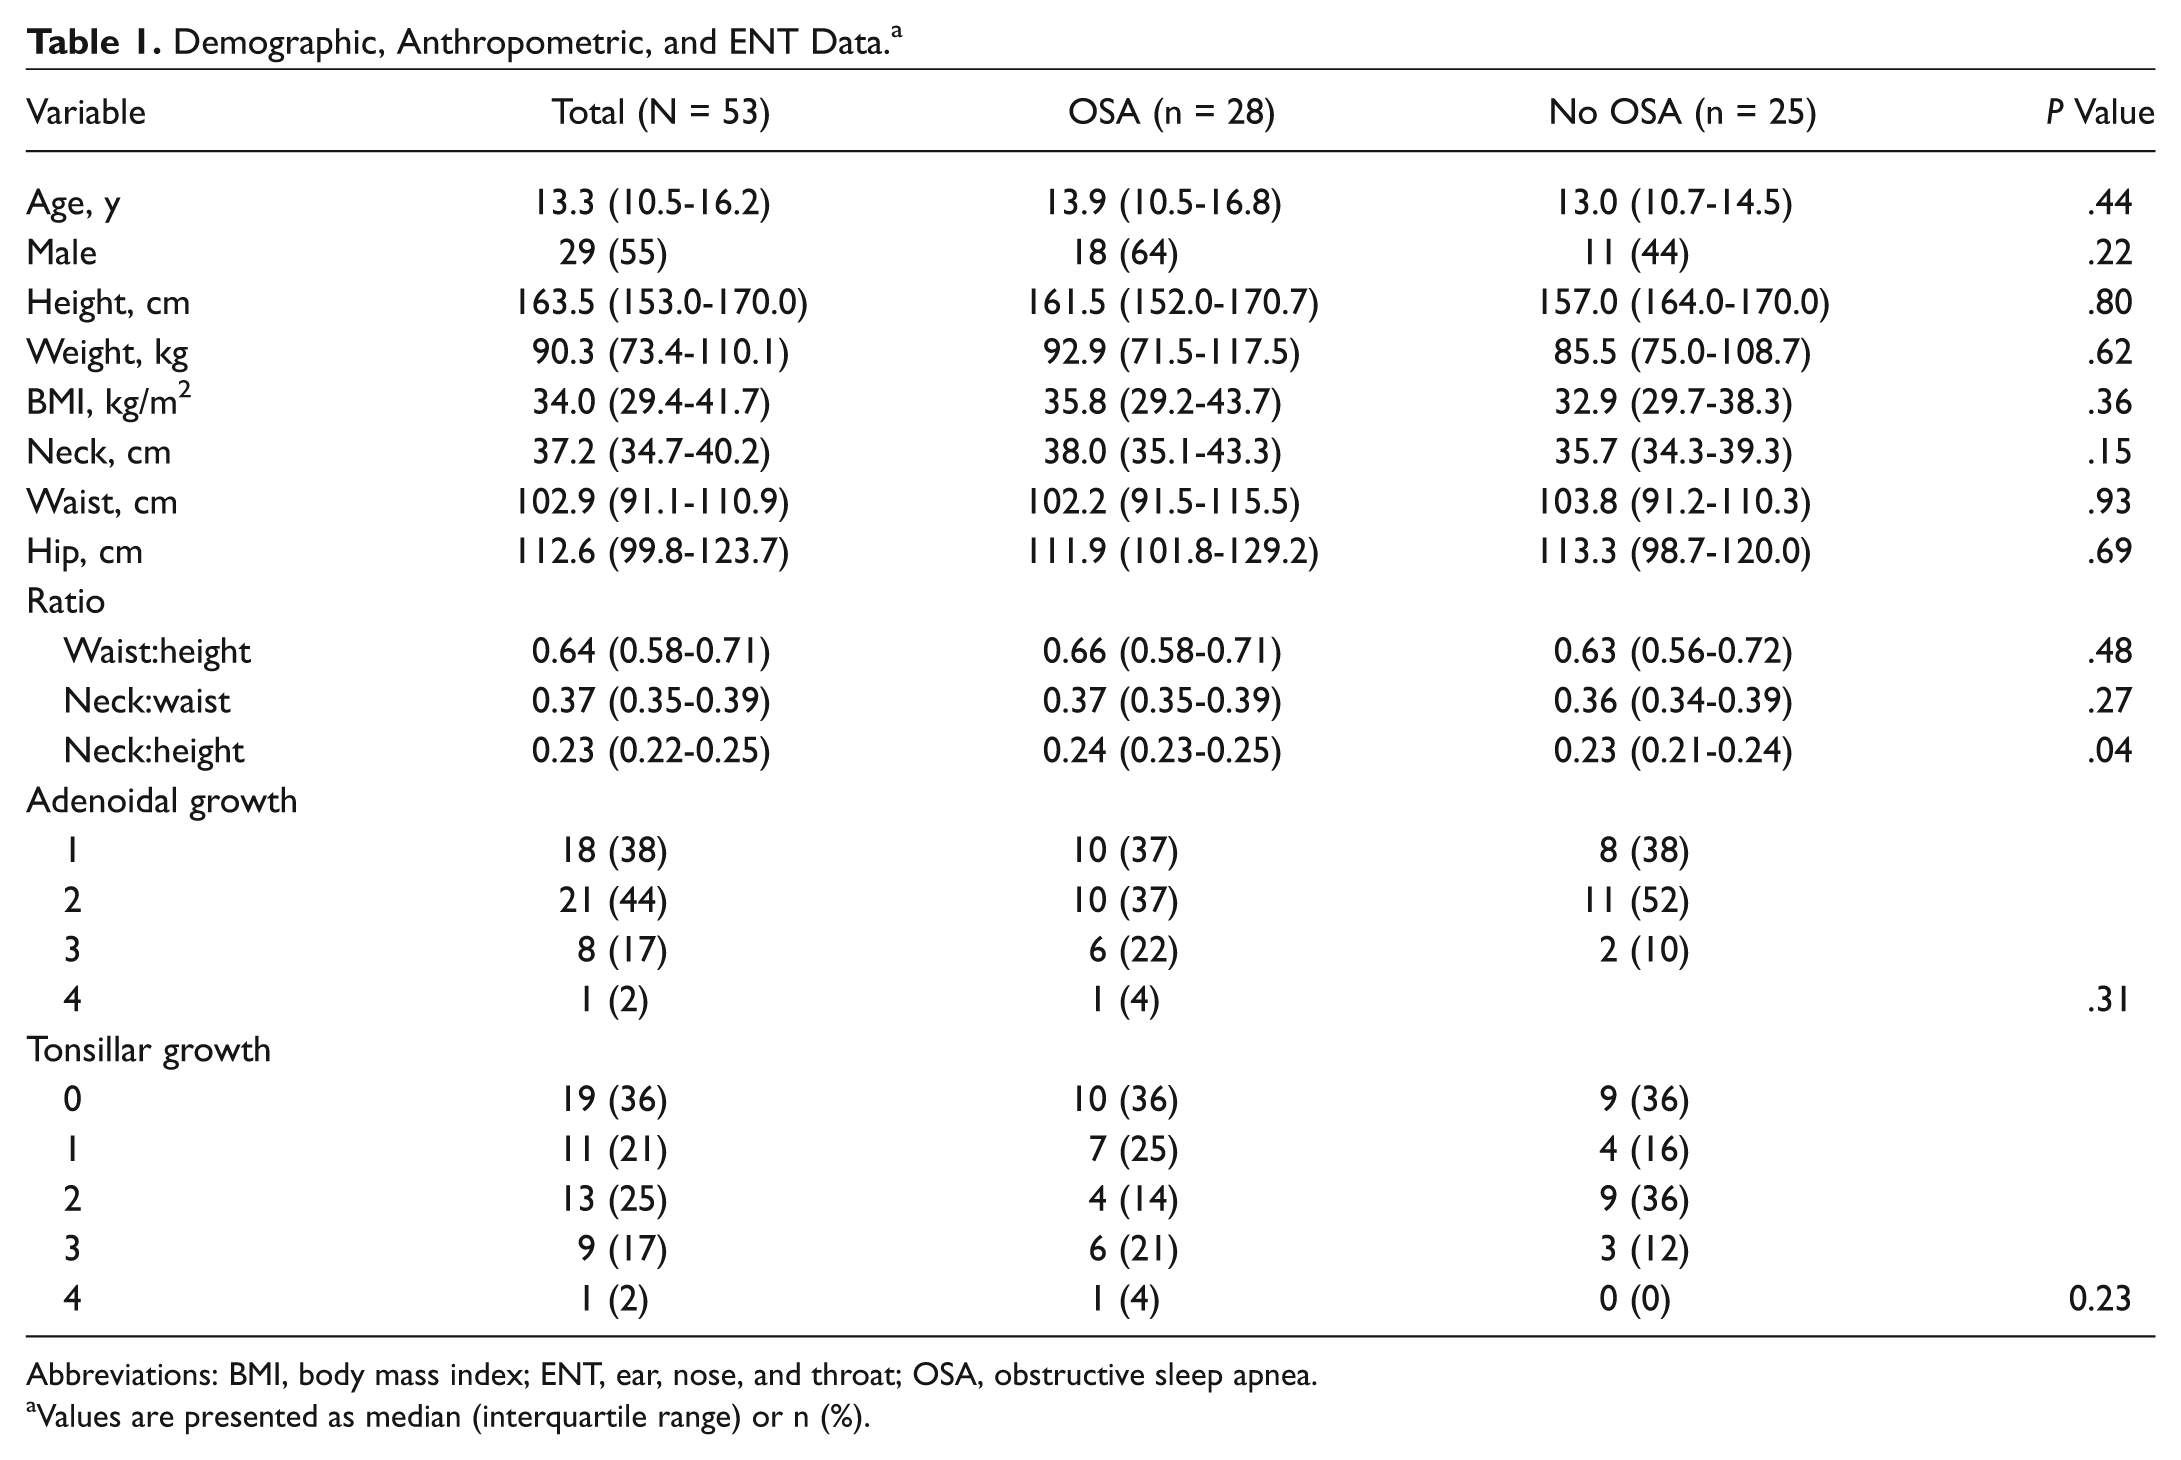
Abbreviations: BMI, body mass index; ENT, ear, nose, and throat; OSA, obstructive sleep apnea.
Values are presented as median (interquartile range) or n (%).
With regard to the PSG data ( Table 2 ), the median OAHI in the OSA group was 10.6 per hour (interquartile range, 4.6-25.7). As expected, when compared with the no-OSA group, the OSA group had a significantly higher desaturation index (P < .001), lower mean SaO2 (P < .02), and lower nadir SaO2 (P = .001).
Polysomnography Data. a
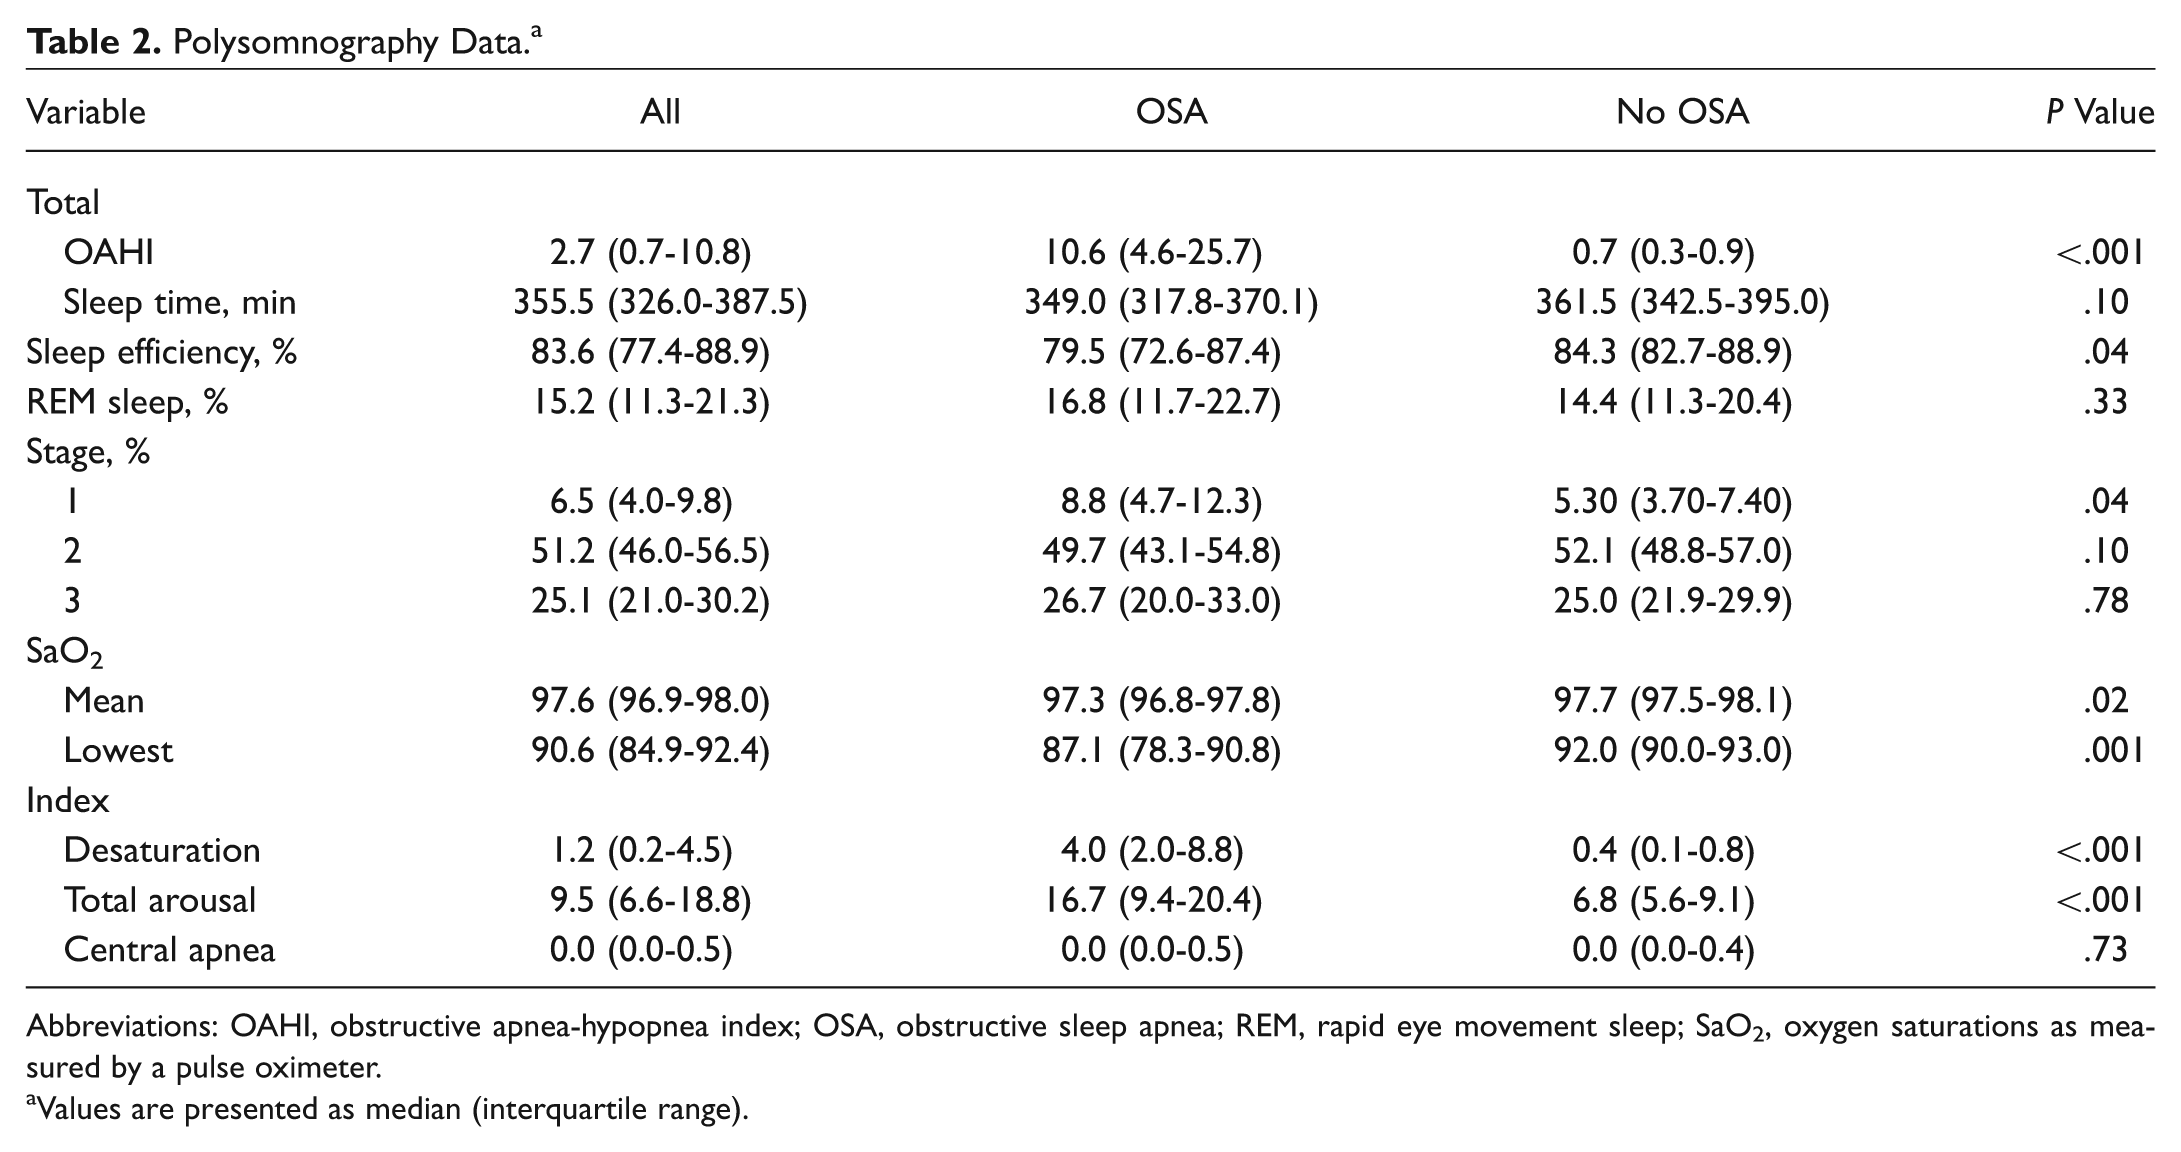
Abbreviations: OAHI, obstructive apnea-hypopnea index; OSA, obstructive sleep apnea; REM, rapid eye movement sleep; SaO2, oxygen saturations as measured by a pulse oximeter.
Values are presented as median (interquartile range).
There were no statistically significant differences in height, weight, BMI, waist, hip, or neck measurements between the OSA and no-OSA groups (P values >.2). The NHr was significantly higher in the OSA group (P = .04). There were no significant differences in the waist:height ratio or neck:waist ratio between the 2 groups. Although not statistically significant, the percentage of individuals with enlarged adenoids and tonsils was higher in the OSA group versus the no-OSA group (adenoids, 26% vs 10%; tonsils, 25% vs 12%). There were no significant differences in the frequency of prior adenoidectomy and/or tonsillectomy between the groups.
Among all correlations between anthropometric measures and PSG characteristics, there was only 1 significant, although weak, correlation between NHr and total OAHI (rho = 0.27, P = .04).
Results of Logistic Regression
In a statistical model controlling for adenoid size, an enlarged tonsil size of 3 or 4, as compared with 0 or 1, was significantly associated with the presence of OSA (P = .02). Adding NHr in the model significantly improved the model fit (P = .005) and the model predictive ability (C-index increased from 0.73 to 0.84) indicating a strong ability of the model, which includes NHr in combination with measures of adenoid and tonsillar hypertrophy to predict OSA among obese youth. Furthermore, in this model, the odds of being diagnosed with OSA among participants with an NHr of 0.25 versus 0.22 (the 75th and 25th percentiles of its distribution, respectively) increased about 5-fold (OR = 5.53, 95% CI: 1.49-20.52, P = .01) when controlling for tonsil and adenoid sizes ( Table 3 ). These results remained similar after controlling for age and sex (results not shown). Finally, we evaluated the relationship between other anthropometric measures considered individually and the presence of OSA, controlling for adenoid and tonsil sizes ( Table 3 ).
Relationships among Anthropometric Measures Considered Individually and in the Presence of Obstructive Sleep Apnea, Controlling for Adenoid and Tonsil Sizes.
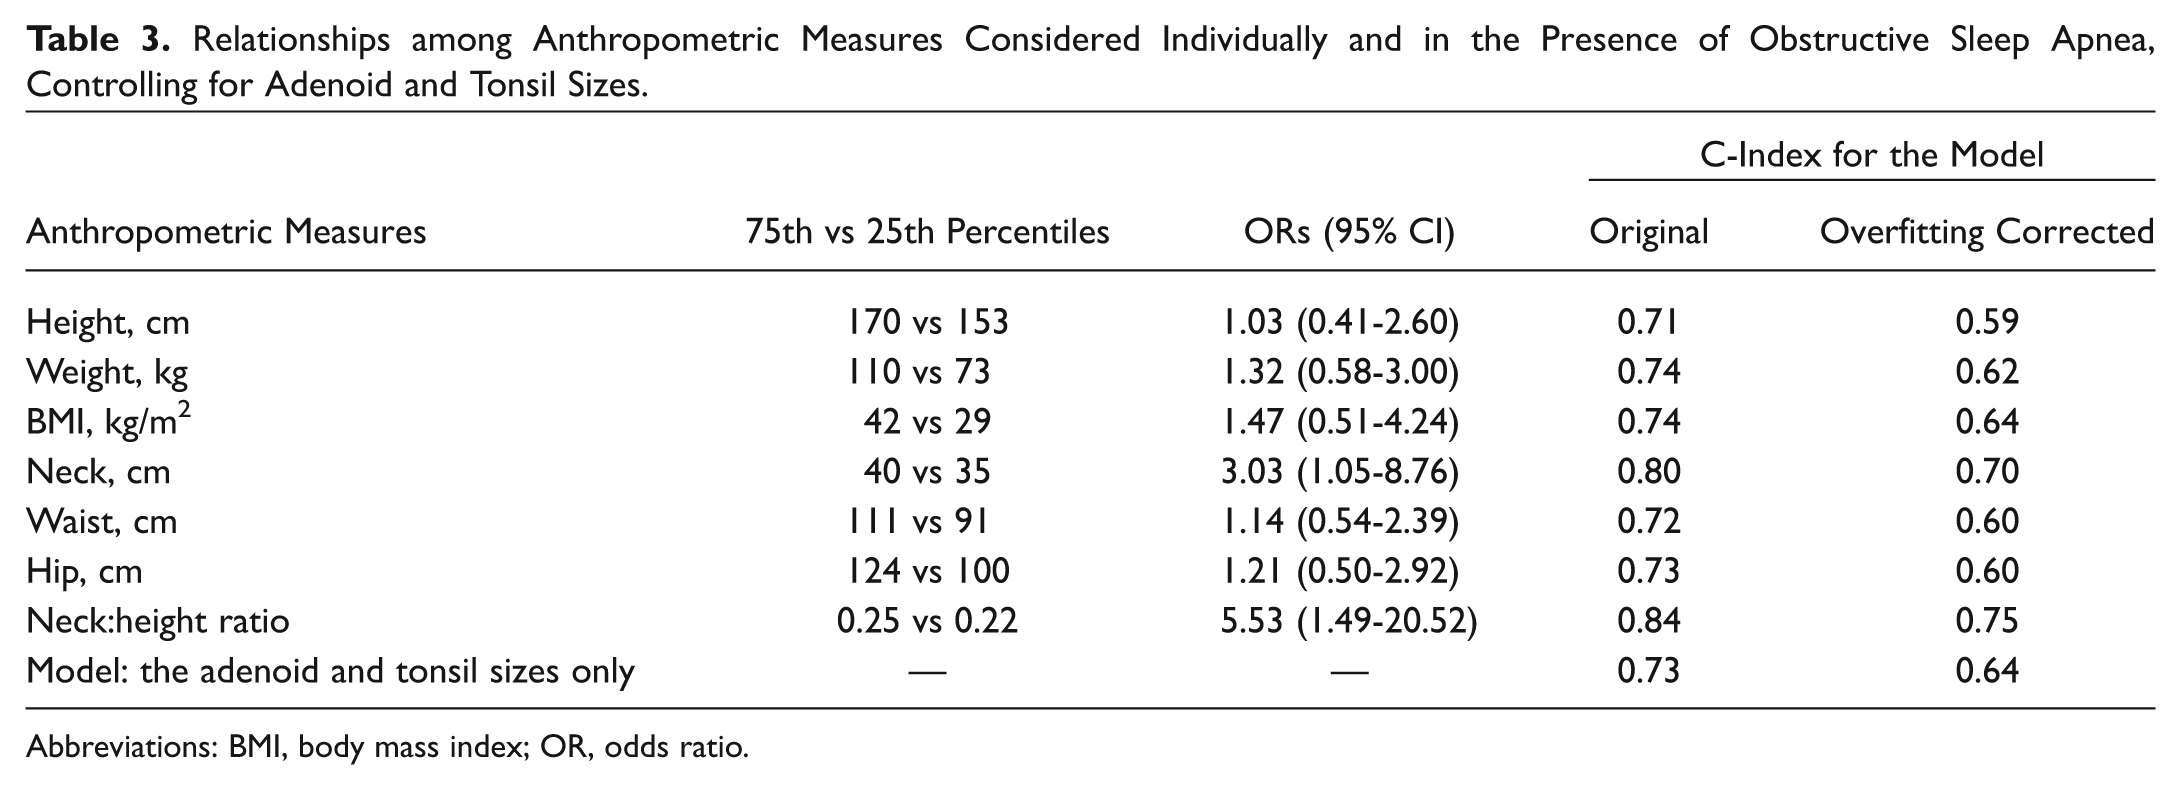
Abbreviations: BMI, body mass index; OR, odds ratio.
Discussion
In this cross-sectional clinical study with prospectively collected data, we demonstrated that increased NHr in combination with tonsillar hypertrophy strongly predicted the presence of OSA among obese youth. We confirmed our hypothesis that the model with NHr demonstrated better predictive ability than measures of adenoid and tonsillar hypertrophy alone. NHr ≥0.25—which corresponds to the 75th percentile of its distribution in the OSA group in combination with enlarged tonsils (sizes 3 and 4)—may be recommended to identify obese youth at high risk for OSA. This study underscores the importance of neck circumference and height measurements in the context of tonsillar enlargement in a clinical setting. This is in keeping with literature demonstrating that obesity-related OSA is multifactorial—that is, related to lymphoid hyperplasia, increased fat deposition in the upper airway, and neuromotor factors predisposing to upper airway collapsibility.24,25 Specifically, in a recent static magnetic resonance imaging study, Schwab and colleagues demonstrated the importance of adenoid and tonsillar hypertrophy in the pathogenesis of OSA in obese adolescents. 25 Our study is in agreement with these results and provides clinicians with a potential easy-to-use predictive tool for screening the obese pediatric population.
Other studies in the literature evaluated the role of either neck circumference or NHr in the pediatric population. Similar to our results, Ho et al reported NHr ≥0.25 to be significantly associated with presence of OSA. 11 However, their study differed significantly from ours in that it was retrospective and had a wide range for age and BMI in subjects with and without OSA (5-18 years). This is important, as lengthening of the airway occurs in postpubertal children versus prepubertal children when normalized for height, and changes in BMI modulate the airway size. 26 Furthermore, age, sex, race, and adenoid and tonsillar sizes were not included or controlled for in their statistical models. 27 A separate study evaluated the predictive value of neck circumference among 245 children, aged 6 to 18 years, of whom 58% were either overweight or obese, with a BMI >85th percentile. 28 Although adenoid and tonsillar size was not measured in that cohort, a neck circumference >95th percentile was associated with OSA in only males >12 years of age and not associated with OSA in females at any age. However, an important relative measure of neck circumference at any age is height, yet NHr was not considered in their predictive models. Indeed, an NHr circumvents the need for normative data on neck circumference. This is relevant, as the neck circumference of subjects in our study was much greater than published normative data in obese children27,28 and thus may not even be applicable to many cohorts. We did not find any other anthropometric measures that were predictive of OSA, which is similar to a study by Katz et al. 29 In that study, neck:waist ratio did not predict OSA in a sample of children with a median age of 12 years and a BMI >2.53. 29
The limitations of our study are that these data represent a small sample size of obese subjects with OSA, and a larger study is needed to confirm these results. Moreover, pubertal status was not assessed in our study, and it could influence the risk of OSA and distribution of adiposity. Our sample may also be biased, as the patients were referred with a history of snoring, thus increasing the likelihood of being diagnosed with OSA. A further limitation is that tonsil size was graded according to only the Friedman scale and not with the Brodsky scale, as suggested in the American Academy of Otolaryngology—Head and Neck Surgery Foundation’s clinical practice guideline on tonsillectomy in children. 30 Future studies evaluating tonsil size should investigate the ability of both scales to predict OSA severity. However, a strength of this study is that adenoid and tonsillar grading was undertaken by otolaryngologists who were blinded to the results of the PSG.
Conclusions
Obese adolescents are at risk of multiple morbidities, including a significant risk for developing OSA. Due to limited PSG resources, screening tools are urgently needed to identify obese individuals at greatest risk for OSA. In this cohort of obese subjects, we observed that NHr combined with measures of tonsillar hypertrophy showed a strong predictive ability for OSA and may be useful in an ambulatory setting after further validation. We confirmed our hypothesis that the model with NHr demonstrated better predictive ability than measures of adenoid and tonsillar hypertrophy alone. NHr ≥0.25, which corresponds to the 75th percentile of its distribution in the OSA group, in combination with enlarged tonsils may be a useful screening tool to identify obese youth at risk for OSA. These observations are relevant in the context that neck, height, and tonsillar size can be easily and reliably measured in an ambulatory setting to screen obese youth. This will allow prioritization of high-risk obese individuals for early diagnosis and targeted therapeutic interventions for OSA to minimize long-term morbidity. This is especially important, as 75% of obese adolescents will seamlessly transition to obese adults with their coexisting morbidities. 31 Given our study limitations, future research is needed to focus on validating these results in a larger community-based cohort with appropriate comparison groups of nonsnorers and nonobese subjects with and without prior tonsillectomy. This will further our understanding whether such measurements can be used as a surrogate for PSG, which is especially relevant for underresourced areas.
Author Contributions
Disclosures
Footnotes
No sponsorships or competing interests have been disclosed for this article.