
Abstract
In this article, the development of microcellular structure foams has developed by integrating the two successful and existing technologies, namely CO2 gas batch foaming and Fused Deposition Modeling (FDM) 3D printing technique. It is a novel approach to manufacture complex design porous products for customized applications. The eventual cell morphologies of the extruded 3D printing filament depends on the process parameters pertaining to both microcellular foaming and 3D printing processes. Further, morphological study has been conducted to evaluate the cell morphologies of the 3D printing filament developed through customized FDM setup. During this process, the significance of various process parameters including saturation pressure, saturation time, desorption time, feed rate and extrusion temperature were thoroughly studied. To pursue this study base material used was acrylonitrile butadiene styrene (ABS). The 3D printed filaments consisted of cells with an average cell size in the range of 2.3–276 µm and the average cell density in the range of 4.7 × 10⁴ to 4.3 × 10⁹ cells/cm3. Finally, it has found that by controlling the process parameters different cell morphologies can be developed as per the end application.
Keywords
Introduction
Batch foaming
The demand for cellular plastic materials is increasing significantly due to its very diverse industrial utilization such as in lightweight, insulation, purification, shock-absorbing and sound-absorbing applications.1-4 The replacement of solid polymer with its foamed counterpart results in reduction in product weight combined with additional provision for attaining tailor made properties according to the desired end application. Carbon dioxide (CO2) foaming is a green process used for developing thermoplastic polymeric foams by utilizing CO2 as a physical blowing agent. 5 The CO2 gas foaming process has two distinct steps namely saturation process and expansion process. In the saturation process, polymers are saturated under high pressure CO2 gas using an autoclave equipment, which results in absorption of CO2 in the polymer matrix. During this process, the glass transition temperature (Tg) of the polymer is observed to decrease and the polymer depicts to be more plasticized. 6 Post-depressurization, the expansion process by inducing thermodynamic instability which is pursued by the sudden decrease in pressure or increase in temperature. This process will result in cell growth and the formation of polymeric foams. Further, cell growth will stop after polymer returning to its glassy state, either due to a decrease in temperature or decrease in CO2 concentration in the polymer then polymer no more plasticized. Generally, below the glass transition temperature no foaming or very poor foaming occur due to rigidity of the polymer matrix.
The foaming behavior, performance of ABS polymer has investigated by researchers and found a wide range of applications, excellent in processing. Tsuchiya et al. 7 have studied the influence of filler types (Vapor grown carbon fiber, Calcium carbonate) and their concentration (5–15% Weight) on the microstructure of CO2 batch foamed ABS polymer matrix. Also, Realinho et al. 8 have studied the effects of a phosphorus flame retardant system on the mechanical and fire behavior of microcellular filled and unfilled ABS polymer. Further, Forest et al. 9 have developed the nanocellular ABS foams by increasing the nuclei density via induction of heterogeneous nucleation. Likewise, Yoon et al. 10 have developed micro and nanocellular foams with controlled cell nucleation densities by using sub- and supercritical CO2 blowing agents. Gomez-Monterde et al. 11 have studied the properties of microcellular ABS foams and found that flexural modulus, flexural strength, and fracture toughness KIc decreased with the density. Furthermore, Ho Kim et al. 12 have investigated the electrical performance of ABS foamed polymer and it was found that electrical properties enhanced compare to its counterpart neat polymer.
In general, foams are classified based on their attributes such as cell connectivity, elastic modulus, expansion ratio, cell size and cell density. Based on cell connectivity foams are categorized as open cells and closed cells. Gandhi et al. have utilized ultrasound technique for the induction of nucleation 13 and developing porous foams. 14 Also developed bimodal 15 and multimodal 16 foams using multi-stage depressurization method. Further, developed ultralow dense foams using cyclic foaming14,17 and water as co-blowing agent. 18 Furthermore, investigated the influence of blowing agent residence conditions on foam attributes, 19 developed an open-cell porous sheet by utilizing the surface-quenching method during an extrusion process. 20 The key quantifying parameters of foams are cell morphologies and expansion ratio. The eventual output of foams will be controlled by process parameters comprised of both saturation and foaming process. The key governing parameters of the CO2 are saturation pressure, saturation temperature, saturation time, depressurization rate, foaming time and foaming temperature etc.
3D printing
Three-dimensional printing (3DP) is a trending technology, persistently exploring options and expanding its frontiers owing to its numerous benefits and pioneered solutions. The key benefits of this cutting edge technology such as freedom of design, producing complex geometries & tailor-made objects, eco-friendly and waste minimization. 3D printing techniques works based on various principles which include extrusion-based, vat or photopolymerisation, inkjet printing, sheet lamination, powder bed fusion and direct energy deposition. 3D printing techniques are very popular in providing customized solutions for various industries such as aerospace, automotive, engineering, construction, medical & biomedical, education & research and food industry etc. 21 3D printing is the process of fabricating parts by successive deposition of material layer one up on other until to print the entire object. 22 This process has three steps such as pre-processing, printing and post-processing. Pre-processing includes the development of a geometric model (using CAD software), layered process (using slicing software) and also setting printing process parameters. Post-processing is the process of removing support structures and enhancing the surface finish. In this study, fused deposition modeling (FDM) 3D printing method has utilized for experimentation which works on the extrusion-based principle. FDM is the most popular and widely used 3D printing technique among other techniques. The key advantages of the FDM technique are economical, easy to operate and portable. Most of the thermoplastics and its blends can be printed using this technique, acrylonitrile butadiene styrene (ABS), Polylactic acid (PLA) are commonly printing materials.23,24
Integration of batch foaming and 3D printing
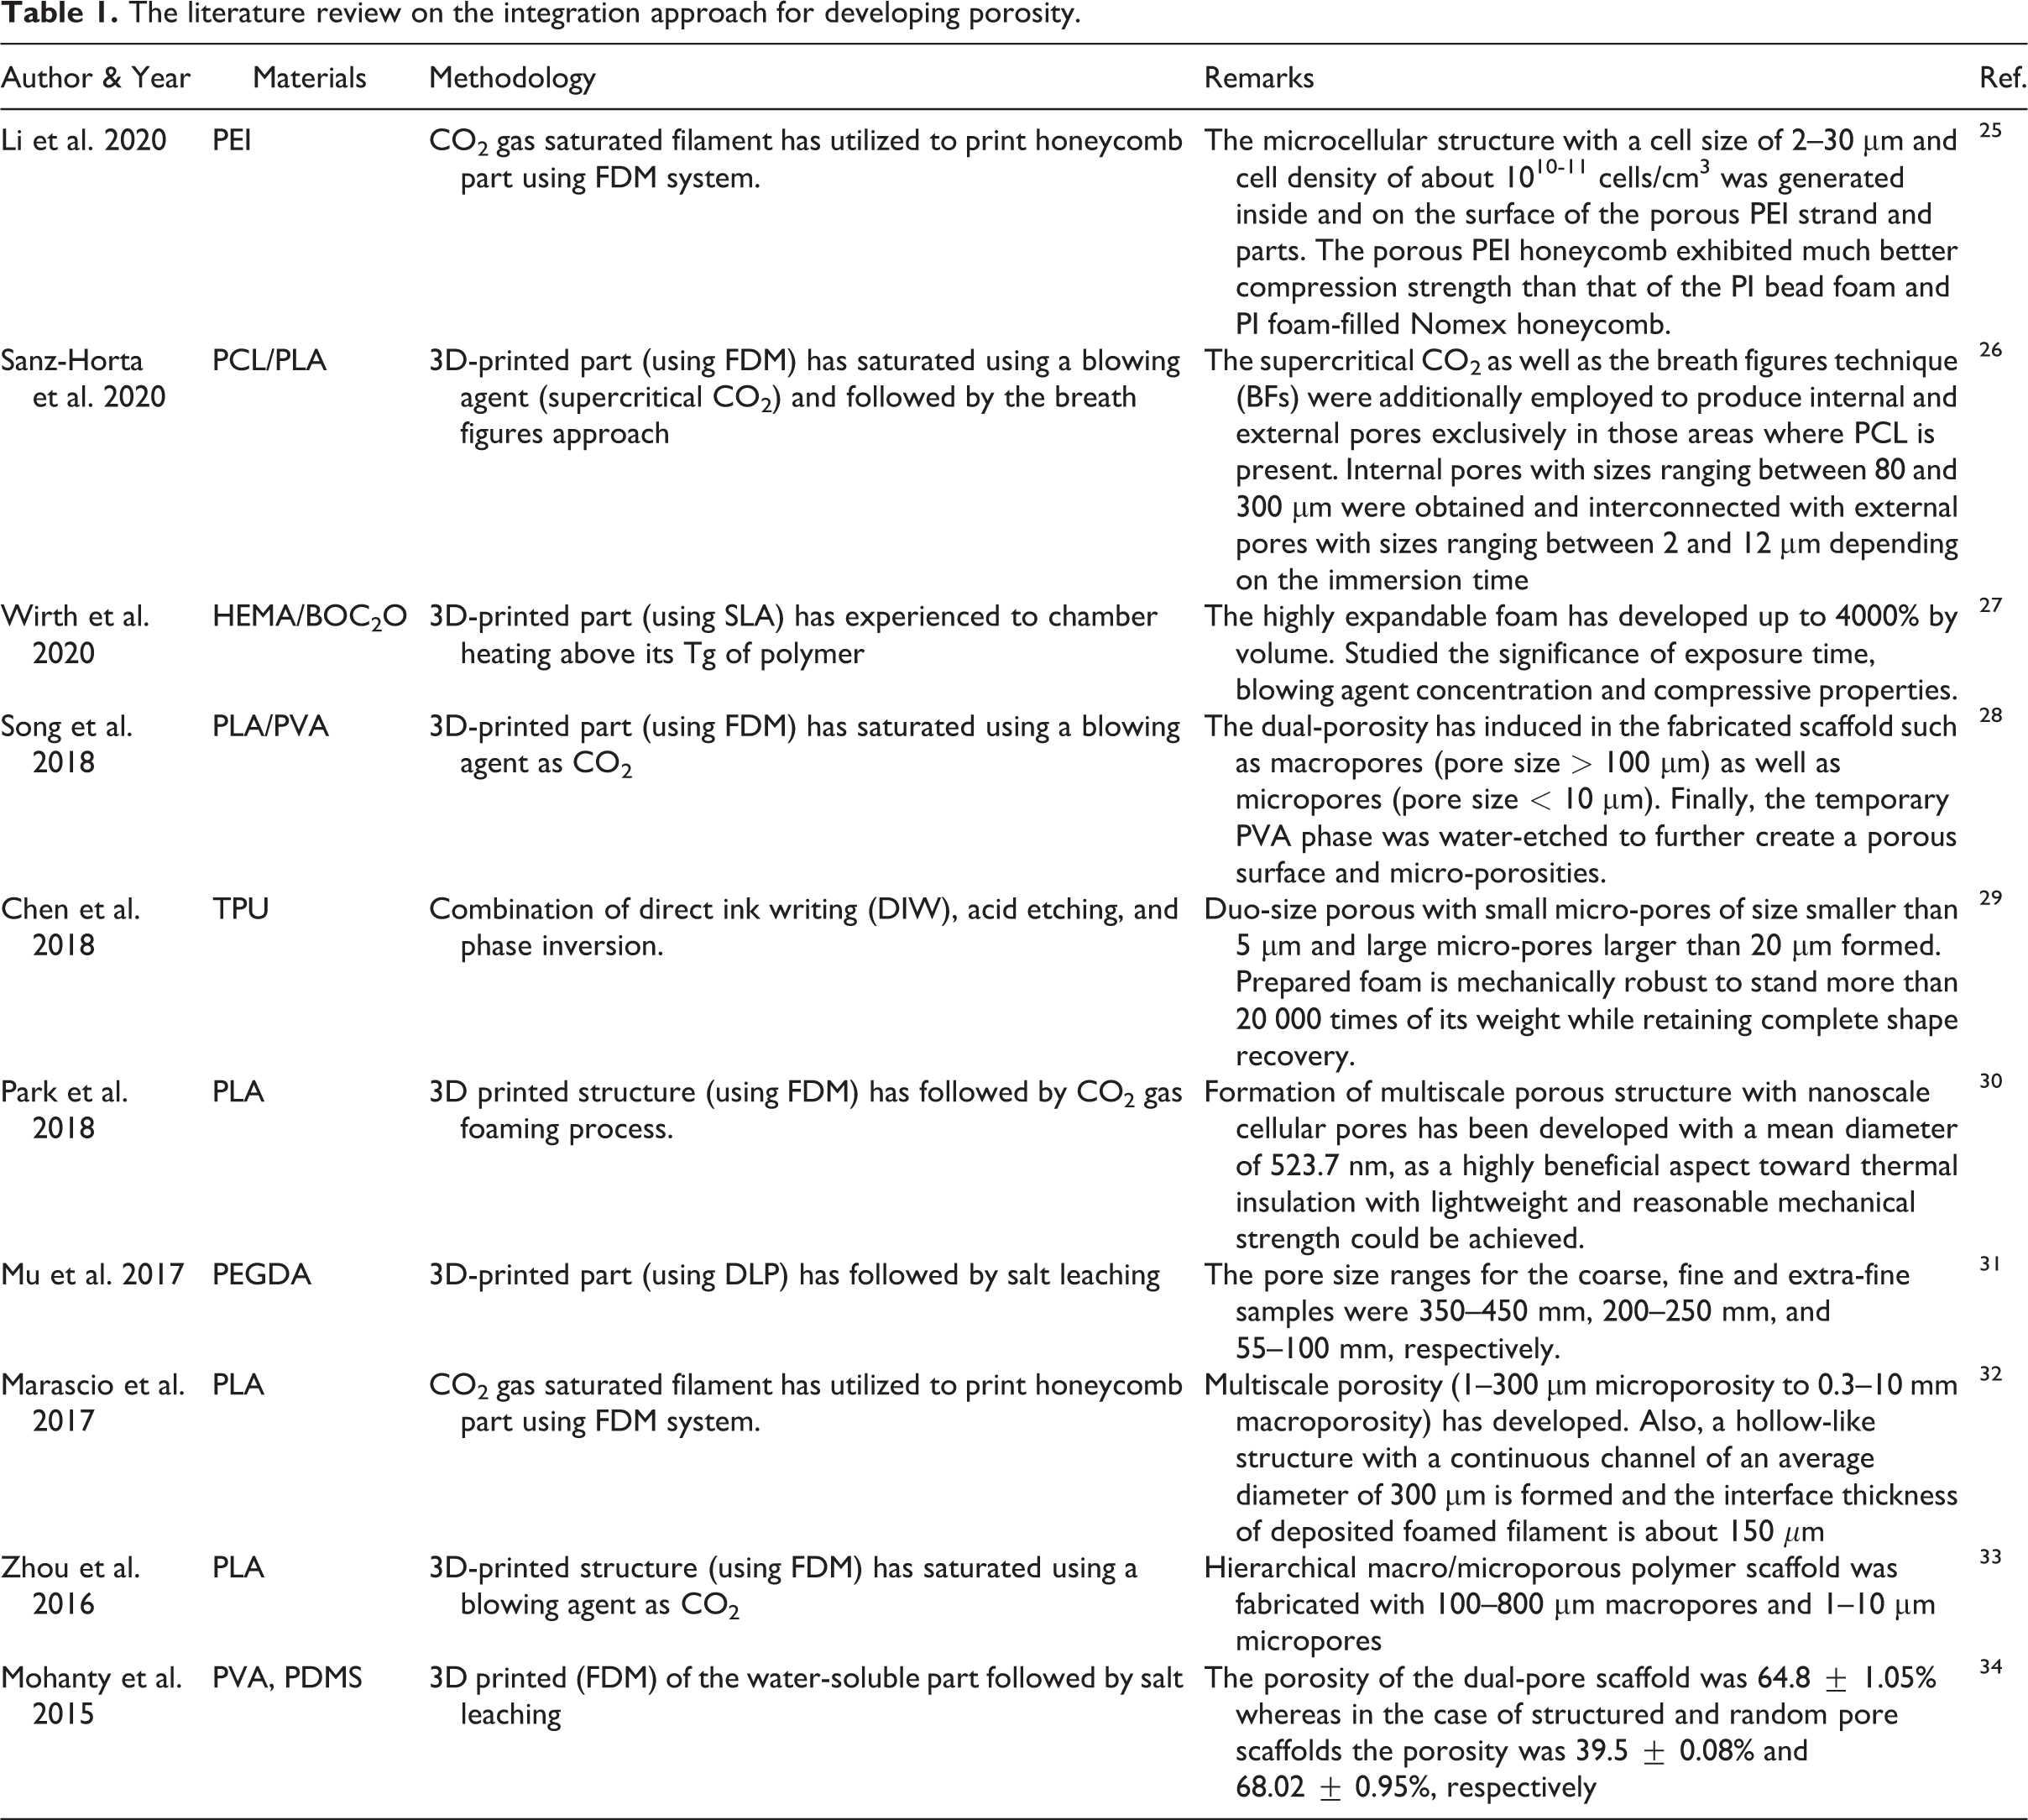
Integration approach of batch foaming and 3D printing method gains both the advantages of these two processes. For instance, batch foaming is familiar with developing light products and 3D printing provides flexibility in design and producing customized parts. The integration approach attains benefits from both the processes. Also, dual-porosity can be achieved through the integration approach method. The detailed literature review of the integration methods and methodology has shown in Table 1.
The literature review on the integration approach for developing porosity.
Experimental
Materials
Commercially available acrylonitrile butadiene styrene (ABS-M30) 3D printing filament has used as the base polymer for experimentation. The standard filament has supplied by M/s Altem technologies with a diameter of 1.75 mm, the density of 1.04 g/cc and the and glass transition temperature (Tg) of approximately 108°C. Industrial graded CO2 gas was used as a physical blowing agent that has supplied in a standard cylinder with a purity of 99%.
Foaming methodology
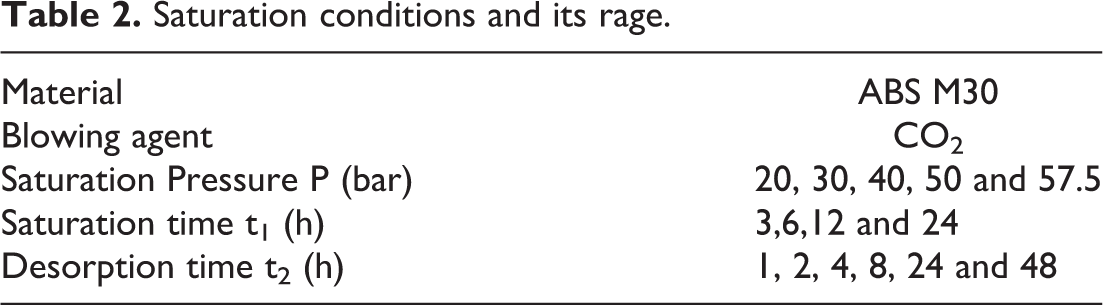
Development of microcellular foams by integration approach is a novel method which has comprised of integration of two successful and existing technologies such as solid-state CO2 gas batch foaming technology and fused deposition modeling method (FDM). Figure 1 shows the schematic of this microcellular foaming process methodology. During this process, the standard 3D printing filaments were saturated under high-pressures CO2 gas by using an autoclave setup. Table 2 shows the saturation conditions of the pursued experiments. Post-depressurization, the saturated 3D printing filaments were extruded at various conditions using a customized FDM setup. Table 3 shows the extrusion conditions of FDM. In general, the development of foams using CO2 gas is due to the induction of thermodynamic instability by either a sudden drop of pressure or a sudden rise in temperature. In this study, thermodynamic instability was induced at the time of passing through the orifice of the heated nozzle. As the gas saturated 3D printing filament passes through the heated nozzle, there is a drop in solubility of CO2 within ABS matrix which results in nucleation of cells. The cell morphologies can be controlled by the process parameters of both the saturation and expansion stages. Throughout this study, samples have been saturated at room temperature and the desorption time was maintained at approximately 1 hour. Also, the time gap between the release of pressure and sorption measurements is approximately 5 min (Idle time for depressurization & removing samples from autoclave). Further, the depressurization of CO2 gas from the vessel have pursued at 10 bar/s.
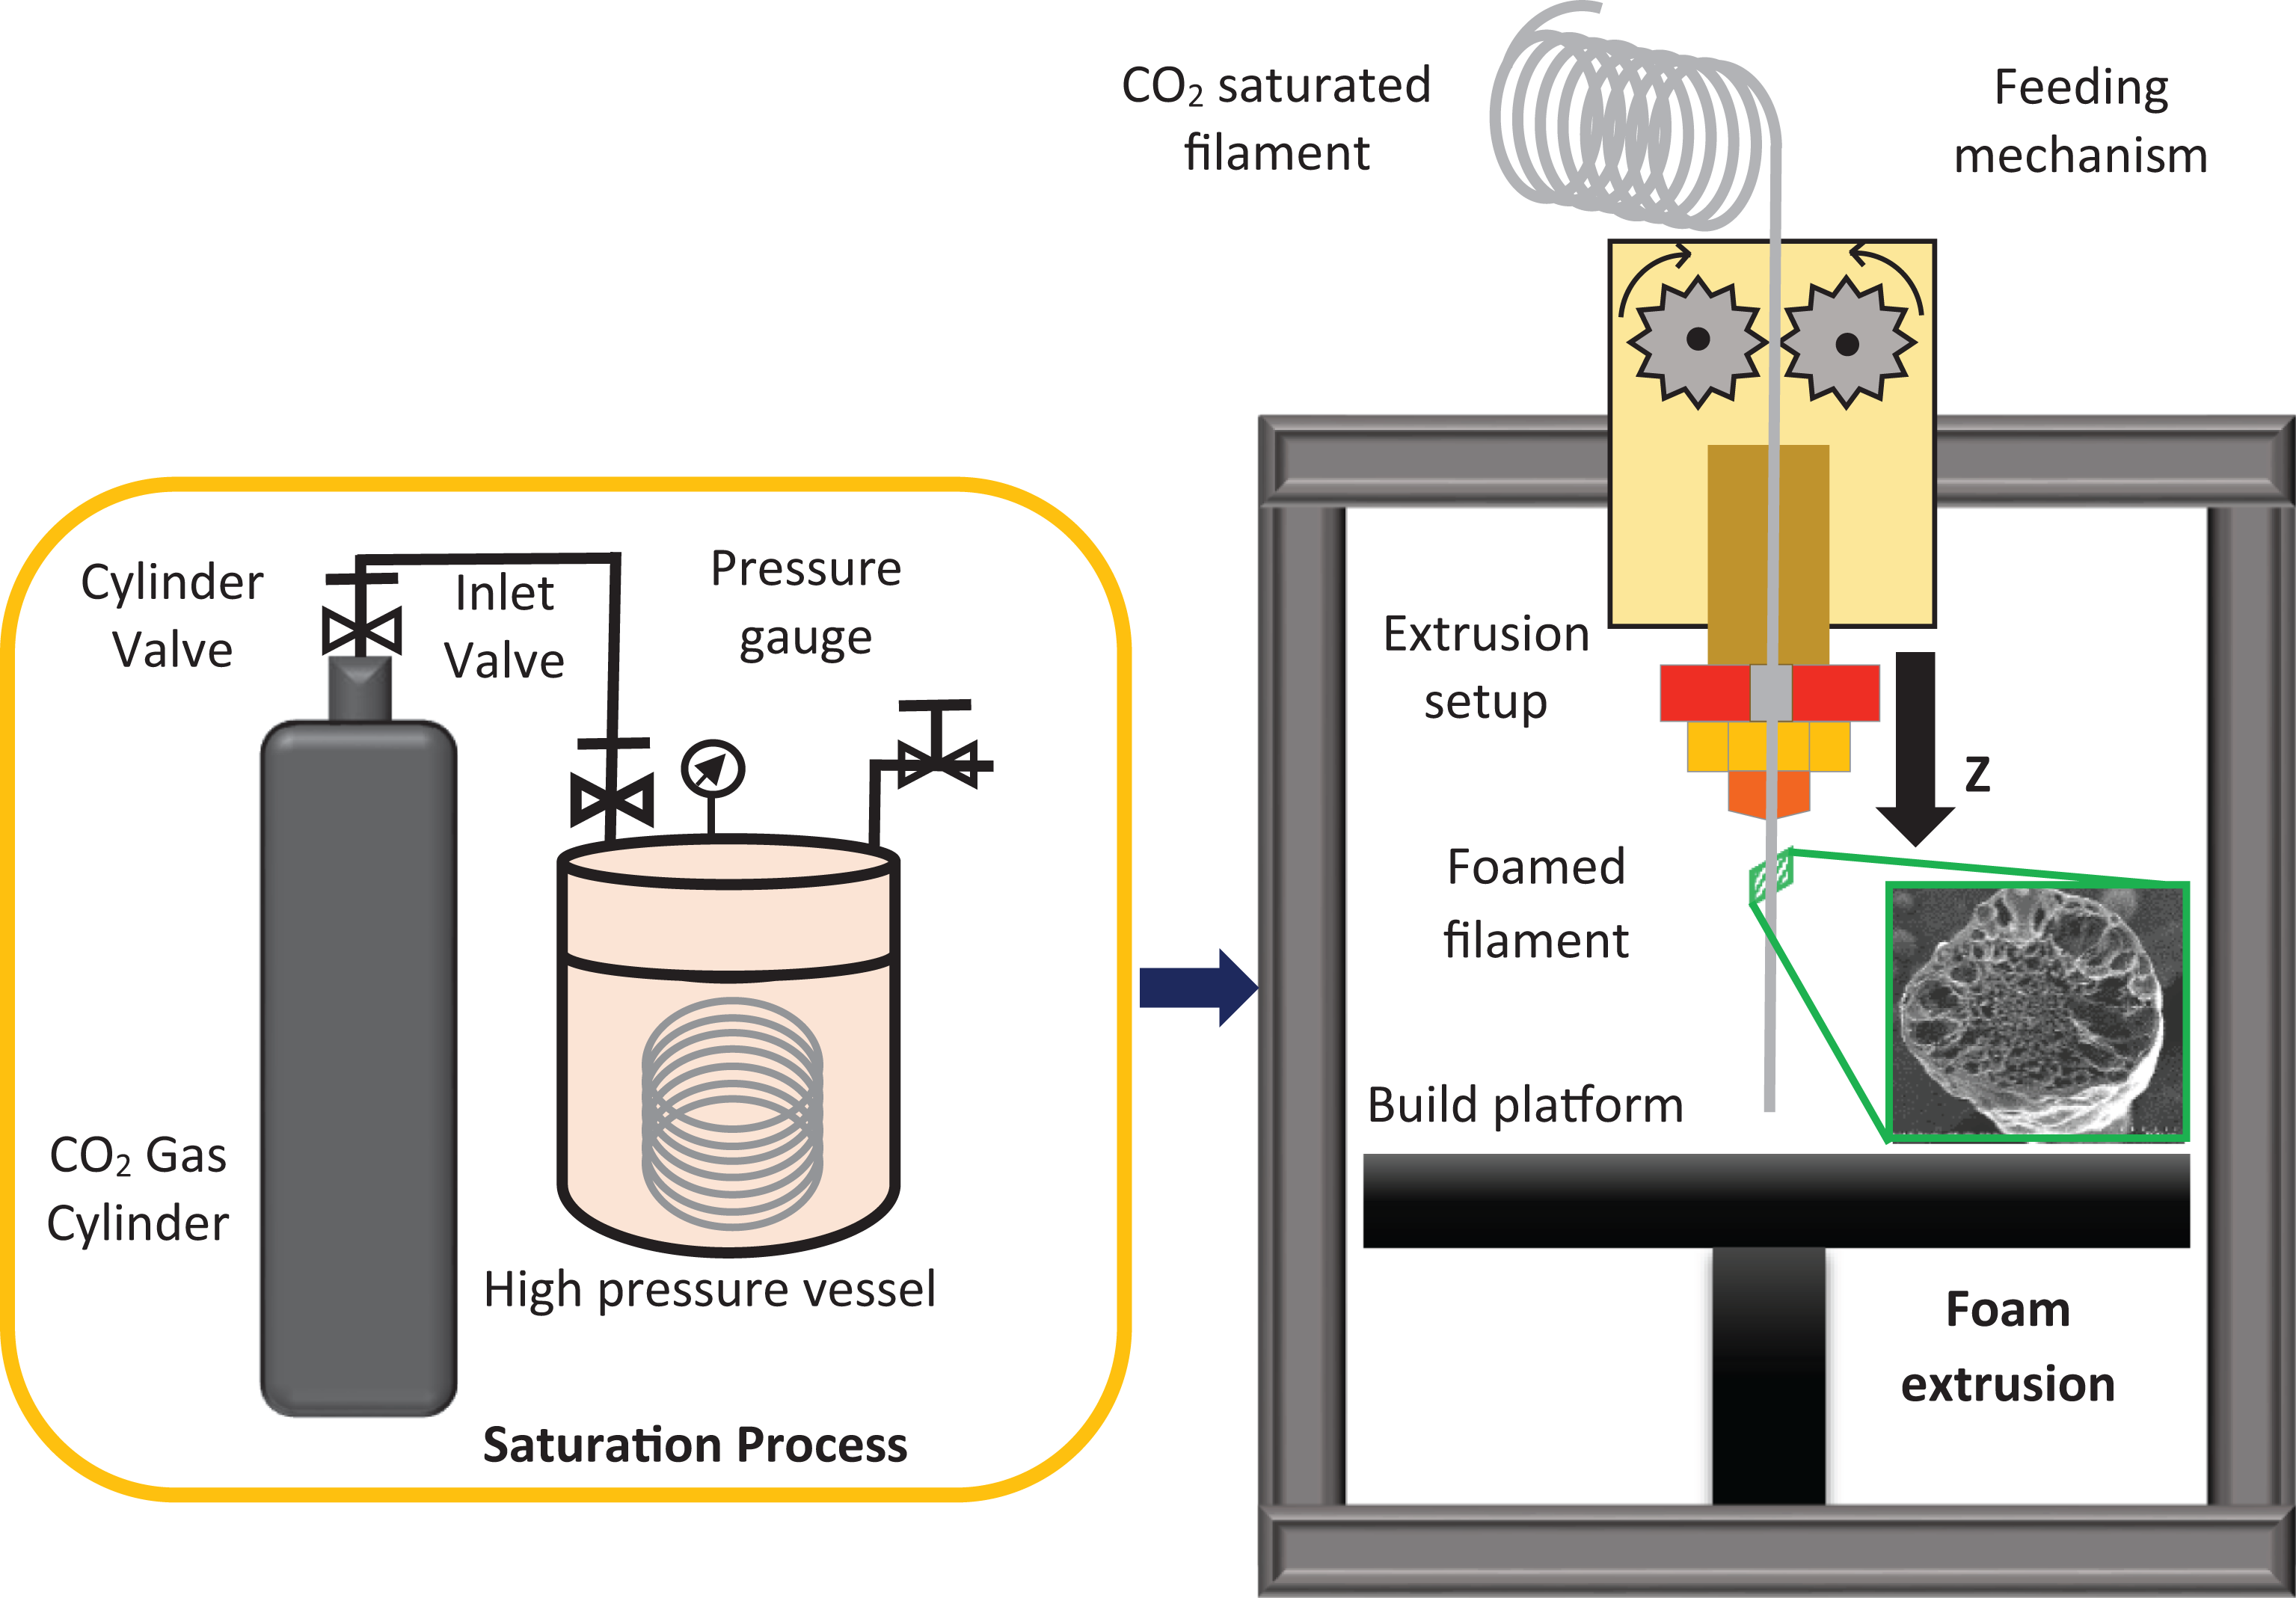
Schematic of novel microcellular foaming methodology.
Saturation conditions and its rage.
Extrusion conditions and its range.
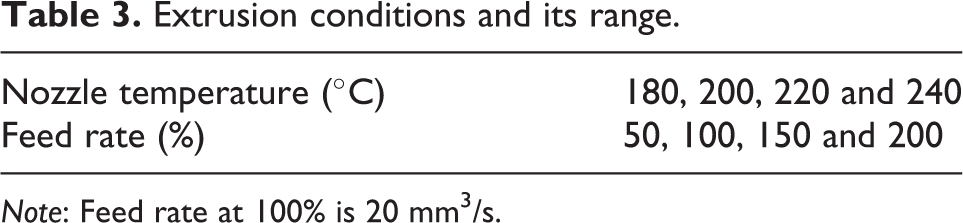
Note: Feed rate at 100% is 20 mm3/s.
Characterization
Sorption
Sorption characterization was investigated for the saturated 3D printing filaments at various saturation parameters and its range are defined in Table 2. The weight of the samples was measured using a weighing balance (Make: Wensar – MAB-220) with an accuracy of 0.1 mg. Further, the percentage of weight gain by specimens have measured by the gravimetric method. 16

Here, Wf refers to the weight of the specimen after saturation and W0 refers to the weight of the specimen before saturation.
Density
The density of the microcellular foam structure of acrylonitrile butadiene Styrene (ABS) samples have measured according to ASTM D 792. Samples weight have measured in the air as well as in distilled water by utilizing the Wensar density measurement equipment. The density of distilled water was considered to be 0.9975 g/cc at room temperature. The density of ABS microcellular foams has determined by using the following equation (2). 35

a = weight in air
b = weight in standard liquid
Expansion ratio
Expansion ratio (Δ) is defined as the ratio of the density of virgin polymer to foamed polymer samples. The expansion ratio of the microcellular foamed samples has calculated by using equation (3). 36
Cell morphology
Cell morphologies are defined as the arrangement of cellular microstructures in the foamed polymer samples. The cell morphologies were evaluated by utilizing Scanning Electron Microscopy (SEM), in Hitachi SU 3500N. All the 3D printed filaments were sliced across the filament by using a sharp razor blade to focus the cross-section of the foamed filament. Then the cut cross-section area was gold sputter-coated using a (Make: Hitachi MC1000) Ion Sputter Coater. Then the cell characteristics like cell size, cell density of SEM micrographs were pursued by utilizing Image analysis software (image-j) software.
Cell density
Cell density is defined as, the total number of cells that are presented in the foamed sample within a cubic centimeter. The cell density of microcellular foamed samples has determined using SEM micrograph using the equation (4). 1
No = cell density
n = total number of cells in micrograph
A = area of micrograph in (cm2)
Results and discussions
In this article, microcellular structures have been developed by utilizing an integrated approach of batch foaming and fused deposition modeling method. The integration of these methods is a novel approach used to develop 3D foam printing.
Significance of saturation pressure on cell morphology and its attributes
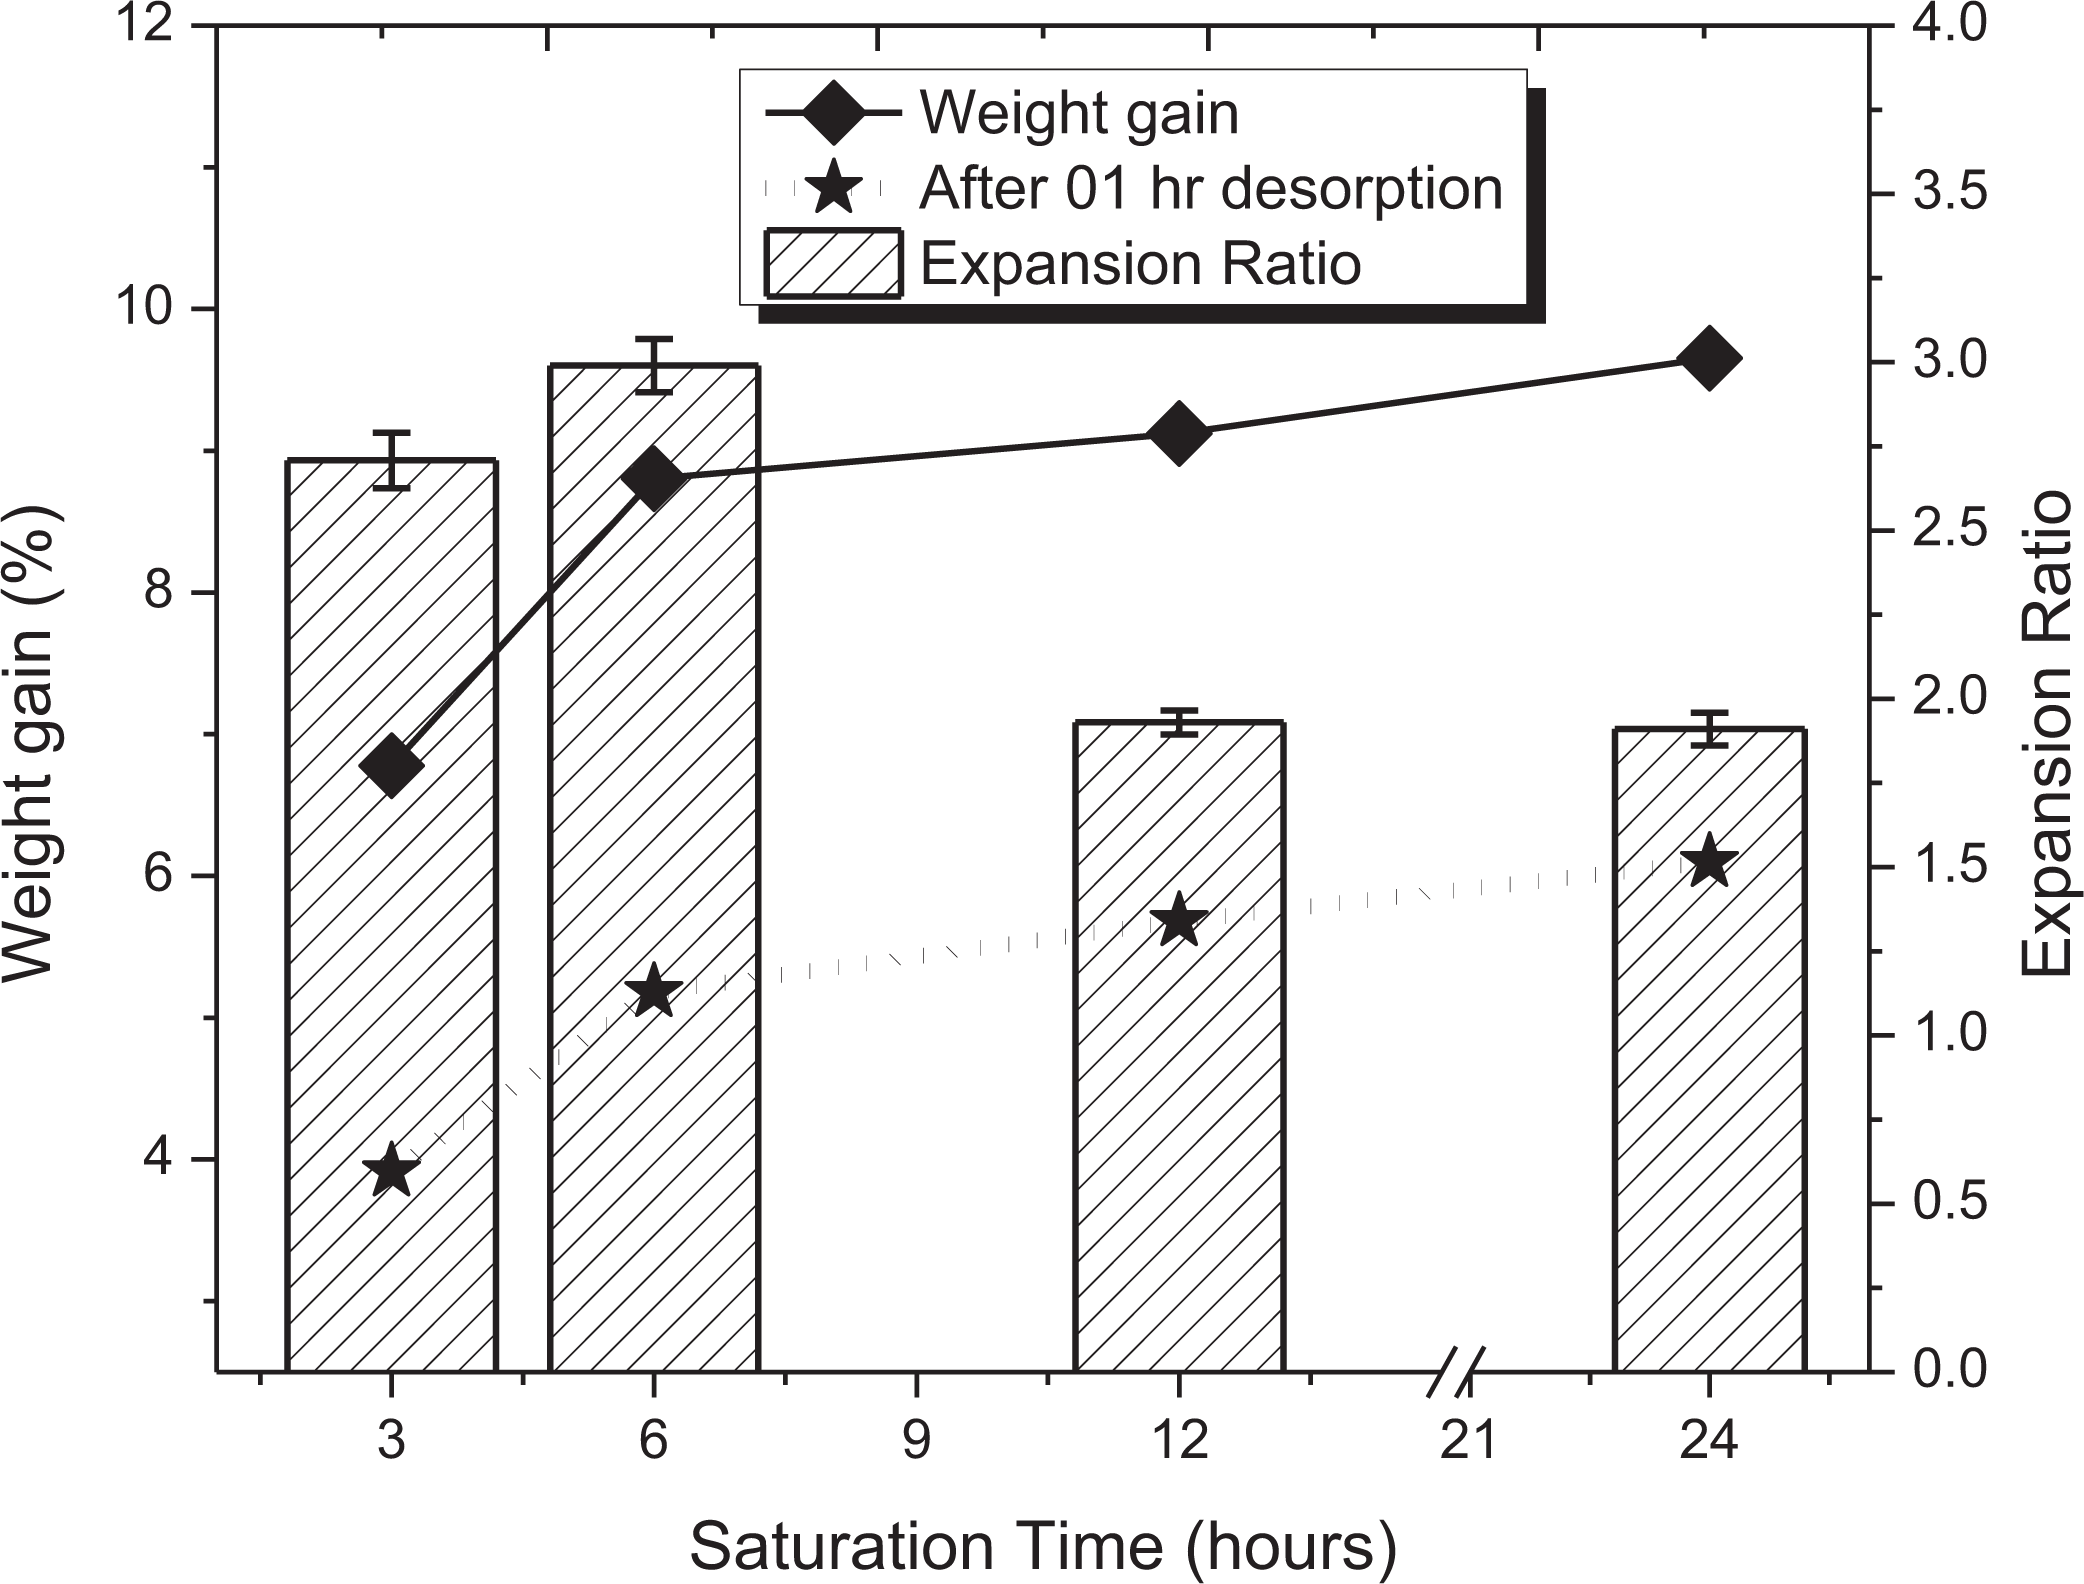
To pursue this study, the CO2 gas saturation pressure inside the autoclave was varied from 20 bar to 50 with an interval of 10 bar. The other process parameters were kept constant which includes saturation time of 24 h, nozzle temperature of 200°C, feed rate of 100% and 1 h desorption time. Figure 2 portrays the Influence of saturation pressure on the percentage of weight gained and expansion ratio. The percentage of weight gain after immediate depressurization was found to be vary from 5.69% to 12.51% corresponding to 20 bar to 50 bar respectively. Similarly, it was found to be 3.92% to 6.95% for after 01 h of desorption corresponding to 20 bar to 50 bar, respectively. But the expansion ratio was found to be followed by a reverse trend i.e. increase in saturation pressure results in decrease in expansion ratio. The expansion ratio was found to be from 5.6 to 1.98 corresponding to 20 bar to 50 bar saturation pressure, respectively.
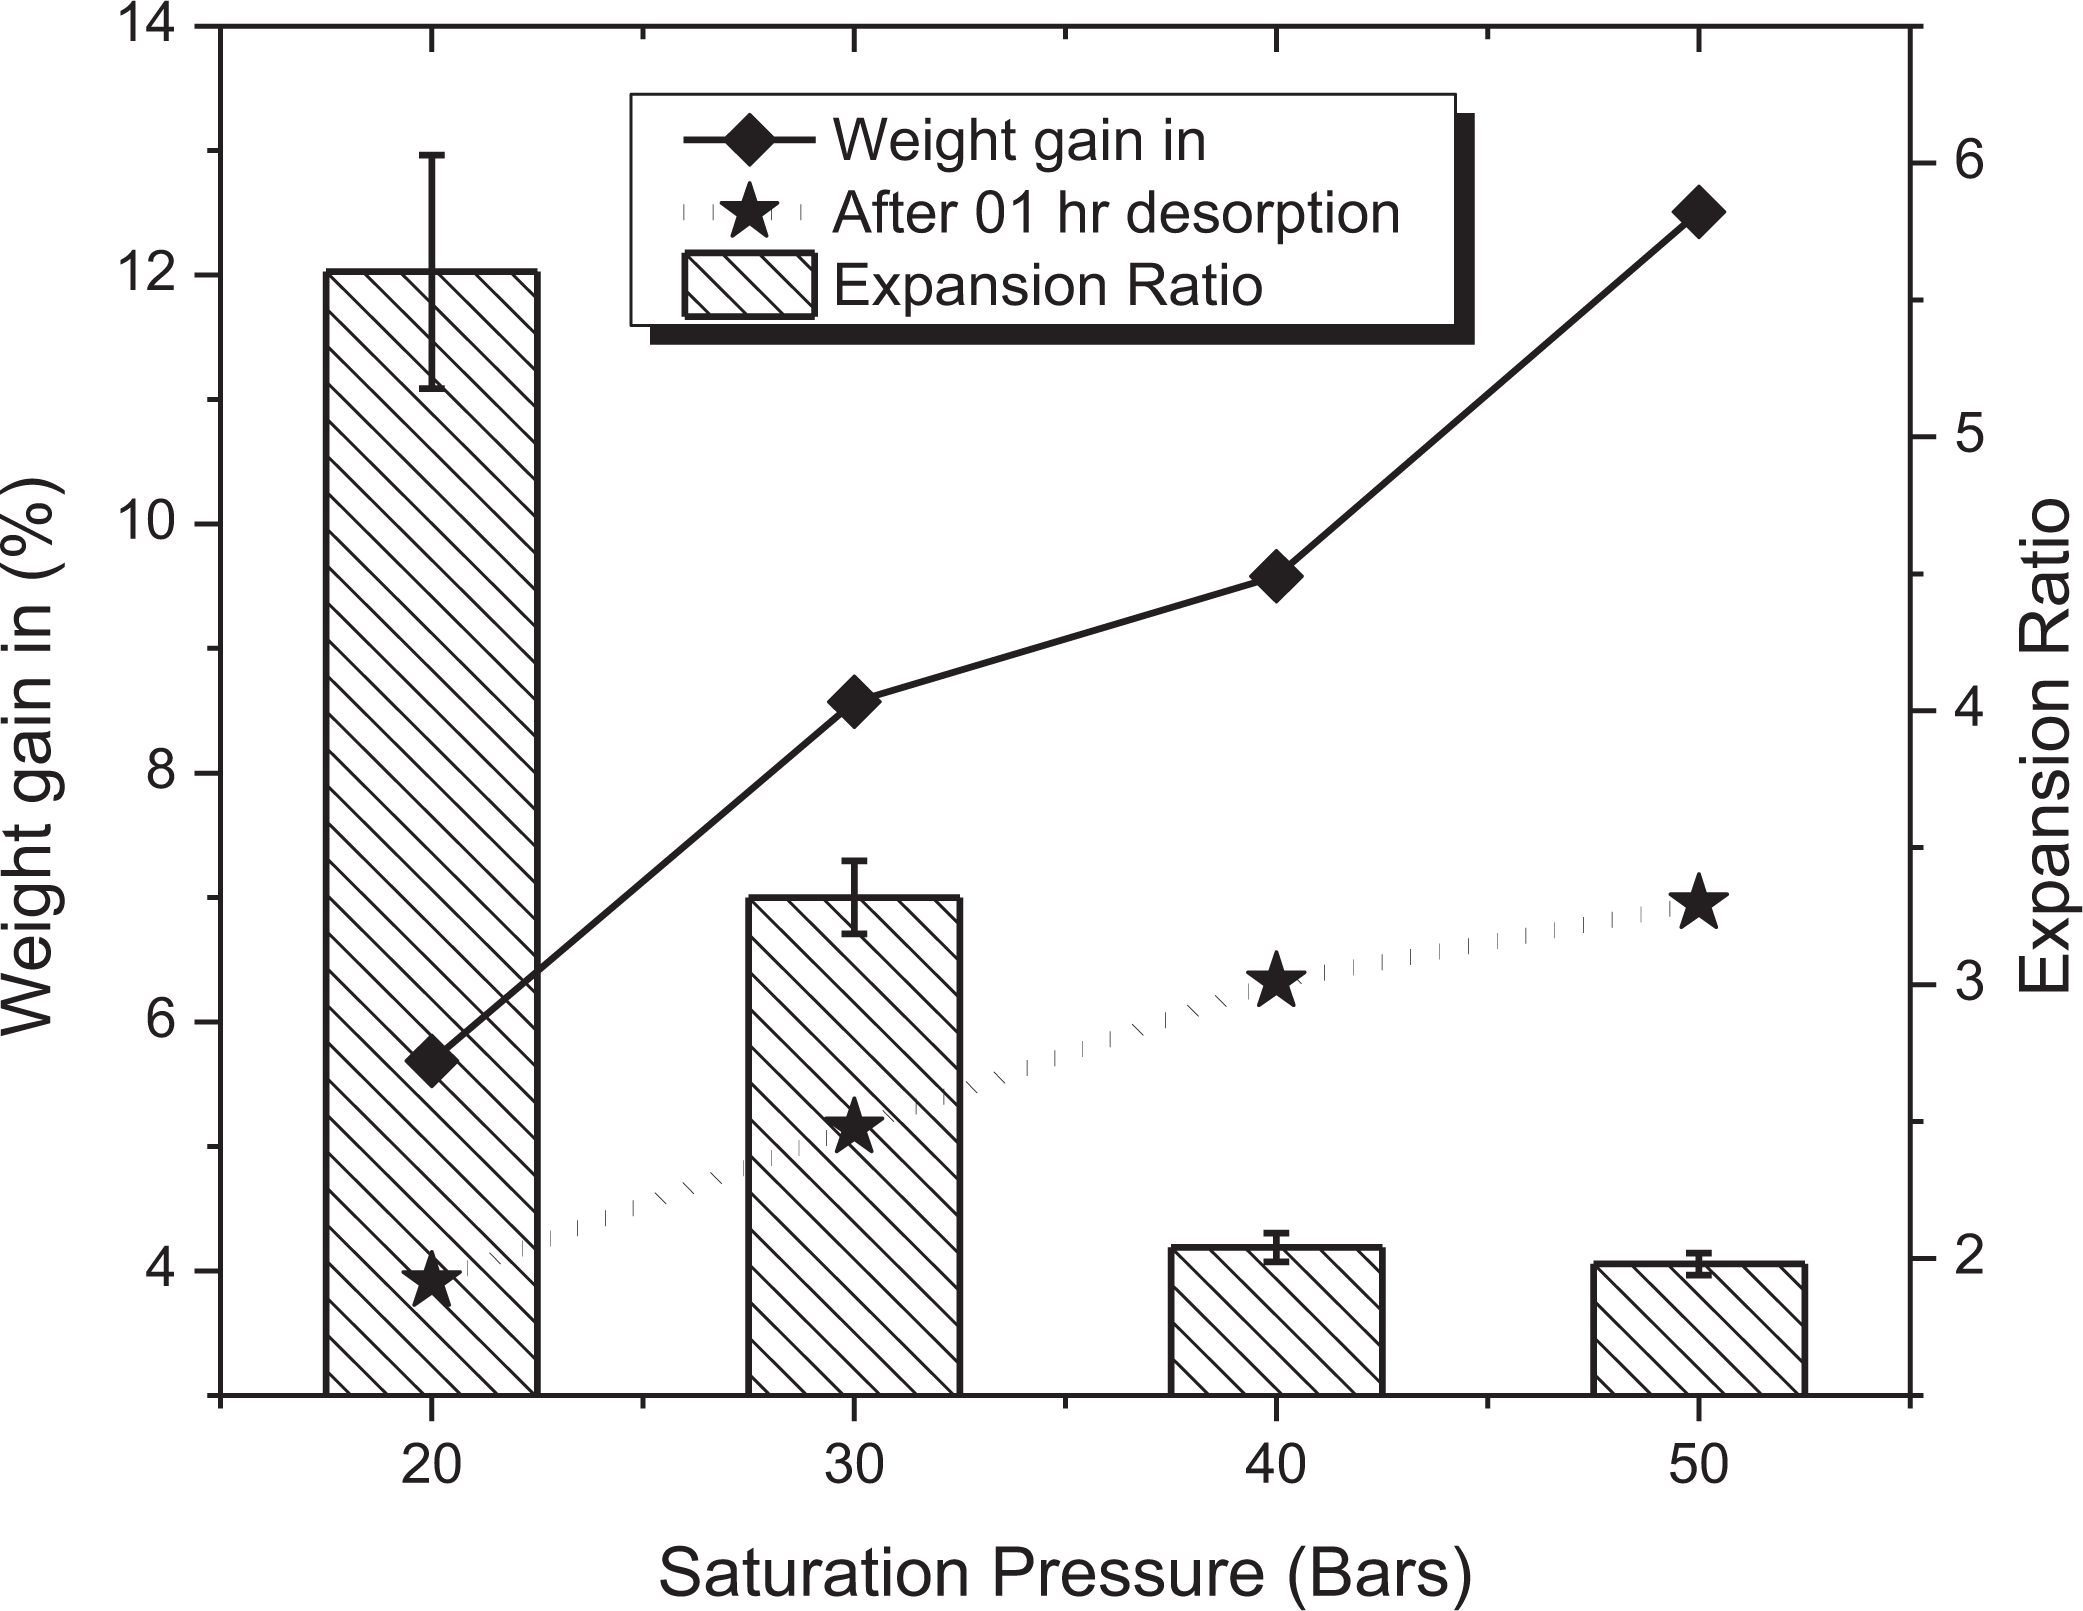
Influence of saturation pressure on the percentage of weight gain and expansion ratio.
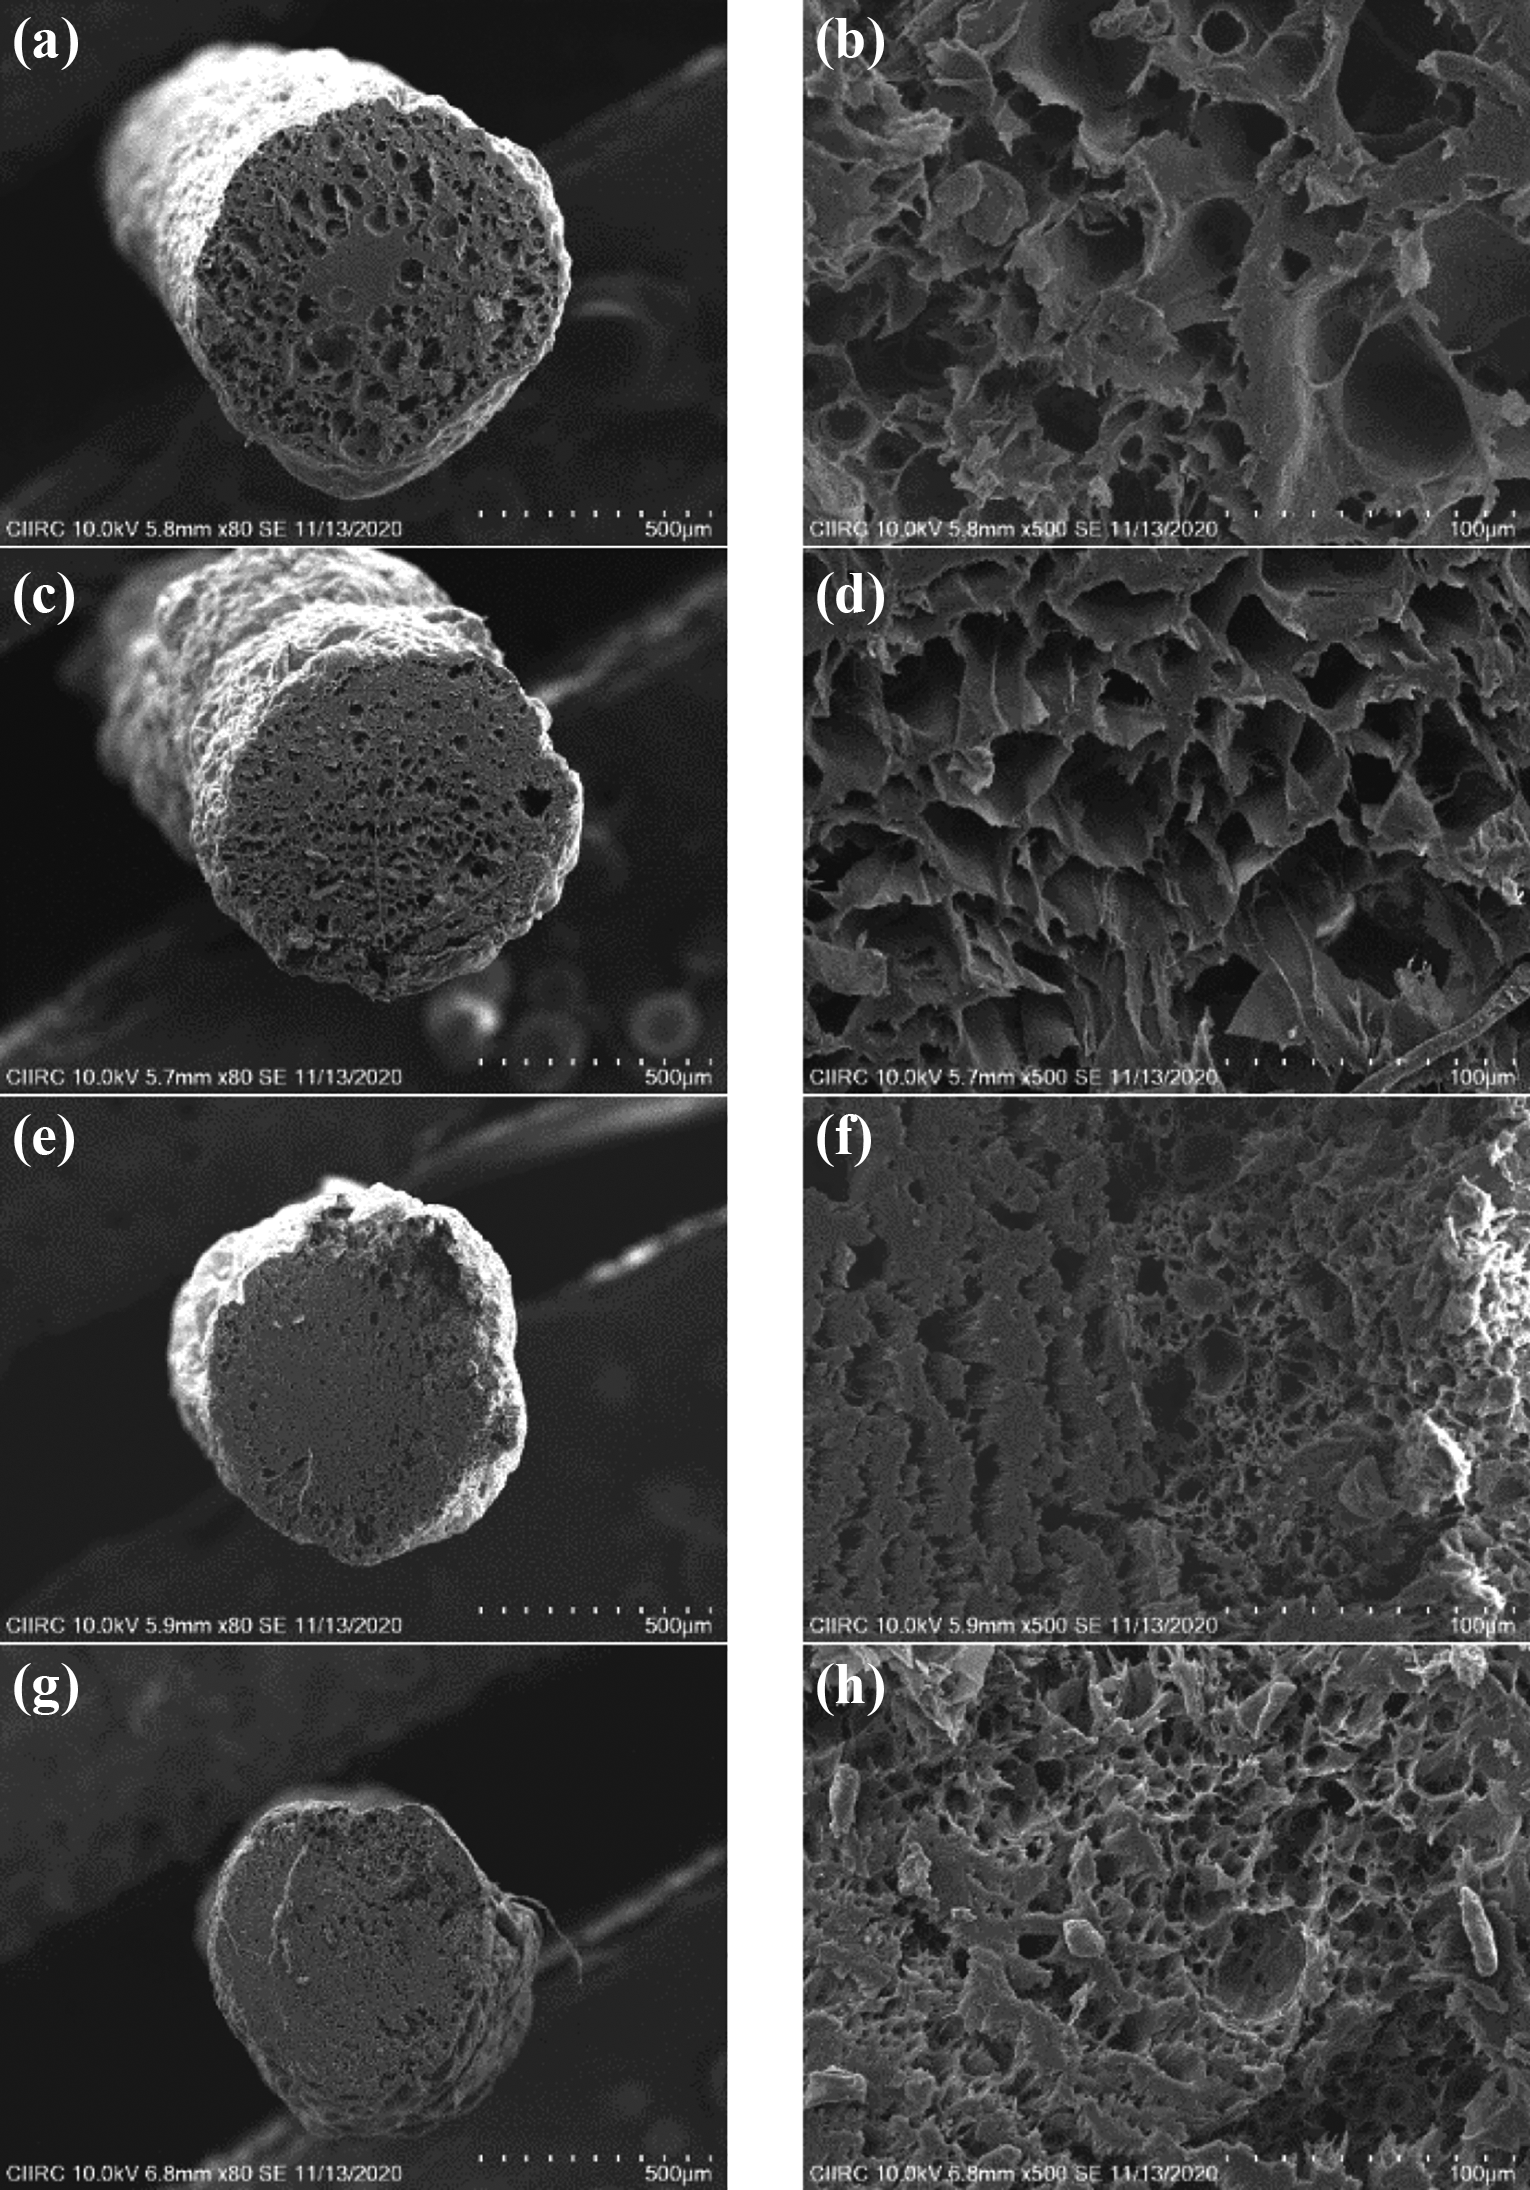
Figure 3 shows the effect of saturation pressure on cell morphologies at different magnifications for better comprehension. Further, it was observed that the selected range of pressure from 20 bar to 50 bar was sufficient to produce microcellular structures in the ABS M30 material. Also, it has found that with the increase in saturation pressure decrease in cell size and an increase in cell density was observed. At 40 bar and 50 bar saturation pressures, finer cell morphologies were obtained when compared with the foams developed at 20 bar and 30 bar saturation pressure. Figure 4 depicts the effect of saturation pressure on cell attributes such as the average cell size and average cell density. The average cell size was found to vary from 8.12 µm to 2.88 µm and the average cell density was found to vary from 2.13 × 10⁸ cells/cm3 to 1.11 × 10⁹ cells/cm3 for corresponding saturation pressure ranging from 20 bar to 50 bar respectively.
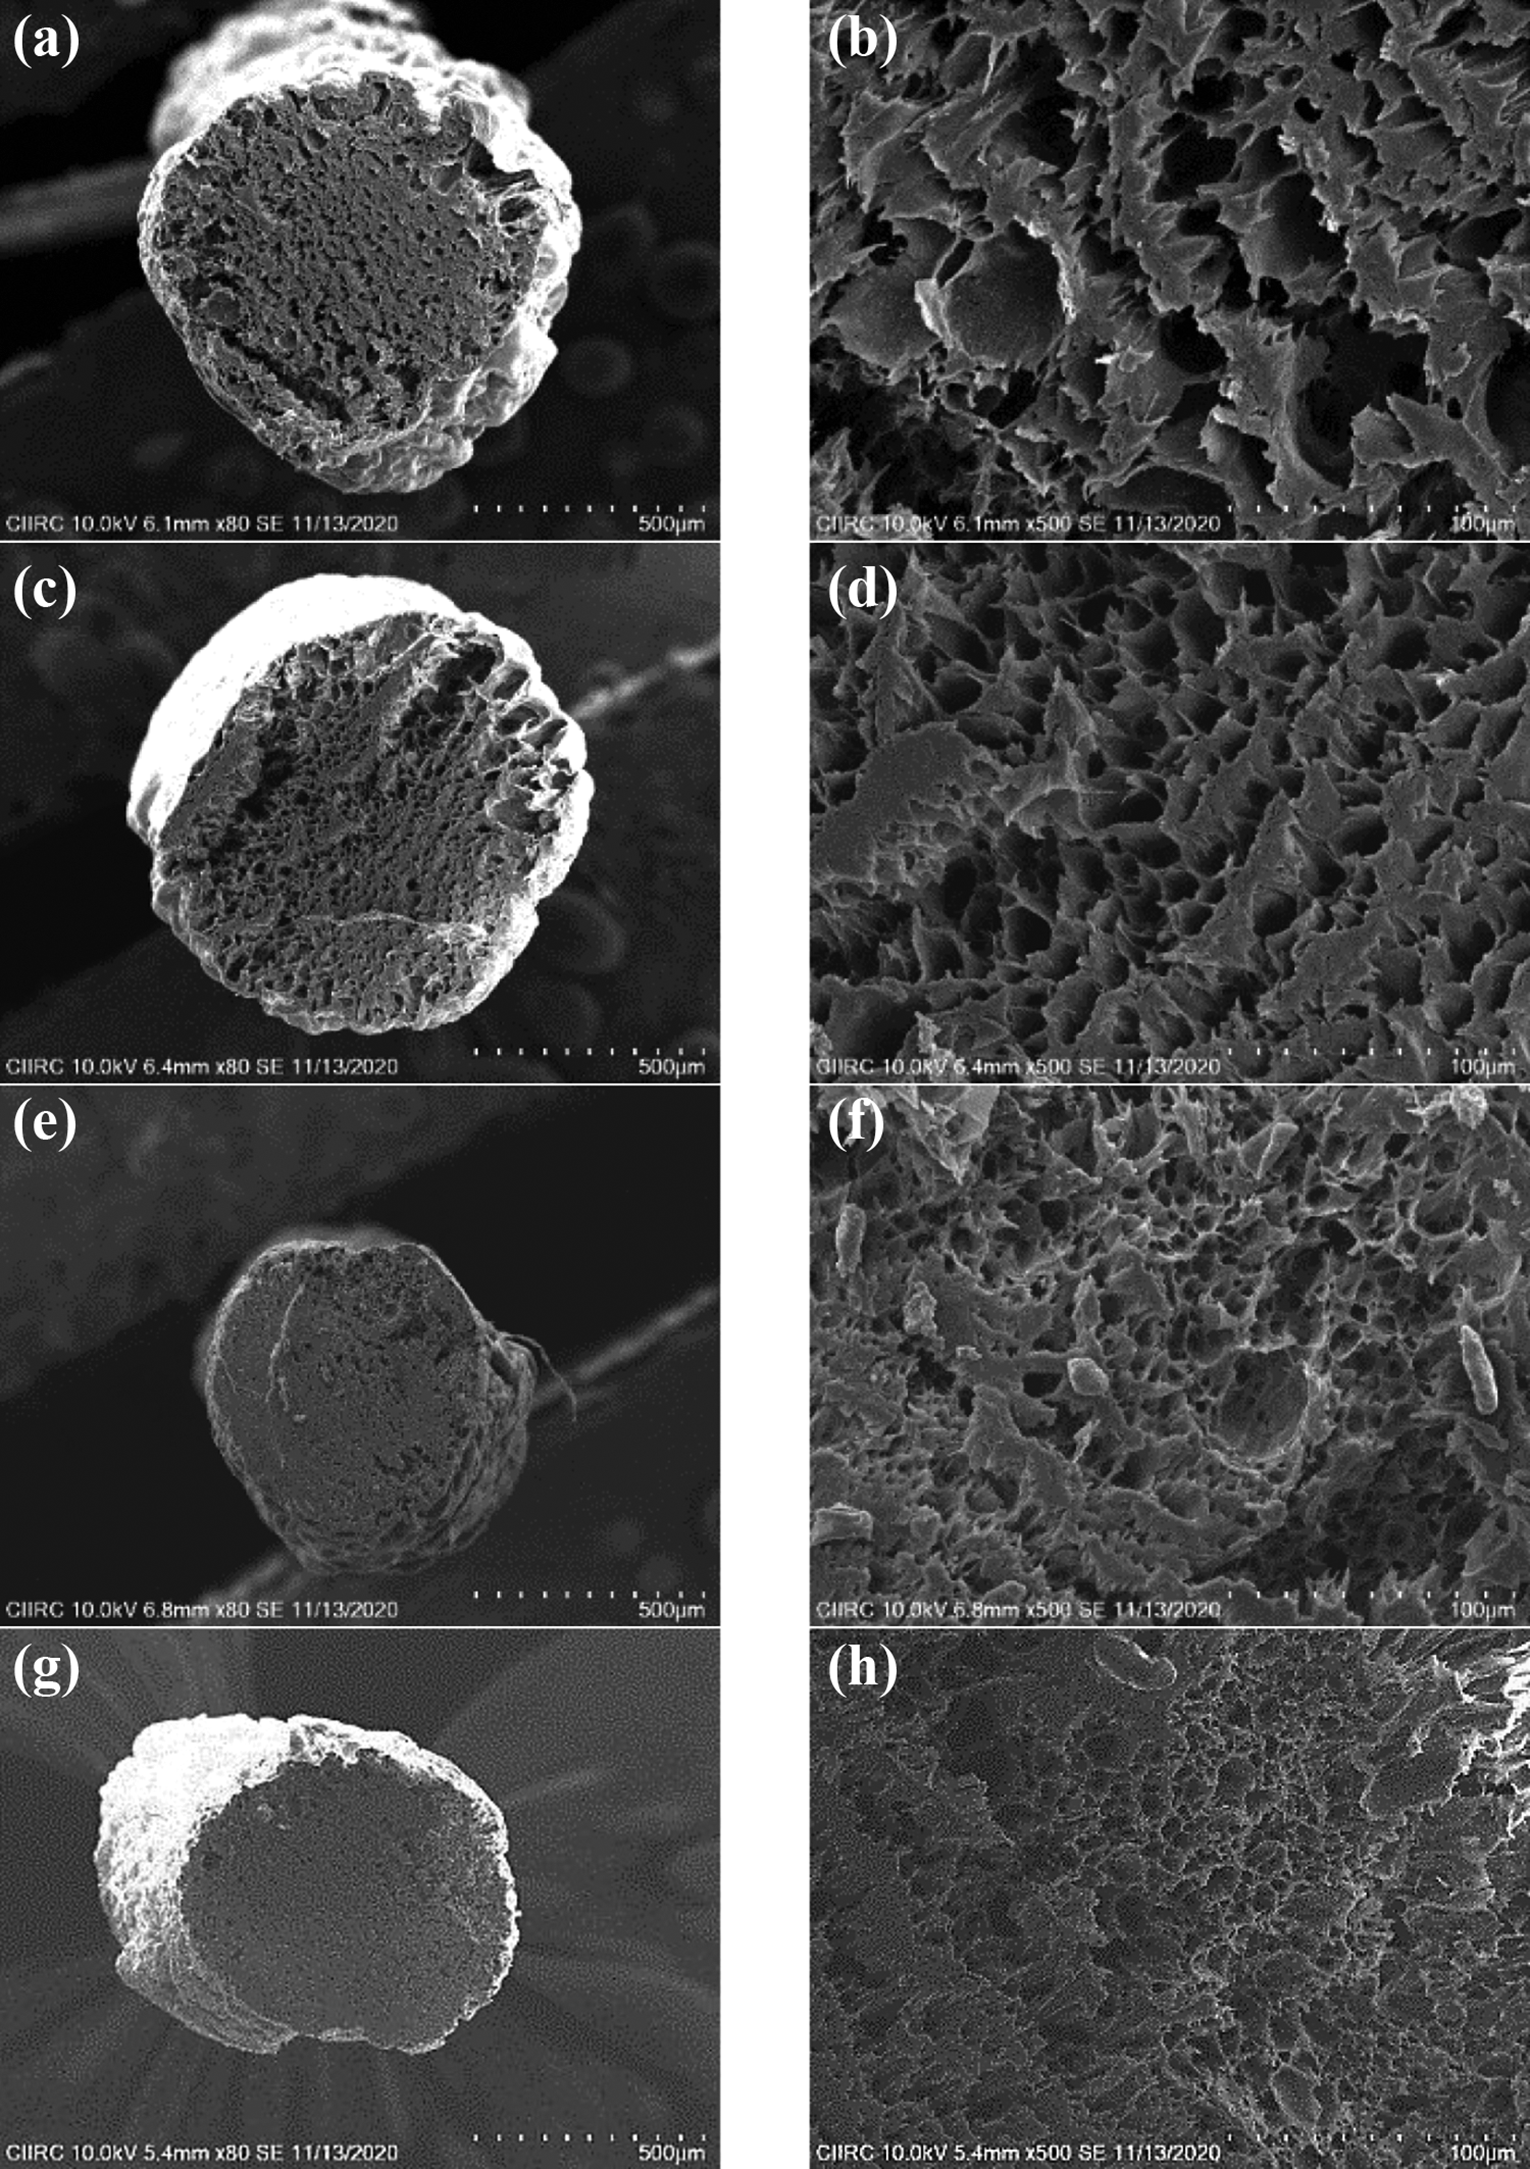
Effect of saturation pressure on cell morphologies. (a) Saturation pressure P = 20 bar, 80×, (b) saturation pressure P = 20 bar, 500×, (c) saturation pressure P = 30 bar, 80×, (d) saturation pressure P = 30 bar, 500×, (e) saturation pressure P = 40 bar, 80×, (f) saturation pressure P = 40 bar, 500×, (g) saturation pressure P = 50 bar, 80×, (h) saturation pressure P = 50 bar, 500×.
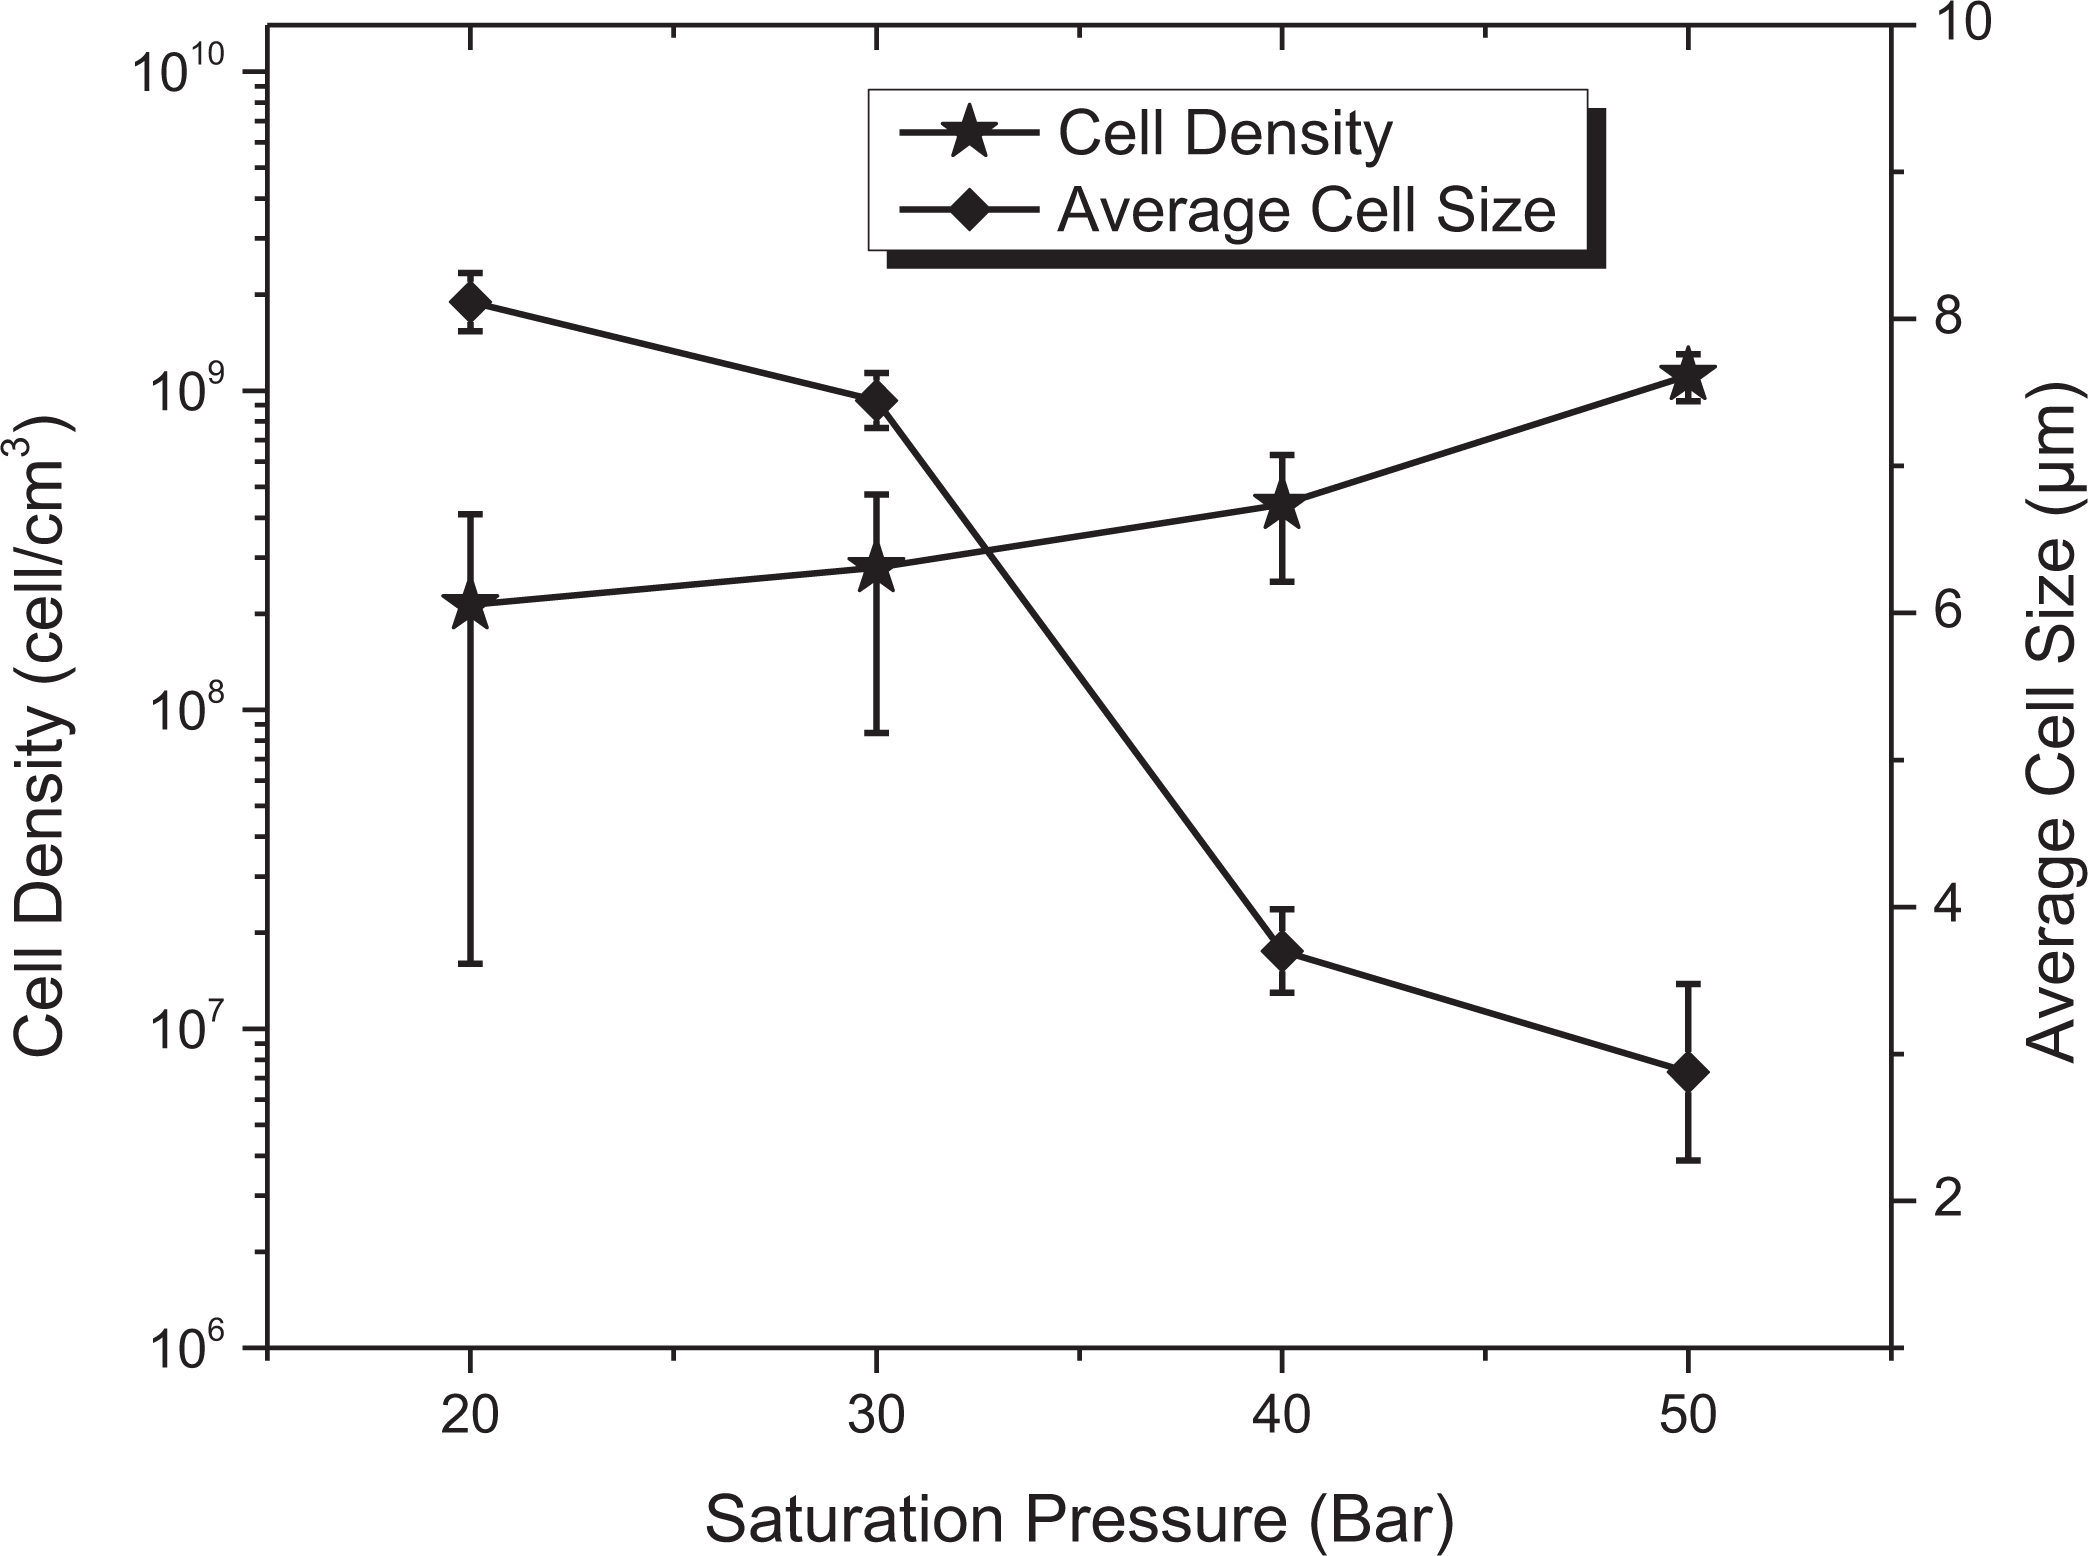
Effect of saturation pressure on cell attributes.
Significance of saturation time on cell morphology and its attributes
Significance of saturation time on cell morphology and its attributes has studied by varying saturation time from 3 h to 24 h. The other process parameters kept constant such as saturation pressure as 40 bar, nozzle temperature as 200°C, feed rate as 100% and 01 h desorption time. Figure 5 depicts the Influence of saturation time on the percentage of weight gain and expansion ratio. The increase in saturation time leads to an increase in the percentage of weight gain for both after immediate depressurization and after 01 h desorption. The percentage of weight gain after immediate depressurization has varied from 7% to 9.65% corresponding to 3 h to 24 h, respectively. Similarly, it has varied from 4.15% to 6.10% for after 01 h desorption corresponding to 3 h to 24 h, respectively. But the difference in the percentage of weight gain for 3 h saturation time to 6 h saturation time is significant. Whereas, for 12 h saturation time to 24 h saturation time the difference in the percentage of weight gain is trivial. The expansion ratio of extruded 3D printing filament has increased from 3 h saturation time to 6 h saturation time. Whereas, from 6 h saturation time to 12 h and 24 h saturation time expansion ratio was decreased. However, the difference in expansion ratio between the 12 h and 24 h saturation time is slight.
Influence of saturation time on percentage of weight gain and expansion ratio.
Figure 6 shows the effect of saturation time on cell morphologies at different magnifications for better comprehension. At 3 h saturation time the sorption of physical blowing agent was insufficient. The SEM micrograph of 3 h saturation time at 80× is evident that the core of the sample has observed as un-foamed compare to remaining saturation conditions. Further, the increase in saturation time results in a decrease in average cell size and an increase in cell density. Figure 7 shows the effect of saturation time on cell attributes such as average cell size and average cell density. The average cell size has varied from 2.99 µm to 1.91 µm and the average cell density has varied from 2.1 × 10⁸ cells/cm3 to 4.4 × 10⁸ cells/cm3 for corresponding saturation time ranging from 3 h to 24 h, respectively.
Effect of saturation time on cell morphologies. (a) Saturation time t1 = 3 h, 80×, (b) saturation time t1 = 3 h, 500×, (c) saturation time t1 = 6 h, 80×, (d) saturation time t1 = 6 h, 500×, (e) saturation time t1 = 12 h, 80×, (f) saturation time t1 = 12 h, 500×, (g) saturation time t1 = 24 h, 80×, (h) saturation time t1 = 24 h, 500×.
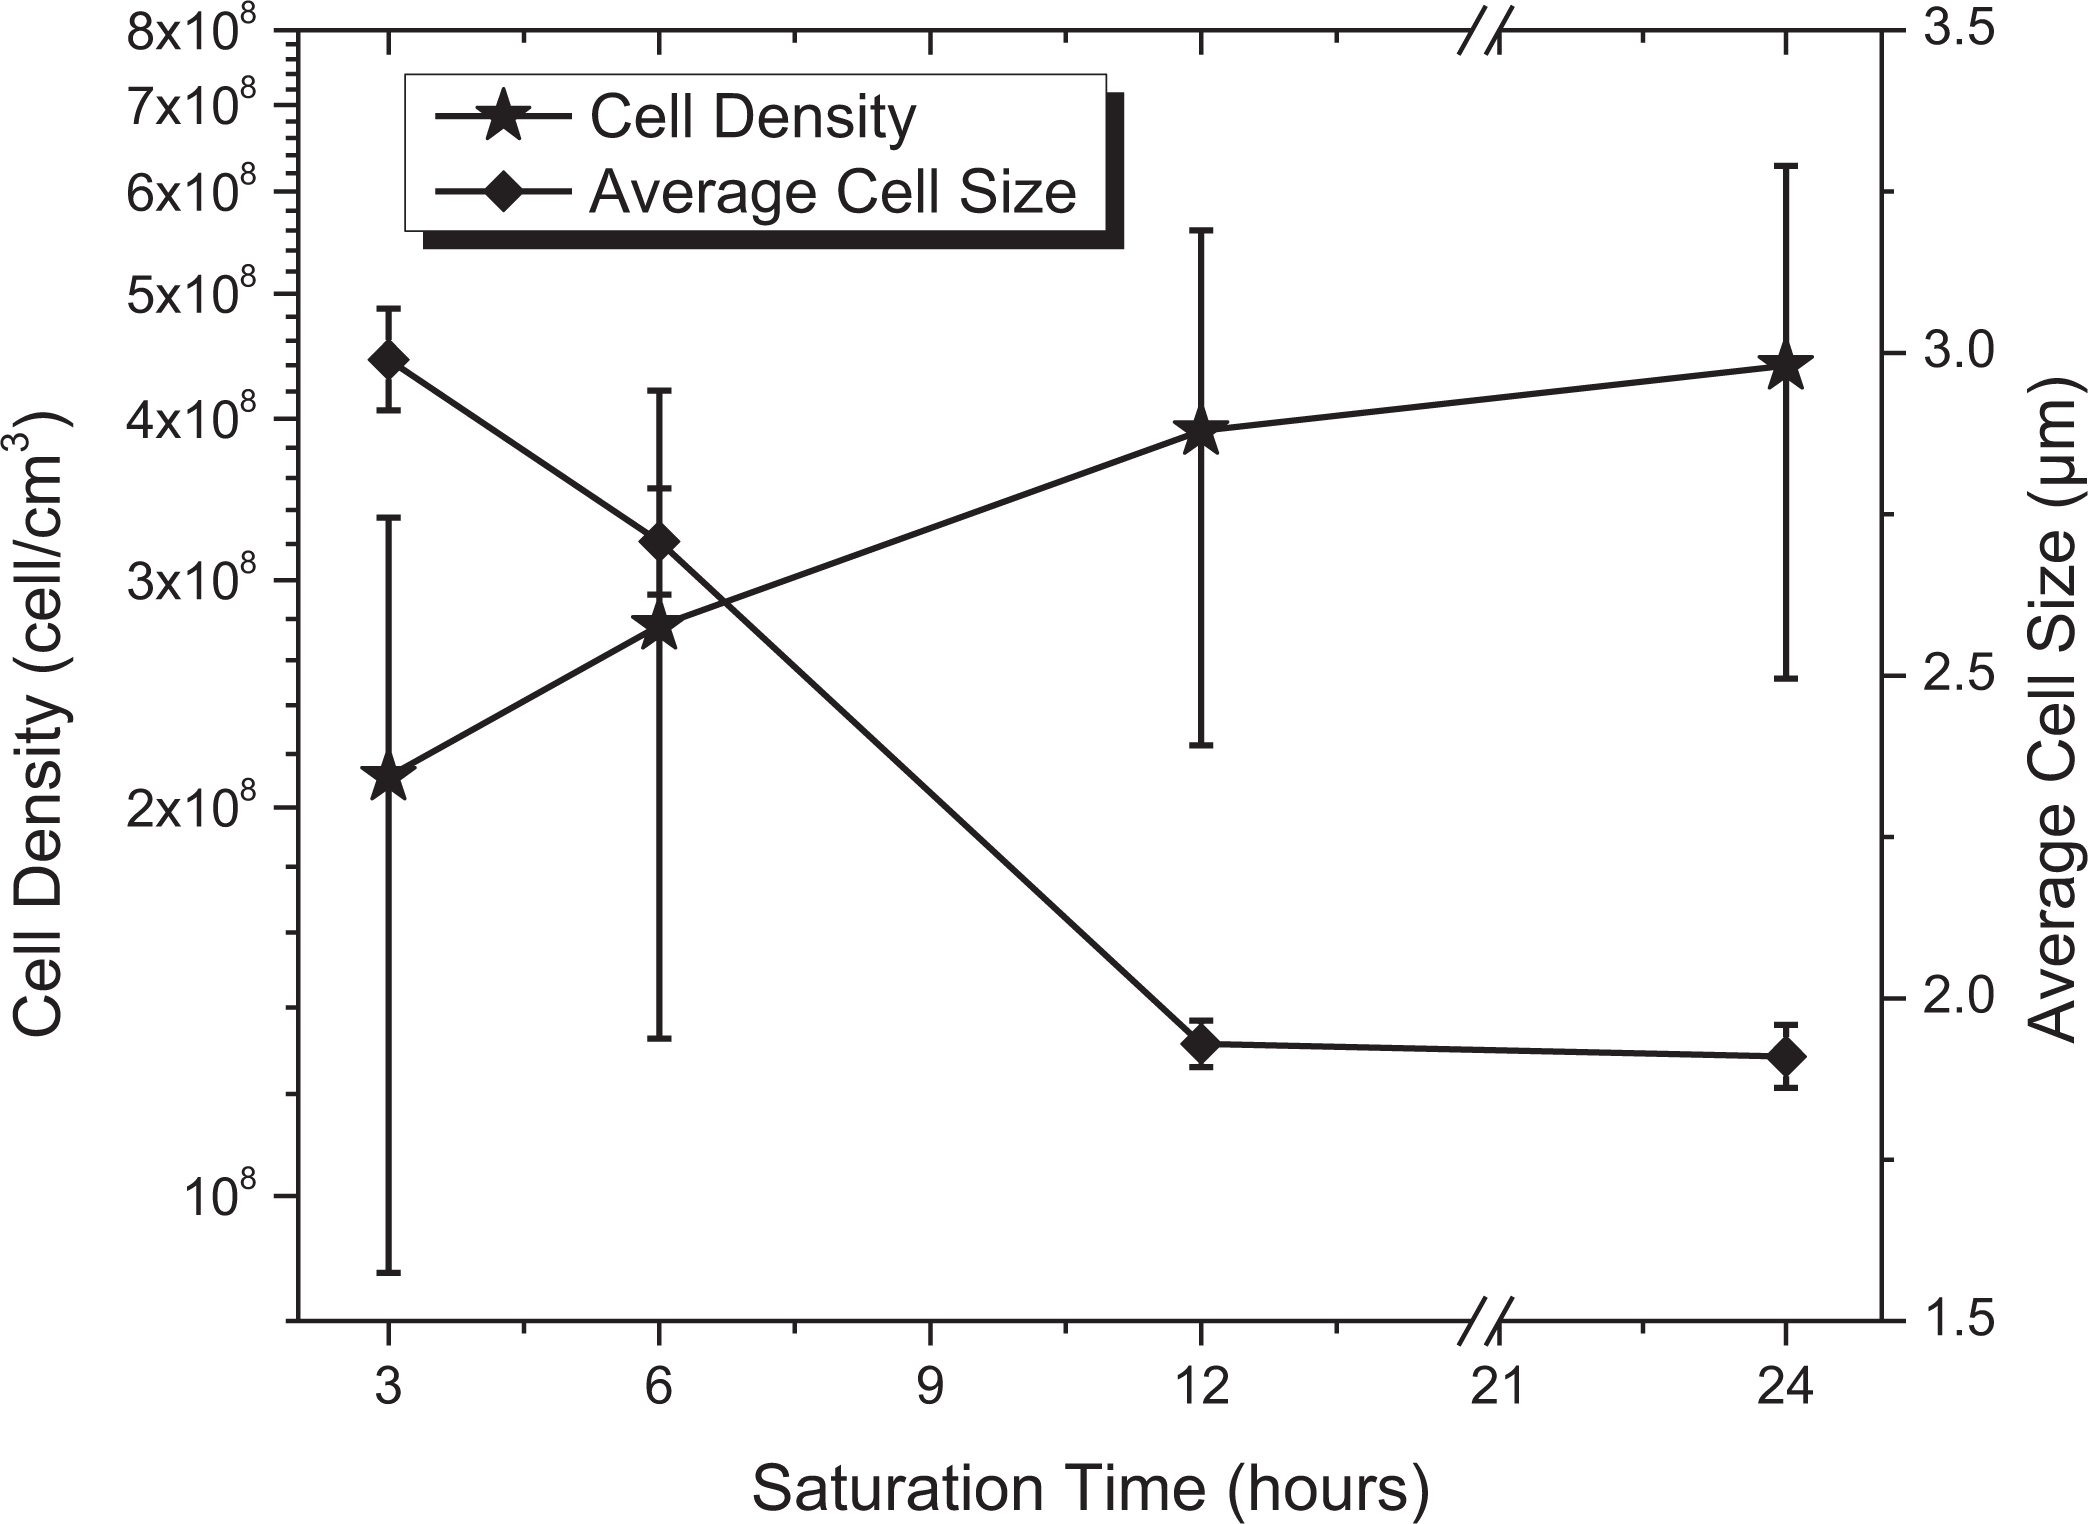
Effect of saturation time on cell attributes.
Significance of nozzle temperature on cell morphology and its attributes
To study the significance of nozzle temperature on cell morphology and other attributes, the nozzle temperature was varied from 180°C to 240°C. The other process parameters were kept constant which includes saturation pressure at 40 bars, saturation time at 24 h, feed rate at 100% and 01 h desorption time. Figure 8 shows the Influence of change of nozzle temperatures on the foam expansion ratio and the percentage of weight gain at different conditions. The average percentage of weight gain after immediate depressurization was noticed as approximately 10.34%. Similarly, it has been noticed for after 01 h desorption time the percentage of weight as approximately 5.96%. The expansion ratio of extruded 3D printing filament was found to decrease with increase in nozzle temperature. The expansion ratio was found to vary from 3.90 to 1.40 corresponding to the nozzle temperatures 180°C to 240°C. The difference in the expansion ratios among the nozzle temperatures except 180°C observed was trivial. Whereas, the expansion ratio at nozzle temperature of 180°C was to be found more than double of the expansion ratio observed with nozzle temperature ranging from 200°C to 240°C.
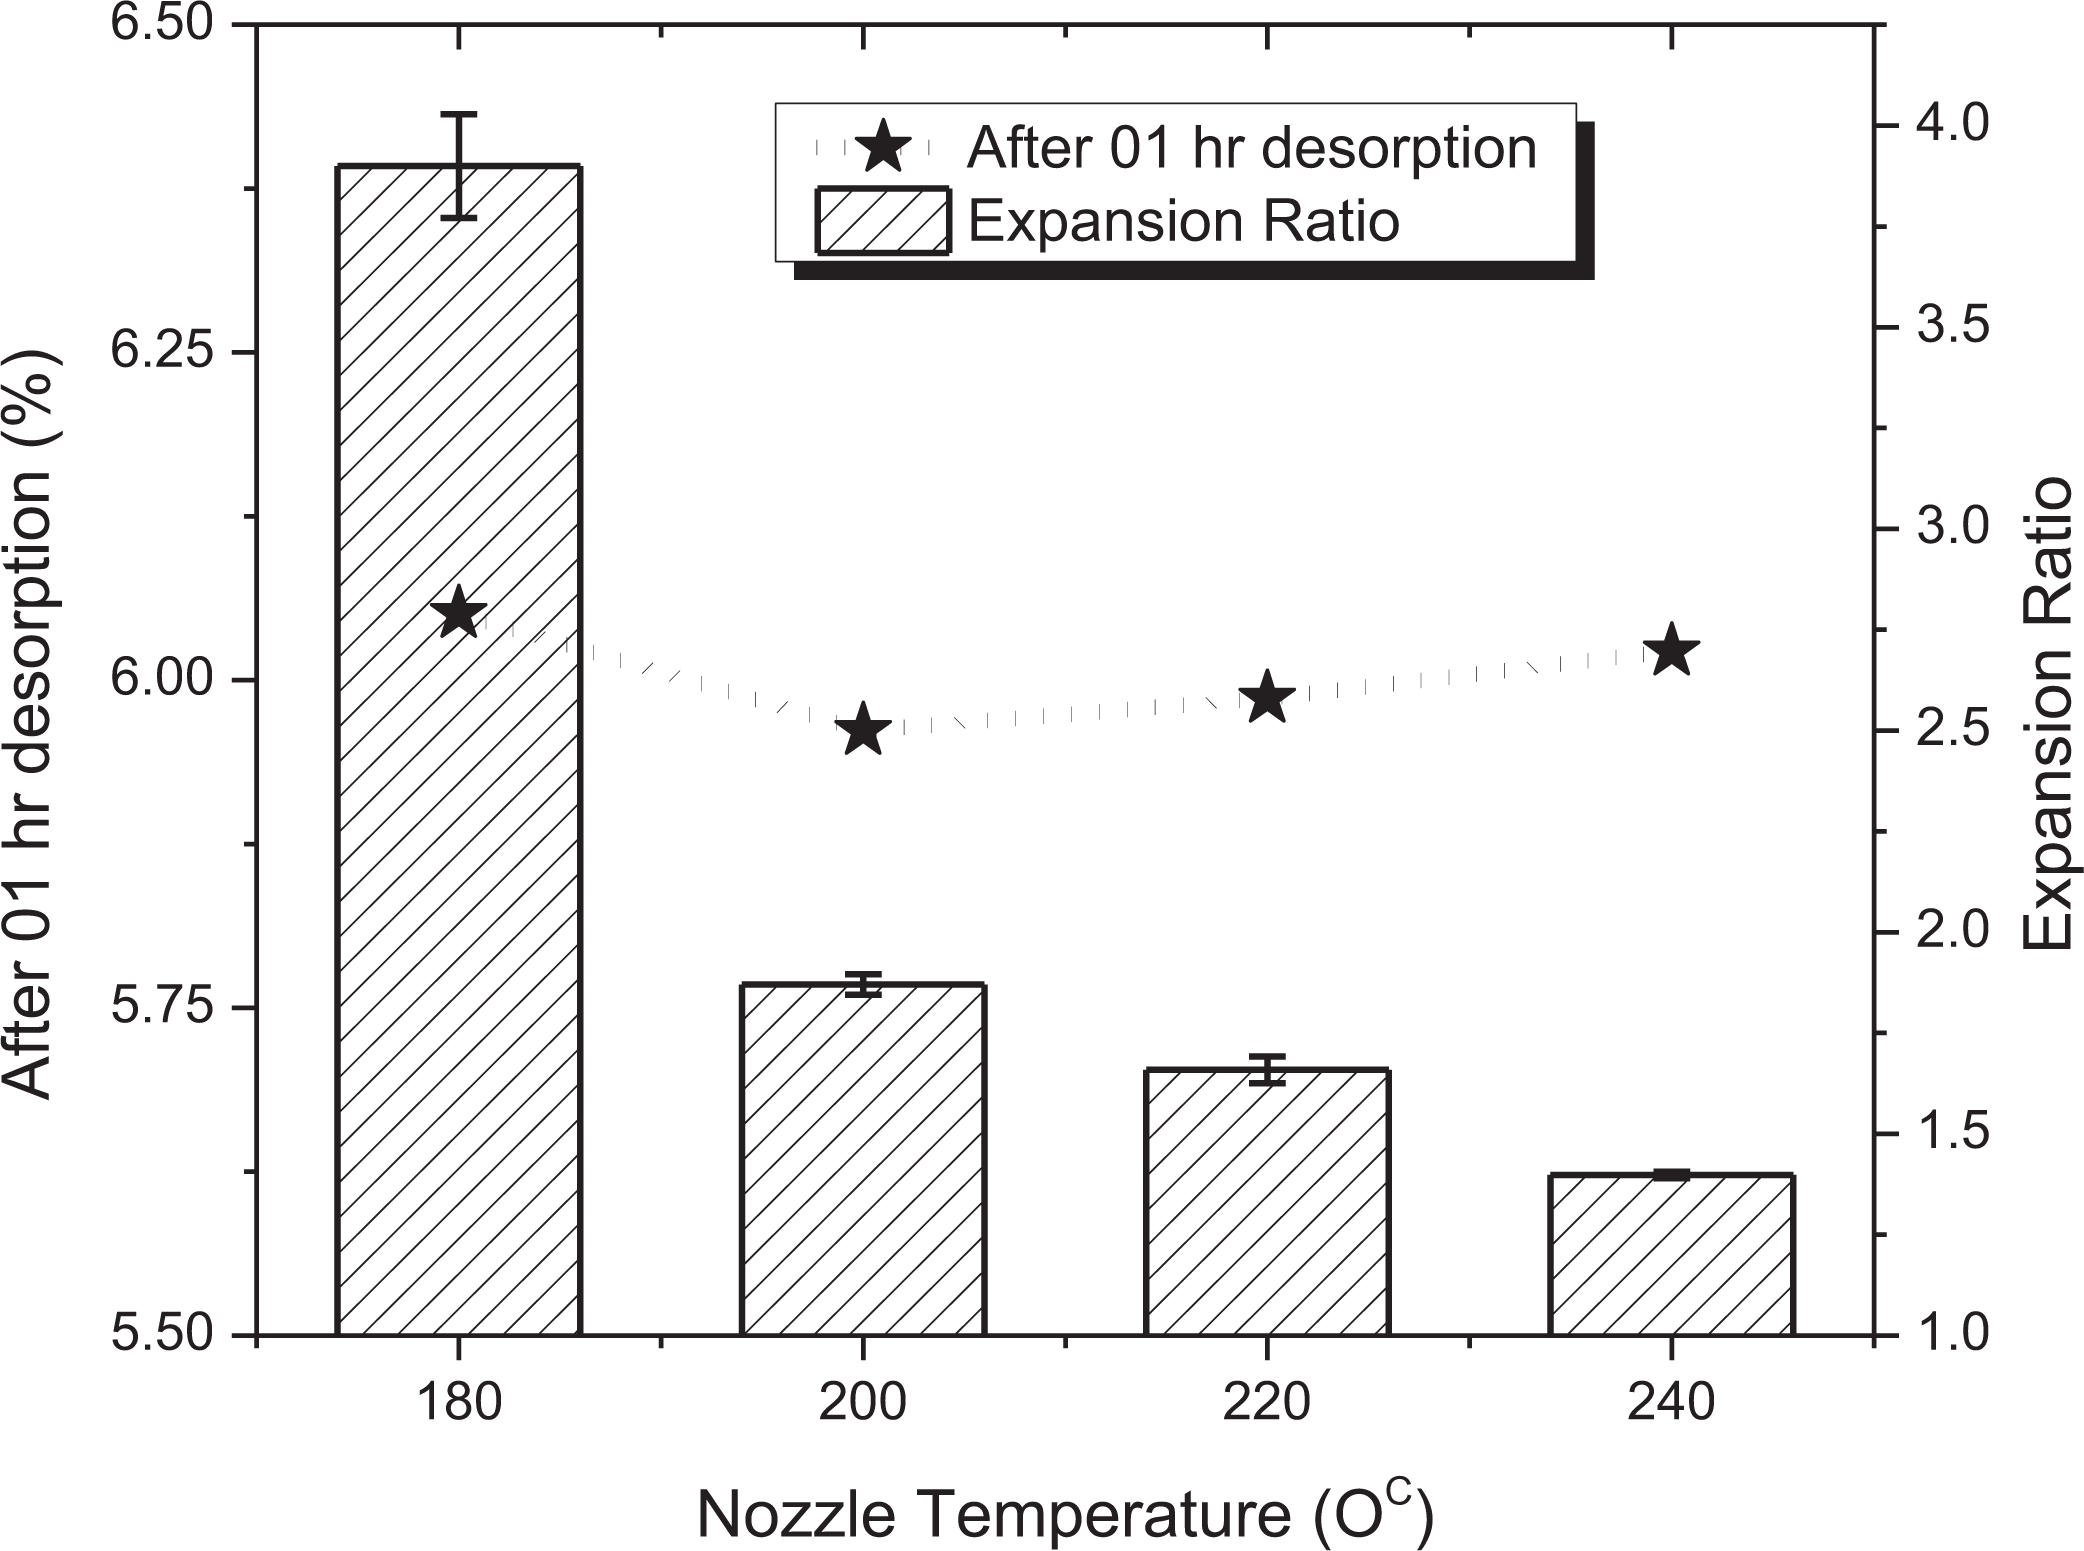
Influence of nozzle temperature on expansion ratio/percentage of weight gain after 01 h desorption.
The significance of nozzle temperatures on microstructure were studied through SEM micrographs was shown in Figure 9 at different magnifications. The increase in nozzle temperature from 180°C to 220°C exhibited a decrease in cell size, whereas, cell size was slightly increased at 240°C. At nozzle temperature of 240°C the cell collapse and contraction phenomena resulted in an increase in cell size. Similarly, the cell density was found to increase with an increase in nozzle temperature from 180°C to 220°C, whereas at 240°C, the cell density was found to drastically decrease. Figure 10 shows the effect of nozzle temperature on cellular attributes such as the average cell size and average cell density. The average cell size was found to vary 6.87 µm to 2.30 µm and the average cell density has varied from 4.28 × 10⁸ cells/cm3 to 1.61 × 10⁹ cells/cm3 for the corresponding nozzle temperature from 180°C to 240°C.
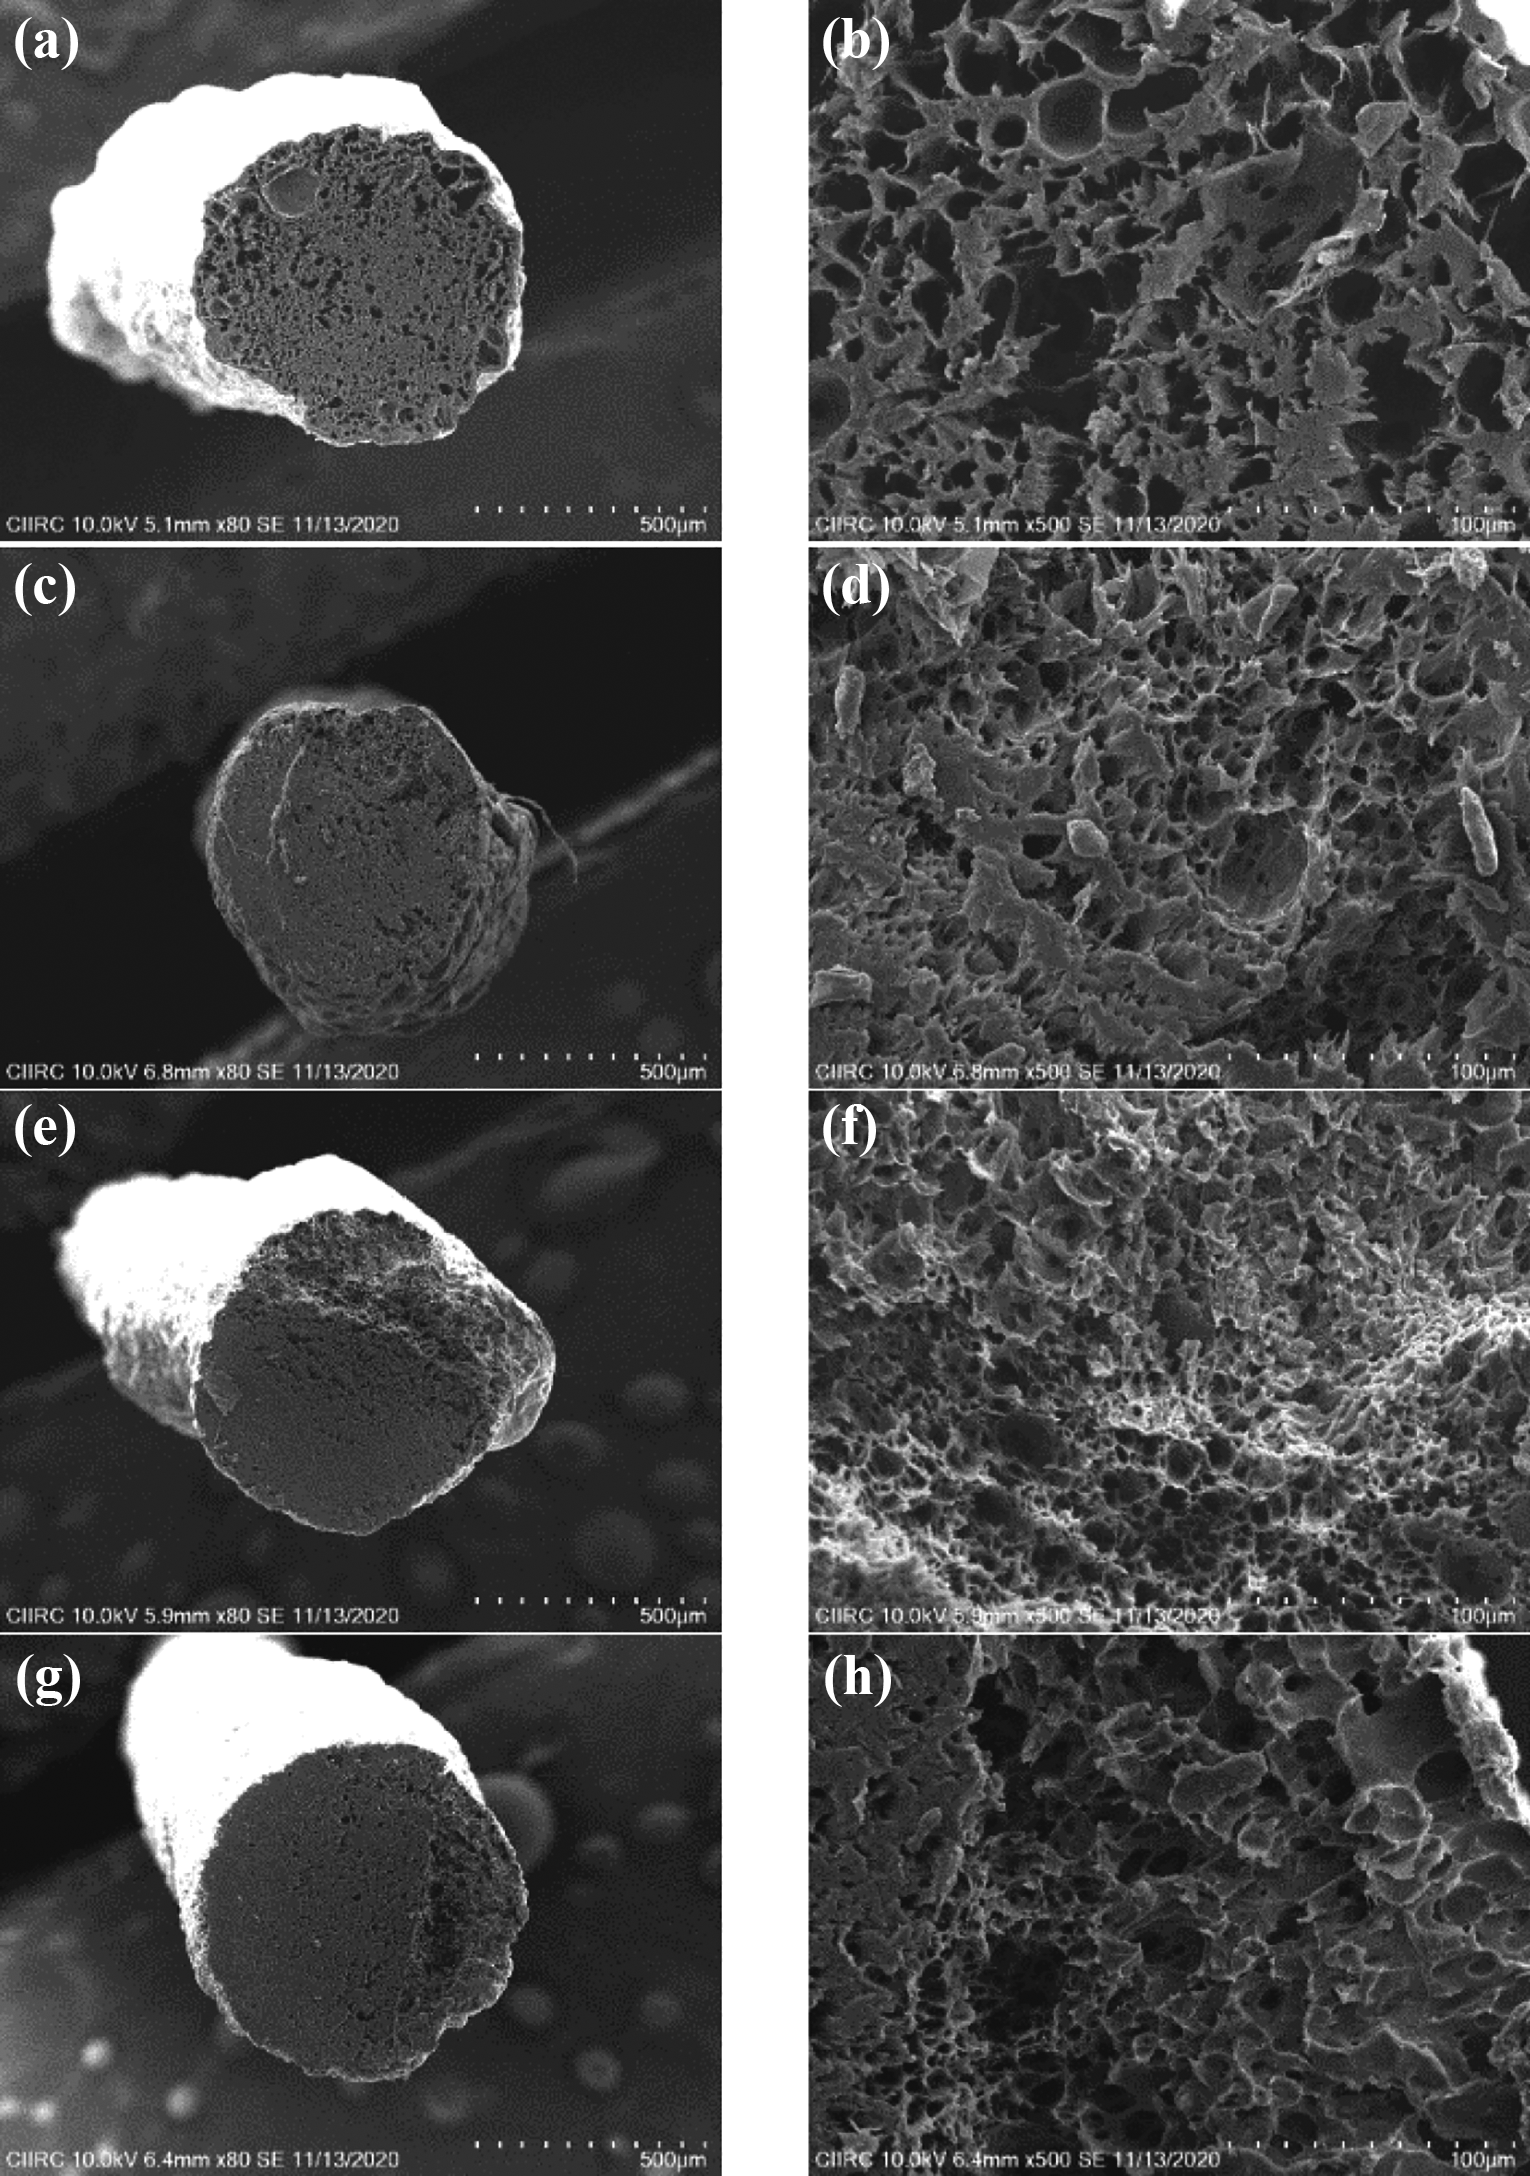
Effect of nozzle temperature on cell morphologies. (a) Nozzle temperature 180°C, 80×, (b) nozzle temperature 180°C, 500×, (c) nozzle temperature 200°C, 80×, (d) nozzle temperature 200°C, 500×, (e) nozzle temperature 220°C, 80×, (f) nozzle temperature 220°C, 500×, (g) nozzle temperature 240°C, 80×, (h) nozzle temperature 240°C, 500×.
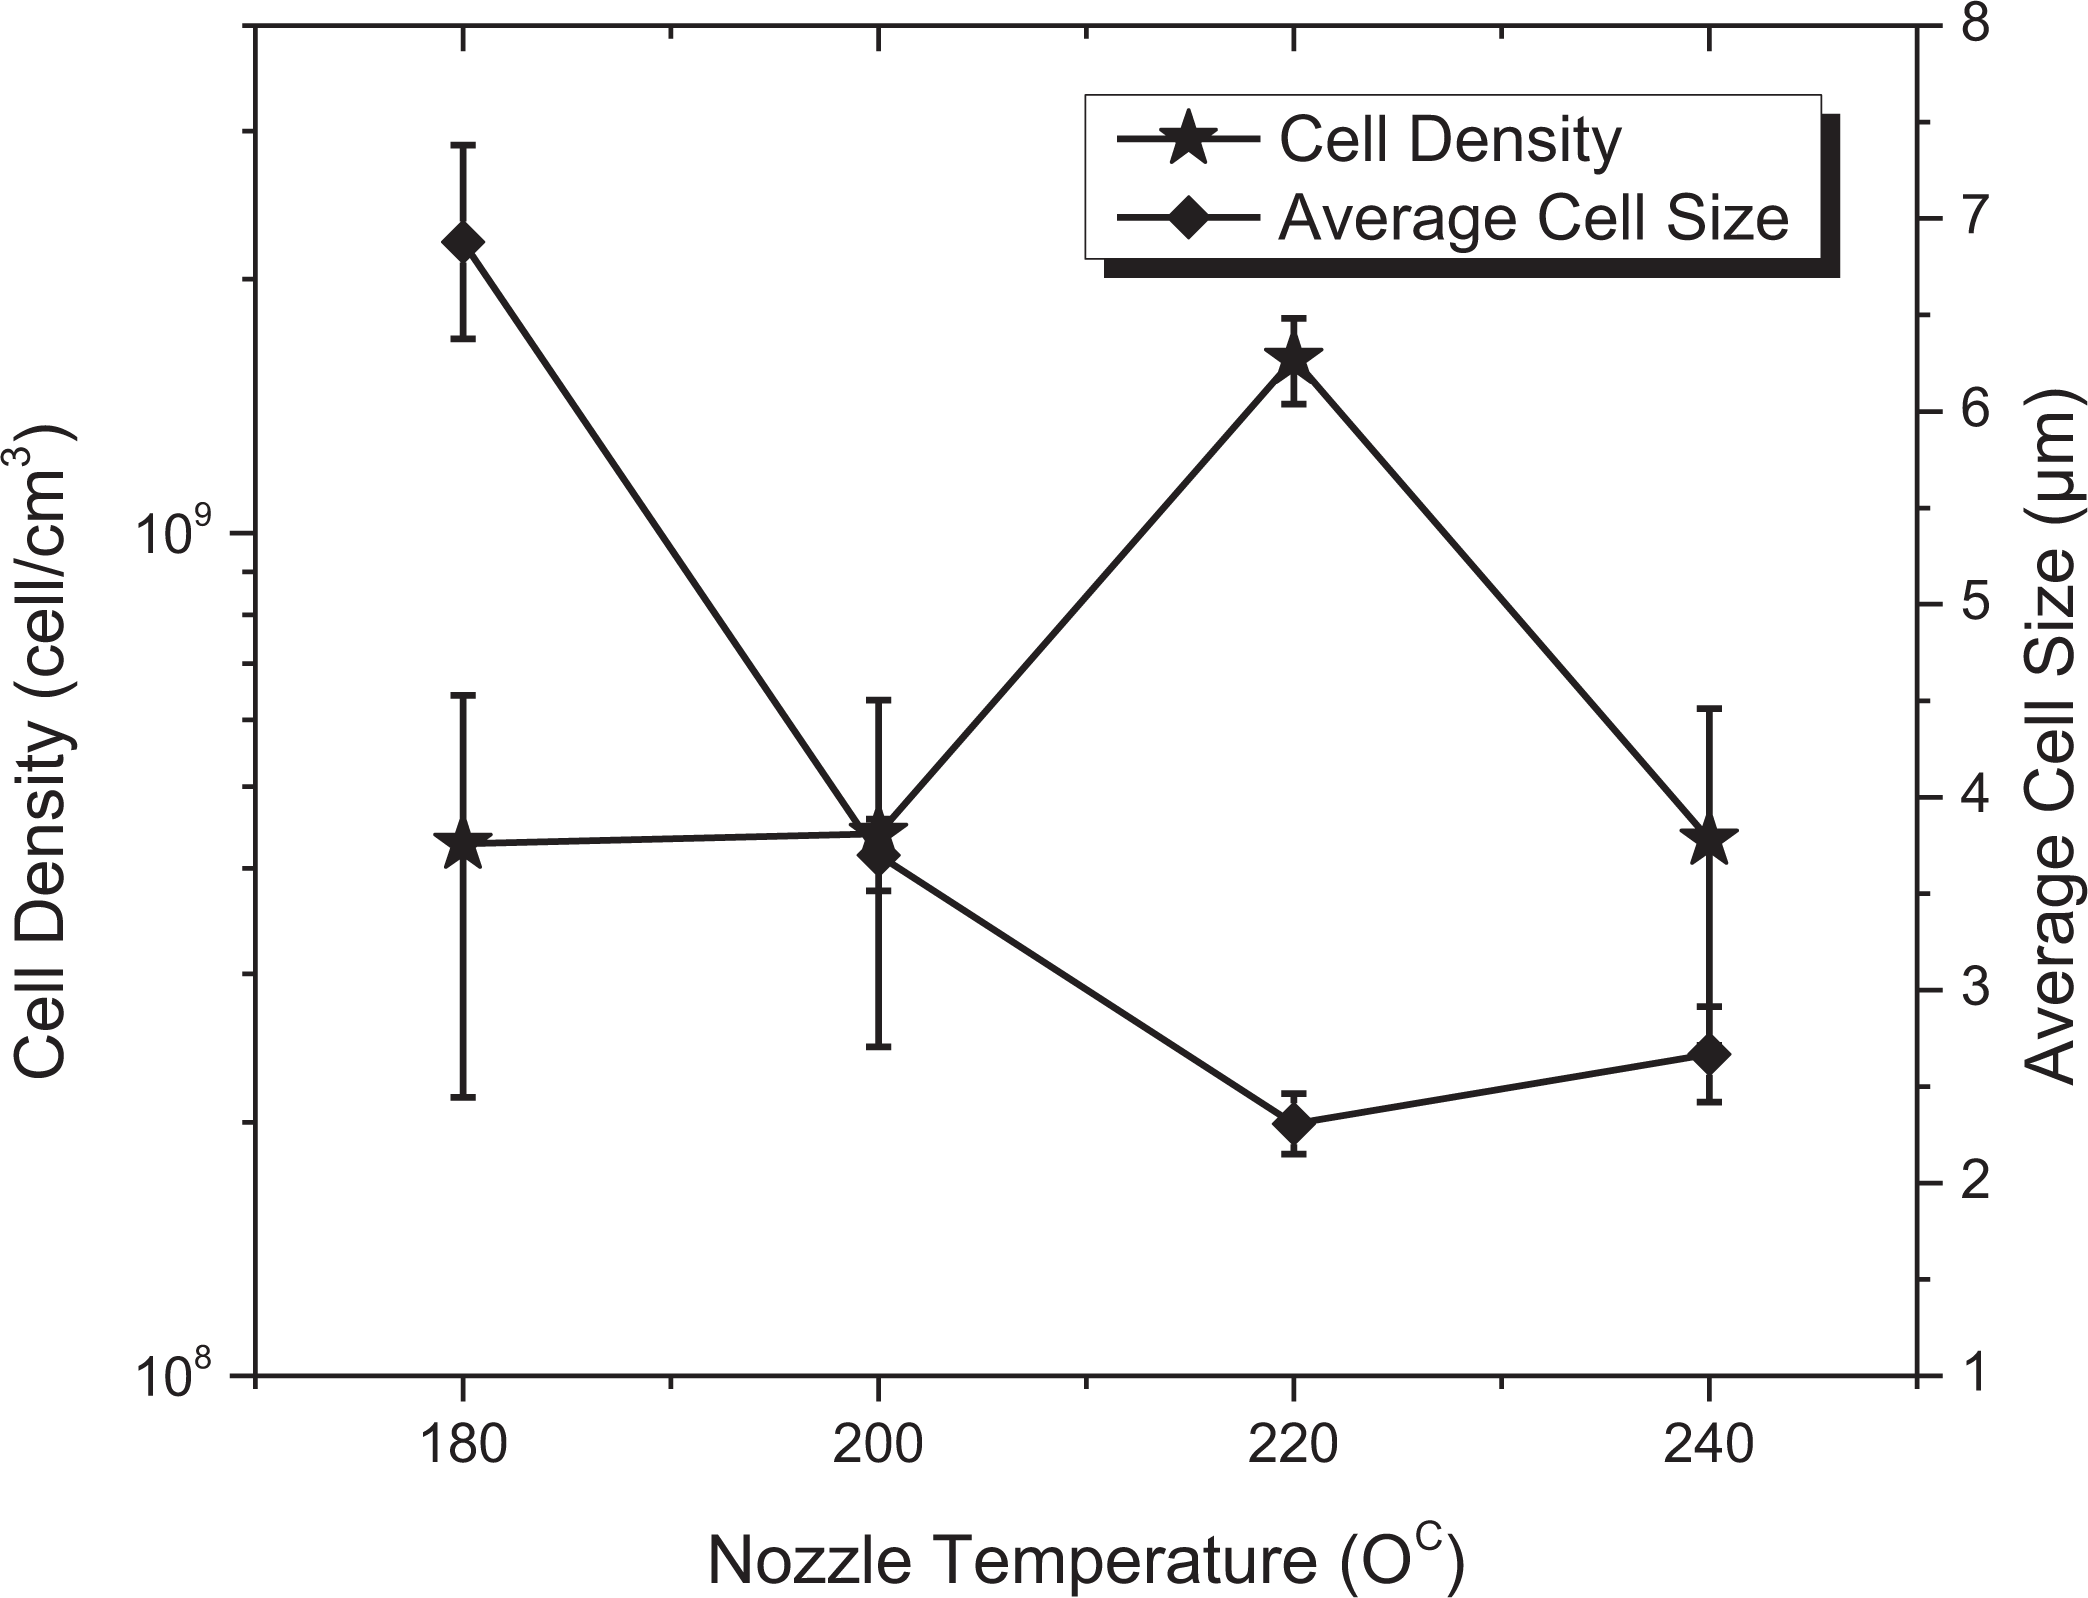
Effect of nozzle temperature on cell attributes.
Significance of feed rate on cell morphology and its attributes
Significance of feed rate on cell morphology and its attributes has been studied by varying feed rate from 50% to 200%. The other process parameters were kept which includes saturation pressure at 40 bars, saturation time at 24 h, nozzle temperature at 200°C and 01 h desorption time. Figure 11 shows the Influence of feed rates on the expansion ratio, along with the percentage of weight gain of polymer matrix at different condition. The average percentage of weight gain after immediate depressurization has been found to be approximately 10.11%. Similarly, it has been noticed after 01 h the desorption time the percentage of weight gained of CO2 in the polymer matrix was approximately 5.99%. The expansion ratio of extruded 3D printing filament was found to increase with respect to an increase in feed rate. The increase in expansion ratio was found to negligible corresponding to feed rate 50–200%.
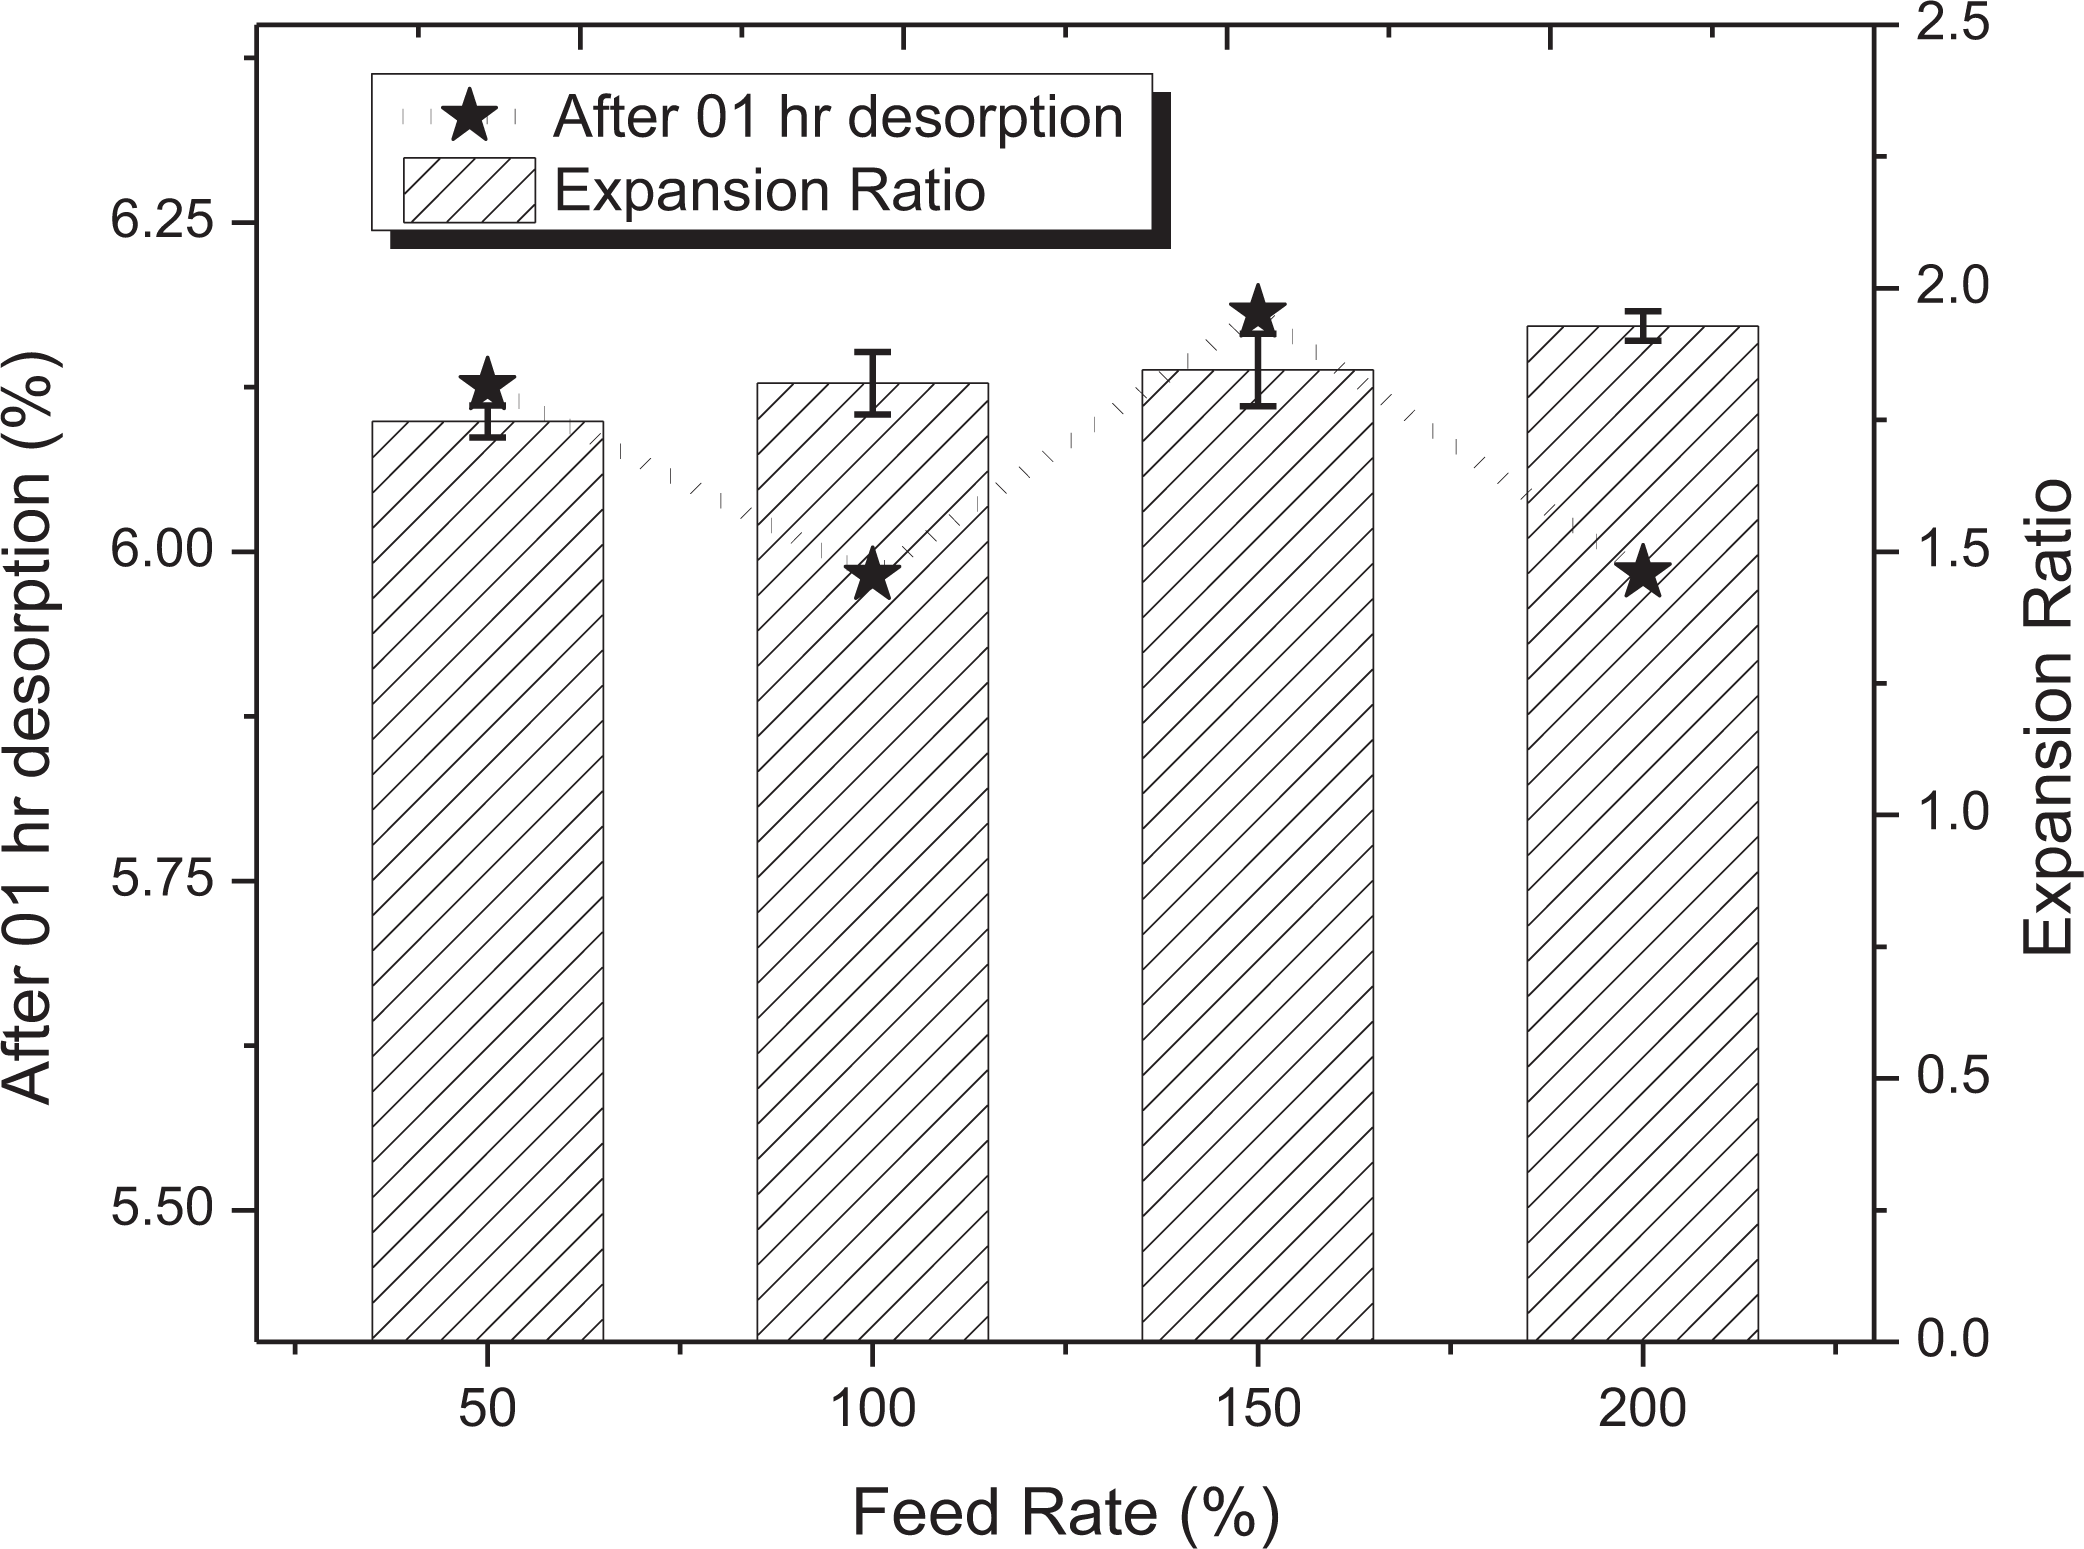
Influence of feed rate on expansion ratio/percentage of weight gain.
The significance of feed rate on microstructure were studied through SEM micrographs as shown in Figure 12 at different magnifications. The increase in feed rate results in a decrease in cell size corresponding to the feed rate 50–150%, however at 200% federate, the cell size was observed to increase. Similarly, the cell density was found to increase with an increase in the feed rate from 50% to 150%, whereas at 200% feed rate the cell density was found to decrease. Figure 13 shows the effect of feed rate on cellular attributes including the average cell size and average cell density. The average cell size was found to vary 4.17 µm to 2.62 µm and the average cell density was found to vary 1.66 × 10⁸ cells/cm3 to 2.11 × 10⁸ cells/cm3 for corresponding feed rate ranging from 50% to 200%.
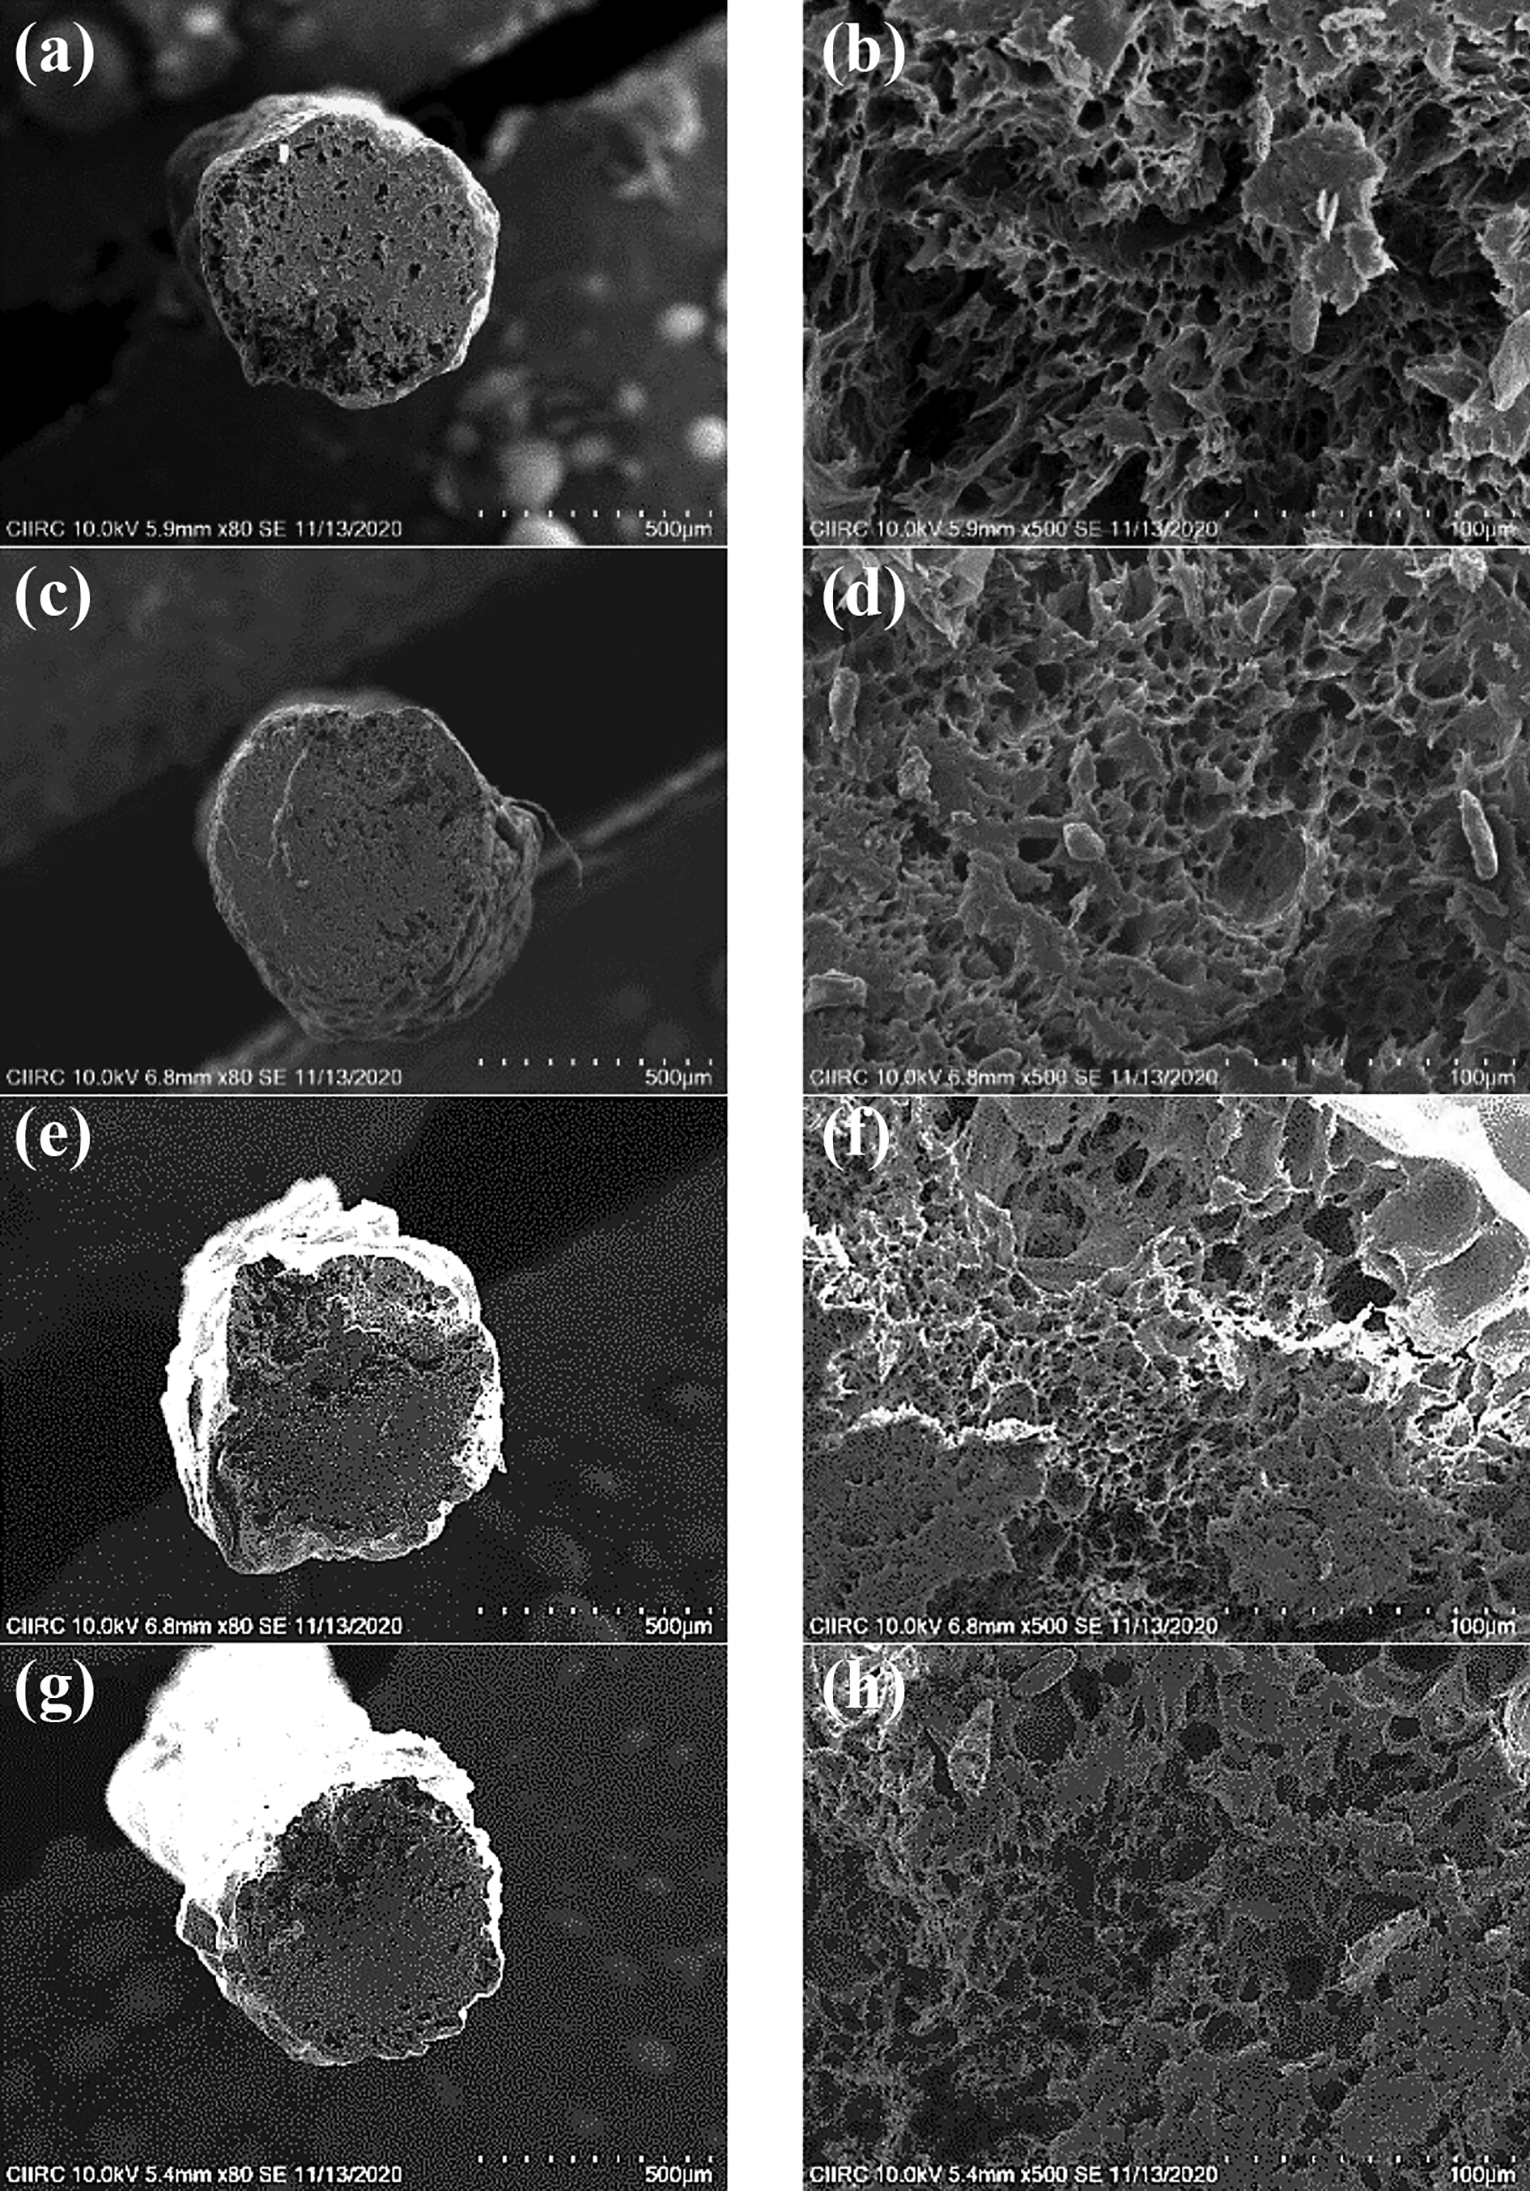
Effect of feed rate on cell morphologies. (a) Feed rate 50%, 80×, (b) feed rate 50%, 500×, (c) feed rate 100%, 80×, (d) feed rate 100%, 500×, (e) feed rate 150%, 80×, (f) feed rate 150%, 500×, (g) feed rate 200%, 80×, (h) feed rate 200%, 500×.
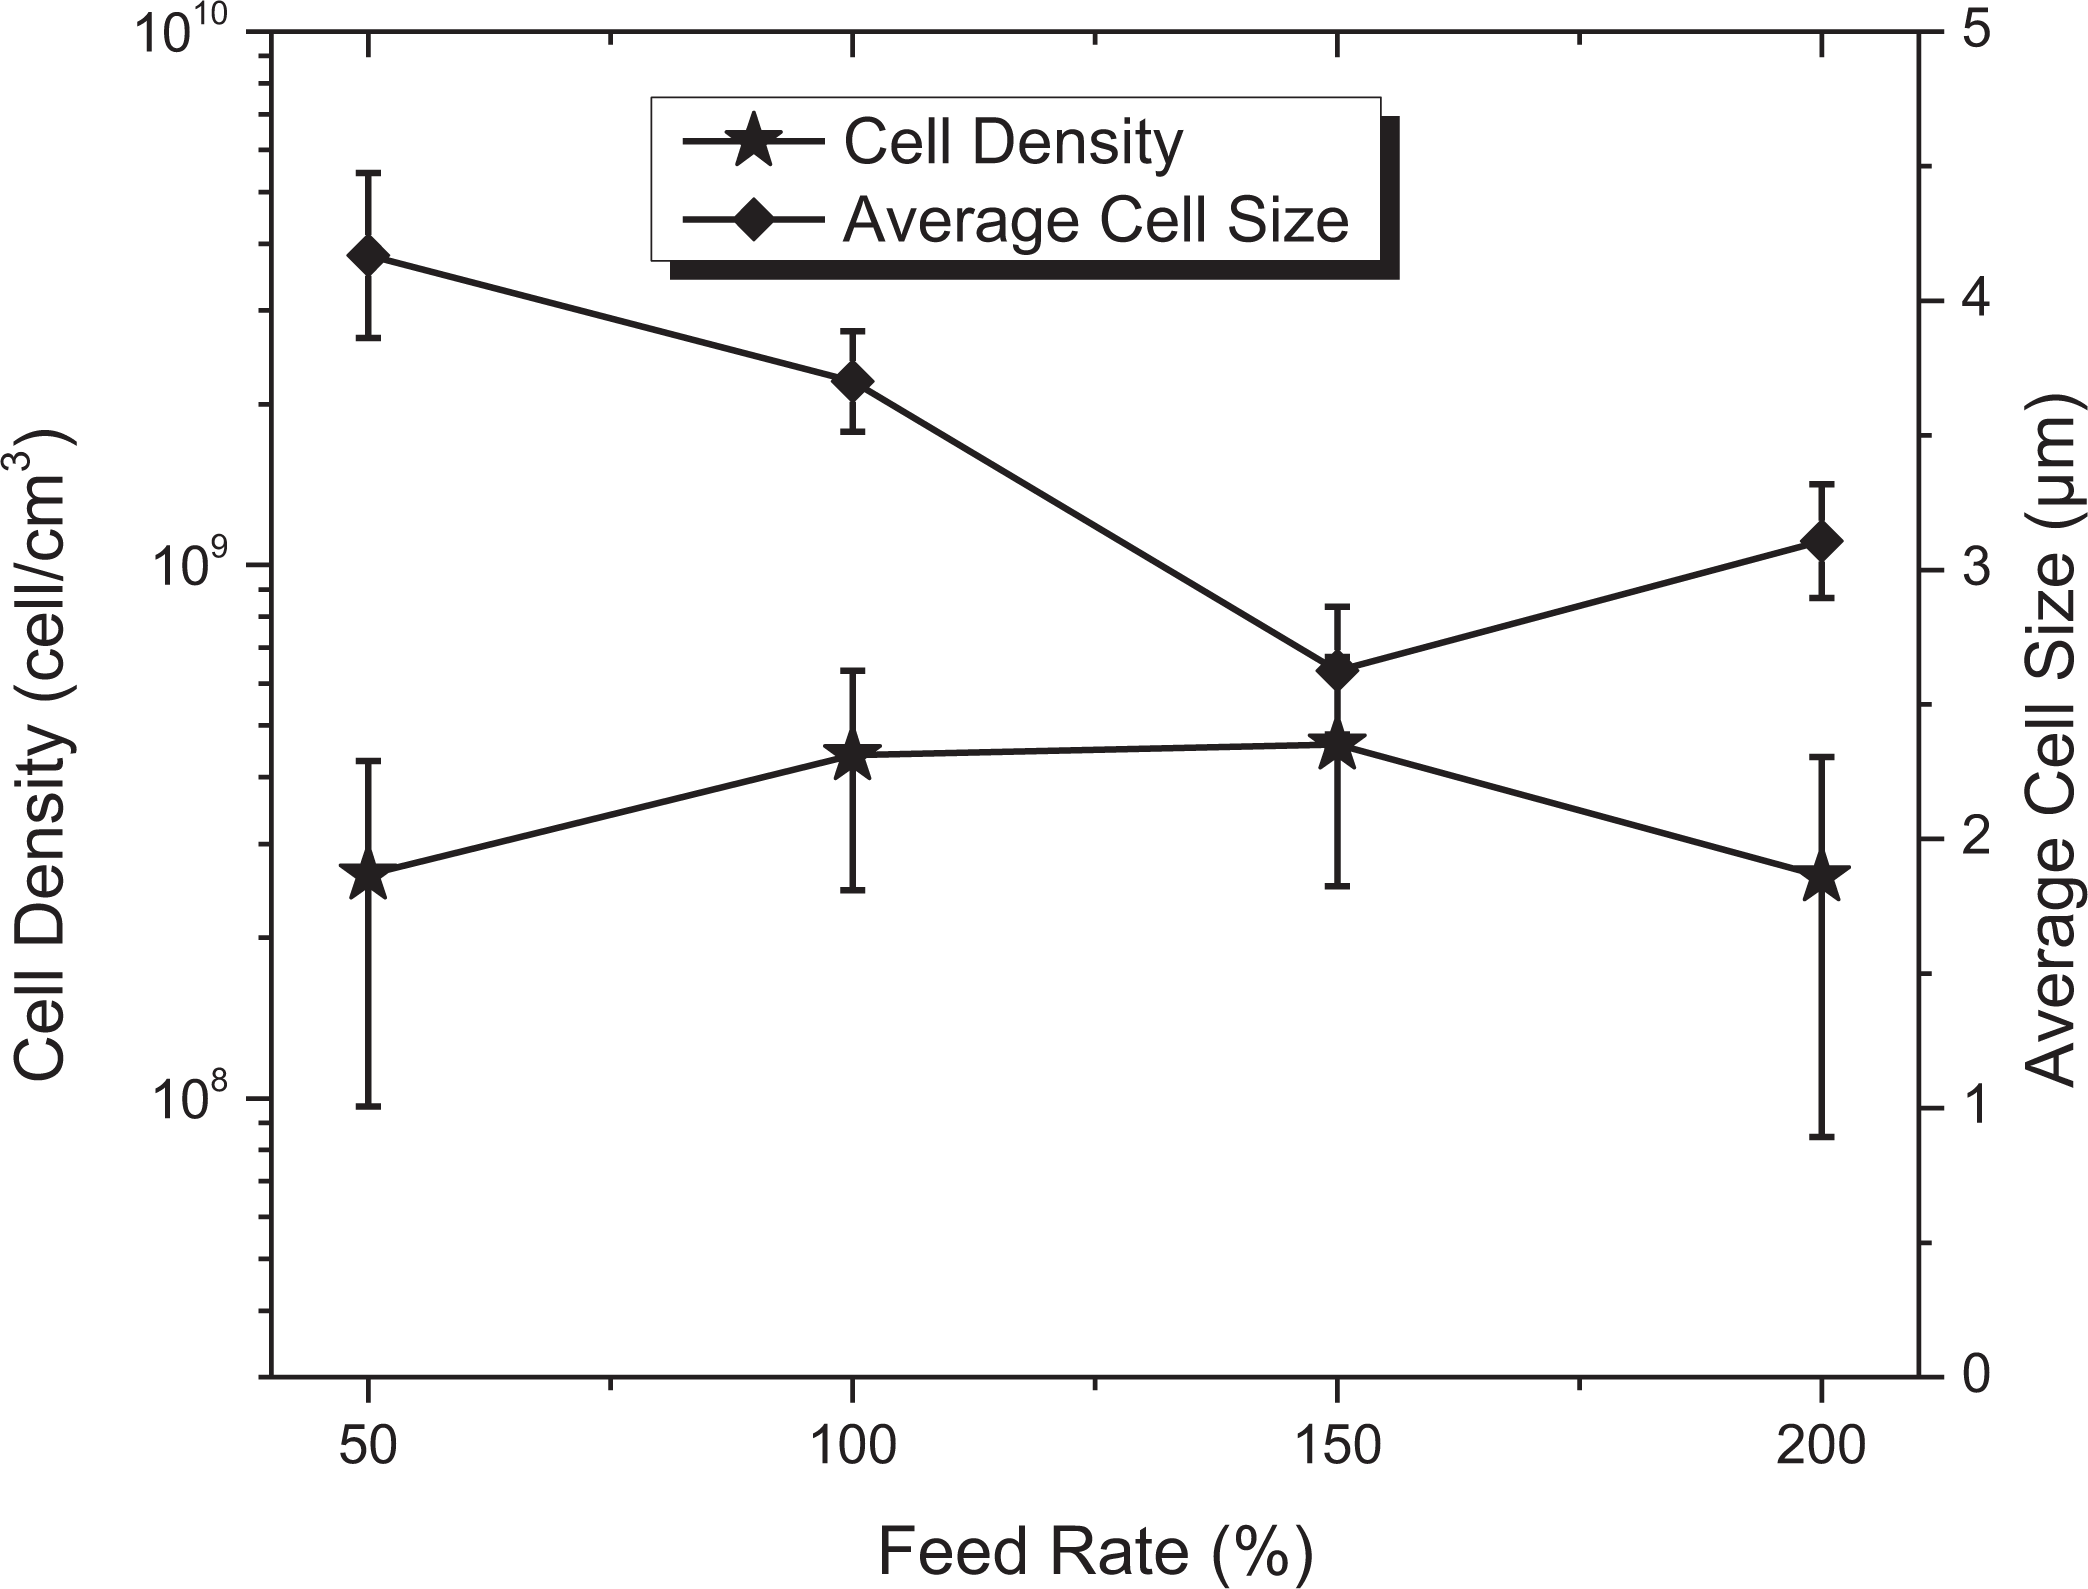
Effect of feed rate on cell attributes.
Significance of desorption time on cell morphology and its attributes
Significance of desorption time on cell morphology and its attributes has been studied by varying desorption time from 0 h (after immediate depressurization) to 48 h. The other process parameters were kept constant such as the saturation pressure at 57.5 bars, saturation time at 24 h, nozzle temperature at 200°C. Figure 14 shows the Influence of desorption time on expansion ratio along with the percentage of gas remaining at different condition. The percentage of gas remaining at each condition was found to vary from 13.79% to 1.06% corresponding to its desorption time ranging from 0 h to 48 h. Further, the desorption of CO2 gas was observed as radical i.e. half of the absorbed gas has been desorbed within one hour and after that observed as slow and study. The expansion ratio of extruded 3D printing filament was found to increase with increase in the desorption time up to 8 h, but after 8 h desorption time, the expansion ratio was found to be decrease radically. The peak expansion ratio was observed as 4.88 at 8 h and the least expansion ratio has observed as 1.53 at 1 h.
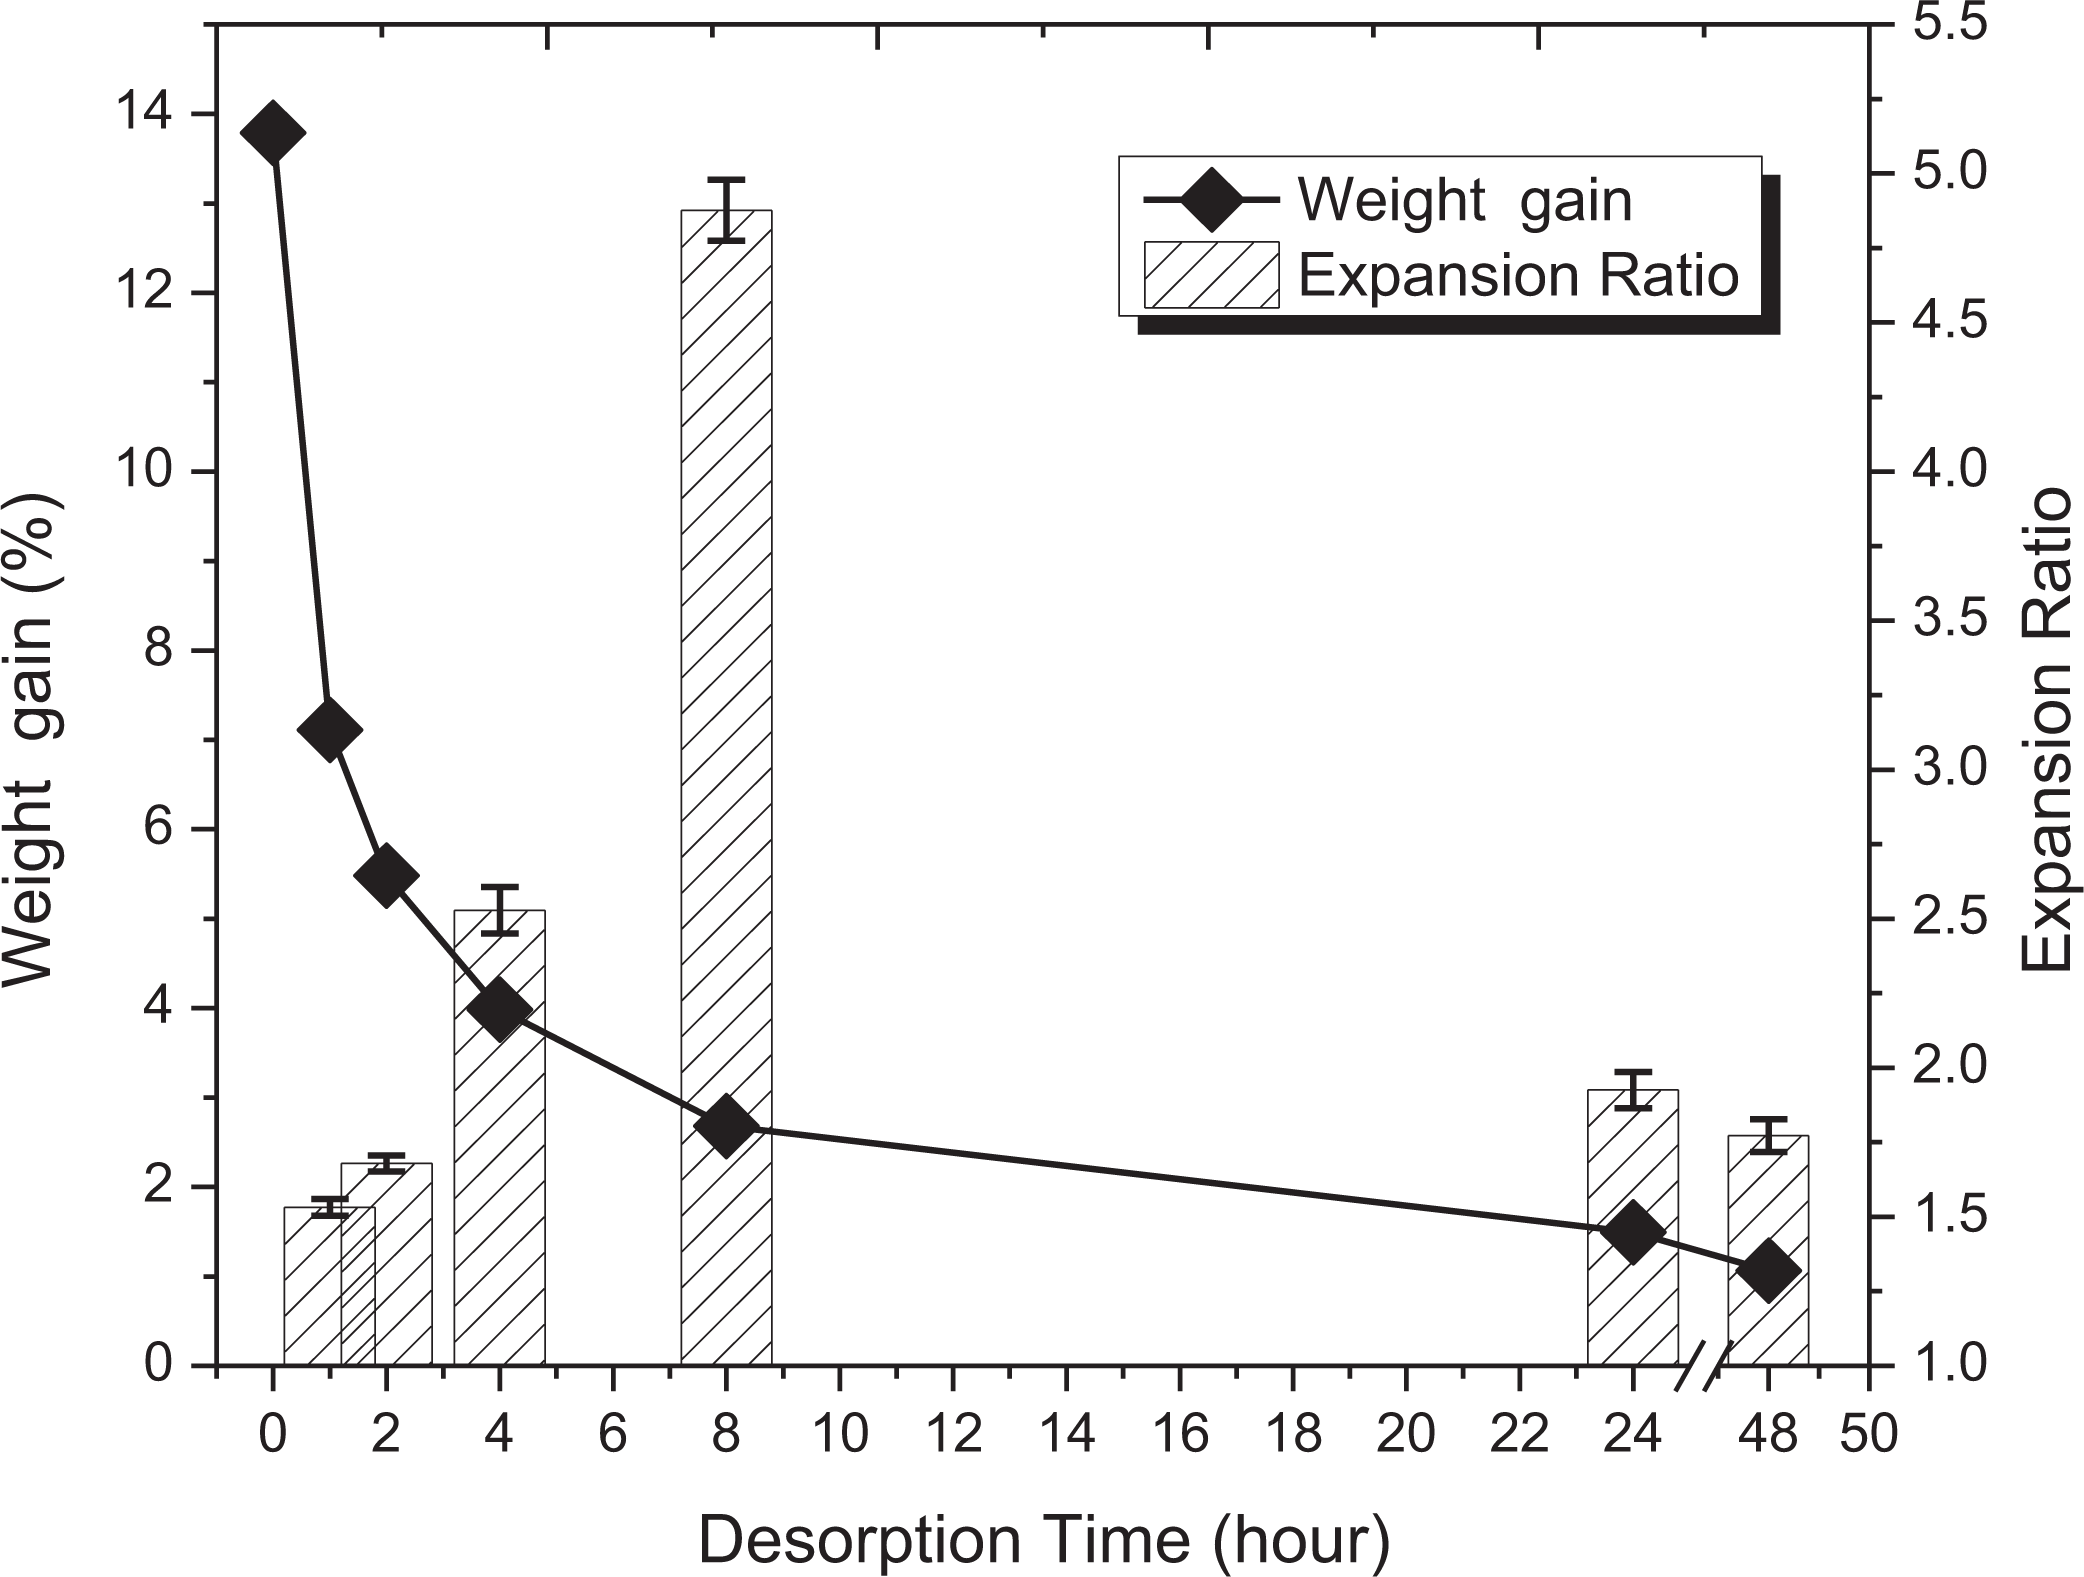
Influence of desorption time on expansion ratio/percentage of weight gain.
The significance of desorption time on the microstructure was studied through SEM micrographs as shown in Figure 15 at different magnifications. The un-foamed virgin polymer shows clearly there is no microcellular structure. Whereas, at 0 h desorption time also shows clearly there is no microcellular structure present in the SEM micrograph even though after saturation at elevated pressure. Since the saturated filament could not enter into the nozzle because of its plasticization (filament becomes soft) owing to the saturation process. Further, by comparing SEM micrograph of polymer sample with 0 h desorption time at 80× with SEM micrograph of the virgin polymer sample the shape deformation could be seen (oval shape). This has been obtained because of the plasticization of a sample. This is one of the prime reason for maintaining the desorption time 01 h during entire experimentation.
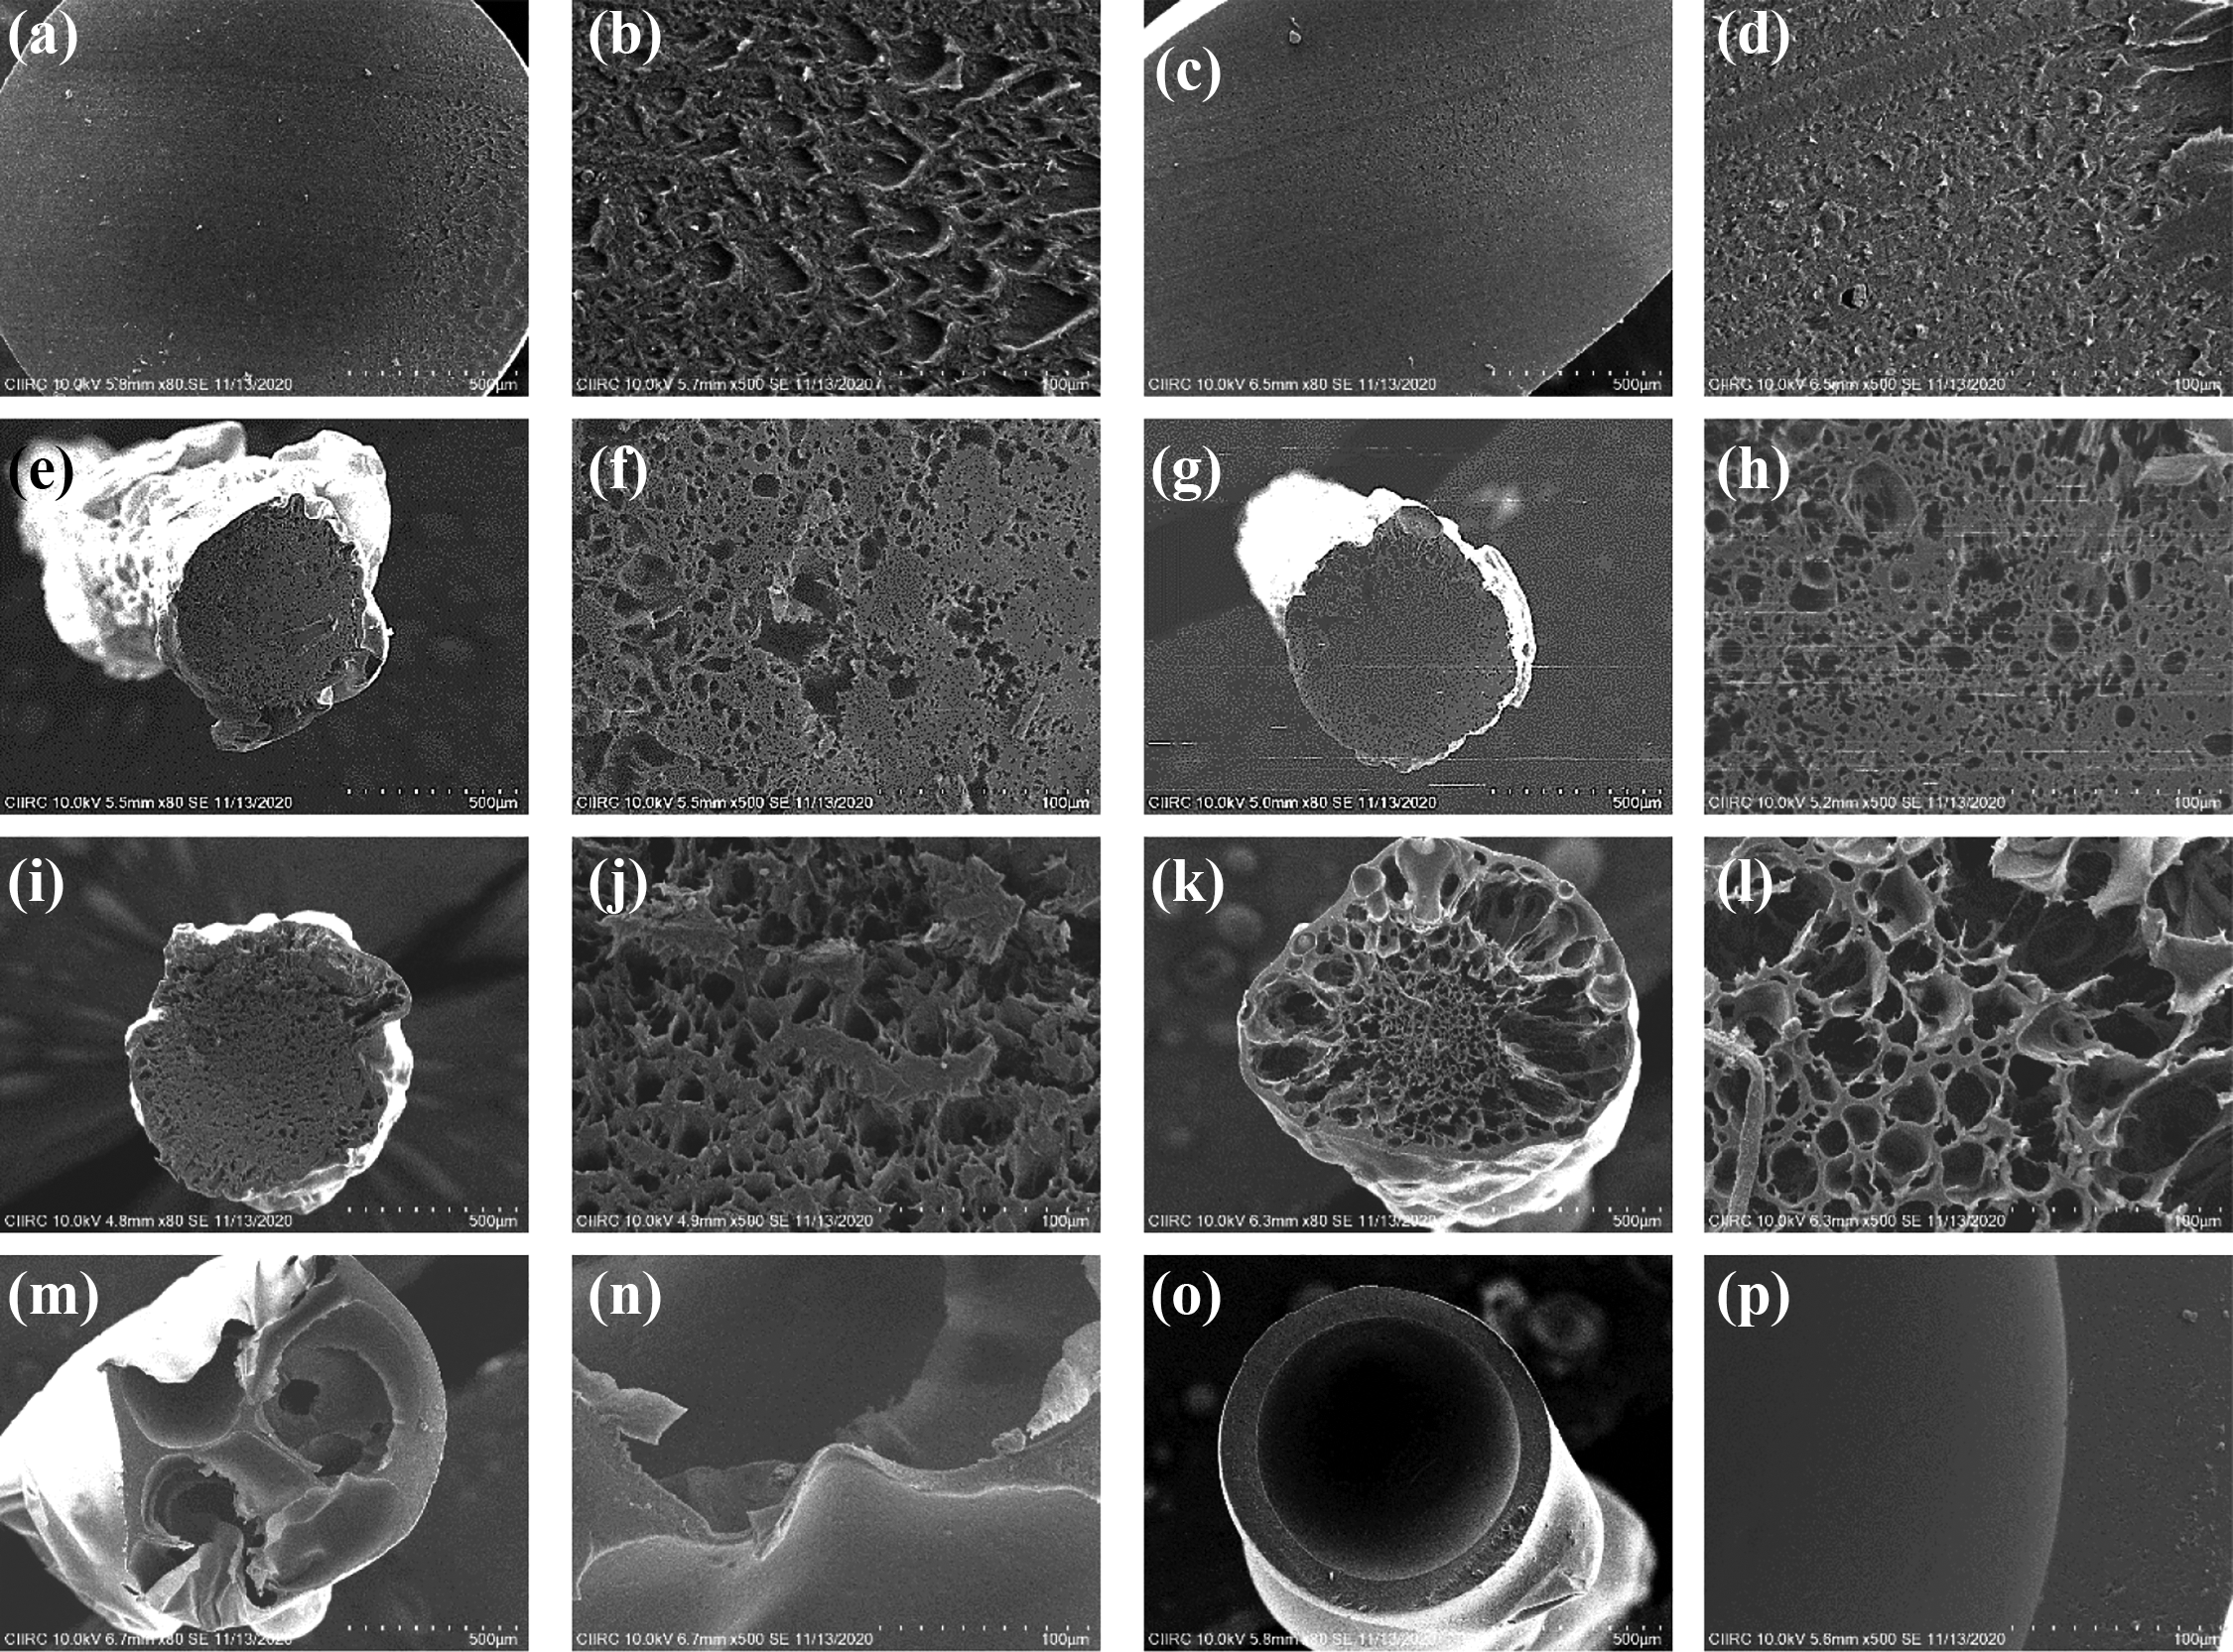
Effect of desorption time on cell morphologies. (a) Un-foamed virgin filament, 80×, (b) un-foamed virgin filament, 500×, (c) after immediate desorption, 80×, (d) after immediate desorption, 500×, (e) after 1 h desorption time, 80×, (f) after 1 h desorption time, 500×, (g) after 2 h desorption time, 80×, (h) after 2 h desorption time, 500×, (i) after 4 h desorption time, 80×, (j) after 4 h desorption time, 500×, (k) after 8 h desorption time, 80×, (l) after 8 h desorption time, 500×, (m) after 24 h desorption time, 80×, (n) after 24 h desorption time, 500×, (o) after 48 h desorption time, 80×, (p) after 48 h desorption time, 500×.
The increase in desorption time results in increase of average cell and decrease in average cell density. Figure 16 shows the effect of desorption time on cellular attributes including average cell size and average cell density. In the entire experimentation, large average cell size and least average cell density were noticed at 48 h desorption time. The average cell size was found to vary from 2.99 µm to 276.62 µm and the average cell density was found to vary from 3.58 × 10⁹ cells/cm3 to 4.70 × 10⁴ cells/cm3 for corresponding desorption time ranging from 1 h to 48 h.
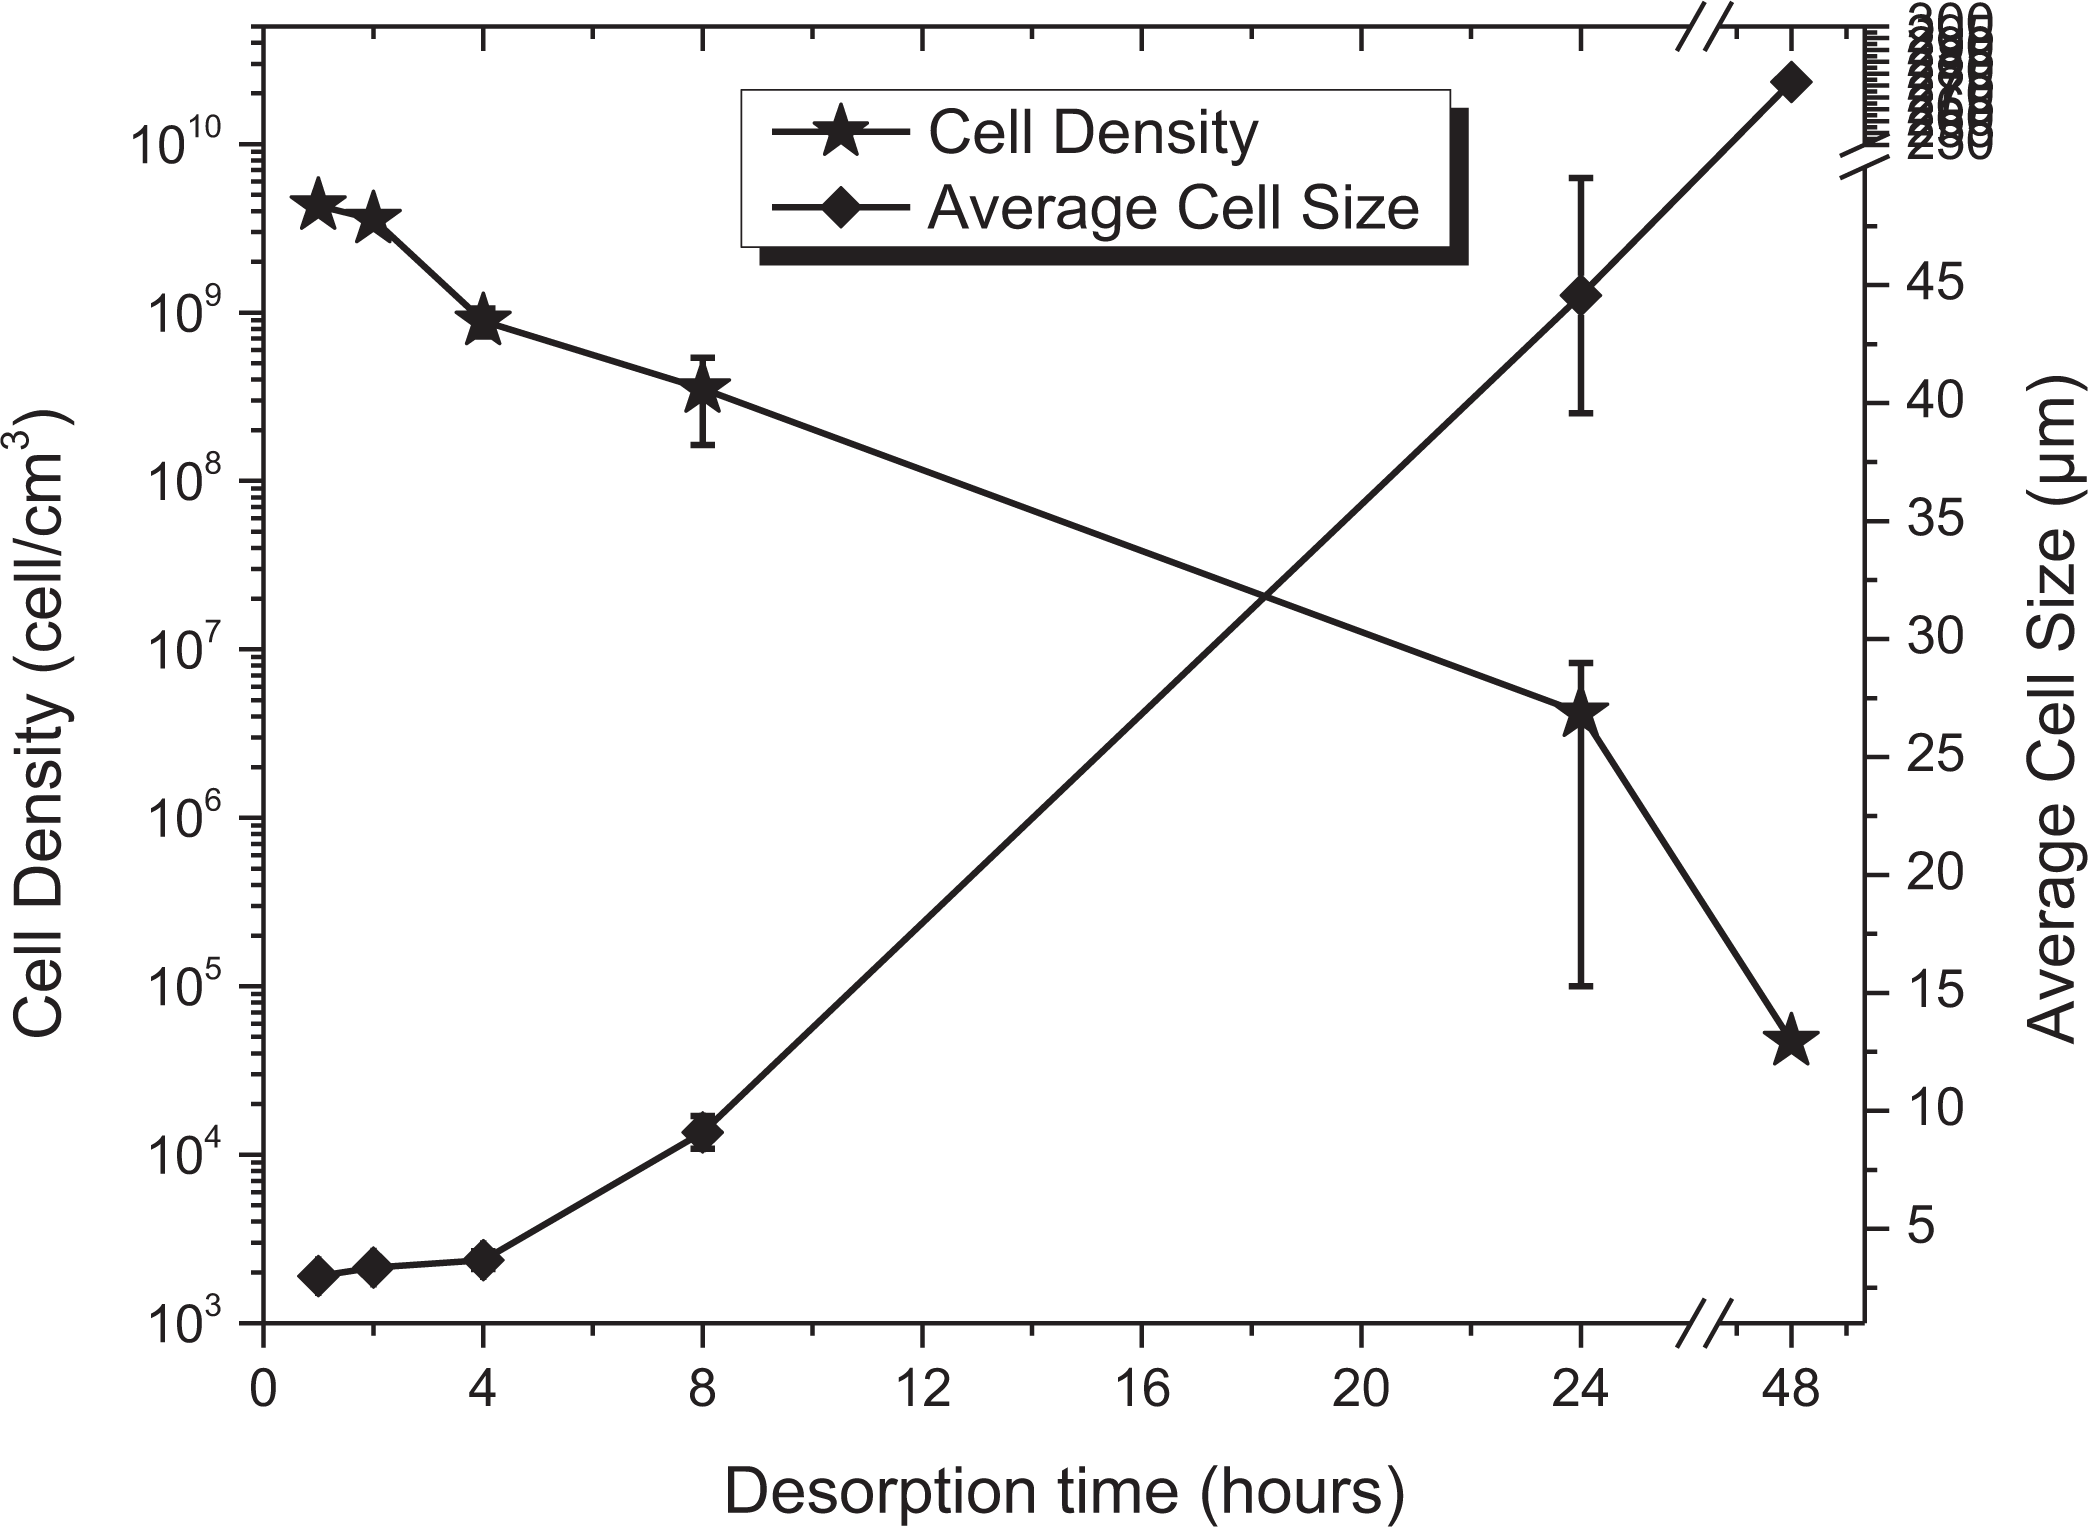
Effect of desorption time on cell attributes.
Conclusions
The gas foaming with 3D printing process integration approach could successfully develop microcellular foam microstructures. During this process, the significance of process parameters on the cell morphologies and its attributes were studied. The strategic process parameters studied were saturation pressure, nozzle temperature, feed rate and desorption time. The increase in saturation pressure resulted in a decrease in expansion ratio, a decrease in average cell size and an increase in average cell density. Further, the increase in nozzle temperature resulted in a decrease in expansion ratio, the average cell size decreased up to 220°C and increased slightly again at 240°C. Similarly, the average cell density increased up to 220°C and subsequently decreased at 240°C. Furthermore, the increase in feed rate results in an increase in expansion ratio but the difference among them was found to be trivial. But the average cell size was found to be decrease and average cell density was observed to be increase up to feed rate 150%, subsequently upon increasing the feed rate the average cell size increased and average cell density decreased. Likewise, the significance of desorption time was studied up to 48 h. After immediate depressurization the microcellular structured foams could not be produce due to excess plasticization of the polymer chain. The increase in desorption time increases in expansion ratio up to 8 h after that decreased. Similarly, the average cell size increased and average cell density decreased. Overall, the novel integration method could develop microcellular structure in the 3D printing filaments which could be utilized in several industrial applications.
Footnotes
Acknowledgements
Financial assistance has been received from the Department of Science and Technology, Government of India under the project titled “Development of Microcellular & Nanocellular 3D Printing Process to Manufacturing Acrylonitrile Butadiene Styrene Foamed Products” Grant order: DST/TDT/AMT/2017/092 (G).
Declaration of conflicting interests
The author(s) declared no potential conflicts of interest with respect to the research, authorship, and/or publication of this article.
Funding
The author(s) received no financial support for the research, authorship, and/or publication of this article.