
Abstract
Using methacrylic acid (MAA) and methyl methacrylate (MMA) as core monomers and polystyrene as the shell layer, polymer hollow microspheres (PHM) with good stability were prepared by using an alkali osmotic swelling method followed by spray drying. The average size of the PHM was approximately 875 nm. As a filling cross-linking agent, the PHM were added to a skin collagen material to disperse and fix, and a “polymer hollow microsphere composite collagen fiber” (PHCC) material was obtained. The results show that the PHM improve the mechanical strength, thermal stability and water resistance of the skin collagen material. The PHCC material has a low thermal conductivity (0.035 W/(K·m)) and excellent sound insulation performance and retains the soft and delicate touch of leather, which has application value in high-grade decorative materials and functional leather. This provides a new approach for developing flexible sound-absorbing thermal insulation materials.
Keywords
Introduction
With its rich visual effects and delicate touch, leather has always been a luxurious material. Leather has begun to be popularized into people’s lives. 1 As a furniture manufacturing and interior decoration material,2,3 the visual, tactile, and temperature-humidity buffering functions of leather have won the favor of consumers and interior environment art designers,4,5 facilitating a new conceptualization of “green building material”. 6
With the development of cities, noise from traffic and construction has become a part of environmental pollution. People find it difficult to sleep when the sound pressure exceeds 50 dB, and hearing loss and deafness can occur when the sound pressure exceeds 120 dB. Noise can increase the risk of hypertension, heart disease and so on, and have a serious impact on people's daily life and work.7-9 Generally, porous structural materials have the inherent properties of sound absorption and noise reduction. 10 These materials include porous fiber materials 11 and porous foam materials. 12 These sound-absorbing materials are made of synthetic materials,13,14 natural materials 15 and their composite materials. 16 However, environmental protection and green safety are the developmental directions for sound-absorbing materials. Natural fiber materials meet the requirements of sustainable development and have a natural reticulated porous structure, which are the first choice for new sound-absorbing materials. 15 Bamboo fiber, 17 pulp fiber, 18 wool fiber 19 and kenaf fiber 20 are the main raw materials of natural sound-absorbing materials.
The use of animal skins has a long history. Leather manufacturing is the main use of animal skin, which is also used in clothing, 21 food, 22 medicine 23 and other fields. The dermis of animal skin is a three-dimensional network material woven by 95% collagen fibers with a molecular weight of 3.0 × 10⁵ Da. 24 The pores formed by the staggered structure of the fiber bundles facilitate the good mechanical strength and softness of leather. The natural structure of animal skin exhibits air permeability, and its absorption and buffering of heat energy and sound energy has always been considered and utilized.25,26 Therefore, the structural characteristics of the collagen fibers in natural leather are suggestive of its good prospective value as an environmentally friendly packaging material for household ecological decoration and objects.2,3 However, the hygroscopicity of collagen fibers leads to fiber bonding and loss of function. The maintenance and improvement of the natural characteristics of animal skin is a subject worth exploring.
Polymer hollow microspheres (PHM) are special microspheric materials with internal cavity structures. They have the characteristics of low density, large specific surface area, light weight, and excellent light scattering properties, and are often used as a covering pigment , [27] an additive for UV protection, 28 a drug carrier 29 and an additive for sound-absorbing and insulating materials. 30 Hollow microspheres filled with animal skin materials are mostly related to medical applications. Jang D demonstrated that the surface interaction (electrostatic repulsion and hydrophobic interaction) between polystyrene drug-loaded microspheres and pigskin affects drug delivery, and the addition of emulsifiers can improve delivery efficiency. 31 Therefore, the preparation of hollow microspheres by emulsion polymerization can better penetrate animal skin materials. Hollow microsphere composites have broad application prospects. Hollow glass microspheres improve the compressive strength of epoxy resins and make low-density deep-sea buoyancy materials, 32 Hollow glass microspheres filled into polystyrene material to impart light-diffusing properties. 33
In this work, polystyrene hollow microspheres are filled into animal skin materials, in order to improve the strength of the material and increase the function of noise reduction and heat insulation. The polymer microspheres with core-shell structures were prepared by continuous emulsion polymerization with carboxyl-containing polymer latex particles as the core and styrene as the shell monomer. After neutralization with lye, an emulsion of microspheres with hollow structures was obtained. This emulsion was then spray dried to obtain solid PHM. The stability, morphology, size distribution and chemical structure of the PHM emulsions were determined. PHM emulsion was used as a filling crosslinking agent to support the pores of collagen fiber to obtain “polymer hollow microsphere composite collagen fiber” (PHCC) material. The sound absorption, heat insulation and physical strength of the PHCC material were measured, and its air permeability, water vapor permeability and chromaticity were studied.
Experimental
Materials
Acrylamide (AM), methyl methacrylate (MMA), alpha-methacrylic acid (MAA), sodium stearate (Sodiu), ammonium persulfate (APS), methacrylamide propyl trimethyl ammonium chloride (MPTAC), isopropyl alcohol (IPA), and styrene (St), all of analytical grade, were obtained from Chengdu Kelong Chemical Reagent Factory. Isodecanol polyoxyethylene ether (XP-70) of analytical grade was obtained from BASF (China) Co., Ltd. Chrome-tanned cowhide was obtained from the Xuzhou Yuehai Leather Company. Leather chemical additives, such as neutralizers and fatliquoring agents, were obtained from Xuzhou Hongfeng Polymer Material Company.
Preparation of polymer hollow microspheres (PHM)
Preparation of polyacrylamide (PAM)
First, 15.39 mol distilled water was added to a reaction flask, and after the temperature reached 70°C, 0.074 mol XP-70, 0.011 mol APS and 0.216 mol IPA were added in sequence, and the reaction was carried out for 10 min. Then, 1.69 mol AM was added dropwise to the reaction flask, reacted for 60 min, stirred at a constant temperature for 60 min. Finally, a transparent viscous liquid was obtained and removed for future use.
Preparation of core emulsion
First, 0.05 mol of XP-70 and 0.018 mol of APS was dissolved in 13.89 mol of distilled water to prepare liquid A. Then, 4 mol of MMA and 0.58 mol of MAA were mixed to prepare liquid B. Next, 350 g of PAM was dissolved in 222.22 mol of distilled water and placed in a reaction flask, the temperature was raised to 80°C, and then 10 wt% liquid A and 12 wt% liquid B were added, and the mixture was allowed to react for 10 min. A slightly blue emulsion was obtained. The remaining A and B solutions were added dropwise to the reaction flask respectively, and the dropwise addition was carried out at a temperature of 80°C for 75 min. The reaction was then heated to 84–87°C for 60 min. The resulting core emulsion was a white liquid.
Preparation of core/shell emulsion
Two hundred grams of distilled water, 39 g of PAM solution and 500 g of core emulsion were added to a reaction flask, and the temperature was raised to 80°C in a water bath. XP-70 (0.0003 mol) and APS (0.018 mol) were mixed in 5 mol of distilled water to prepare liquid C. Then, 25% liquid C was added to the flask and allowed to react for 10 min. Next, 2.26 mol of St and the remaining liquid C were added dropwise to the reaction flask respectively, and dropwise addition was carried out at a temperature of 85°C for 135 min. After synthesis, a mixed aqueous solution of 0.02 mol of MPTAC was added. The reaction temperature was raised to 90°C, and the pH of the emulsion was adjusted to 9.0 by adding 0.116 mol KOH aqueous solution. After 120 min of reaction, it was lowered to room temperature to obtain a white emulsion which was PHM emulsion.
Preparation of solid PHM
The PHM emulsion was diluted to a solid content of 20% and dried with a small spray dryer (JOYN-8000Y, Hangzhou Jutong Electronics Co., Ltd., China). The inlet temperature was set to 160°C, the outlet temperature to 60°C, and the feed rate to 500 mL/h. The obtained white powder was uniformly ground with a mortar to obtain the finished solid PHM.
Characterization of PHM
Particle size analysis of PHM emulsions
The particle size distributions of the PHM emulsions were measured using a nanoparticle size and zeta potentiometer (Zetasizer Nano zsp, Malvern Instruments, UK). Before the measurement, 5 mg solid PHM was dissolved in 20 mL water to prepare the PHM emulsion. Then the emulsion was treated by ultrasonic treatment of 20min. The PHM emulsion was diluted 20,000 times with ultrapure water, and ultrasonic treatment for 20 min, then an appropriate amount of sample was transferred into the sample cell for measurement. Measurement conditions: the equilibration temperature was 25°C, the equilibration time was 3 min, and the measurement was repeated 3 times.
Investigation of PHM structure and morphology
The morphology and structure of the solid PHM were observed by scanning electron microscopy (JSM-7500F, JEOL, Japan). The test surface was treated with gold spraying, and the accelerating voltage was 3.00 kV.
PHM emulsion stability test
Before the measurement, the solid PHM was dissolved in water to prepare an emulsion with a solid content of 30%. Considering the addition of neutral salts in practical applications, the salt resistance stability of the PHM emulsion was tested. sodium sulfate (0.25 g) and 4.75 g PHM emulsion were mixed in a 10 mL centrifuge tube and allowed to stand for 24 h, and the stability of the sample was observed. Similarly, sodium chloride (0.25 g) and 4.75 g PHM emulsion were mixed in a 10 mL centrifuge tube and allowed to stand for 24 h to observe the stability of the sample. The pH value of the PHM emulsion was adjusted to 5 with a 0.2 mol/L HCl solution, and it was allowed to stand for 24 h to observe the acid resistance stability of the sample. Finally, the dilution stability of a blank sample was measured, and the PHM emulsion was diluted to 10% with distilled water and left for 24 h to observe the stability of the sample emulsion.
Chemical structure analysis of PHM
The solid PHM and KBr were mixed in a ratio of 1:100, and ground in an agate mortar for 5 min after drying. The mixture was evenly mixed, and an appropriate amount of the mixed powder was taken into a mold, and then pressed into a tablet, and the FT-IR spectrum of the sample was recorded by a Fourier transform infrared spectrometer (IS10-potassium bromide tablet, Perkin Elmer, USA). The scanning wavelength range was 650–4000 cm-1, the number of scans was 32, and the resolution was 4 cm-1.
The surface element and functional group information of the samples was obtained by an X-ray photoelectric energy spectrometer (ESCALAB 250Xi, Thermo Fischer, USA), and the XPS full spectrums and fine spectrums of the C 1s and O 1s of the PHM were obtained. Monochromatic Al Kα (hv = 1486.6 eV) was used in the test, as well as a power of 150 W, a 650 μm beam spot, a voltage of 14.8 kV, a current of 1.6 A, a full-spectrum scanning pass energy of 100 eV, a fine-spectrum scanning pass energy of 20 eV, and a vacuum of 100 eV. The degree of vacuum was 1.0×10⁻¹⁰ mbar. The XPS data were fitted by Avantage, and the charge correction was always C 1s = 284.8 eV.
Characterization of thermal stability of the PHM
A differential scanning calorimeter (DSC204F1, NETZSCH, Germany) was used to determine the phase transition temperature of the PHM. Specimens (5–10) mg were weighed, and the measurements were carried out at a heating rate of 20 K/min from 20°C to 400°C under a N2 atmosphere. The thermal stability of the PHM was determined with a thermogravimetric analyzer (TG209F1, NETZSCH, Germany). Specimens (5–10) mg were weighed, and the measurements were carried out at a heating rate of 20 K/min from 30°C to 550°C under a N2 atmosphere. 34
Preparation of PHCC
Sheep skin pretreatment: Sheep skin with a thickness of 1.2 mm and pH of 2.8 was weighed and put into a Ф600 drum (Wuxi Derun Light Industry Machinery Factory, China), and 200% water (30°C) and 2% chrome agent was added to the drum, which was then rotated for 120 min. Subsequently, the pH was adjusted to 3.8–3.9 with 0.5% sodium formate and 1.2% baking soda within 120 min, and then the liquid was drained. After standing for 24 h, 150% water (35°C), 2% neutralizer, 0.5% sodium formate and 0.5% baking soda were added to the drum, which was then rotated for 60 min, and the endpoint pH was 5.0–5.5. The liquid was drained, and the pretreated sheepskin was washed for 10 min with 200% water (35°C).
Preparation of PHCC: 150% water (35°C), 5% fatliquor and 30% PHM emulsion (30% PHM with solids) were added to a drum and rotated for 60 min. The pH was adjusted to 3.8–4.0 by adding 0.5% formic acid, turning for 60 min, draining the liquid, washing with 200% water (35°C) for 10 min, and again draining the liquid. The wet PHCC was hung to dry.
Characterization of the PHCC material
Determination of PHCC material physical properties
Referring to the national standard QB/T 2710–2005, after cutting the PHCC material into standard molds, all samples were conditioned for 24 h in a standard atmosphere (relative humidity 65%, 25°C) before testing. The softness of the PHCC samples was examined by using a softness tester according to the standard procedure (GT-303, High Speed Rail Testing Instrument Co., Ltd., China). The thickness of the PHCC samples was measured with a thickness meter (MY-3130-A2, Dongguan Mingyu Electronic Technology Co., Ltd., China). The tensile strength, elongation at break and tear strength of the PHCC samples were measured with a universal testing machine (AL-7000SN, Taiwan High Speed Rail Technology Corporation, China). 35 The cracking strength of the PHCC samples was measured with a crack tester (GX-5071, Dongguan Gaoxin Testing Equipment Co., Ltd., China). Each group of samples was tested in 5 parallel experiments, and the final results were averaged.
Stability characterization of the PHCC material
The shrinkage temperature (Ts) of the PHCC material reflects the change in moisture and heat resistance of the collagen treated with PHM. The Ts of the samples was measured with a shrinkage thermometer (SMW-YD1, Shaanxi University of Science and Technology, China) with reference to the national standard QB/T 2713–2005.
A differential scanning calorimeter (DSC204F1, NETZSCH, Germany) was used to determine the thermal stability characterization of the PHCC material. Specimens (5–10) mg were weighed, and the measurements were carried out at a heating rate of 20 K/min from 20°C to 400°C under a N2 atmosphere.
X-ray diffraction (XRD, D8 Advance, Germany) of 40 KW was used to scan the samples. The radiation wavelength is 0.154 nm, the scanning speed is 10°/min and the scanning range is 5°–85°.
Swelling property test of the PHCC material
The PHCC samples were conditioned for 24 h in a standard atmosphere (relative humidity 65%, 25°C) before testing. The samples were immersed in 50.0 mL deionized water and soaked for 24 h at 37°C. Then, the surface moisture was removed with filter paper. The weight of the samples before and after soaking was measured and recorded as M (g) and Ms (g). The sample swelling degree (S) is calculated according to the Equation:

Characterization of the PHCC material microstructure
The cross-sectional morphologies and structures of the samples were observed with a scanning electron microscope (JSM-7500F, JEOL Corporation of Japan). The test section was sprayed with gold, and the accelerating voltage was 3.00 kV.
Porosity test
Determination of sample apparent density: The circular specimen was regarded as a regular cylinder. The volume of the specimen was calculated by measuring its thickness and diameter. Divide the mass (W) of the specimen by the volume to obtain the apparent density (g/cm3), denoted as d k . The specific determination method refers to the standard QB/T 2715–2005.
Determination of the true density of the sample: Cut the specimen into a narrow strip with a length of 20 mm and a width of 2–3 mm, weigh 5–10 g, accurate to 0.001 g, and place it in a volumetric flask (volume V0), then add toluene to the marking line with a dropper, and write down the toluene used volume V1. Cap the volumetric flask with a stopper and let stand for 24 h. During this period, the voids in the specimen were filled with toluene, and at the same time, the volume of toluene in the bottle decreased, and the reduced amount of toluene was supplemented, and the volume V2 of the supplemented toluene portion was recorded. The volume Vμ of the compacted substance of the specimen is V0-(V1-V2). Divide the mass of the sample (W) by Vμ to obtain the true density d n (g/cm3).
The Porosity (%) of each PHCC sample was calculated according to the following Equation:

Chroma and color difference test
Each sample was cut into a 15 cm × 15 cm sample, which was placed in a standard atmosphere (relative humidity 65%, 25°C) for 24 h before testing. At 6 different positions in the center of each sample, the L, a, b values of the sample were measured with a colorimeter (CM-200S, Guangzhou Lantai Instrument Co., Ltd., China), and the average of the final results was recorded. The sample color difference (ΔE) as calculated according to equation (3):

Thermal conductivity of the PHCC material
The thermal conductivity of the PHCC material was characterized by a steady-state method to measure the thermal conductivities of the PHCC samples.
17
The coefficient of the thermal conductivity tester (DRP-Ⅱ, Xiangtan Xiangjiang Instrument Co., Ltd., China) was used. Cut the sample into circular specimens with a diameter of 7 cm. First, the sample was placed between the upper and lower copper plates and heated to a set temperature. When the temperature of the upper and lower copper plates was stable, the temperatures T
1
and T
2
were recorded. Next, the sample was removed, and the copper plate was heated to T
3
(higher than T
2
), after which the heating was stopped, and then the change in temperature of the lower copper plate over time was recorded again. The thermal conductivity (λ) was calculated by using equation (4):

Sound insulation test
The STL value (sound transmission loss (dB)) is the difference between the noise values on both sides of the sound insulation material, and is the key index used to evaluate the noise reduction effect of a material. The higher the STL value is, the better the sound insulation of the material. The equipment used to measure the PHCC material sound insulation performance is shown in Figure 1. In this study, the MyTone Test V 1.27 sound source driver was installed on a computer, which can generate audio signals from 500 to 12,000 Hz. The audio signal was amplified through a sound amplifier on the right side of the testing equipment, transmitted along a tube and passed through a test specimen. Then, the audio signal was measured and recorded by a GM 1365 digital sound level meter (Benetech, China) on the left side of the testing equipment. All specimens were tested at room temperature (25°C), and three replicate values were measured for each type of specimen.
17
Diagram of the test mechanism used for measuring sound insulation performance.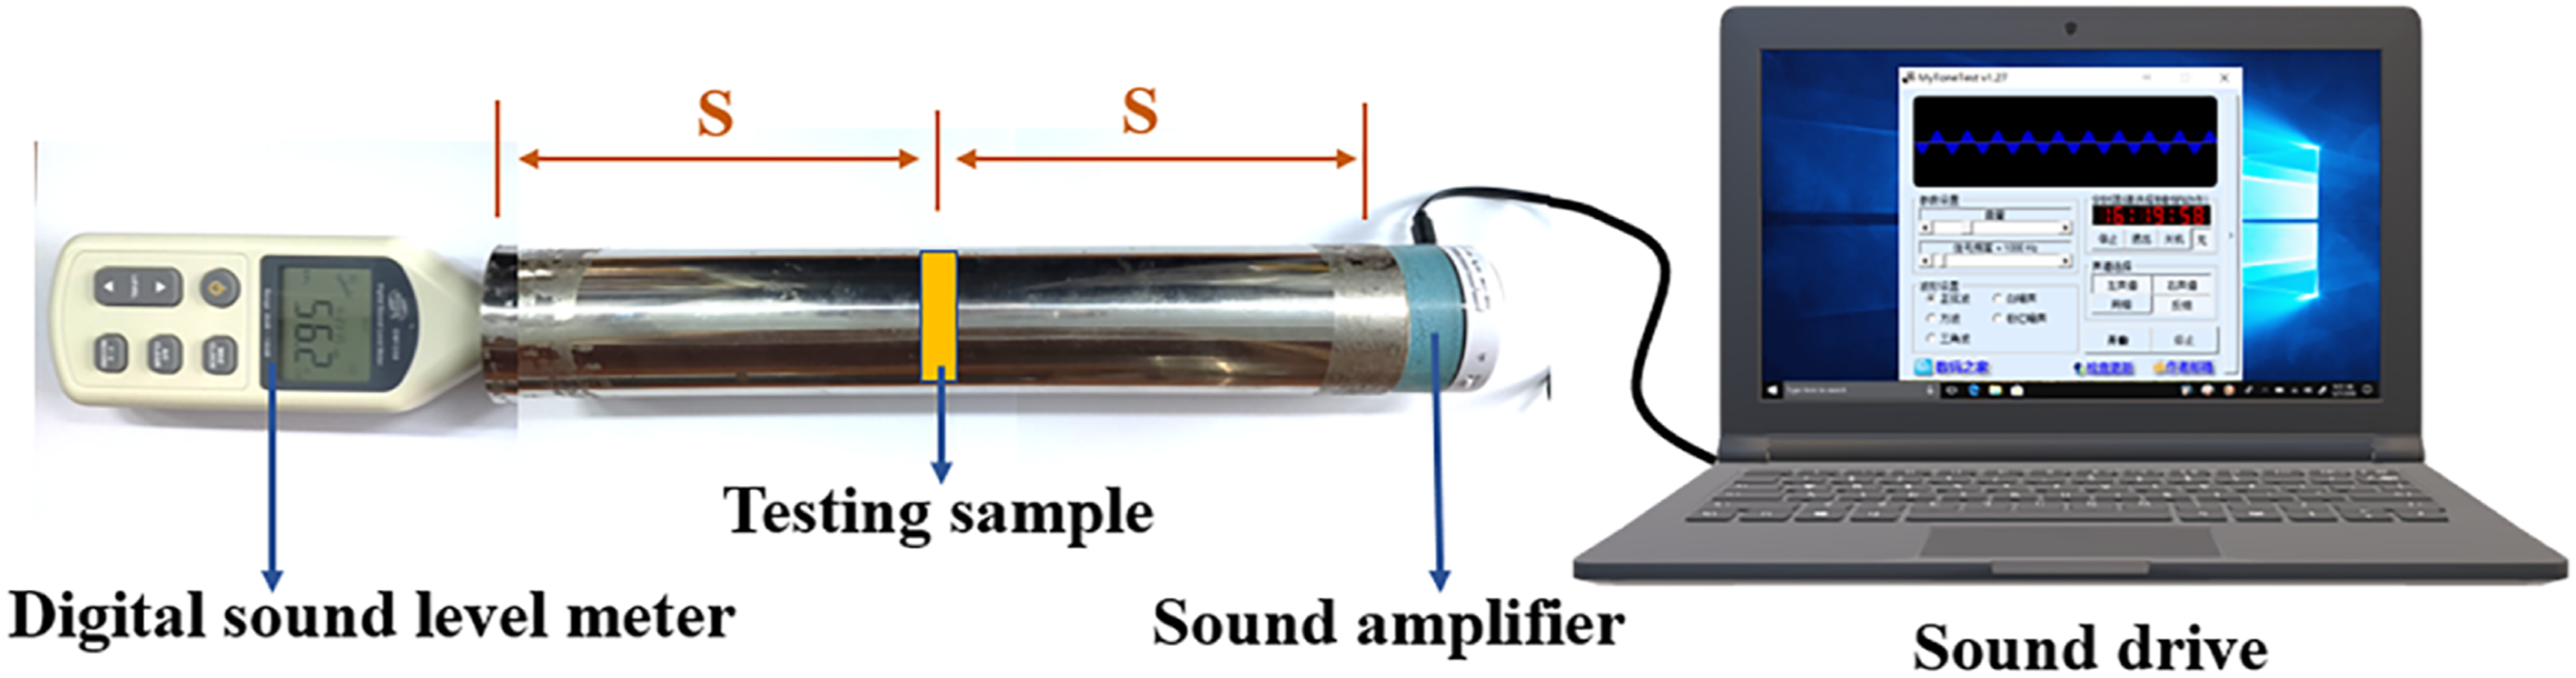
Test of air permeability and water vapor permeability of the PHCC material
In according with the standard QB/T 2799–2006, the material air permeability was measured with an H. C. Fedorov leather air permeability tester, and all samples were tested at (20 ± 3) °C. The air permeability of each sample was calculated according to equation (5).
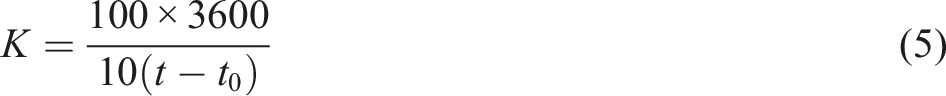
According to the standard QB/T 1811–1993, the water vapor permeability of each sample was determined by a static method. First, 30 mL of distilled water was measured and placed in a test dish, an aluminum screw cap was placed tightly to prevent air leakage, and the test dish was weighed (m
1
) with a balance. The test dish was put into a dryer (diameter 25 cm) containing concentrated sulfuric acid with a relative density of 1.84, then placed in air at (20 ± 1) °C for 24 h, and weighed to obtain m
2
. The water vapor permeability (P, mg∙(10 cm2∙24 h)-1) was calculated as m1-m2 Figure 2. H. C. Fedorov leather permeability tester schematic diagram.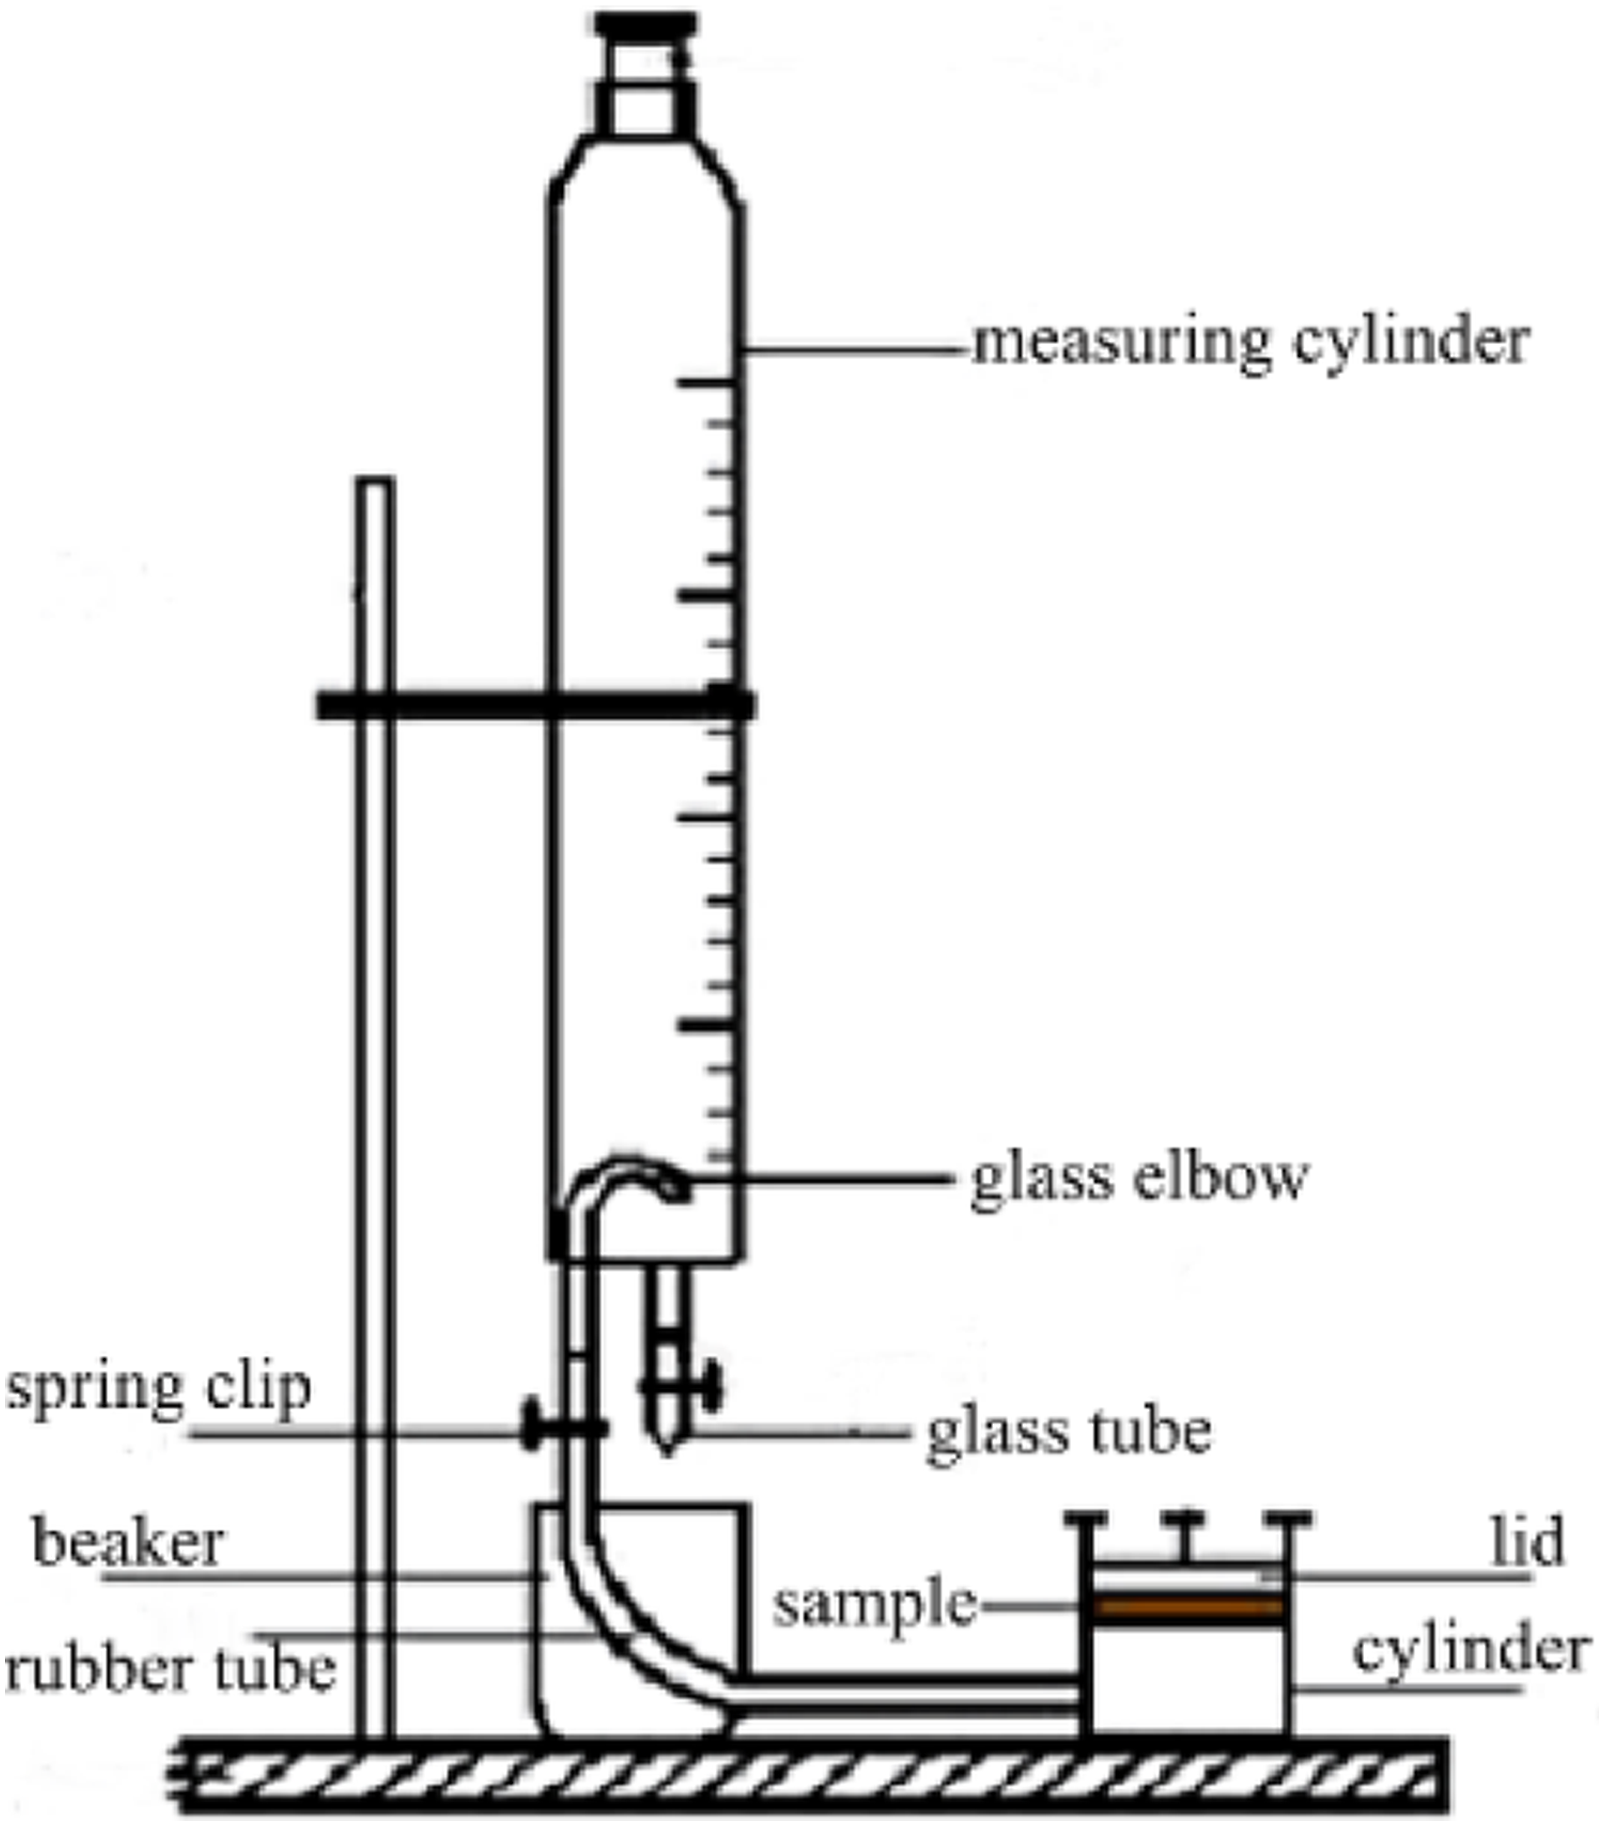
Results and discussion
Morphology and size distribution of PHM
The apparent morphology of the PHM is shown in Figure 3 (A-C). The PHM are spherically distributed, the small nanospheres are agglomerated into microspheres, and the internal cavity structure can be clearly seen at the cross section. The particle size distribution of the PHM emulsion is shown in Figure 3 (d). The size of the microspheres ranged from 500 nm to 1500 nm, and the polydispersity index (PdI) was 0.130, indicating that the PHM emulsion had a uniform distribution and an average particle size of 875 nm. PHM scanning electron microscope images (a–c). and emulsion particle size distribution (d).
Thermal properties and emulsion stability of PHM
It can be seen from the DSC diagram of PHM in Figure 4 that the PHM had an obvious glass transition accompanied by enthalpy relaxation, and the glass transition temperature (Tg) of the sample was 107.1°C. With increasing temperature, a relatively flat curve was obtained, indicating that the microspheres slowly underwent endothermic softening in this temperature range, and the obvious softening and denaturation (melting point) temperature was 283.5°C, which provides a reference for PHM thermal processing. The exothermic peak at 367.8°C was presumed to be caused by physical transformation and initial decomposition.
36
In Figure 4(b), with increasing temperature, the sample exhibited a slow weight loss before reaching the decomposition temperature, indicating that a small amount of small molecular substances was released. It may be that PHM encapsulates a small amount of water, surfactant and unreacted monomer. The PHM began to decompose at 365.1°C, reached a maximum decomposition rate at 439.2°C, and decomposed completely at 472.3°C, which was mutually confirmed by the exothermic peaks of their DSC diagrams. DSC diagram (a), TG diagram (b), emulsion stability diagram (c). and dispersion diagram (d) of PHM. A-5% sodium sulfate, B-5% sodium chloride, C-pH 5.0, D-dilution. ①: spray-dried sample, ②: dried sample.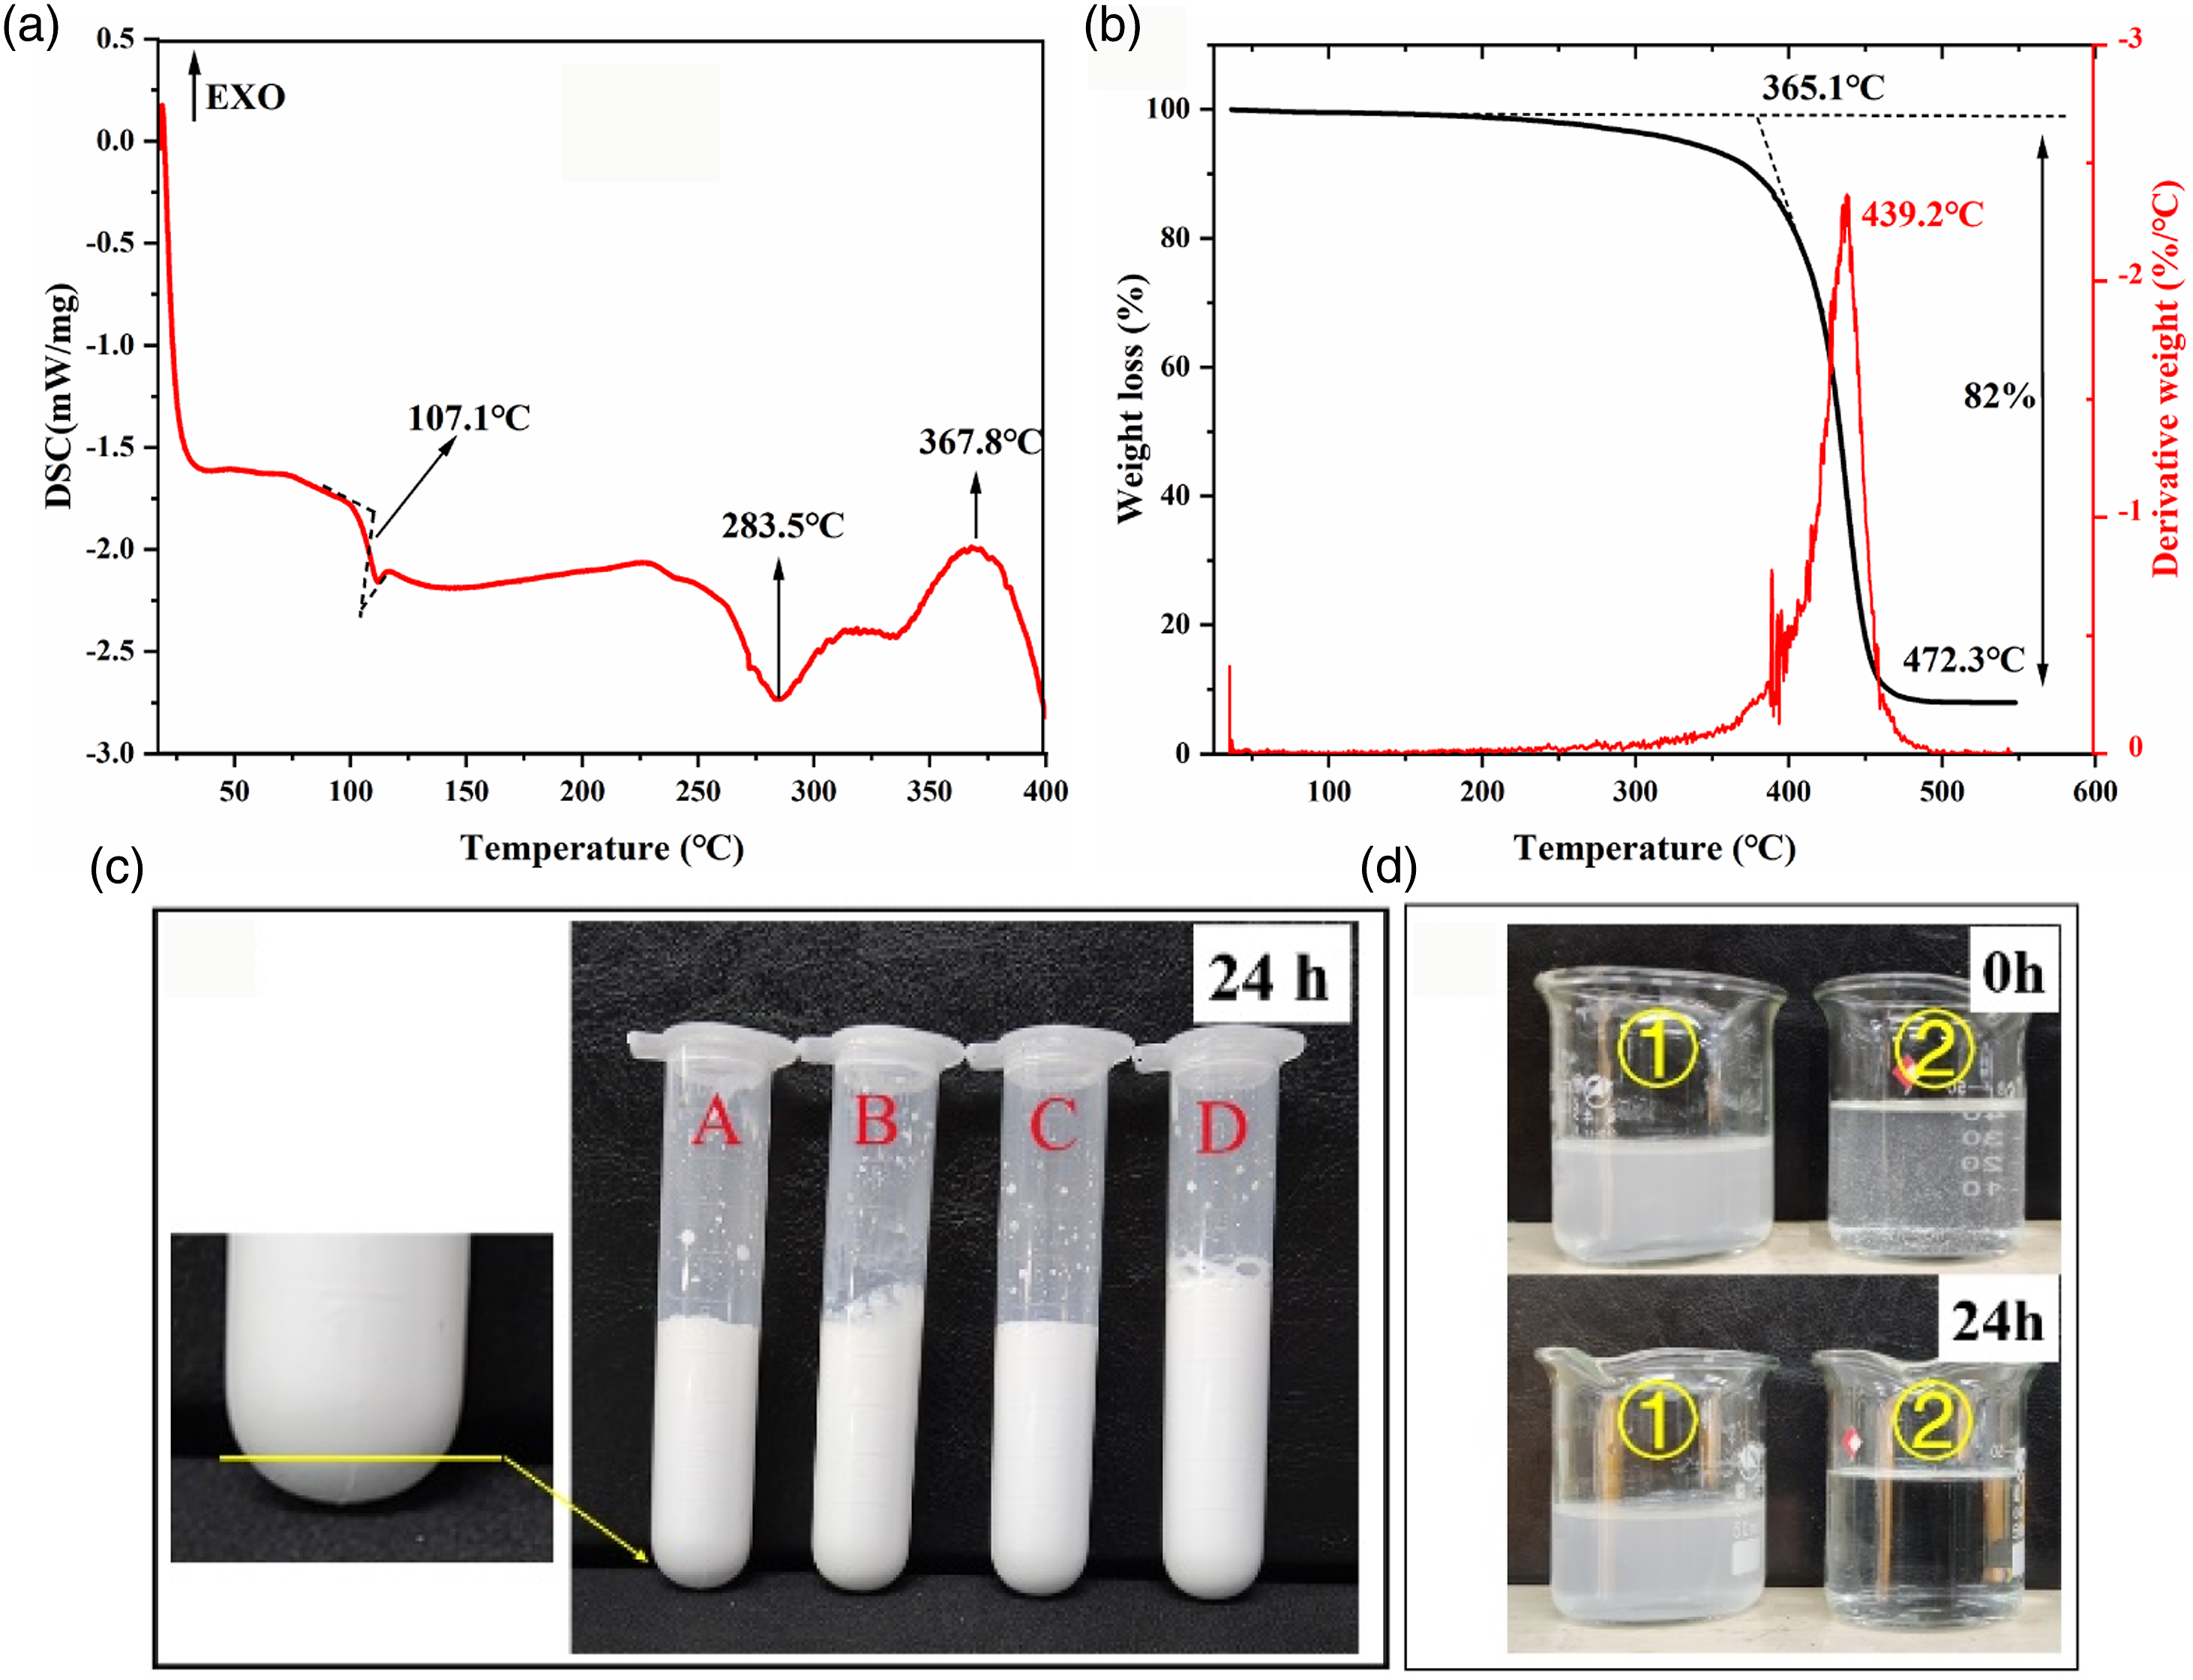
The results of the PHM emulsion stability tests are shown in Figure 4(c). After standing for 24 h, stratification appeared in the solution of the test tube supplemented with 5% sodium sulfate, and the emulsions were stable in other cases. The dispersibility of the oven-dried (60°C) and spray-dried samples in water is shown in Figure 4(d). The spray-dried PHM had better dispersion and stability, and the dried PHM was floating in water after 24 h. This is due to the high temperature flash evaporation at 160°C during the spray drying process, which makes the hydrophilic chains on the surface of the microspheres solidify instantaneously, and the resulting microspheres have better hydrophilicity. 37
Chemical structure analysis of PHM
The FT-IR spectrum of the PHM is shown in Figure 5 (a). Three moderate-intensity absorption peaks appear near 1601 cm-1, 1492 cm-1 and 1452 cm-1, which are the skeleton vibrations of the benzene ring. The two absorption peaks at 756 cm-1 and 697 cm-1 were attributed to the characteristic out-of-plane bending vibrations of the aromatic C-H bonds of the monosubstituted benzene ring. The =C-H stretching vibration of alkenes appears at 3025 cm-1 with moderate and strong absorption, and the C=C stretching vibration appears at approximately 1668 cm-1. The C=O stretching vibration of carboxyl or ester groups appears near 1729 cm-1, and 1386 cm-1 represents the stretching vibration of -COO-, indicating that the PHM surfaces contain carboxyl groups. The C=O stretching vibration of amide appears near 1668 cm-1. The strong and broad absorption peak near 3438 cm-1 was caused by the -NH2 stretching vibration peak of the amide and the O-H bond stretching vibration of the carboxyl group. The weak absorption peak at 1386 cm-1 was attributed to the mixed absorption peaks of the C-N stretching vibration of amide and the bending vibration of N-H. FT-IR spectrum (a), XPS scans (b–d) and synthesis mechanism (e) of PHM. 3: core-shell microspheres (CSM); ②: PHM.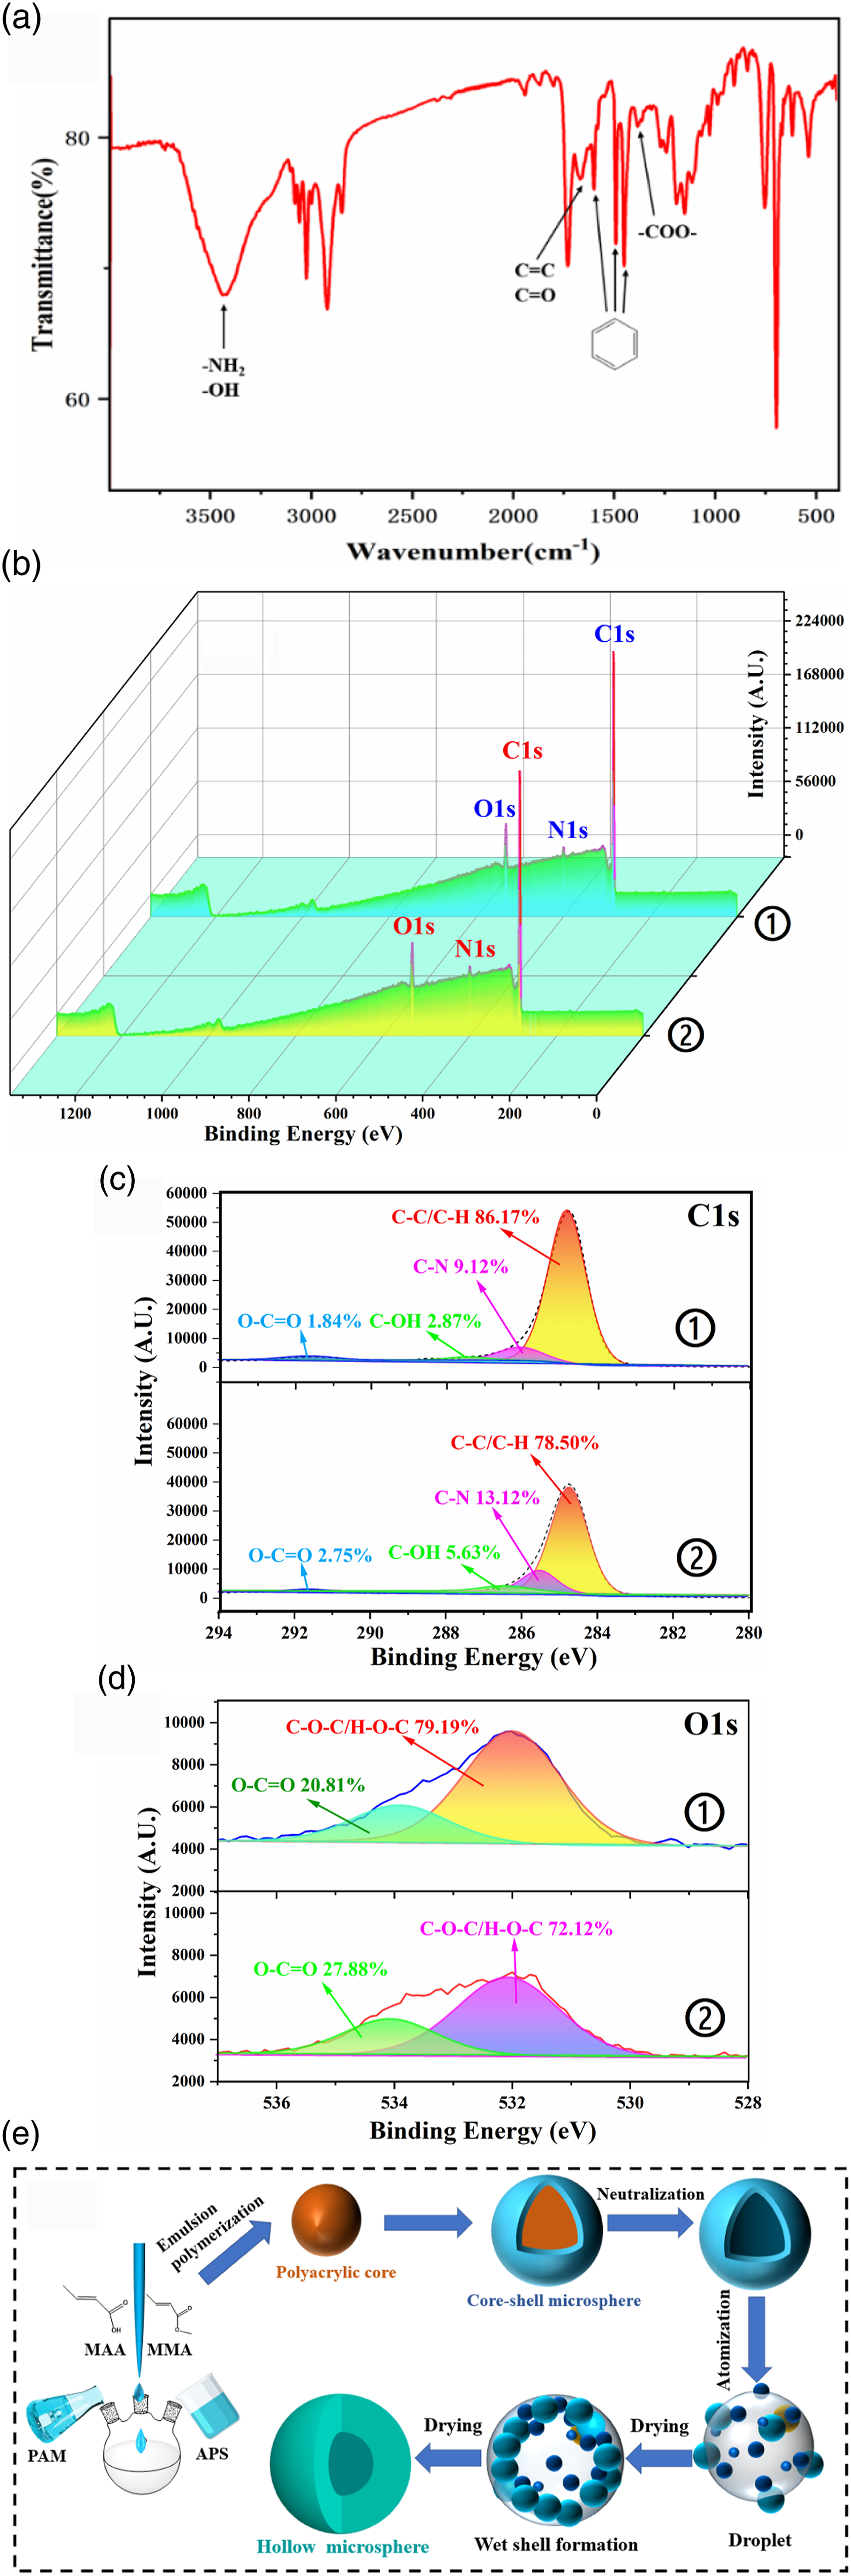
To further verify the swelling effect of alkali post treatment on microspheres, XPS was used to conduct the full spectrum scanning and fine spectrum scanning of C 1s and O 1s elements for the PHM and core-shell microspheres (CSM) without alkali treatment, respectively. The results are shown in Figure 5(b–d). The surface elements of the PHM and CSM were mainly C, O, and N, of which the content of C was more than 75%, and the C/O ratios were 4.35 and 5.68, respectively. The surface O content of the PHM increased significantly, further indicating the migration of hydrophilic groups such as carboxyl groups to the surface shell. The C 1s XPS spectrum of the samples can be deconvoluted into four carbon components with different binding energies: C-C (284.6 eV), C-N (285.4 eV), C-OH (286.5 eV) and carboxylate O-C=O (289.2 eV) . [30] Compared with that of the CSM, the content of oxygen-containing groups in the PHM increased significantly, and the peak area ratios of C-OH and O-C=O increased by 2.76% and 0.91%, respectively. In addition, in the fine spectra of O 1s the two peaks at 532.0 eV and 534.0 eV were attributed O-C=O and C-O-C, respectively. 38 Compared with that of the CSM, the surface carboxyl peak area ratio of the PHM increased by 7.07%, which was consistent with the FT-IR spectral analysis of the PHM. Therefore, it is speculated that after the addition of alkali solution to the CSM, the alkali molecules pass through the shell layer and hydrolyze and neutralize a portion of the ester bonds inside the microspheres so that the hydrophilicity of the polymer segment is enhanced. The carboxyl-containing hydrophilic segment moves toward the shell and water phase, leaving some small holes inside the CSM. With the swelling effect of alkali, these small pores tend to aggregate and reduce the interfacial area, hence the potential energy is decrease, forming a cavity structure.
According to the abovementioned PHM microstructure and chemical structure analyses, the basic process of PHM synthesis can be inferred (as shown in Figure 5 ((e)). After the polymer microspheres with core-shell structures are neutralized and swollen by the alkali solution, the core chain that contains carboxyl groups stretches out of the shell, gradually dissolves, and partially fuses with the shell layer, forming microspheres with internal cavity structure. Then, the microsphere emulsion passes through the atomizer to form small droplets. Due to the evaporation of water, a wet shell of the microspheres is formed, which gradually dries and solidifies to form hollow spheres.
Microscopic structure of the PHCC material
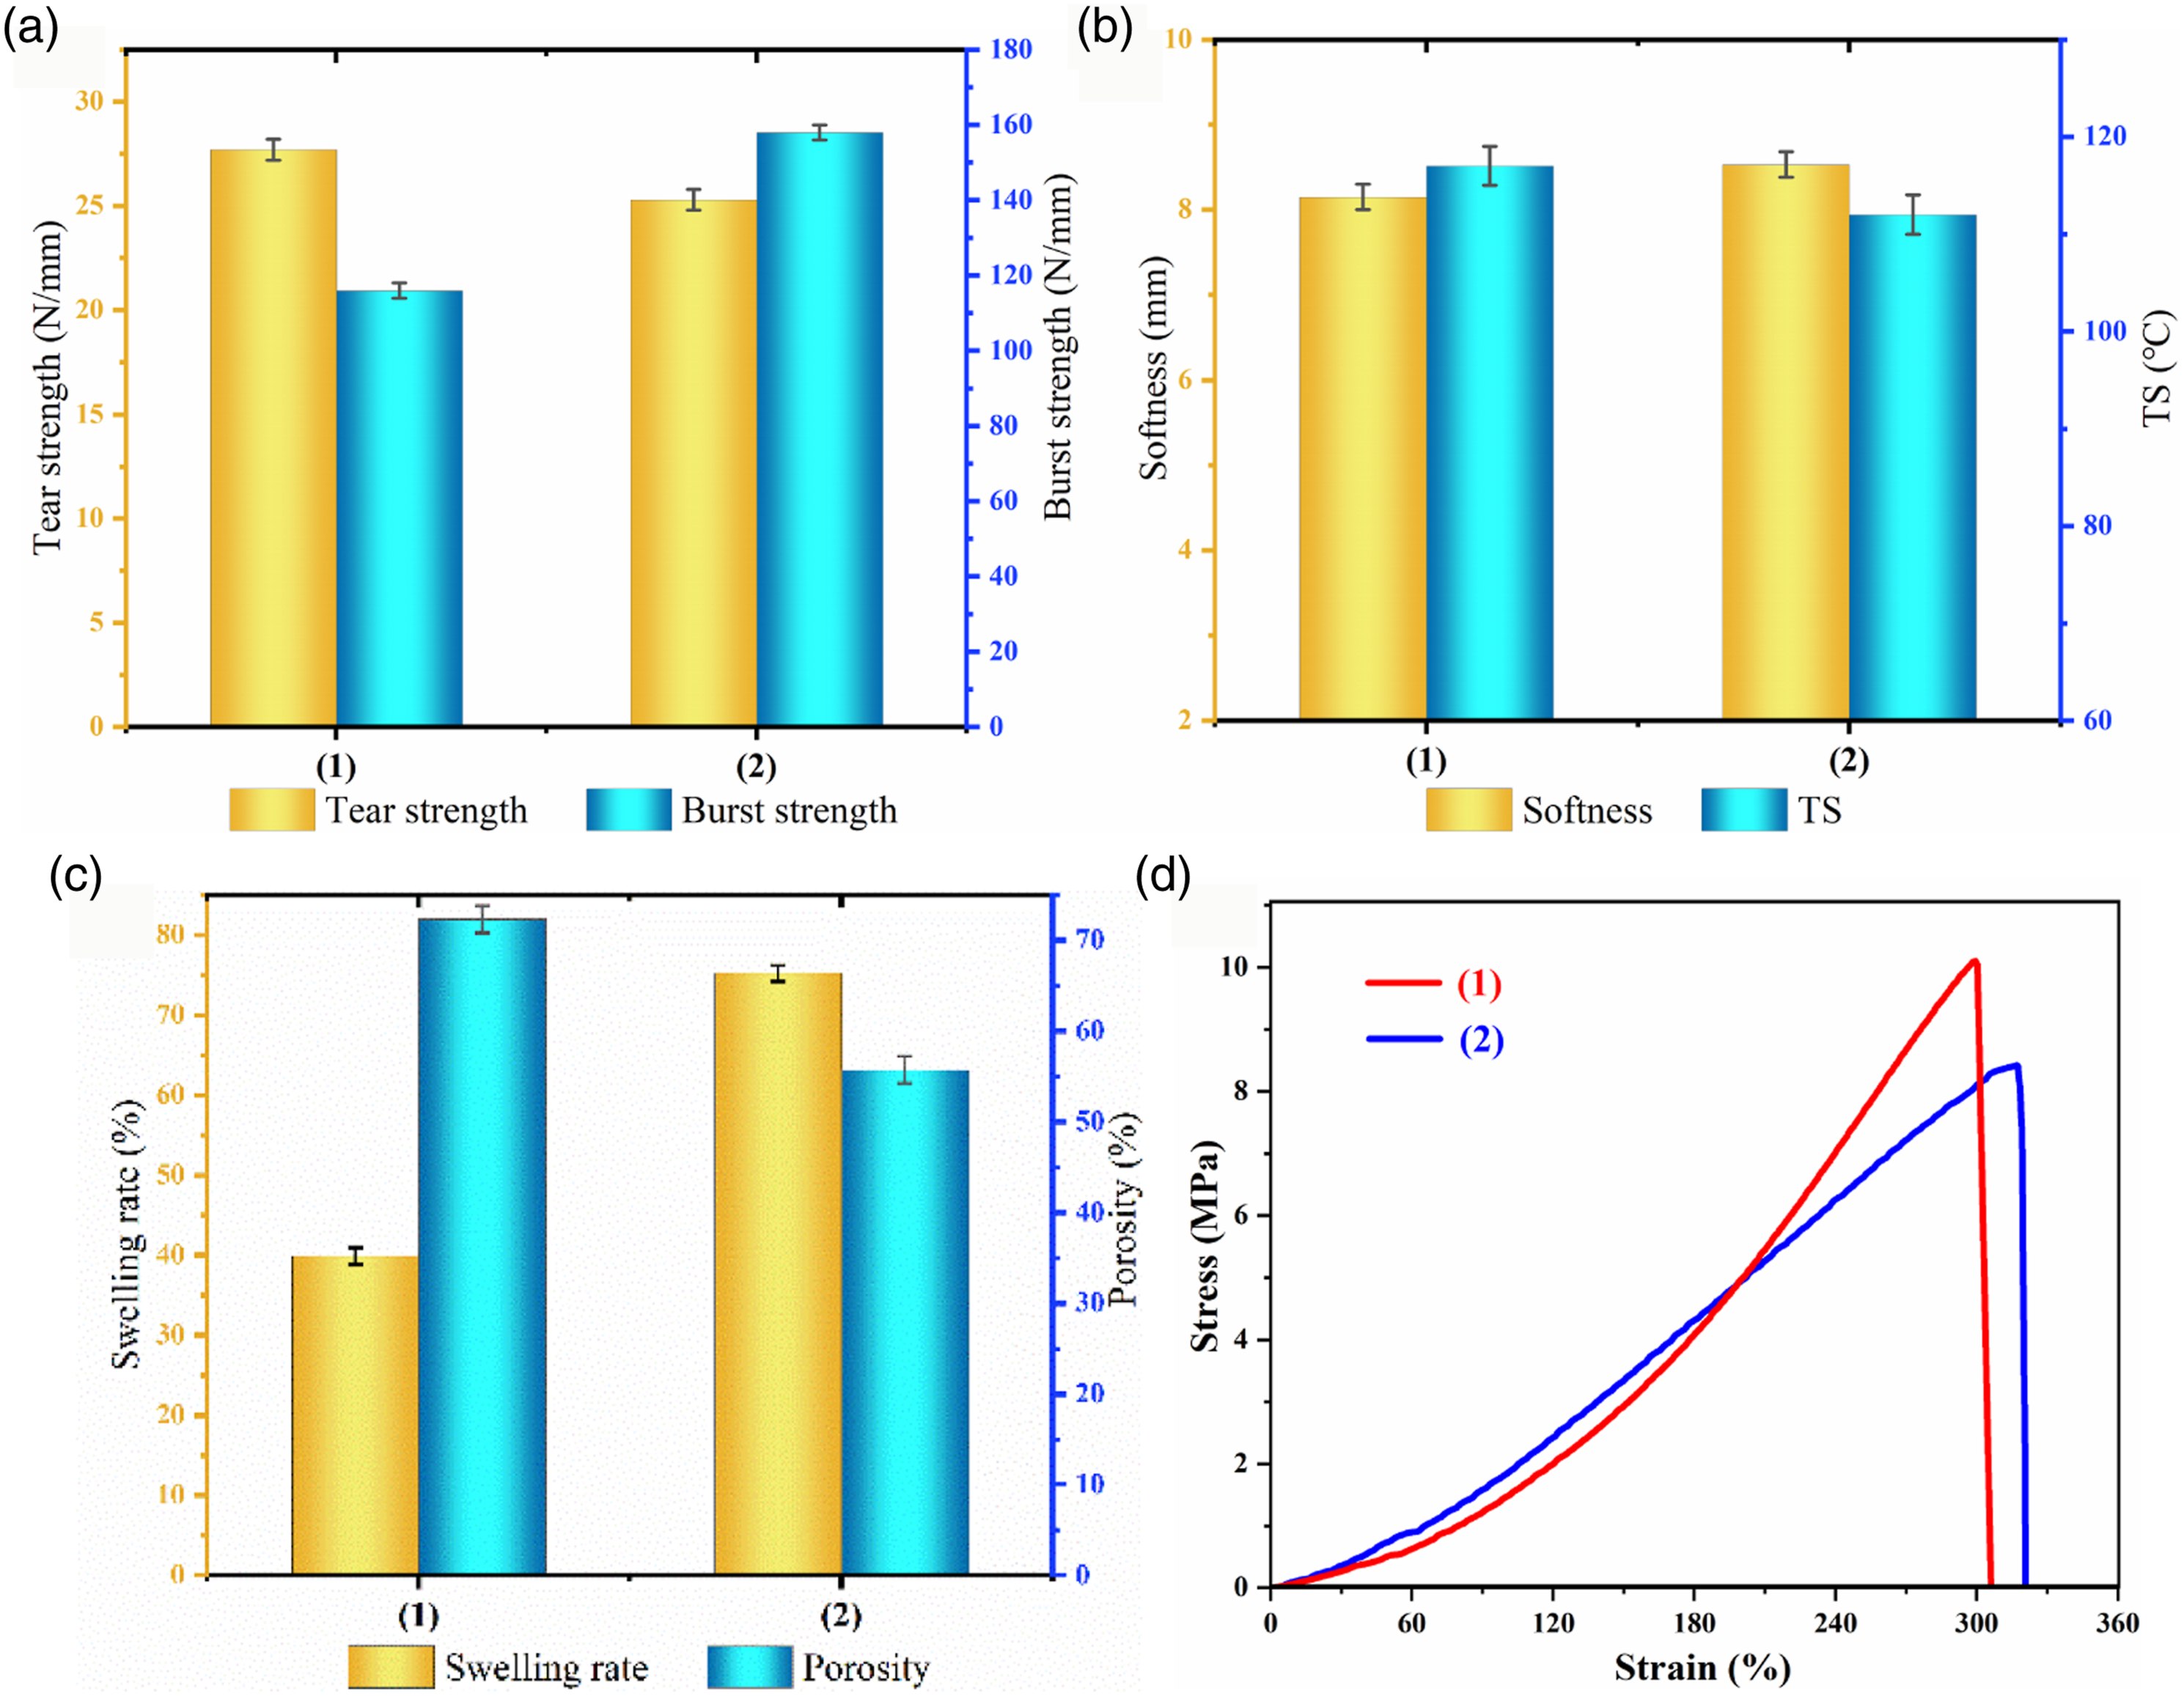
Figure 6 shows that the collagen fiber bundles of blank chrome tanned-leather (BCTL) have large gaps and small fibers. The polystyrene shell of the microspheres is hydrophobic, but it has no bonding ability. In the dry state, hydrophobic adsorption can occur the leather fiber so that the surface of the collagen fiber evenly adheres to the PHM, forming structure that supports and fills the skin collagen. The fibers were ground and separated to prevent sticking after drying. The results show the fiber voids increase, and the porosity is shown in Figure 8 (c). SEM diagram of leather fibers of BCTL(a and b)and PHCC (c and d). Physical and mechanical properties (a–c) and stress-strain curve (d) of materials. (1): PHCC; (2): BCTL.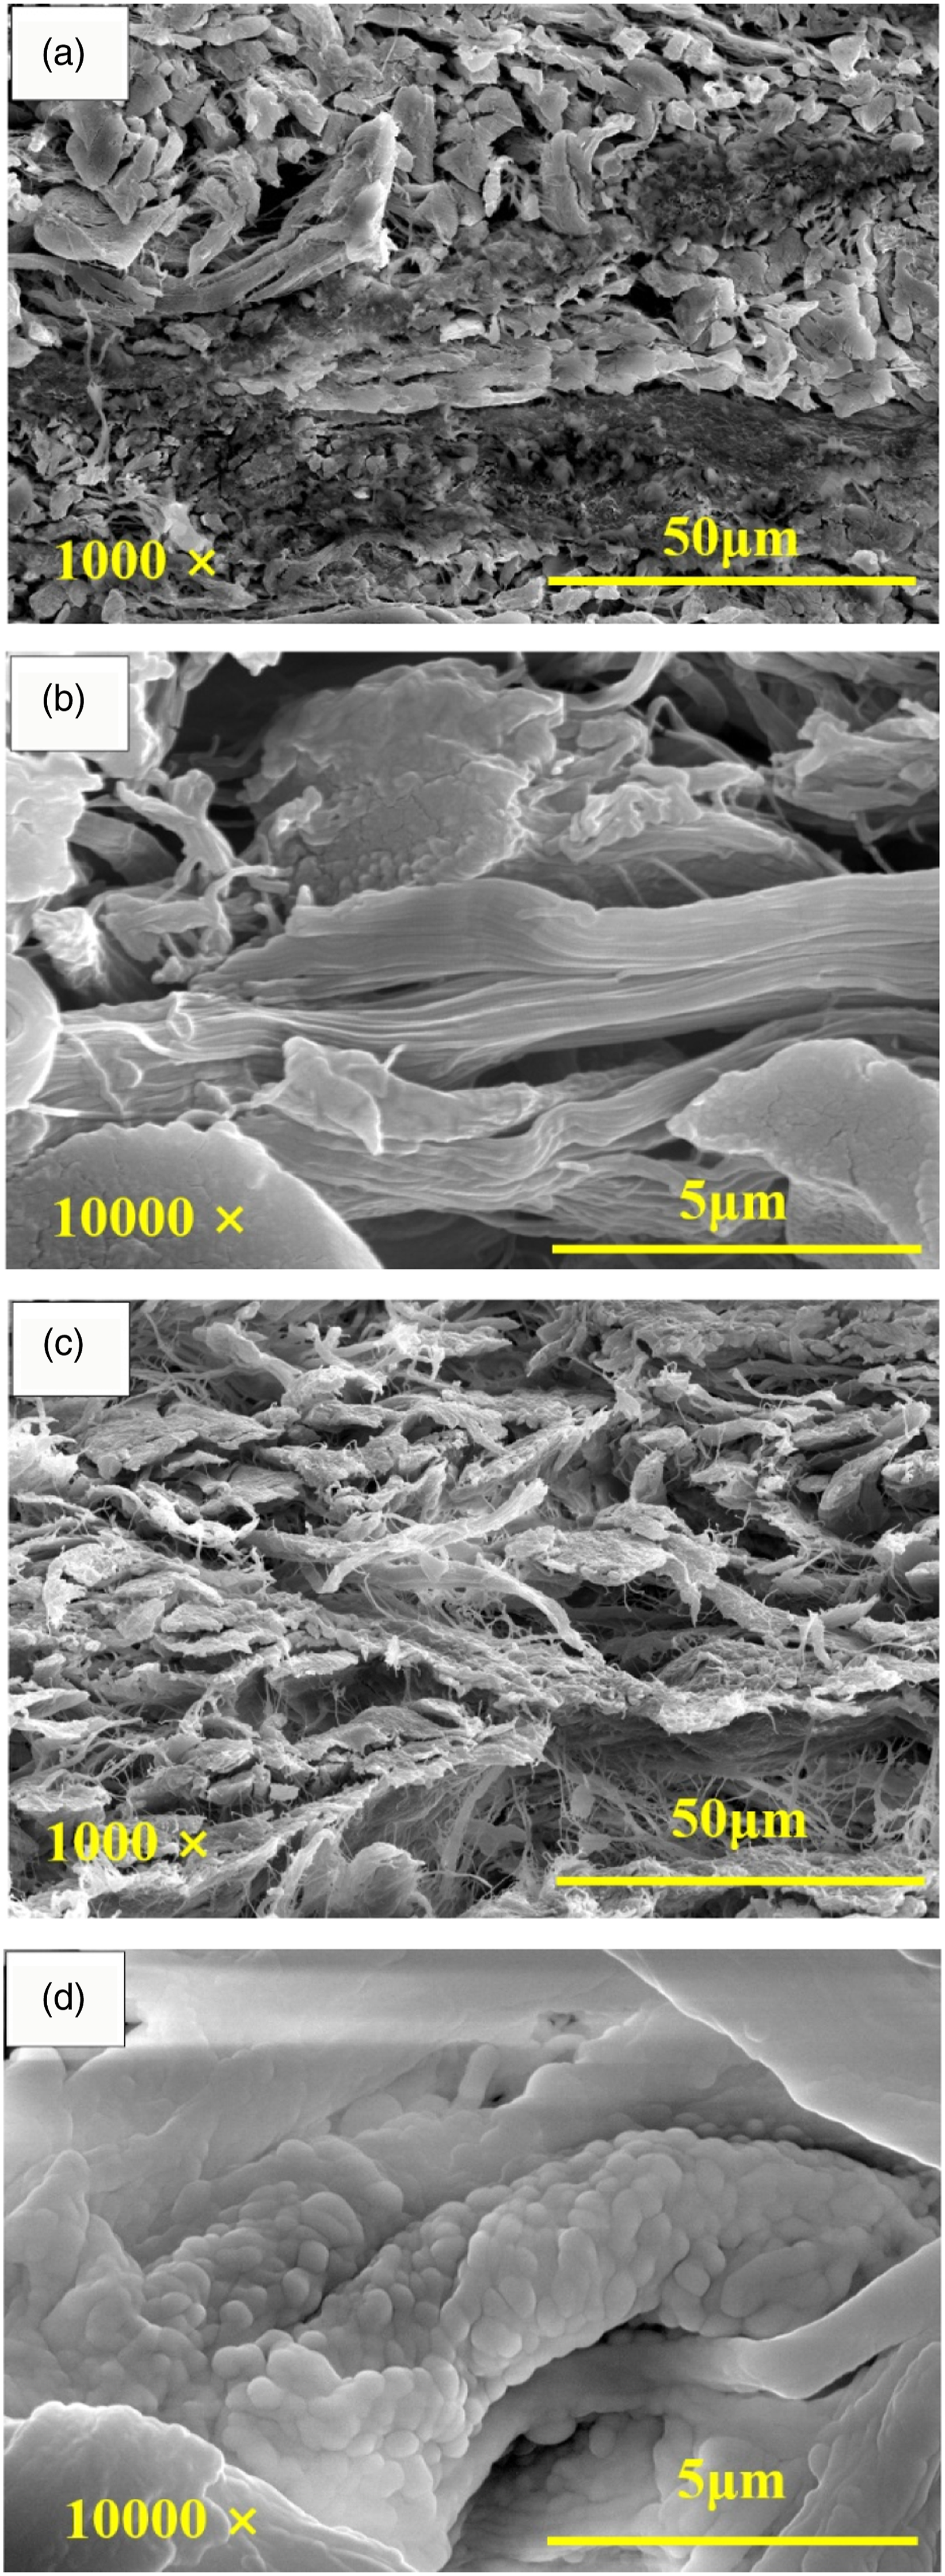
The stability of the PHCC material
The thermal stability diagram of the PHCC material is shown in Figure 7(a). Compared with that of BCTL, the glass transition temperature (Tg) of the PHCC material was increased by 14.8°C. As the material slowly underwent endothermic softening, the apparent softening denaturation temperature was observed at approximately 352°C. The Tg of the PHM was at 107°C, and they were solidified and occupying the space between collagen fibers, which improves the thermal stability of the PHCC material. To further verify the change of fiber crosslinking degree of PHCC material, the measured XRD curve is shown in Figure 7(b). The collagen fiber of BCTL has two characteristic peaks. The first peak (2θ = 7.8°) is the skeleton distance peak, which represents the distance between peptide chains without side chain. The second peak(2θ = 19.5°) is the side chain distance peak, which represents the distance between collagen composite helix chains.
39
The PHCC filled with PHM still has two characteristic peaks, but the peak intensity decreases and the peak position moves forward. This shows that the collagen fibers in the PHCC material are more disordered and the collagen fibers are more dispersed. The relative crystallinity of PHCC obtained by XRD data analysis is 10.7%, while the relative crystallinity of control sample BCTL is 15.3%. The structure of skin fiber is complex, which contains amorphous components and collagen spiral structure with high crystallinity, so the XRD diagram of skin collagen shows semi-crystalline distribution. After PHM filling, the internal fibers of PHCC were cross-linked, and the degree of order and crystallinity decreased. This may be due to the fact that PHM permeates into the fibers and forms a cross-linking network with collagen fibers through Coulomb interaction or hydrophobic interaction, which enhances the ability to resist fiber drying and bonding, resulting in an increase in the proportion of amorphous fibers and a decrease in crystallinity. DSC diagram (a) and XRD diagram (b) of samples. (1): PHCC; (2): BCTL.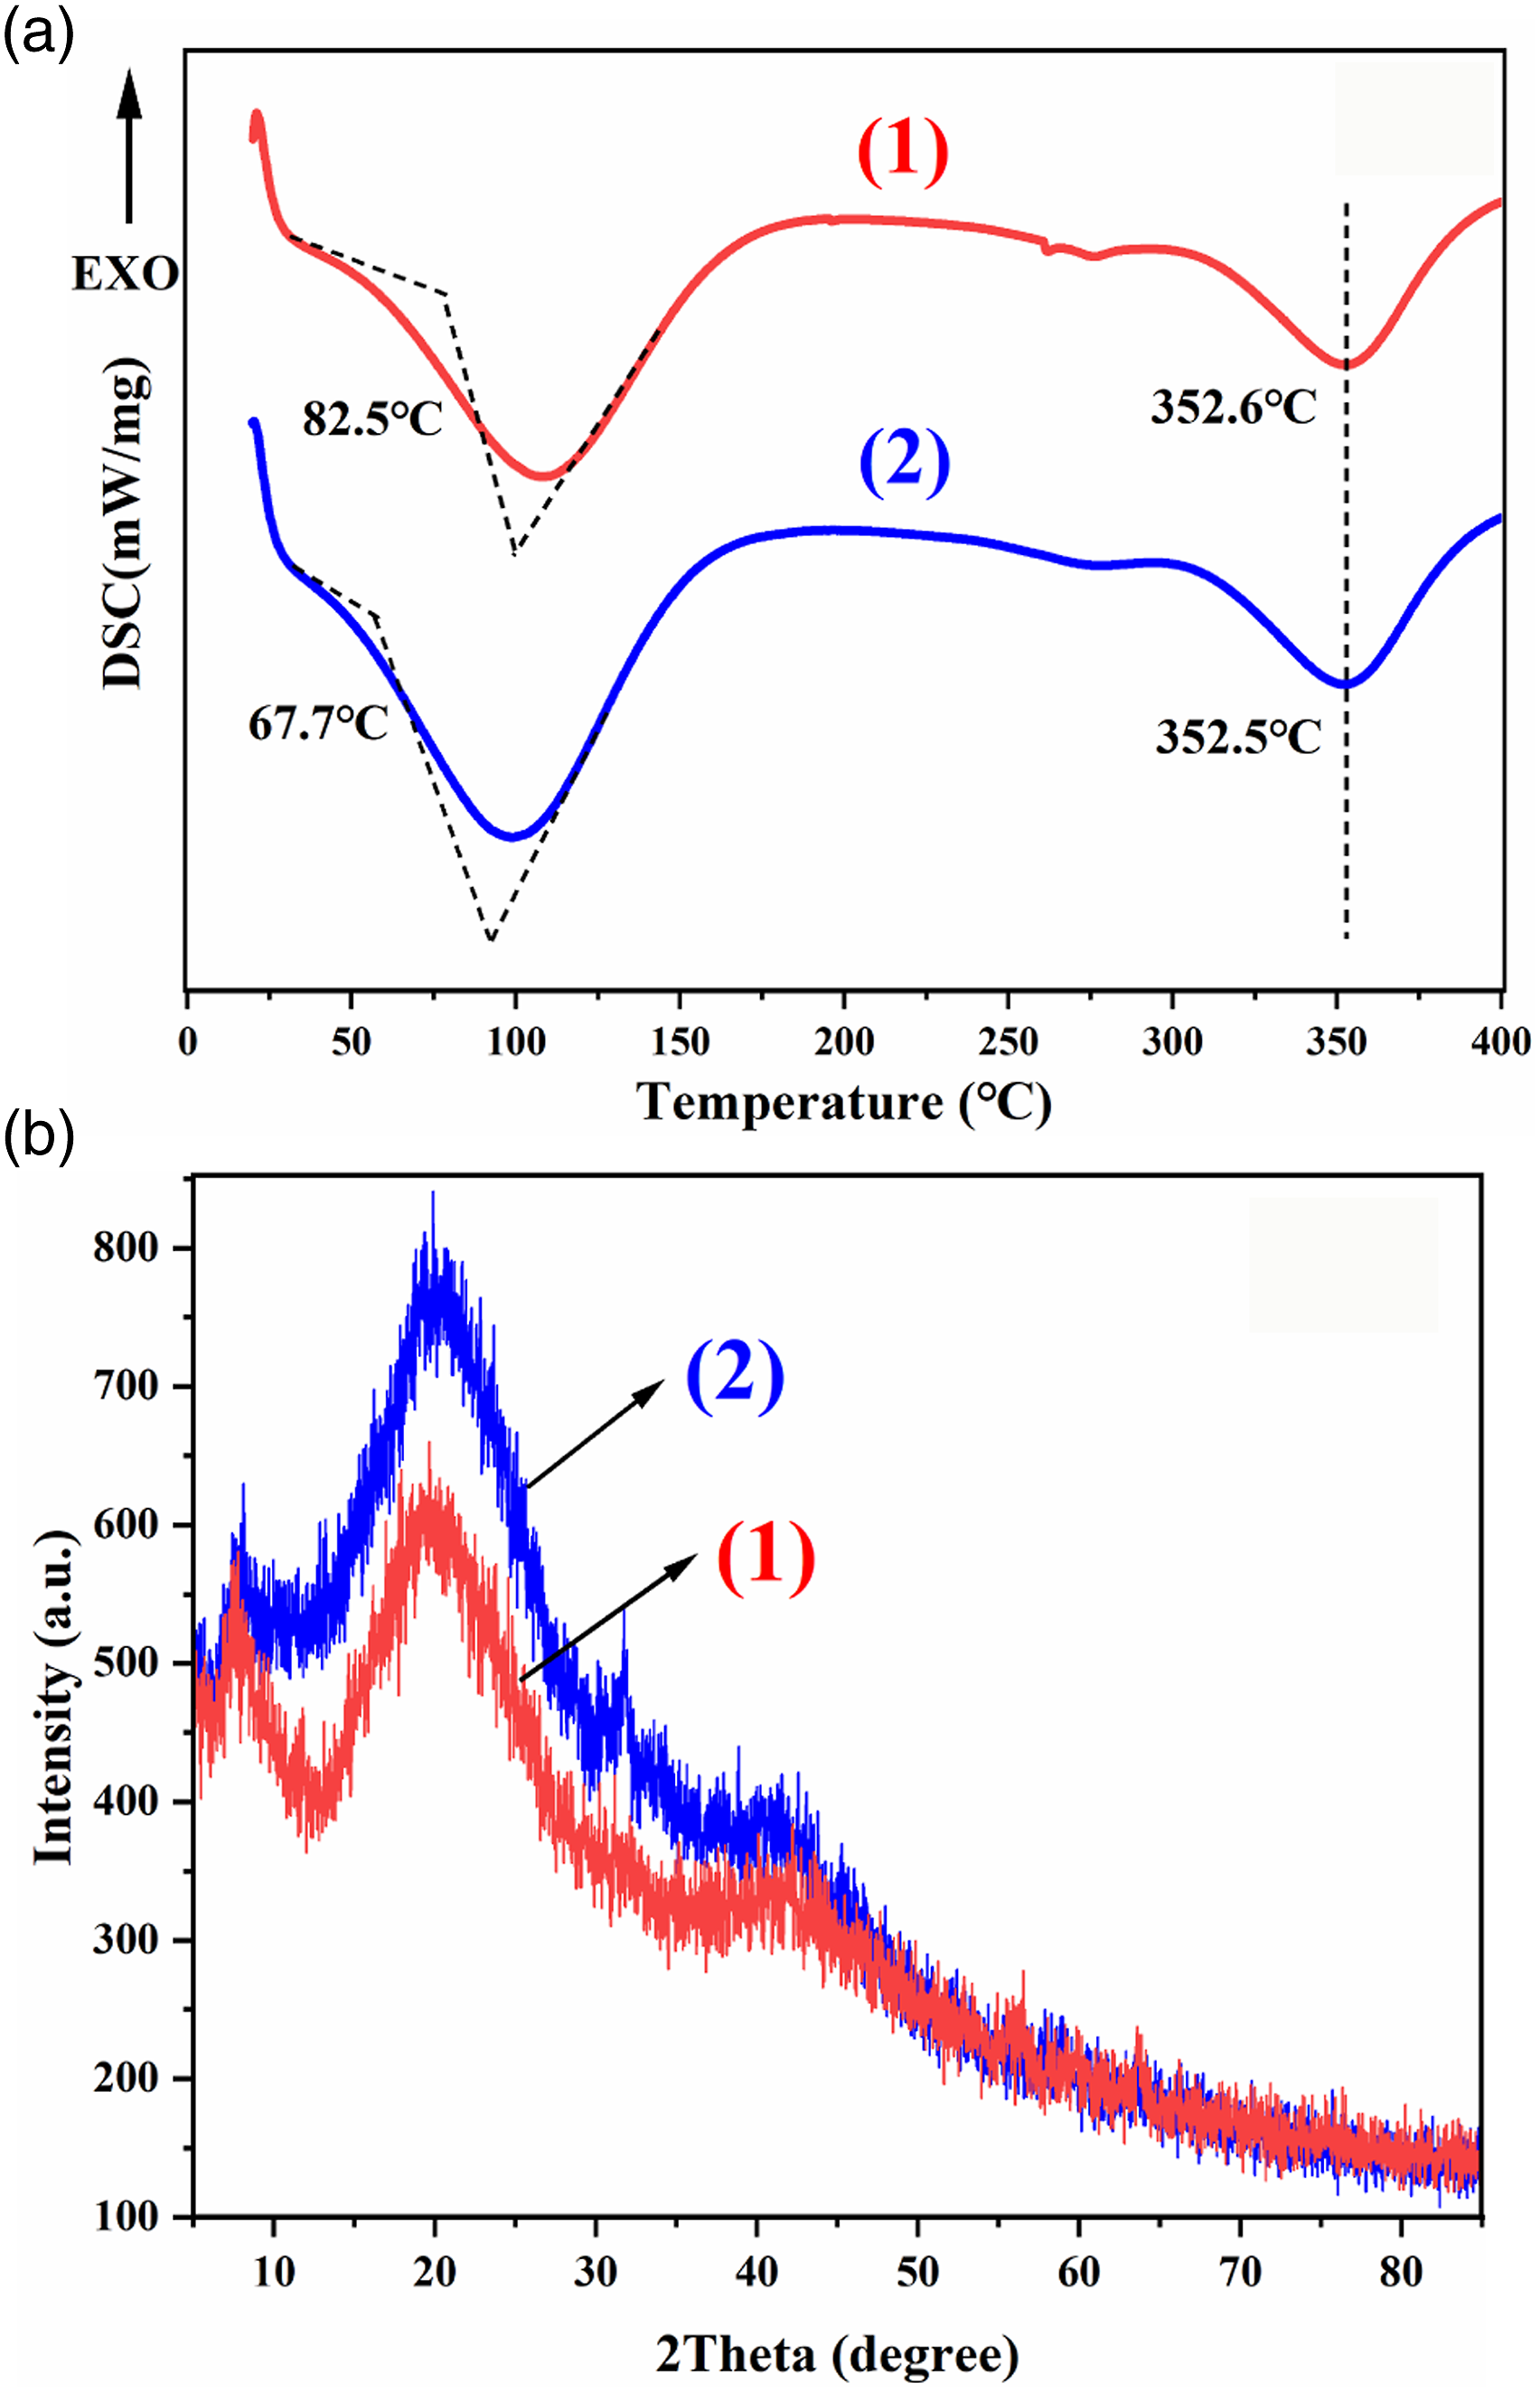
Physical and mechanical properties of the PHCC material
After the PHM enter the collagen fiber network structure, a special stabilization effect occurs, which makes the leather fibers cross-link and solidify, and increases the tensile strength, tear strength and humidity and heat stability of the material (see Figure 8). This is because the PHM occupy the spaces between the fibers, supporting the collagen fibers. PHM and collagen fibers formed a cross-linked network with different forces, which enhanced the fiber’s resistance to deformation and resistance to external forces, which was consistent with the DSC images. In Figure 8(d), the corresponding elastic modulus was calculated according to the stress-strain curve of the material. The elastic modulus of PHCC was 0.0337 mPa and the elastic modulus of BCTL was 0.0265 mPa. PHM increases the rigidity module of the PHCC fiber network, resulting in an increase in its elastic modulus. Compared with BCTL, the shrinkage temperature (Ts) of PHCC material was increased by 5.3°C. It can be seen from Figure 4(a)and (b) that PHM has good thermal stability, delaying the moisture-heat shrinkage of PHCC, and preventing shrinkage during drying, and giving the leather a thickening and plumping effect. PHM supports and cross-links collagen fibers, reducing the density of the material, resulting in a lightweight effect. Due to the hydrophobicity and filling properties of polystyrene materials, the water swelling resistance of polystyrene materials was reduced. The softness of the PHCC material is decreased slightly with fiber coarsening (see Figure 6 (d)).
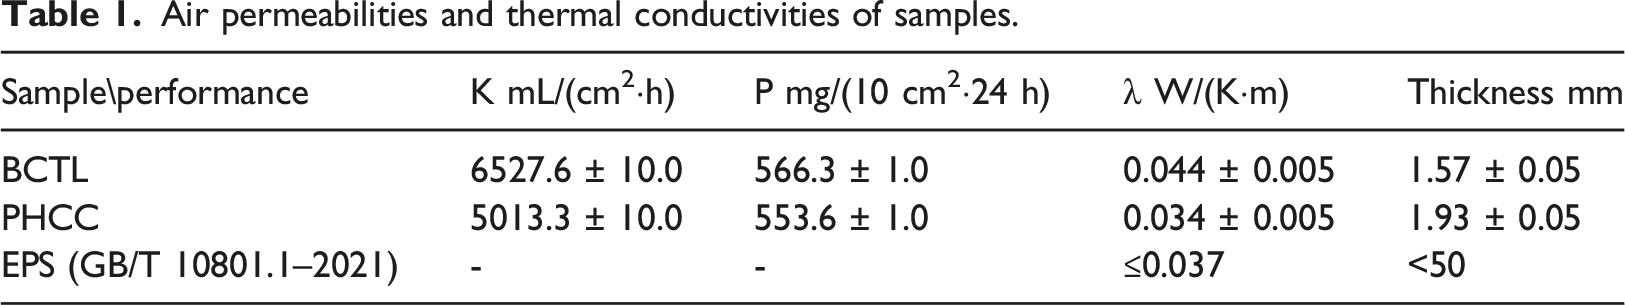
Air permeability and thermal conductivity of the PHCC material
Air permeabilities and thermal conductivities of samples.
Sound insulation performance of the PHCC material
The sound absorption properties of the samples are shown in Figure 9. BCTL and PHCC materials have obvious sound insulation and noise reduction performance, especially in the range of 2500–5000 HZ. Compared with BCTL, the PHCC material has a better noise reduction performance. Skin collagen is a natural material with a three-dimensional network structure and high porosity, and PHM changes the dispersibility and stiffness of collagen fibers. The sound absorption principle is similar to that of the Helmholtz resonant cavity. The irregularly shaped pores in the collagen are many resonant cavities. Different pores absorb sound waves of different frequencies. The air cavities in the PHM can absorb more sound waves and incident sound waves. These incident sound wave can facilitate resonance with the air in the air cavity, thus reducing the incident sound energy.
15
The skin collagen material has a small thickness and good air permeability, and part of the incident sound waves will pass through the air, which affects the sound insulation of the material.
40
The PHCC material is cured and cross-linked by PHM, and the microspheres are attached to the fiber surface and the gaps between the fibers, which increases the connection between the collagen fiber bundles and the layers so that the skin collagen material maintains flexibility and has an increased surface density, thereby increasing the air flow resistance. This also extends the time that the sound waves stay inside the material, resulting in the absorption of more sound energy. Therefore, a new type of noise reduction material with soft, lightweight and thin sound insulation has been developed, which has broad development prospects in the fields of life noise and traffic noise reduction. Sound transmission loss diagram (a) and sound loss rate (b). and sound absorption mechanism diagram (c) of materials. (1): BCTL; (2): PHCC.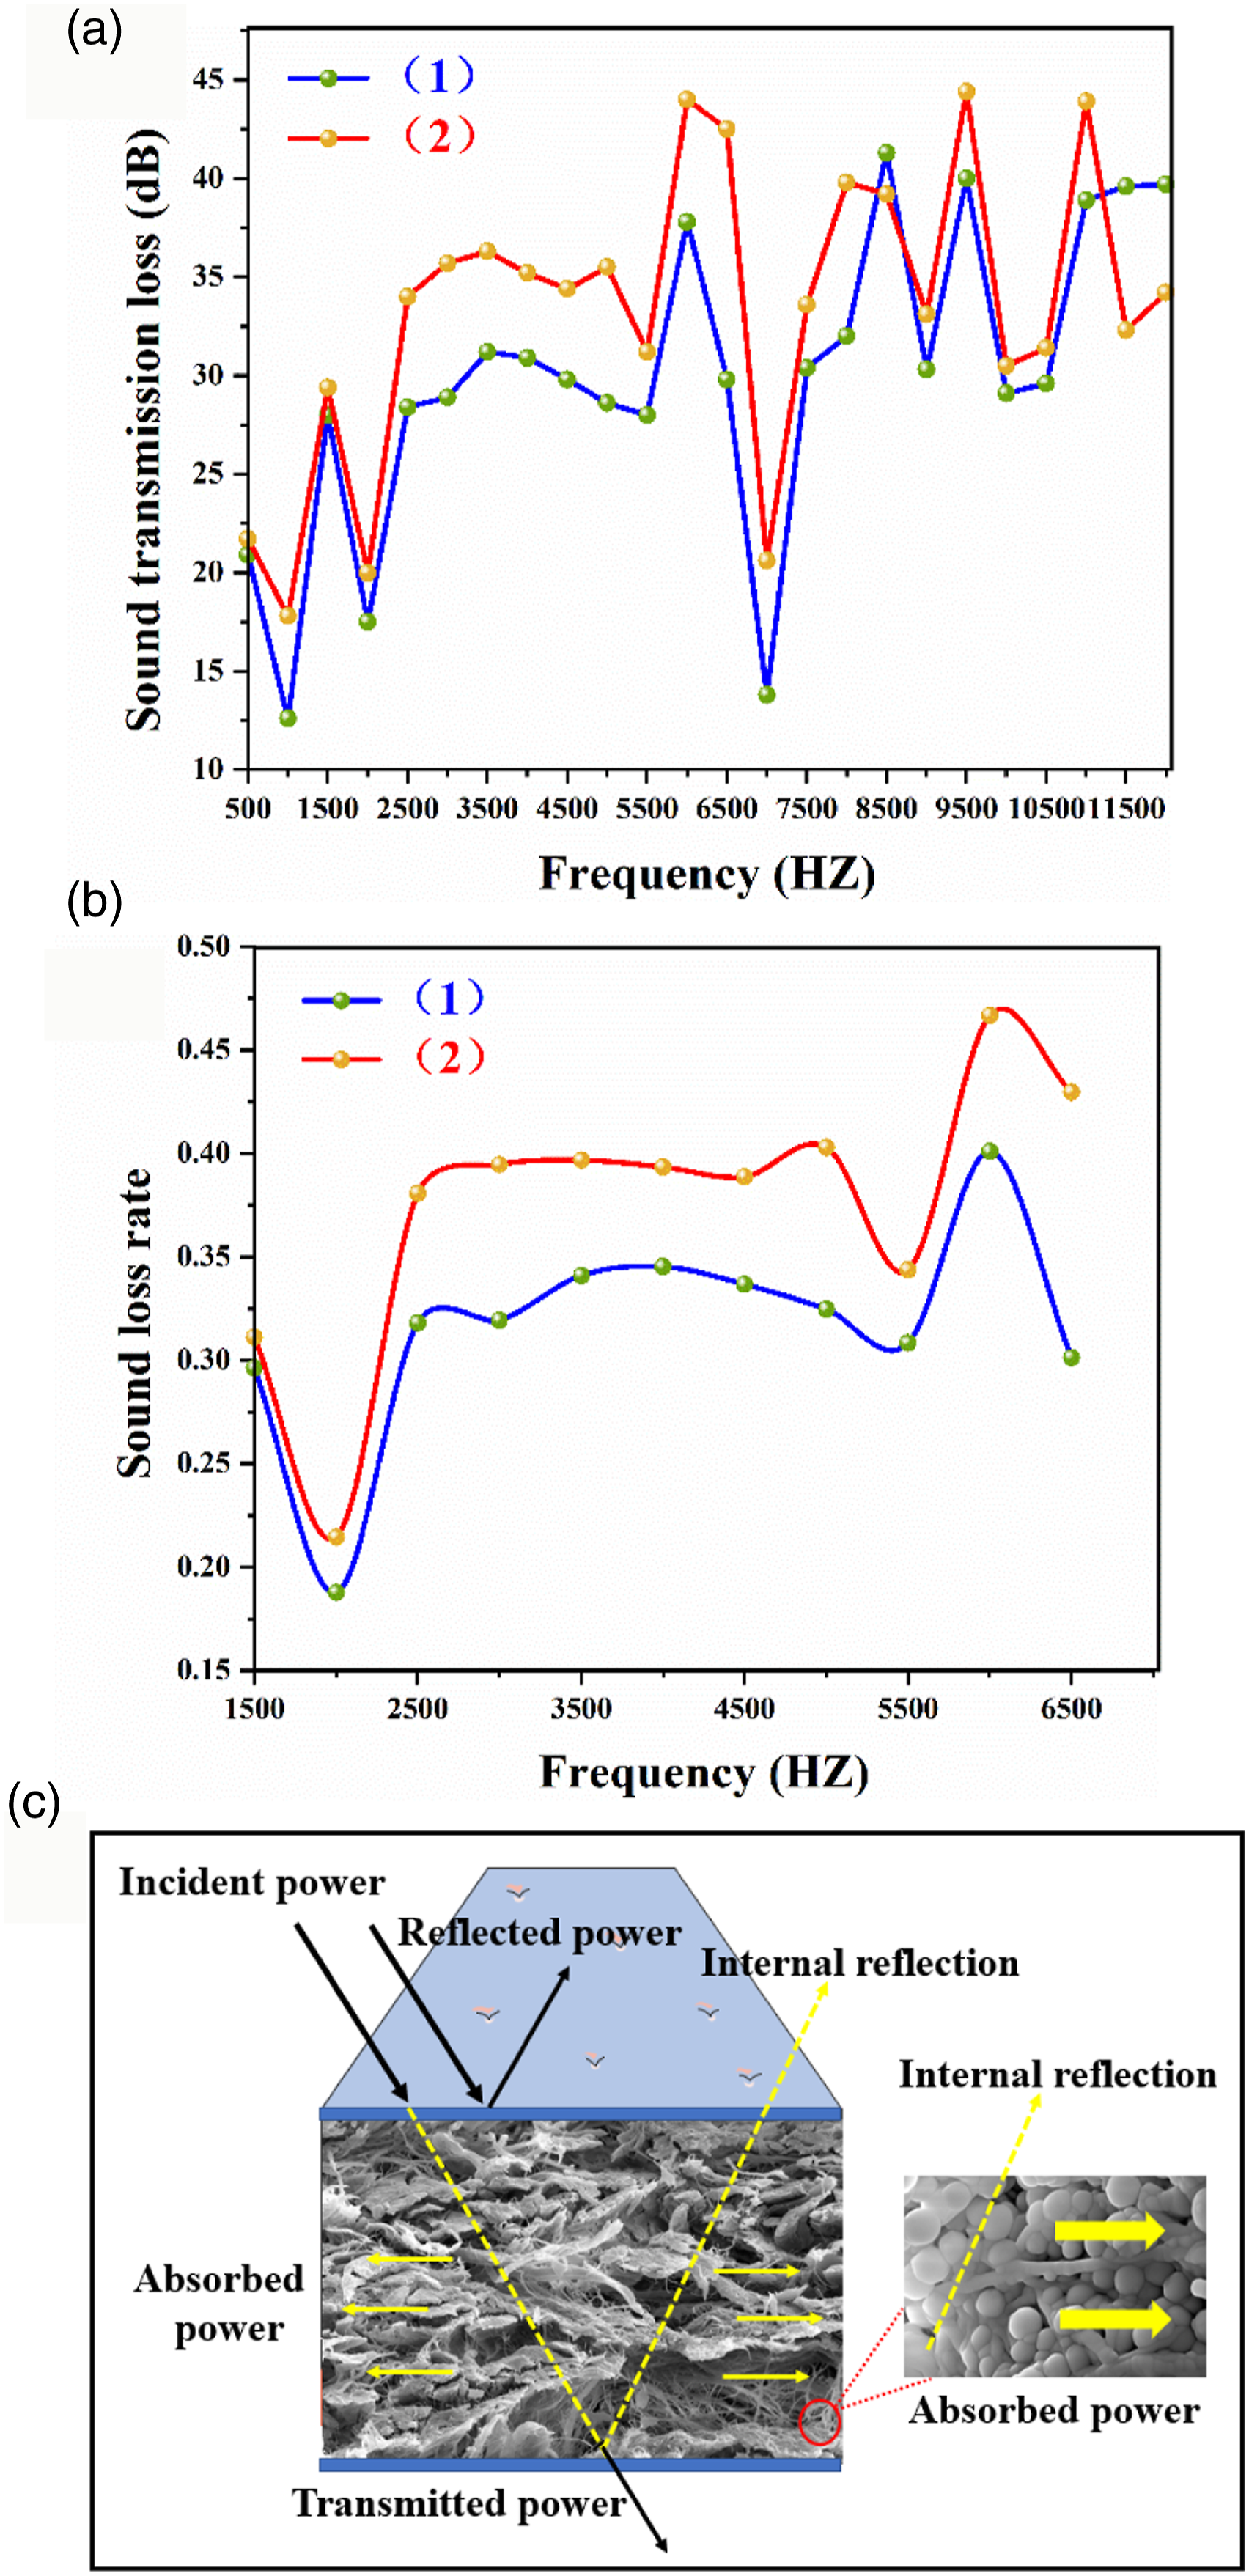
Chromaticity analysis of the PHCC material
It can be seen from the micrograph of the sample surface in Figure 10 that the animal skin material has natural texture, the surface is uneven, there are many small bumps, and the surface has a large roughness, which increases the diffuse reflection of light. The chromaticity and chromatic aberration of the sample are shown in Figure 10. The “L” value of the PHCC material was high, which was 4.3% higher than that of BCTL, indicating that the color brightness of the PHCC material increases. The values of “a” and “b” were negative, the material was light blue–green, and the chromaticity of the PHCC material has a tendency to drift toward yellow–green. There was a large color difference between the PHCC and BCTL materials, and ΔE was 3.47. It is verified that after the PHM cavitates the skin collagen, their unique hollow structure increases the diffuse reflection of the material to light so that the PHCC material has a good whitening effect. Chromaticity diagram and sample surface diagram of materials. (1): BCTL; (2): PHCC.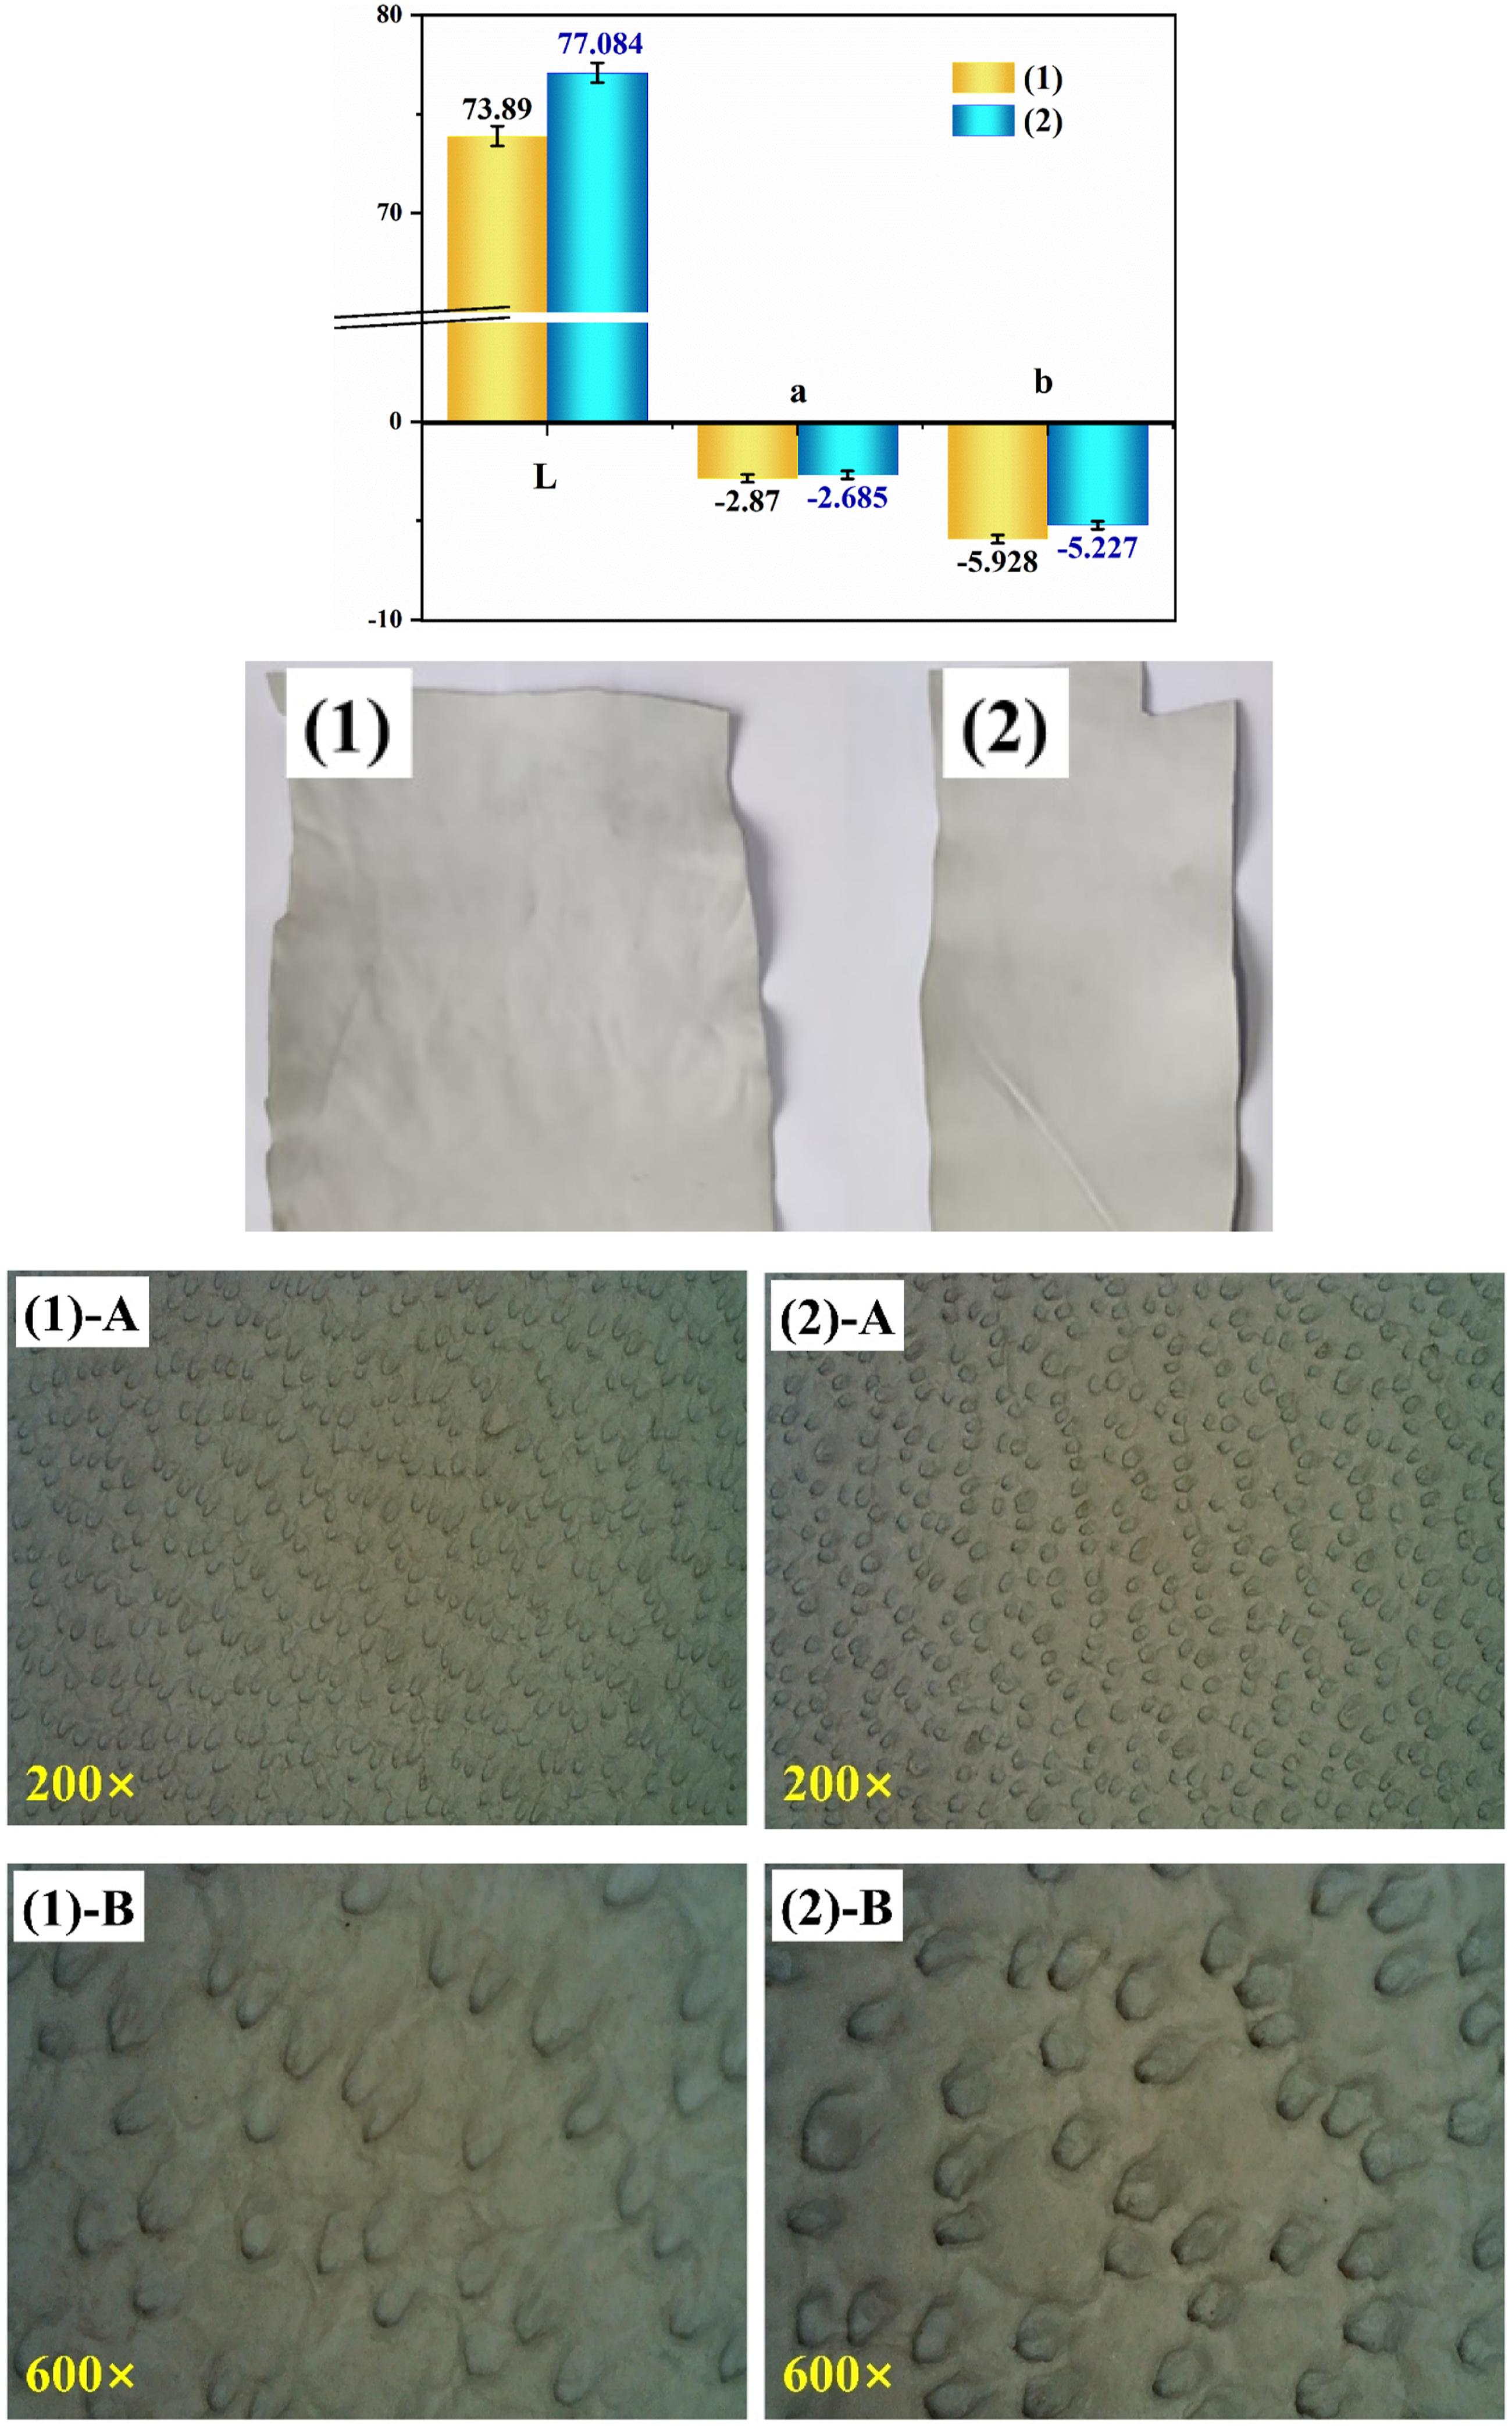
Conclusion
Using carboxyl-containing acrylic acid and acrylic ester as the core monomers and polystyrene as the shell layer, a microsphere emulsion was prepared by an alkali osmotic swelling method, and solid PHM was obtained after spray drying. As a cross-linking filler, the PHM was added to a skin collagen material to disperse and fix to obtain a PHCC material. Compared with those of conventional chrome tanned leather, the physical-mechanical strength, thermal stability and water resistance of the PHCC material are improved, while the natural breathability and water vapor permeability are retained. The PHCC material shows good thermal insulation performance, and the thermal conductivity is 0.035 W/(K·m), which meets the standard of polystyrene foam board for building materials. In the range of 2500 ∼ 6000 Hz, the sound transmission loss of the PHCC material reaches 35 ∼ 45 dB, which results in a good noise reduction effect. This provides a new approach for developing flexible sound absorption and heat insulation materials.
Footnotes
Declaration of conflicting interests
The author(s) declared no potential conflicts of interest with respect to the research, authorship, and/or publication of this article.
Funding
The author(s) disclosed receipt of the following financial support for the research, authorship, and/or publication of this article: This work was supported by Jiangsu Provincial Foundation: Key technology integration innovation and clean product development of leather making (SZ-XZ2017014).