
Abstract
With rapid industrialization and consumerism, production across sectors has surged. The textile and paper industries, lacking proper disposal methods, discharge organic waste into drains and water bodies. This study focuses on developing an effective photocatalyst for degrading toxic dyes in wastewater. MAX-Phase/CdS nanocomposites were synthesized via a thermal decomposition approach at 180°C for 1 h. The synthesized nanocomposites were characterized using XRD, FT-IR, Raman, and FE-SEM analysis. The prepared MAX-Phase/CdS nanocomposites have been explored for the degradation of methylene blue dye in aqueous solution. The MAX-Phase/CdS nanocomposite exhibits 97.8% removal efficiency in 60 min compared to the parent compound. A detailed investigation of the mechanism using scavenger studies. The MAX-Phase/CdS nanocomposite has the scope and potential to be an effective photocatalyst, aligning well with environmental concerns and suitable for industrial implementation.
Keywords
Introduction
In recent decades, the dye business has been overgrown. The dye industry is an important part of the textile, paper, chemical industries, and other fields. The textile dye industry currently produces about 3600 different textile dyes. 1 Over 8000 chemicals are used in various textile manufacturing processes, including dyeing and printing. Each year over 60,000 tons of dyes are released into the environment as waste. Hence, the management and handling of wastewater represent a complex and challenging issue that requires careful consideration to protect both human health and the ecosystem. Therefore, it is crucial to remove or address the industrial wastewater to enhance the water quality and environmental conditions. Various techniques have been utilized to address wastewater pollution, with photocatalysis being acknowledged as an effective approach for the degradation of organic substances found in wastewater. 2 The photocatalysis approach provides many advantages such as easy control, eco-friendly, cost-effective, and no secondary pollutants. 3
Semiconductor nanoparticles are reported to be an excellent candidate for the photocatalytic degradation of dyes and organic pollutants. 4 Among all the semiconductor nanomaterials, metal sulfide semiconductor nanoparticles show their electrical and optical characteristics, which makes them distinctive and remarkable. Because of their exceptional features and potential uses in various applications such as catalysis, optoelectronic devices, energy systems, and biology, they have received a lot of attention. Metal sulfide semiconductor nanoparticles such as CdS, ZnS, PbS, and SnS2 capture light in the visible and near-infrared ranges, allowing them to serve as visible-light-driven photocatalysts or sensitizers for narrow bandgap semiconductors. 5 Several attempts have been made to personalize the setup of the catalysts on a nanoscale dimension to achieve the vital photocatalytic efficiency necessary for the catalysts. Single nanoparticle systems suffer from certain limitations in their performance due to low stability. To address these issues researchers have proposed the use of two or more nanomaterials in combination (nanocomposite) to improve the performance of the system. The dispersion of the nanoparticles over the substrate enhances the surface area and active sites of the photocatalyst.
CdS is an optically active semiconductor material with a suitable bandgap (2.4 eV). CdS nanoparticles capture light in the visible and near-infrared ranges, which makes them suitable for use as visible-light-driven sensitizers in broadband gap semiconductors. However, the CdS suffers from the limitations of cost and stability. This issue can be resolved by the dispersion of CdS nanoparticles on a suitable substrate. A recent material MAX-Phase is a stable material used as a precursor for MXenes. It has a chemical formula Mn + 1AXn with specific elements. In MAX-Phases, Mn + 1Xn units and layers are stacked in hexagonal structures. MXenes-based nanocomposites are used for various applications such as electrocatalysis, photocatalysis, lithium-ion batteries, supercapacitors, biomedicine, and many more. 6 The Mxenes and MXenes-based composites have been explored in the photocatalytic degradation of organic pollutants. However, the potential of the MAX-Phase as a catalyst few reports for the removal of organic pollutants and antibiotics have been reported available by researchers.7–9 But, the problem with the MAX-Phase is it does not have a good adsorption capacity. 10 So, this problem can be resolved by incorporating sensitizer materials with good adsorption capacity. As MAX-Phase has a high surface area it is used as substrate and CdS is used as a sensitizer over the substrate of MAX-Phase.
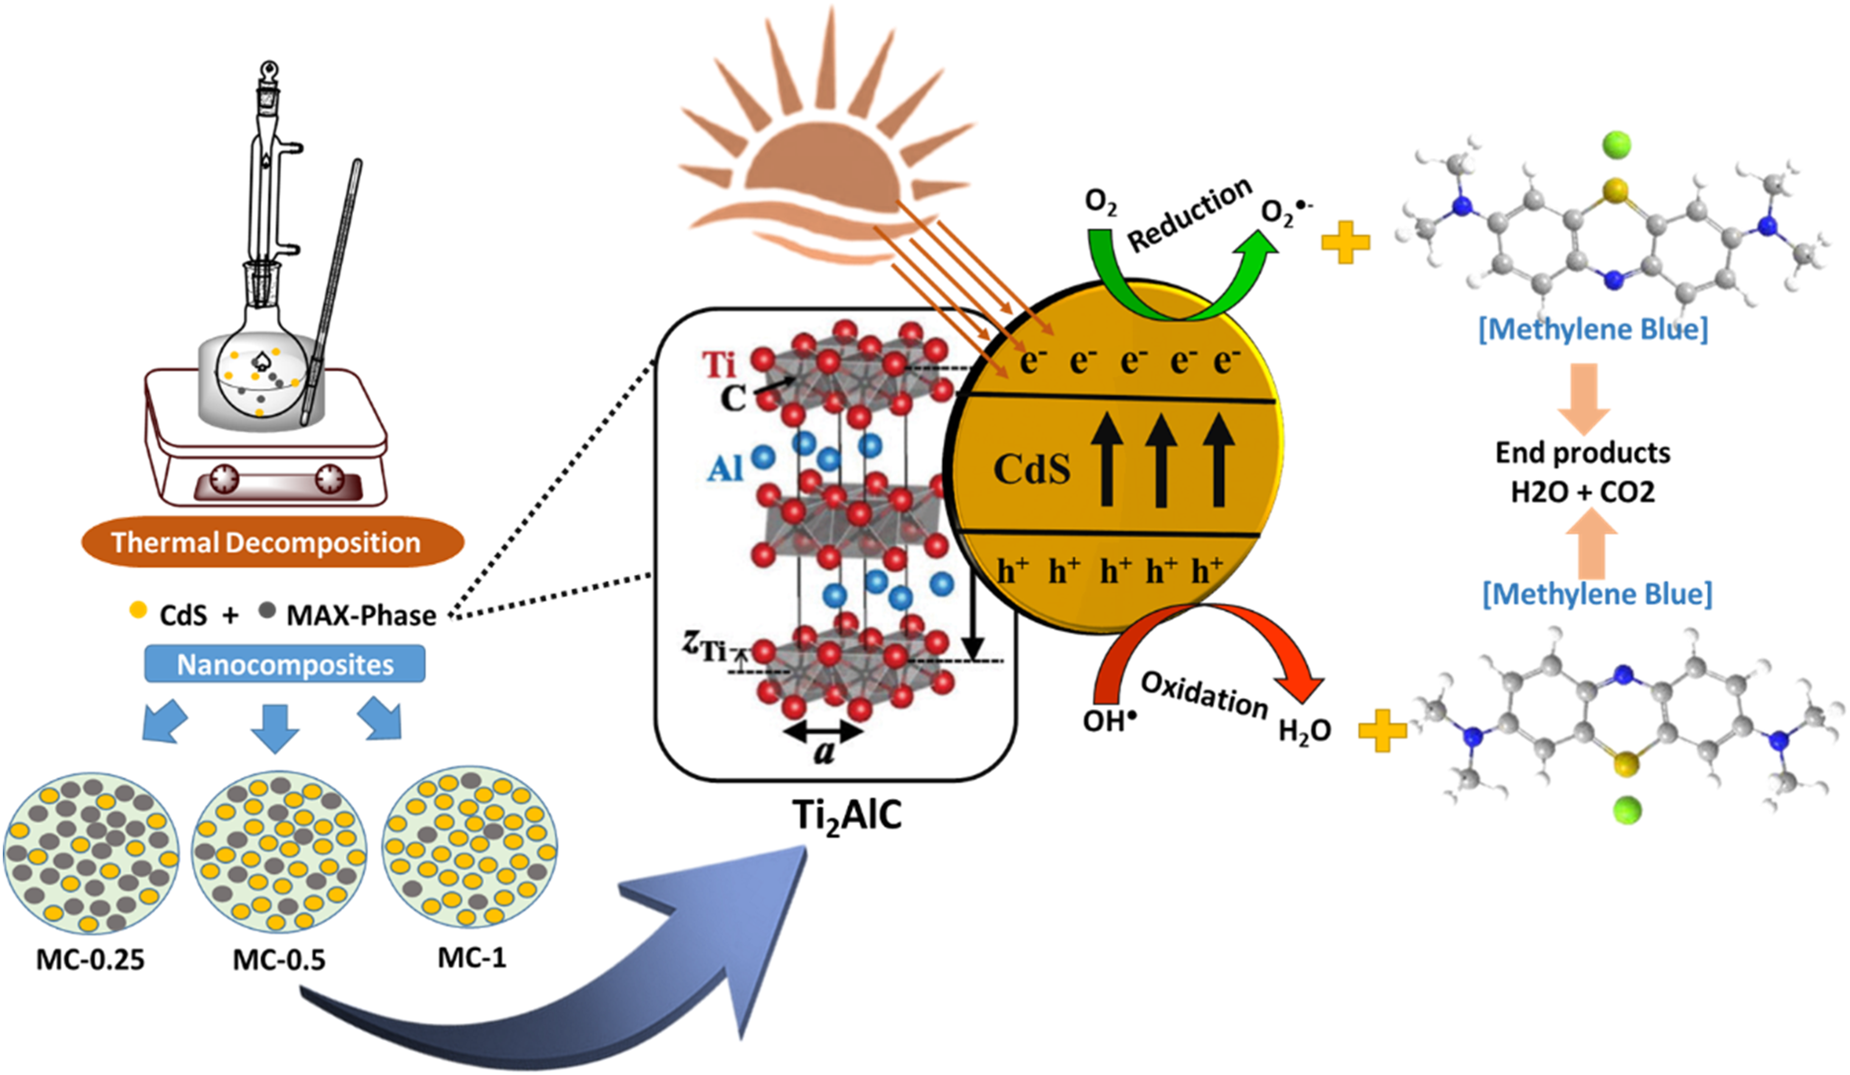
The present study reports the synthesis of MAX-Phase/CdS nanocomposites by thermal decomposition approach and their application in the photocatalytic degradation of industrial wastewater. Aims to develop a low-cost MAX-Phase-supported CdS photocatalyst, with a minimum loading of CdS. Which improves the performance of the photocatalytic efficiency and has better economic and environmental aspects. The present study also shows a detailed investigation of the mechanism supported by the scavenger study.
Experimental section
Reagents
Cadmium acetate dehydrate (SRL 99% purity), thioacetamide (SRL purity 99%), ethylene glycol (Sigma Aldrich 99%), MAX-Phase (Ti2AlC), Methylene blue (Merck), ammonium oxalate monohydrate (Finar), isopropanol (Finar 99%), p- Benzoquinone (Sigma-Aldrich 98%), silver nitrate LR (ACS chemicals 98%), and methanol (Finar Chemicals, India). Distilled water was used in photocatalytic experiments.
Synthesis of MAX-Phase/Cds nanocomposites
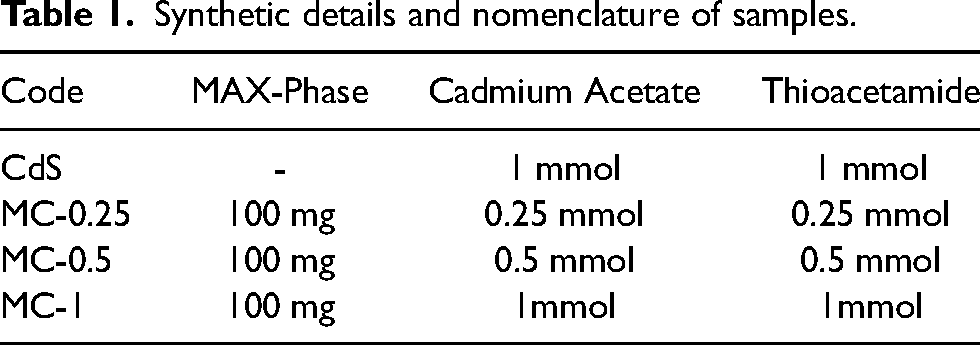
MAX-Phase/CdS nanocomposites were synthesized using the thermal decomposition method. To prepare MAX-Phase/CdS nanocomposites, different amounts of cadmium acetate, thioacetamide, 100 mg of MAX-Phase, and 10 ml of ethylene glycol were added into the round bottom flask. Then the mixture was refluxed at 180° C for 1 h. The different colored slurry confirms the formation of MAX-Phase/CdS nanocomposites. The slurry was cooled at room temperature and in excess of methanol, and then centrifuged. The precipitate was dried in an oven at 80° C overnight. The same approach is used for the preparation of CdS nanoparticles in the absence of the MAX-Phase. Table 1 shows the synthetic details and nomenclature of the prepared nanocomposites.
Synthetic details and nomenclature of samples.
Photocatalytic studies
The photocatalytic performance of the MAX-Phase, CdS, and MC nanocomposites was monitored using UV-visible spectroscopy. Methylene Blue (MB) was chosen as the model dye for degradation studies. For photocatalytic degradation studies the 1 mg/ml catalyst was added to a dye solution (10 ppm) of MB and was sonicated for 15 min for uniform dispersion. The dispersed solution was kept in the dark for 30 min to attain adsorption-desorption equilibrium. After the dark attainment, the solution was kept in a visible light source (10 W Syska LED light) for 60 min for the degradation of the dye. For kinetic studies, the solution was centrifuged for five-minute intervals the supernatant was collected and analyzed using a UV-visible spectrophotometer by measuring the absorption peak at λmax = 662 nm. The adsorption and photocatalytic degradation efficiency was calculated using the following formula.


Where, C0 = concentration of blank dye, C0 = concentration at equilibrium, Ct = final concentration after degradation
To explore the effect of dosage on the photodegradation of MB, degradation studies were carried out at different dosages. To identify the primary species participating in the degradation, scavenger studies were conducted in the presence and absence of scavengers. For a scavenger study, 1 mmol of AO, IPA, AgNO3, and 0.1 mmol of BQ were added MB solution. To find the stability of the photocatalyst regenerability studies were carried out. The treated photocatalyst was washed with water and methanol several times and performed the XRD and FT-IR analyses. The COD analysis has been done by reflux digestion and titration method. 11
Characterization
The prepared samples were characterized for phase, functional groups, and morphology. XRD patterns were recorded using PANalytical X’Pert Pro diffractometer at 30 mA and 40 kV using Cu Kα radiation (λ = 1.53 Å) in the 10–80 degrees 2θ range. Functional groups analysis was conducted using FT-IR spectroscopy Spectrum 2 (Perkin Elmer) in a range of 400–4000 cm−1 under ATR mode. The vibrational modes Raman analysis was conducted using a Renishaw spectrometer in a range of 300–3000 cm−1. The morphological analysis was conducted using a field emission scanning electron microscope (FE-SEM) by ZEISS ultra 55 instruments. For photocatalytic degradation studies, UV-visible spectra were recorded using LABINDIA's UV-visible spectrometer instrument in the 200 nm to 800 nm range.
Result & discussion
The synthesized materials were characterized and explored as photocatalysts; the results are discussed as follows.
Characterization of Cds-MAX-Phase nanocomposites
XRD analysis
XRD patterns of MAX-Phase, CdS, and their nanocomposites are shown in Figure 1. MAX-Phase Bragg reflection at 13.9°, 39.5°, 52.8°, 60.5°, 71.5°, and 74.7° are related miller indices to (002), (103), (106), (110), (109), (116) planes. The (002), (103) and (110) peaks correspond to the Ti2AlC, which may incomplete the etching of Al, Ti, and TiC in the MAX-Phase. The Bragg reflection peaks of CdS at 26.2°, 43.9°, and 51.7° are matched miller indices to (111), (200), and (311) planes respectively. 12 CdS's cubic structure appears in the XRD pattern and is well-matched to the JCPDS data card 80-0006. The XRD pattern of the MC nanocomposites Bragg reflection patterns at 26.5°, 43.8°, and 26.48° are related to Miller's indices to (002), (103), (111), (200), and (311) positions confirming the presence of MAX-Phase and CdS. The nanocomposites show both parent materials’ characteristic peaks confirming the formation of nanocomposites.
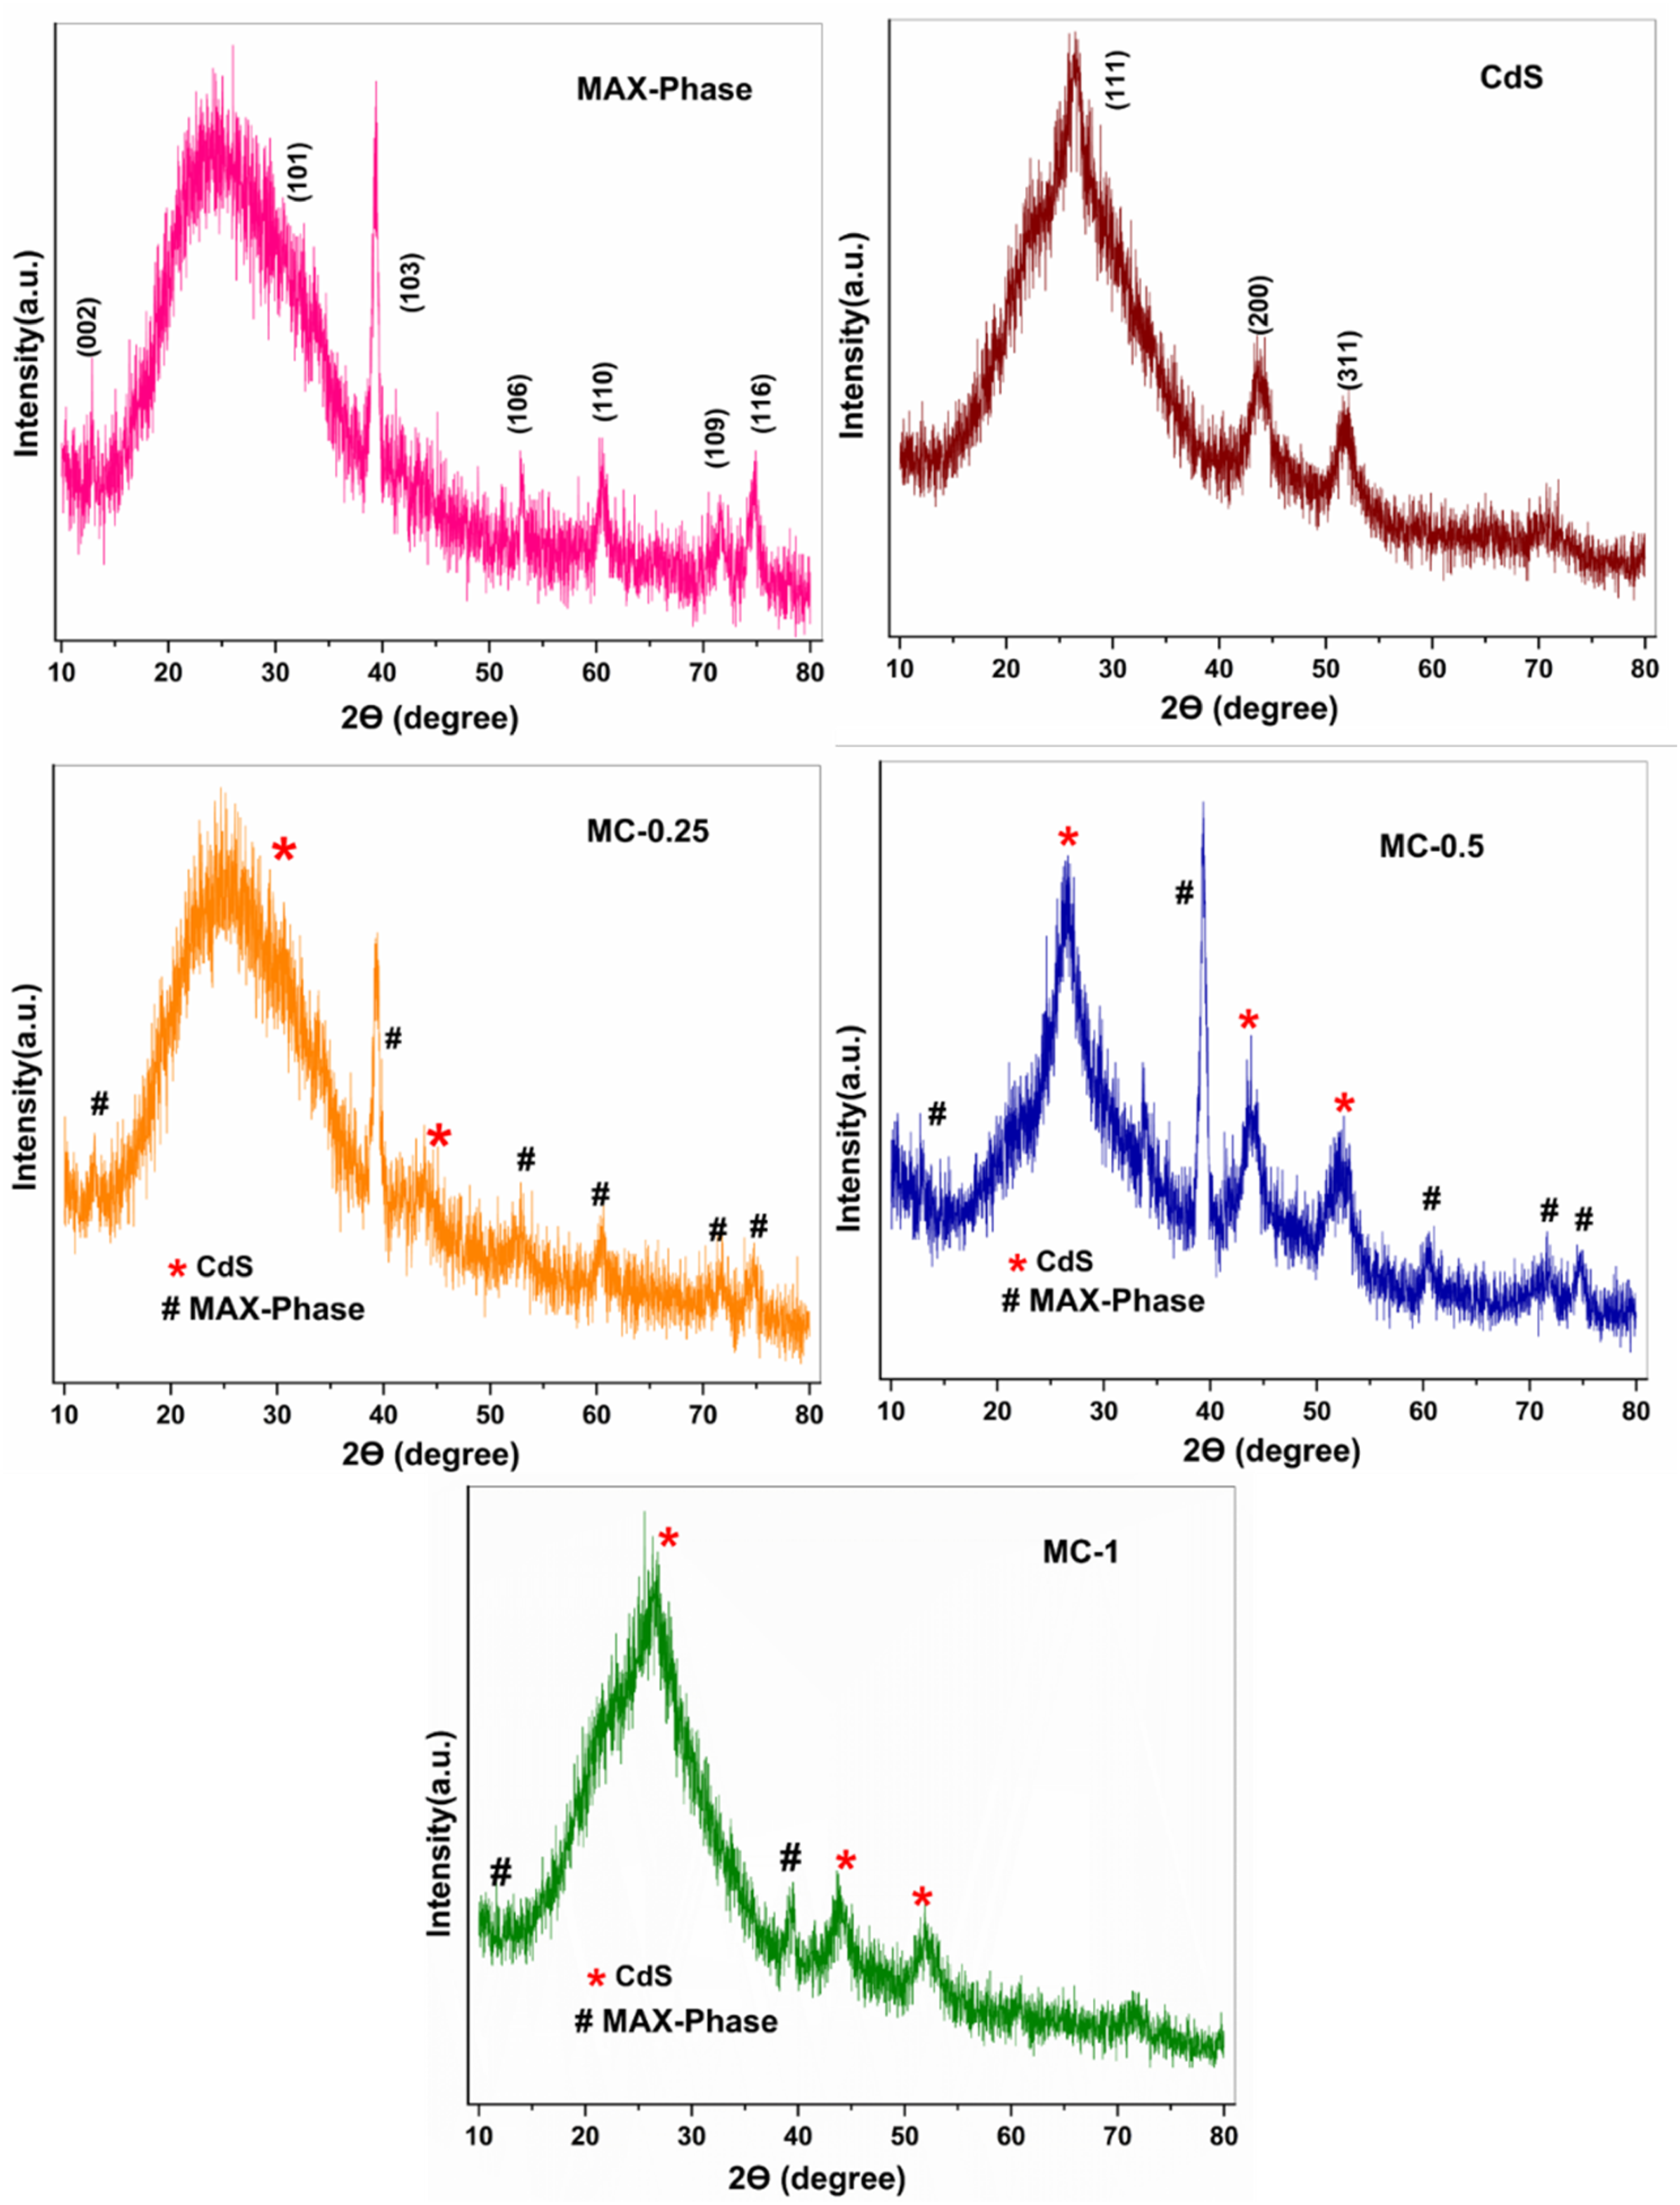
XRD patterns of MAX-Phase, CdS, and their nanocomposites.
Raman analysis
Figure 2 shows the Raman spectra for MAX-Phase, CdS, and its nanocomposites. The Raman spectrum of CdS nanoparticles shows well-resolved peaks at 301 and 609 cm−1, which correspond to first and second-order longitudinal optical (LO) phonon modes scattering, respectively. 13 MAX-Phase exhibits broad peaks at 1300 and 1600 cm−1, due to D and G peaks of graphitic carbon indicating the presence of carbon and disorder in the sample. 14 The nanocomposite sample shows the presence of vibrational peaks for both the parent compounds confirming the formation of nanocomposites. MC-1 and MC-0.5 nanocomposites MAX-Phase were not visible because of the high concentration of CdS.
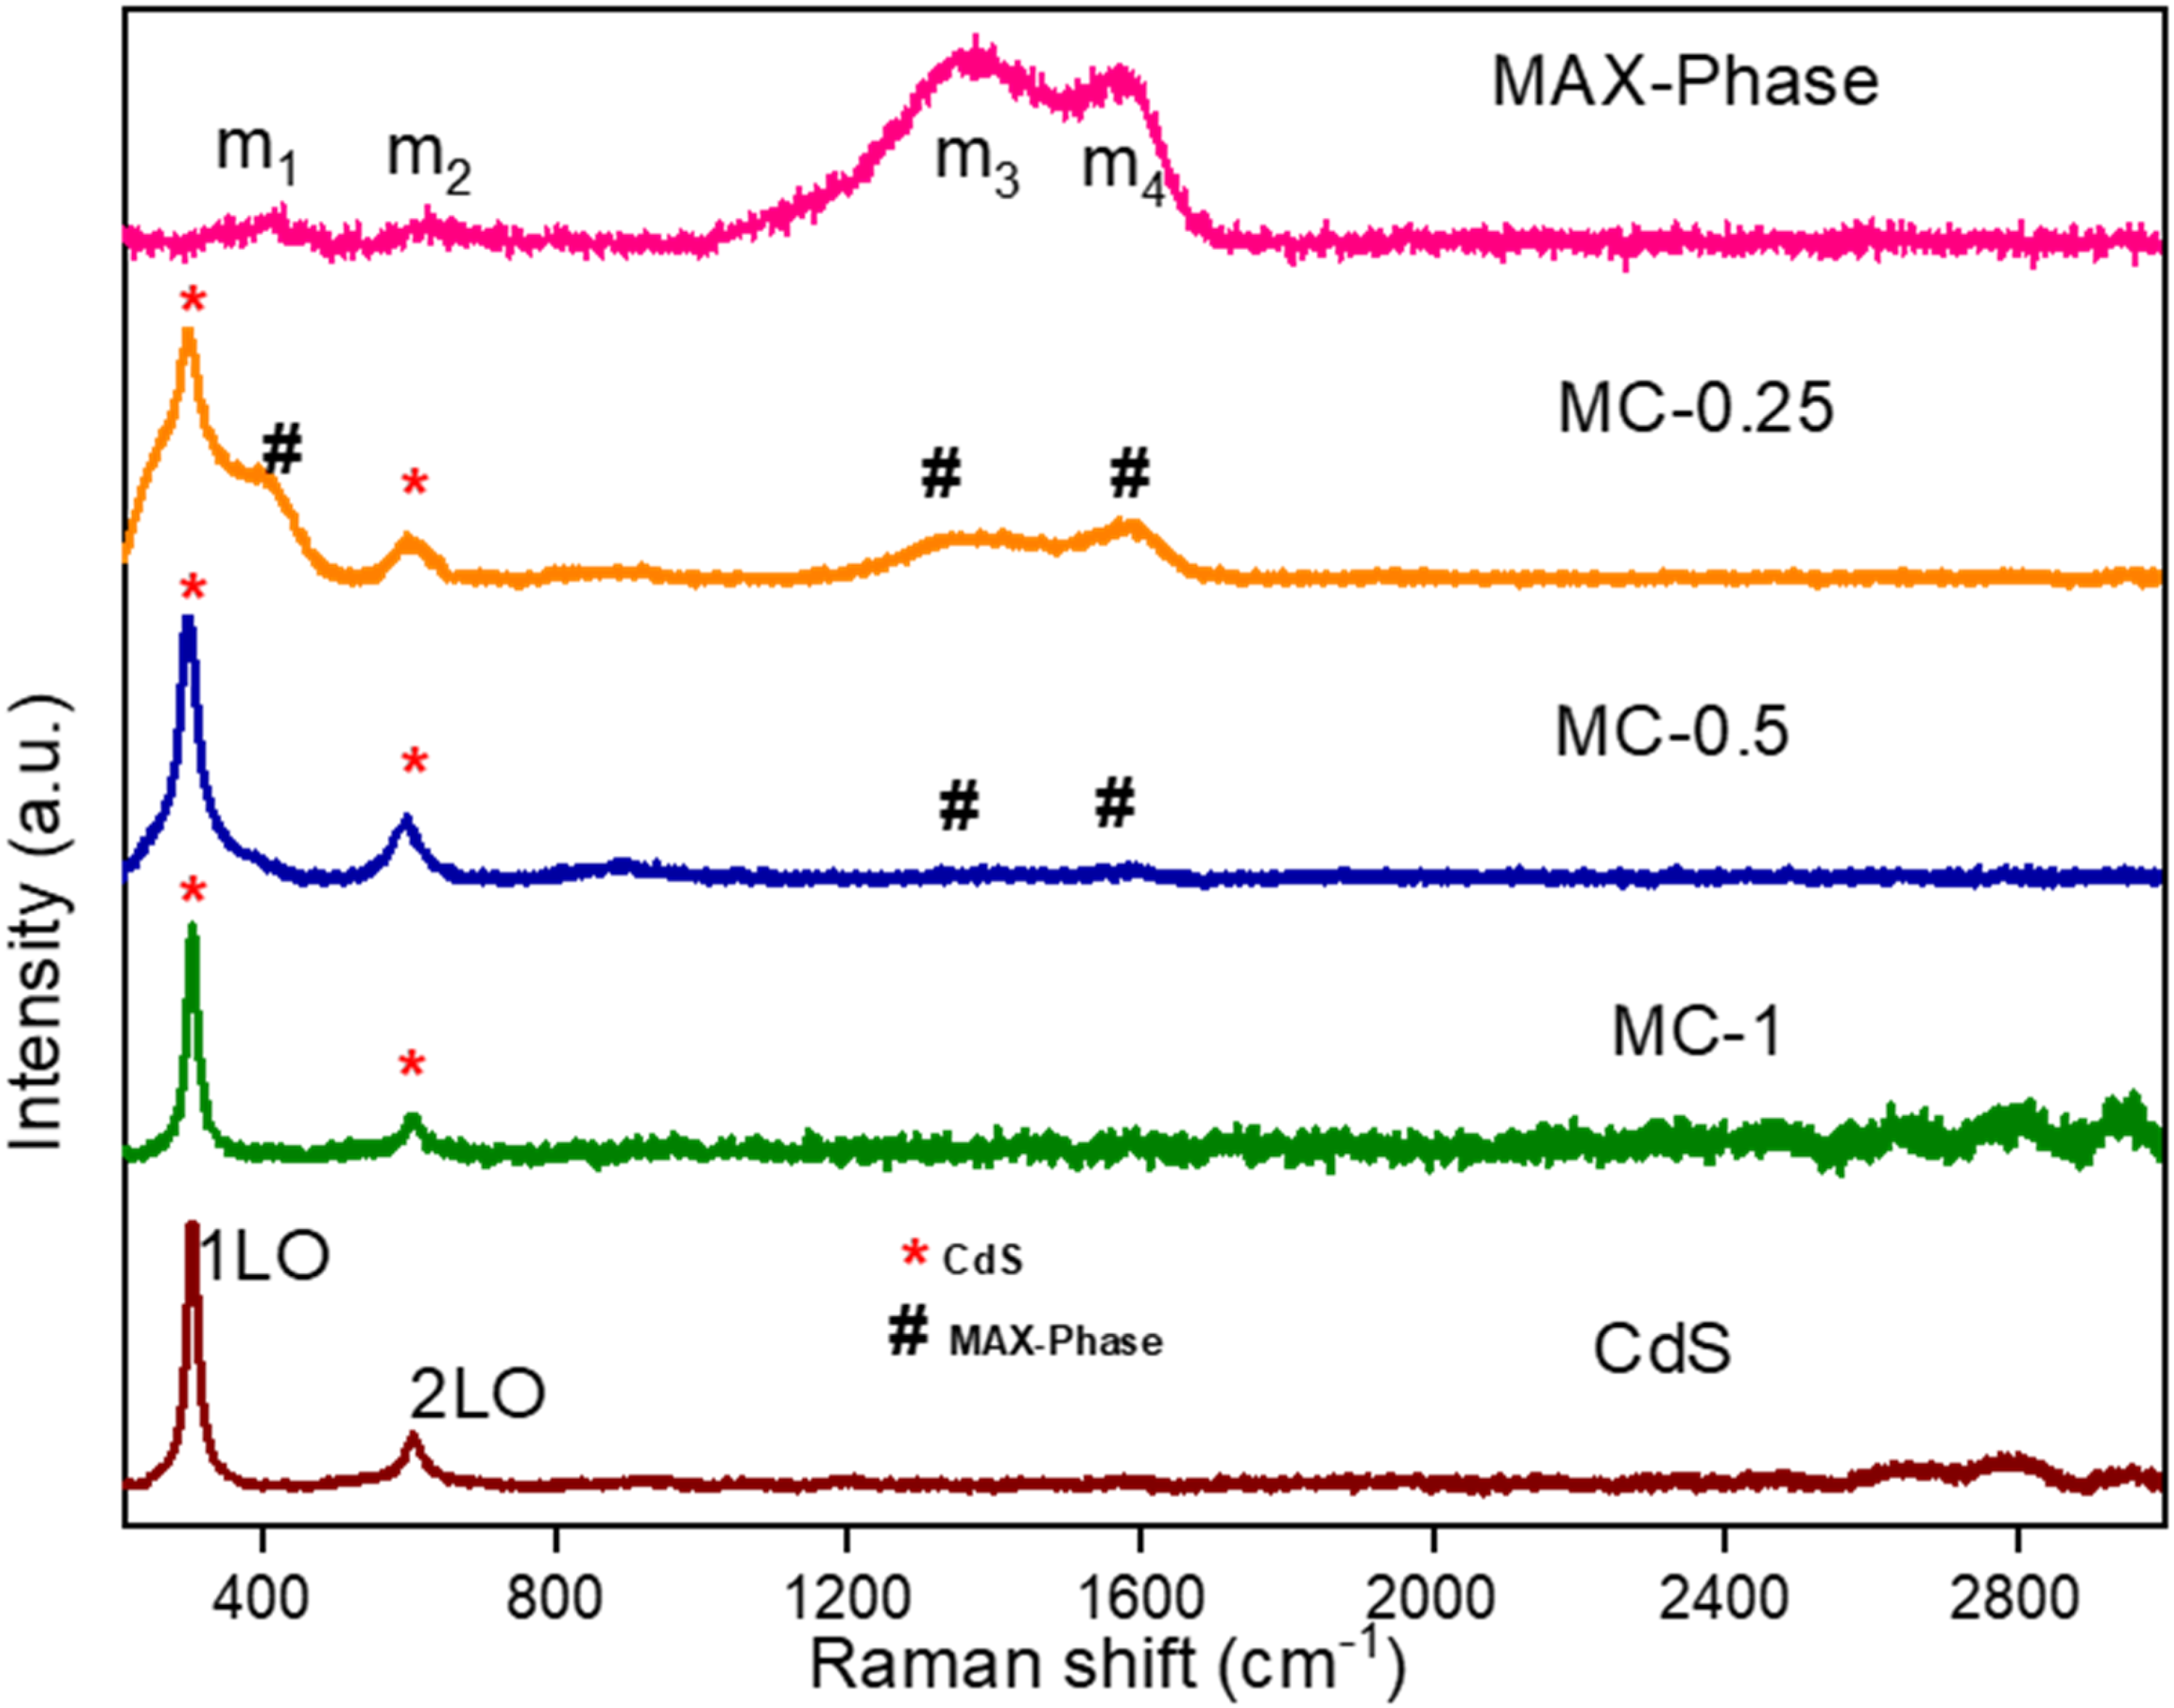
Raman Spectra of MAX-Phase, CdS, and their nanocomposites.
FT-IR analysis
Figure 3 shows the FT-IR spectra of MAX-Phase, CdS, and its nanocomposites. In the CdS spectrum the characteristic peak at 666, 724, 1145, and 1422 cm−1, corresponds to the stretching bands of C–S, C–C, C–O, and CH2 respectively. 13 In the MAX-Phase, the Al-C bond appeared but it shows a peak below 400 cm−1. 7 In the nanocomposite of MC-1, the CdS peak shows because of high concentration and MC-0.25 shows less concentration of CdS and shows more like MAX-Phase behavior.
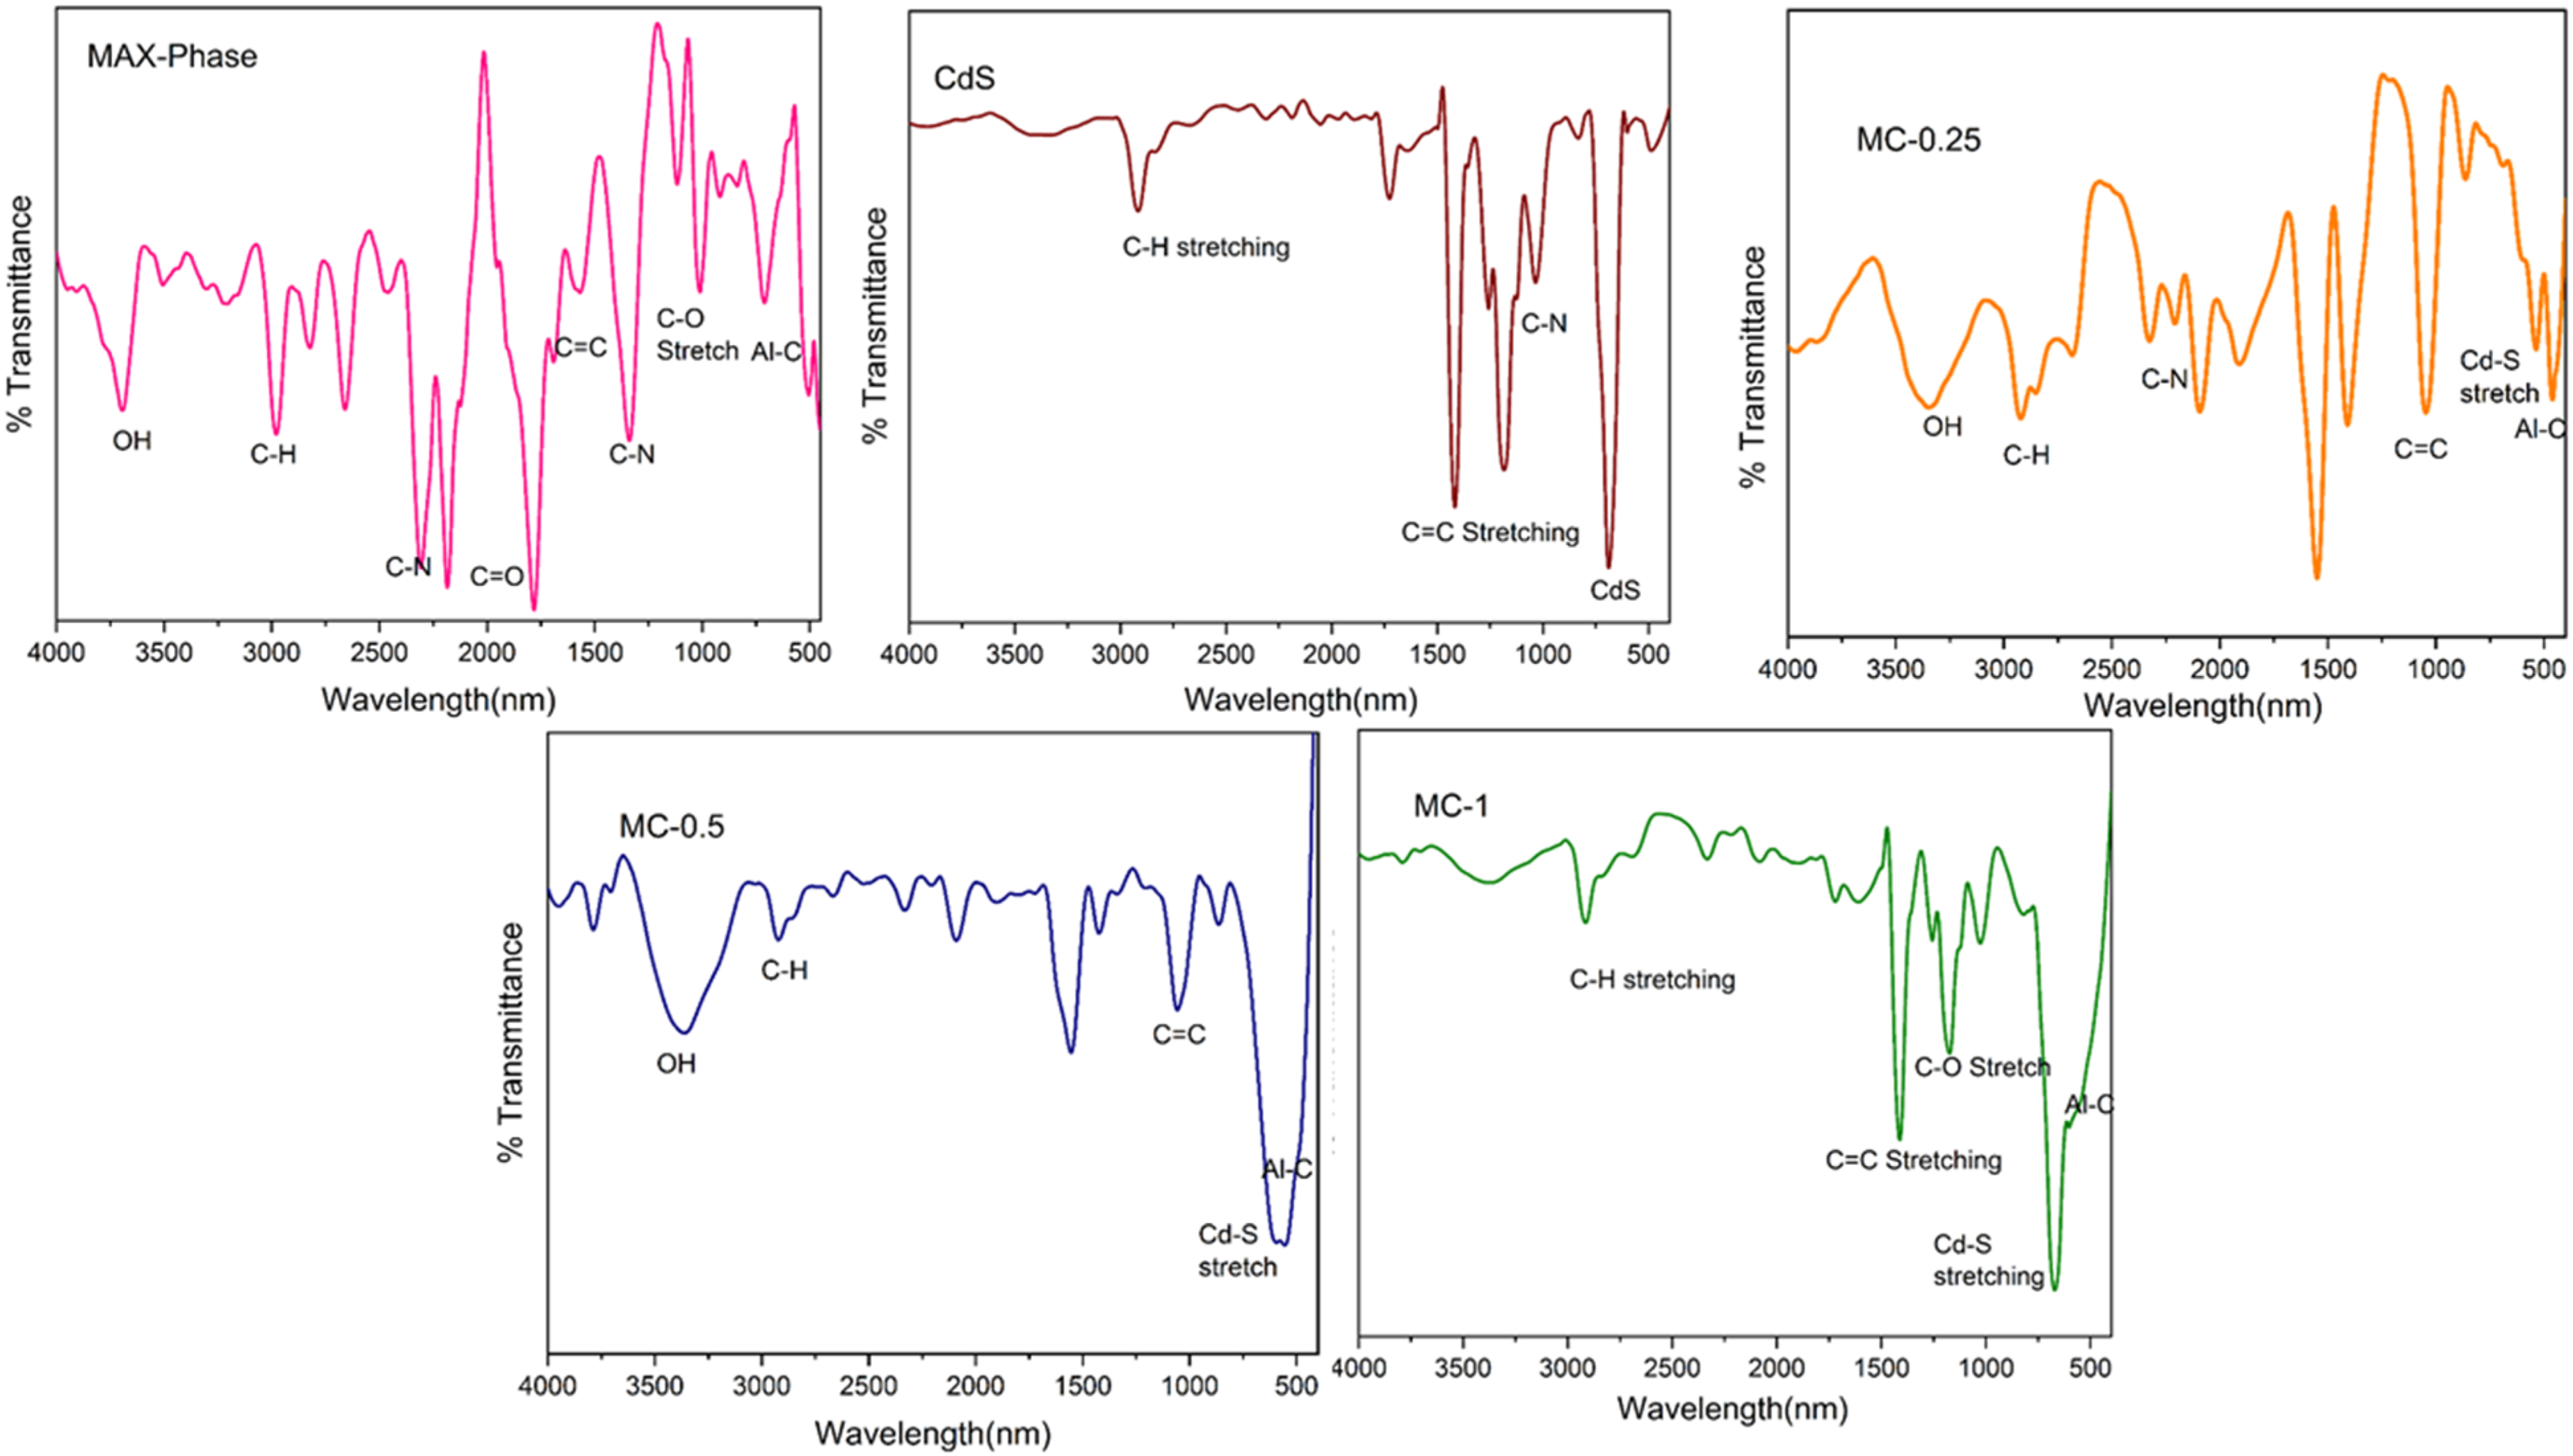
FT-IR spectra of MAX-Phase, CdS, and their nanocomposites.
Morphological analysis
Figure 4 shows the FE-SEM images of MAX-Phase, CdS, and their nanocomposites. The FE-SEM images of MAX-Phase and CdS show the presence of stacked layers and agglomerated nanoparticles, respectively. In nanocomposites, the deposition of CdS nanoparticles over the MAX-Phase was observed in Figure 4. In the nanocomposites as the loading of CdS increases on the MAX-Phase was increased from 0.25 to 1 mM, agglomeration of CdS nanoparticles is observed on the substrate in the nanocomposite sample.

FE-SEM images of MAX-Phase, CdS, and their nanocomposites.
Photocatalytic degradation studies
The photocatalytic degradation of MB was explored in the presence of the prepared samples MAX-Phase/CdS nanocomposites, MAX-Phase, and CdS as a photocatalyst. Figure 5(a) shows the UV-visible spectral results of adsorption and photocatalytic degradation of methylene blue in aqueous solution using MAX-Phase, CdS, and its nanocomposites. A drastic decrease in absorbance peak at λmax = 662 nm indicates the removal of MB dye. MAX-phase shows 2% adsorption and 11% degradation. Whereas CdS show only 3% adsorption and 80% degradation. In the case of nanocomposites MC-1, MC-0.5 & MC-0.25 shows 10%, 2%, and 7% adsorption and 57%, 87%, and 90% degradation, respectively.
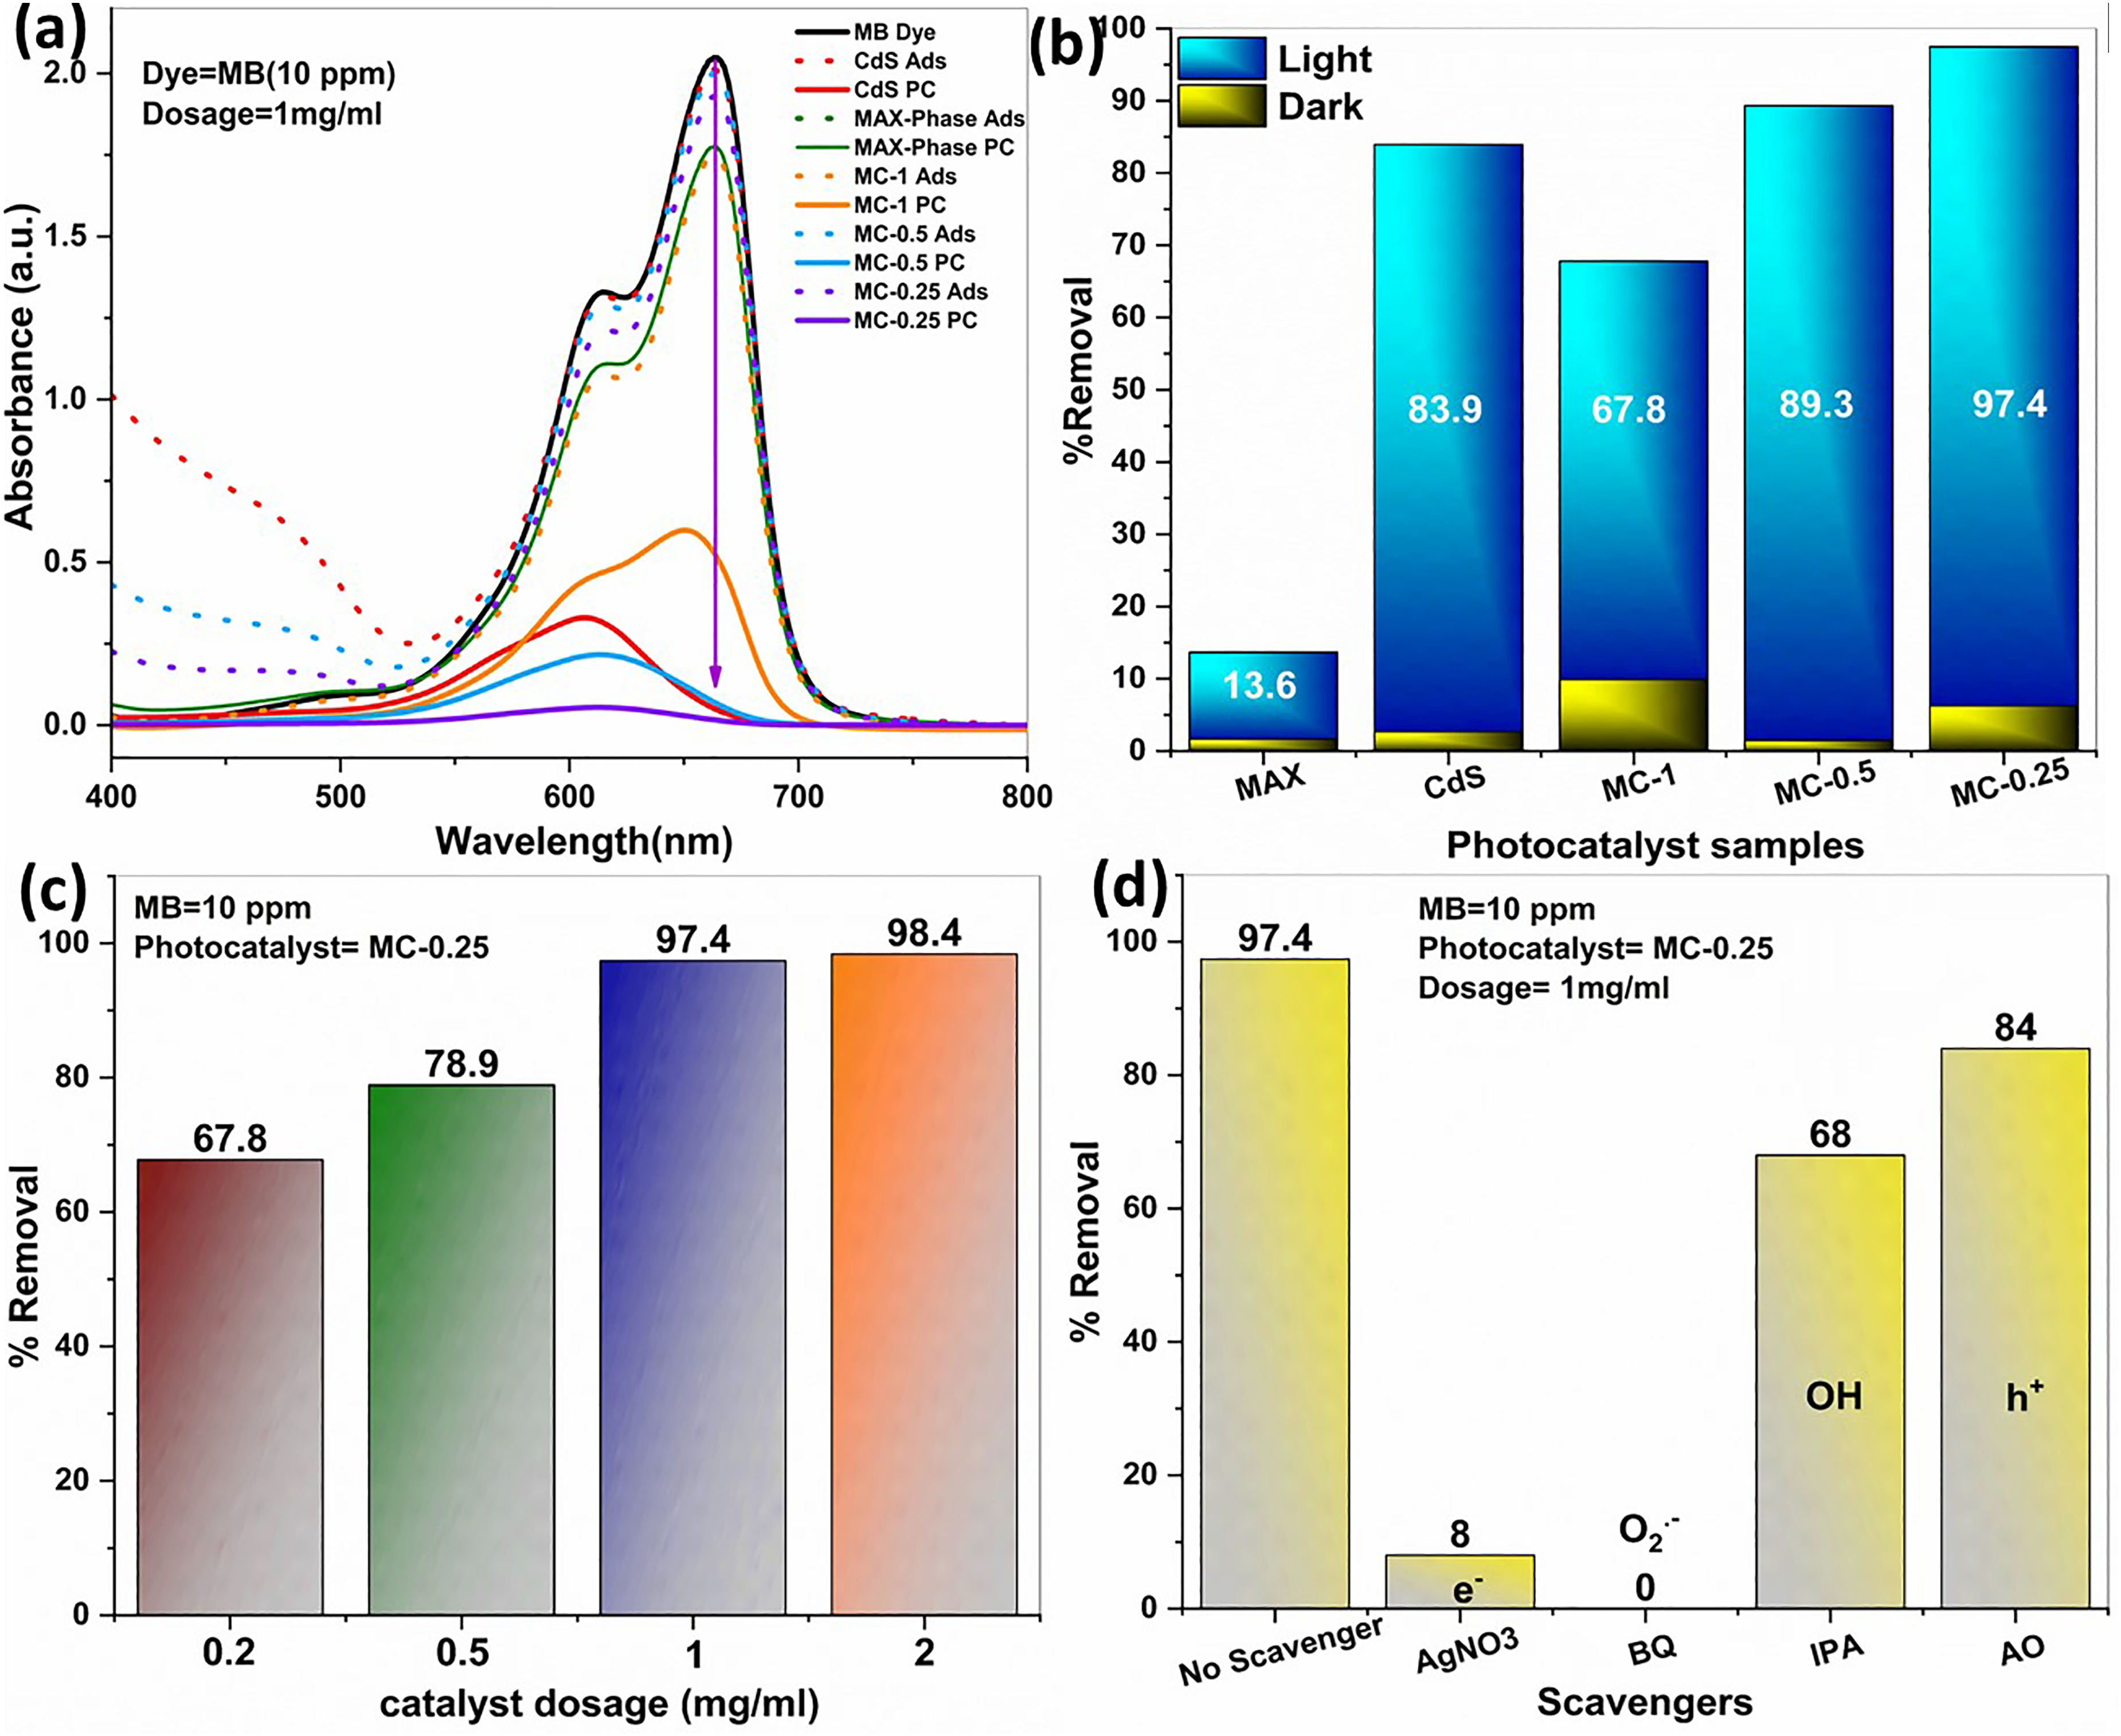
(a) UV-visible spectra depicting degradation of MB using prepared samples (b) % removal of MB using MAX phase, CdS, and its nanocomposites (c) effect of dosage on % removal of MB in the presence of MC-0.25 photocatalyst and (d) scavenger study using MC-0.25 photocatalyst.
Figure 5(b) shows the total % removal of MAX-Phase, CdS, and its nanocomposites. MAX-Phase and CdS show 13.6% and 83.9% removal of MB. In the case of nanocomposites MC-1, MC-0.5, and MC-0.25 show 67.8%, 89.3%, and 97.4% removal of MB respectively. From the comparison, it is analyzed that the nanocomposites show better photocatalytic performance. The formation of MC-0.25 nanocomposite with comparable performance to CdS in nanocomposites acts as a sensitizer and the MAX-Phase acts as substrate. From the results it can be concluded that MAX-Phase is inactive it only works as substrate but when integrating with sensitizer material CdS the photocatalytic performance is enhanced in nanocomposites and shows better removal than parent materials. A further assessment of the waste and treated water sample was conducted using COD analysis, revealing the value of treated water is 107.4 mg/L. Given that the wastewater COD is 200 mg/L, this result confirms that the treated sample is within permissible limits. 15
The efficiency of photocatalytic reactions is dependent on several factors, with one crucial factor being the effect of dosage. The optimum dosage was found by varying the dosage of the MC-0.25 photocatalyst. Figure 5(c) shows the total % removal of the dosage study using MC-0.5 nanocomposite. From the results, it is observed that as the photocatalyst dosage increases, the degradation efficiency also increases from 67.8%, 78.9%, 97.4%, and 98.4% for 0.2, 0.5, 1, and 2 mg/ml, respectively. An increase in the amount of photocatalyst leads to an increase in the more photoactive sites resulting in an enhanced removal efficiency. Increasing the photocatalyst dosage above 1 there is no rise in removal efficiency as the saturation point is reached resulting in lower removal efficiency. In conclusion, 1 mg/ml is the optimal dosage with a removal efficiency of 97.6% and was chosen for further studies.
Scavenger studies were conducted to find out which species are participating in the mechanism and to understand the detailed mechanism of photocatalysis. The scavenger studies were performed in the presence and absence of scavengers. Figure 5(d) shows the % removal of MB in the presence of different scavengers such as AgNO3, benzoquinone, Isopropanol (IPA), and ammonium oxalate (AO) which were used for electrons, superoxide radicals, hydroxyl radicals, and holes, respectively. From the results, it can be concluded that superoxide radicals and electrons are the major participating species in the degradation process. In the case of hydroxyl and holes 68% and 84% decrease is observed. It is indicated that superoxide radicals and electrons have the maximum effect on the degradation of MB dye. The major contribution of superoxide radicals, electrons, hydroxyl, and holes can be predicted.
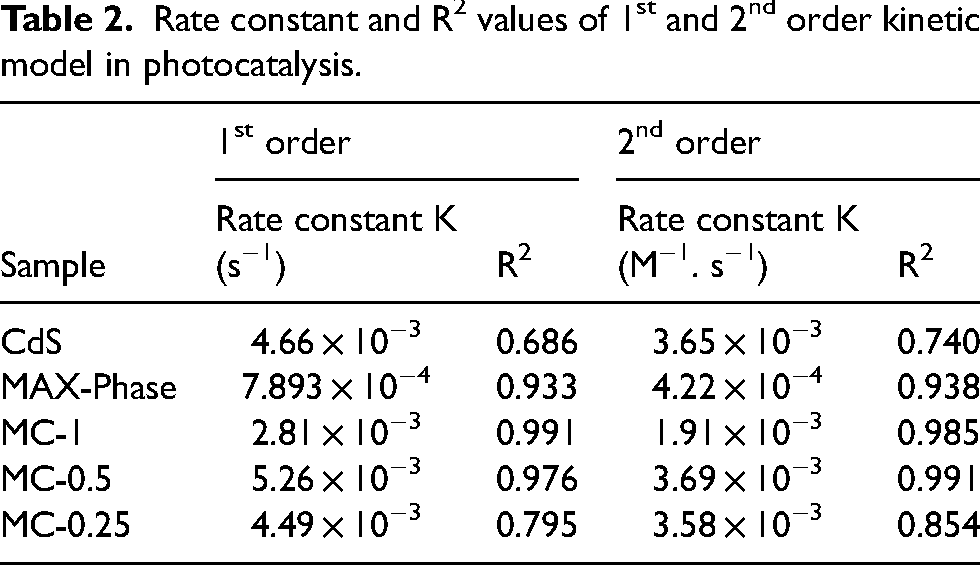
The kinetics study was carried out by monitoring the degradation reaction at regular time intervals. The obtained data was fitted to different kinetic models for 1st and 2nd order. Figure 6(a) shows the kinetic plot of lnC/Co versus Time and Figure 6(b) shows the kinetic plot of 1/C versus Time. Table 2 shows the rate constant and R2 values for the 1st order and 2nd order kinetic models. The higher R2 values fitted for the 2nd order kinetics for degradation studies confirm that degradation follows 2nd order kinetics with a maximum rate constant of 3.58 × 10⁻³.
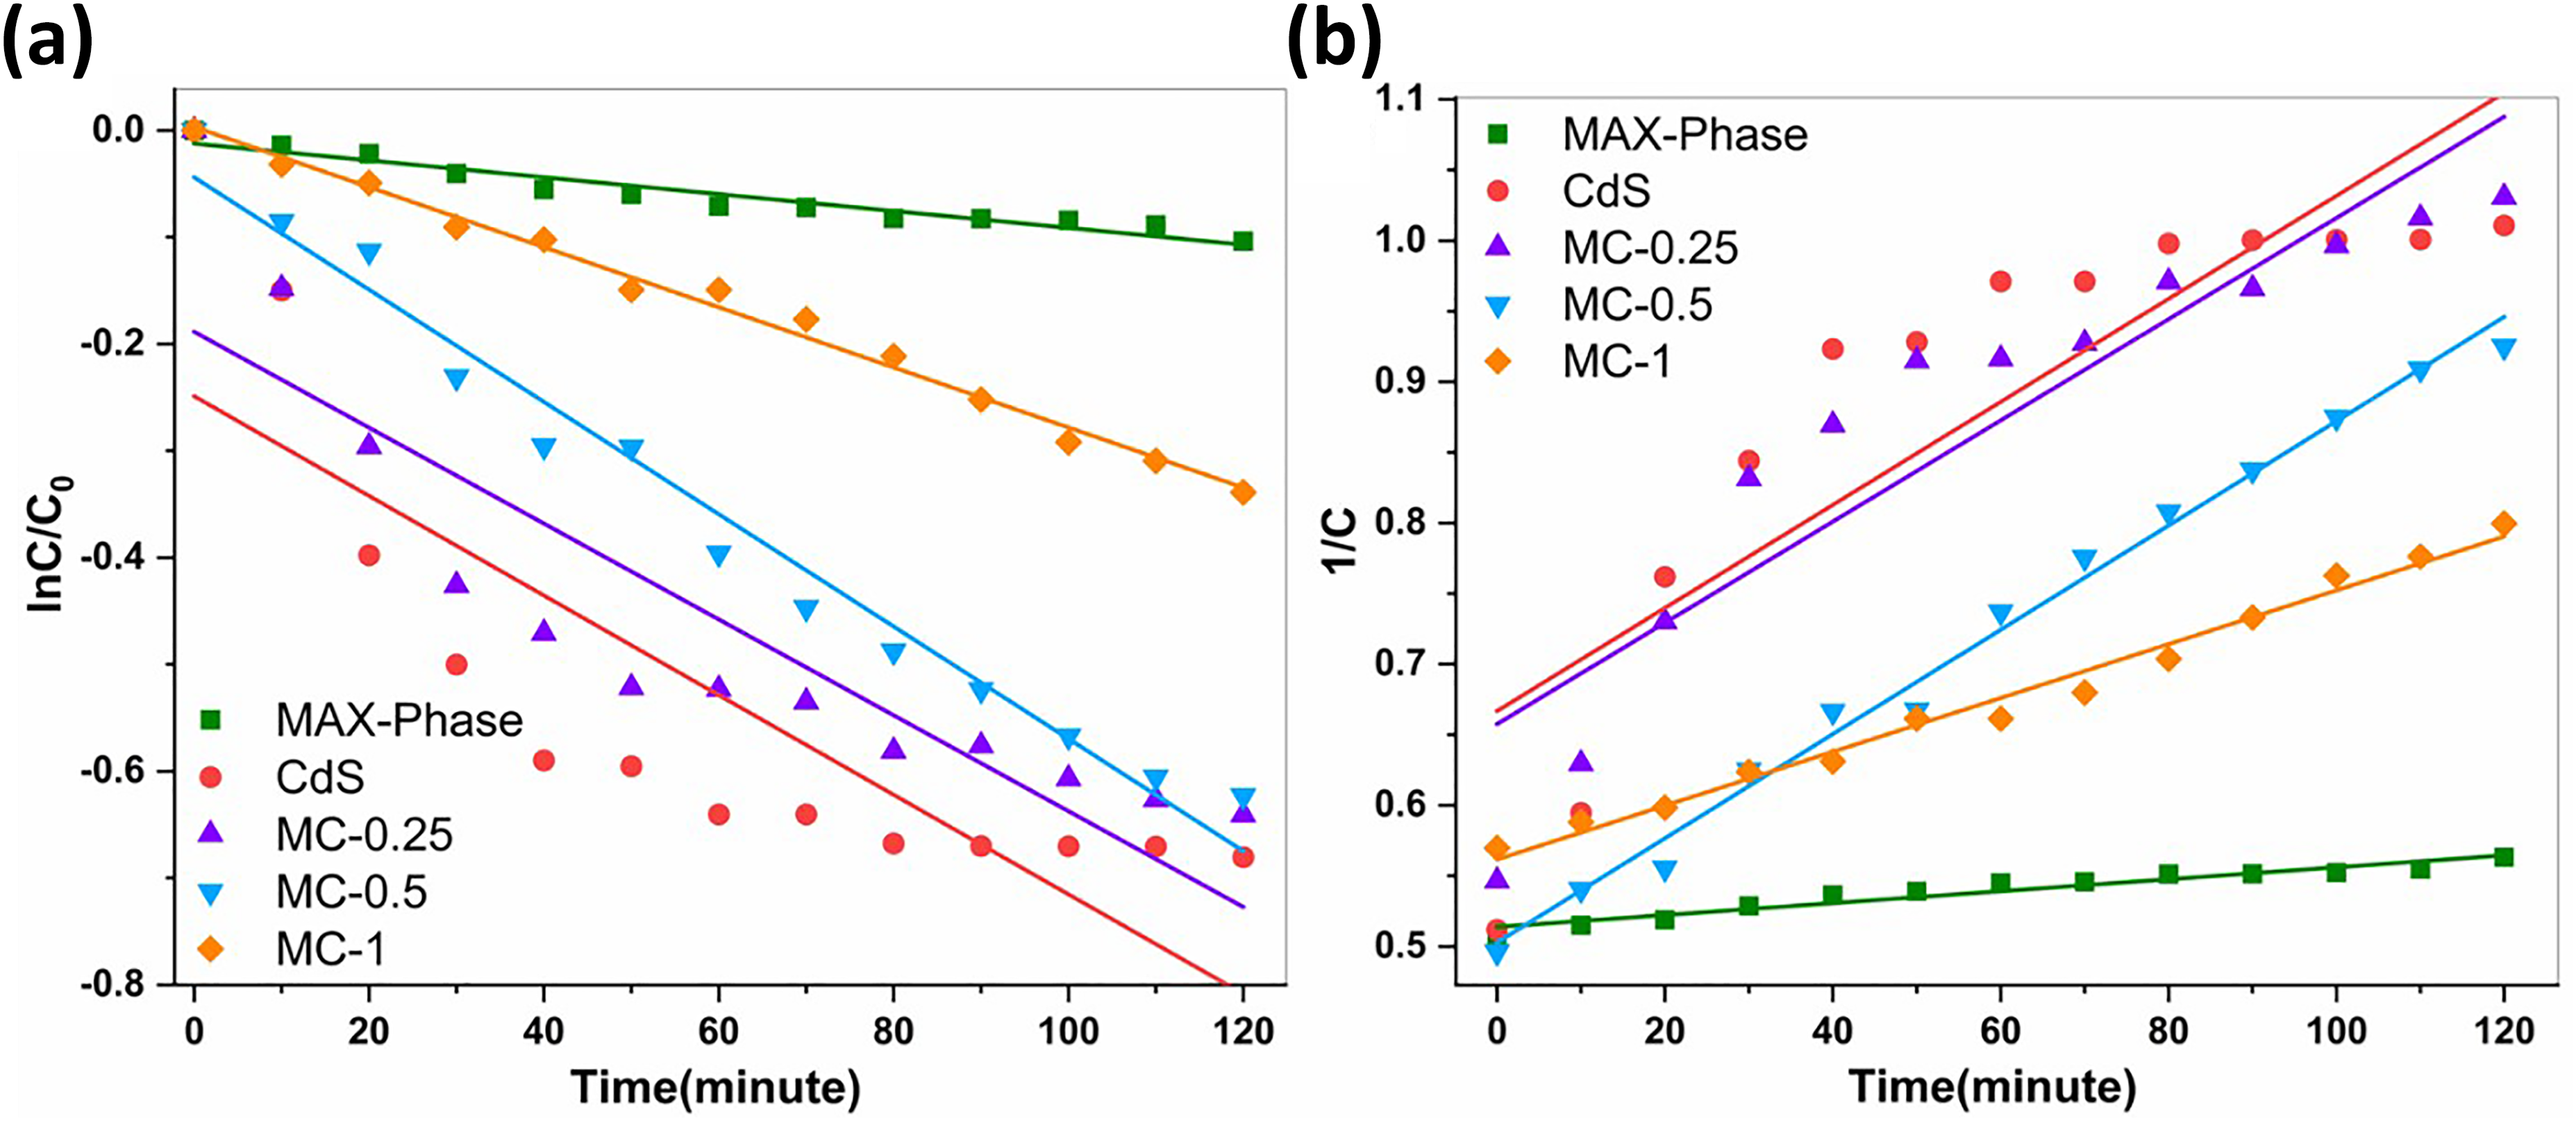
(a) Kinetic plot of lnC/C0 versus time, (b) kinetic plot of 1/C versus time [catalyst = 1 mg/ml, dye concentration = 10 ppm, light source = 10 W LED lamp].
Rate constant and R2 values of 1st and 2nd order kinetic model in photocatalysis.
Regenerability study
To check the regenerability and stability of the photocatalyst have to be used, the regenerability study has been done. Figure 7(a) shows the XRD spectra before and after the use of the photocatalyst and figure (b) shows the FT-IR spectra of the photocatalyst before and after the degradation process. The XRD and FT-IR spectra of the before and after the recovered catalyst show that the stabilities are retained. There is no change in crystal structure because all the peaks are the same and slight change in the relative intensity. It can be concluded that there is no change in XRD and FT-IR the phase structure is the same.
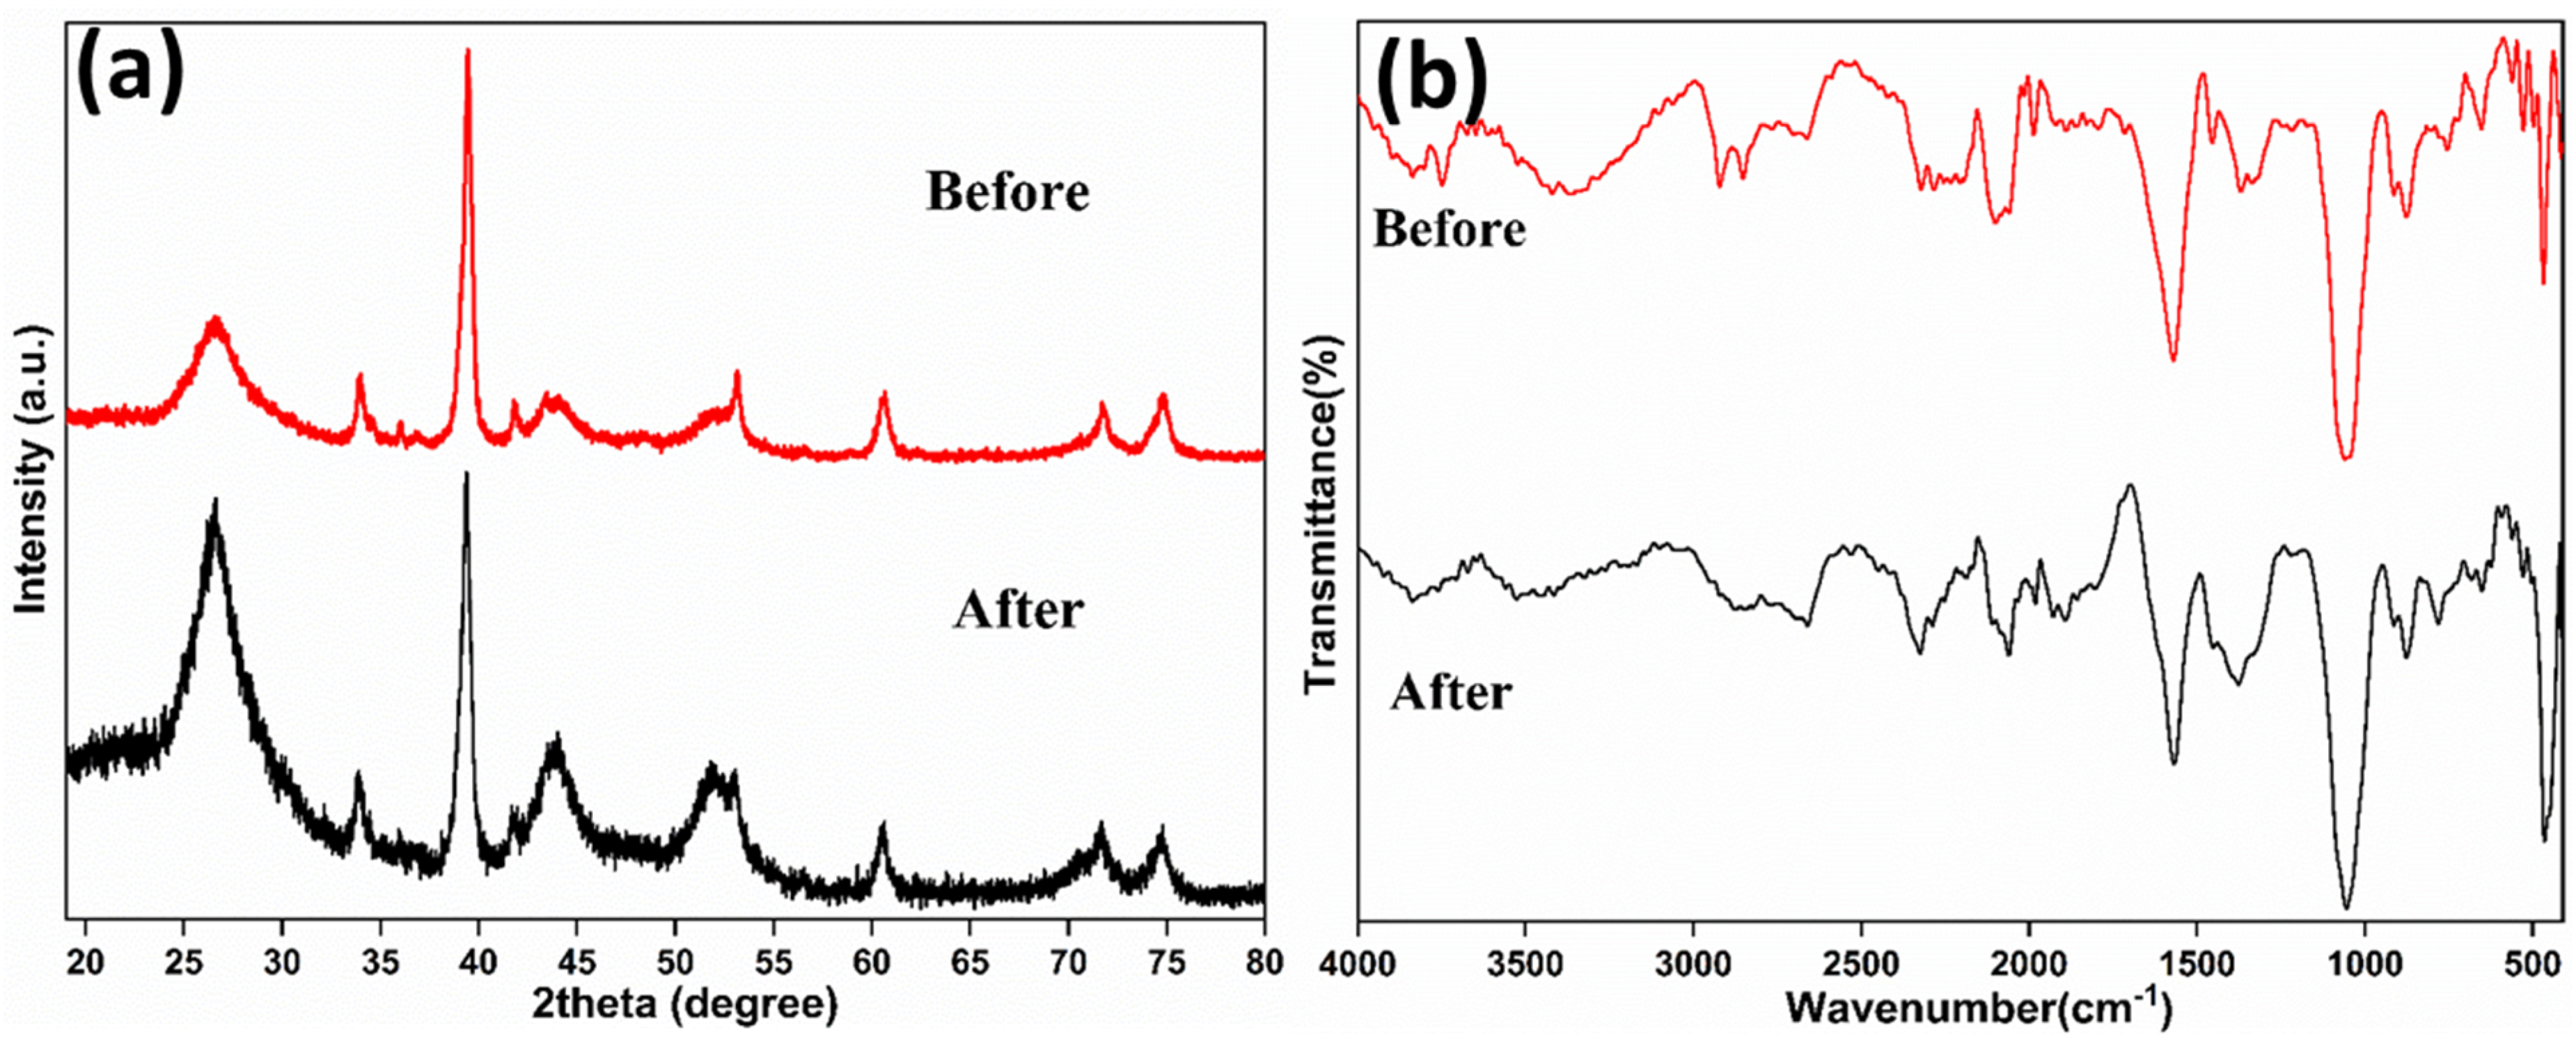
XRD and FT-IR spectra of fresh and treated photocatalyst (MC-0.25).
Photocatalytic degradation mechanism for the dye (MB) degradation
In a photocatalytic system, molecular transformation induced by light takes place on the surface of the catalyst. The fundamental process involved in the photocatalytic reaction is the creation of electron-hole pairs and their subsequent behavior as illustrated in Figure 8. These electron-hole pairs exhibit notable oxidizing and reducing characteristics. Upon interaction with the apertures on the CdS surface, methylene blue molecules can readily undergo oxidation to generate CO2, H2O, and various intermediate substances. In numerous photocatalytic systems, the electrons and holes generated by light can migrate to the surface of particles and engage in reactions with H2O and O2. The primary agent responsible for decomposing pollutants is the hydroxyl radical, which arises from the oxidation of adsorbed water or adsorbed OH. The presence of oxygen is capable of impeding the reorganization of hole-electron pairs. The decomposition of methylene blue ultimately results in the production of CO2 and H2O as the end products. The primary role of superoxide radicals, electrons, hydroxyl, and holes is supported by scavenger studies which are shown in section 3.2. The possible photocatalytic degradation mechanism of MB using MAX-Phase/CdS nanocomposite is proposed based on the scavenger study as follows.


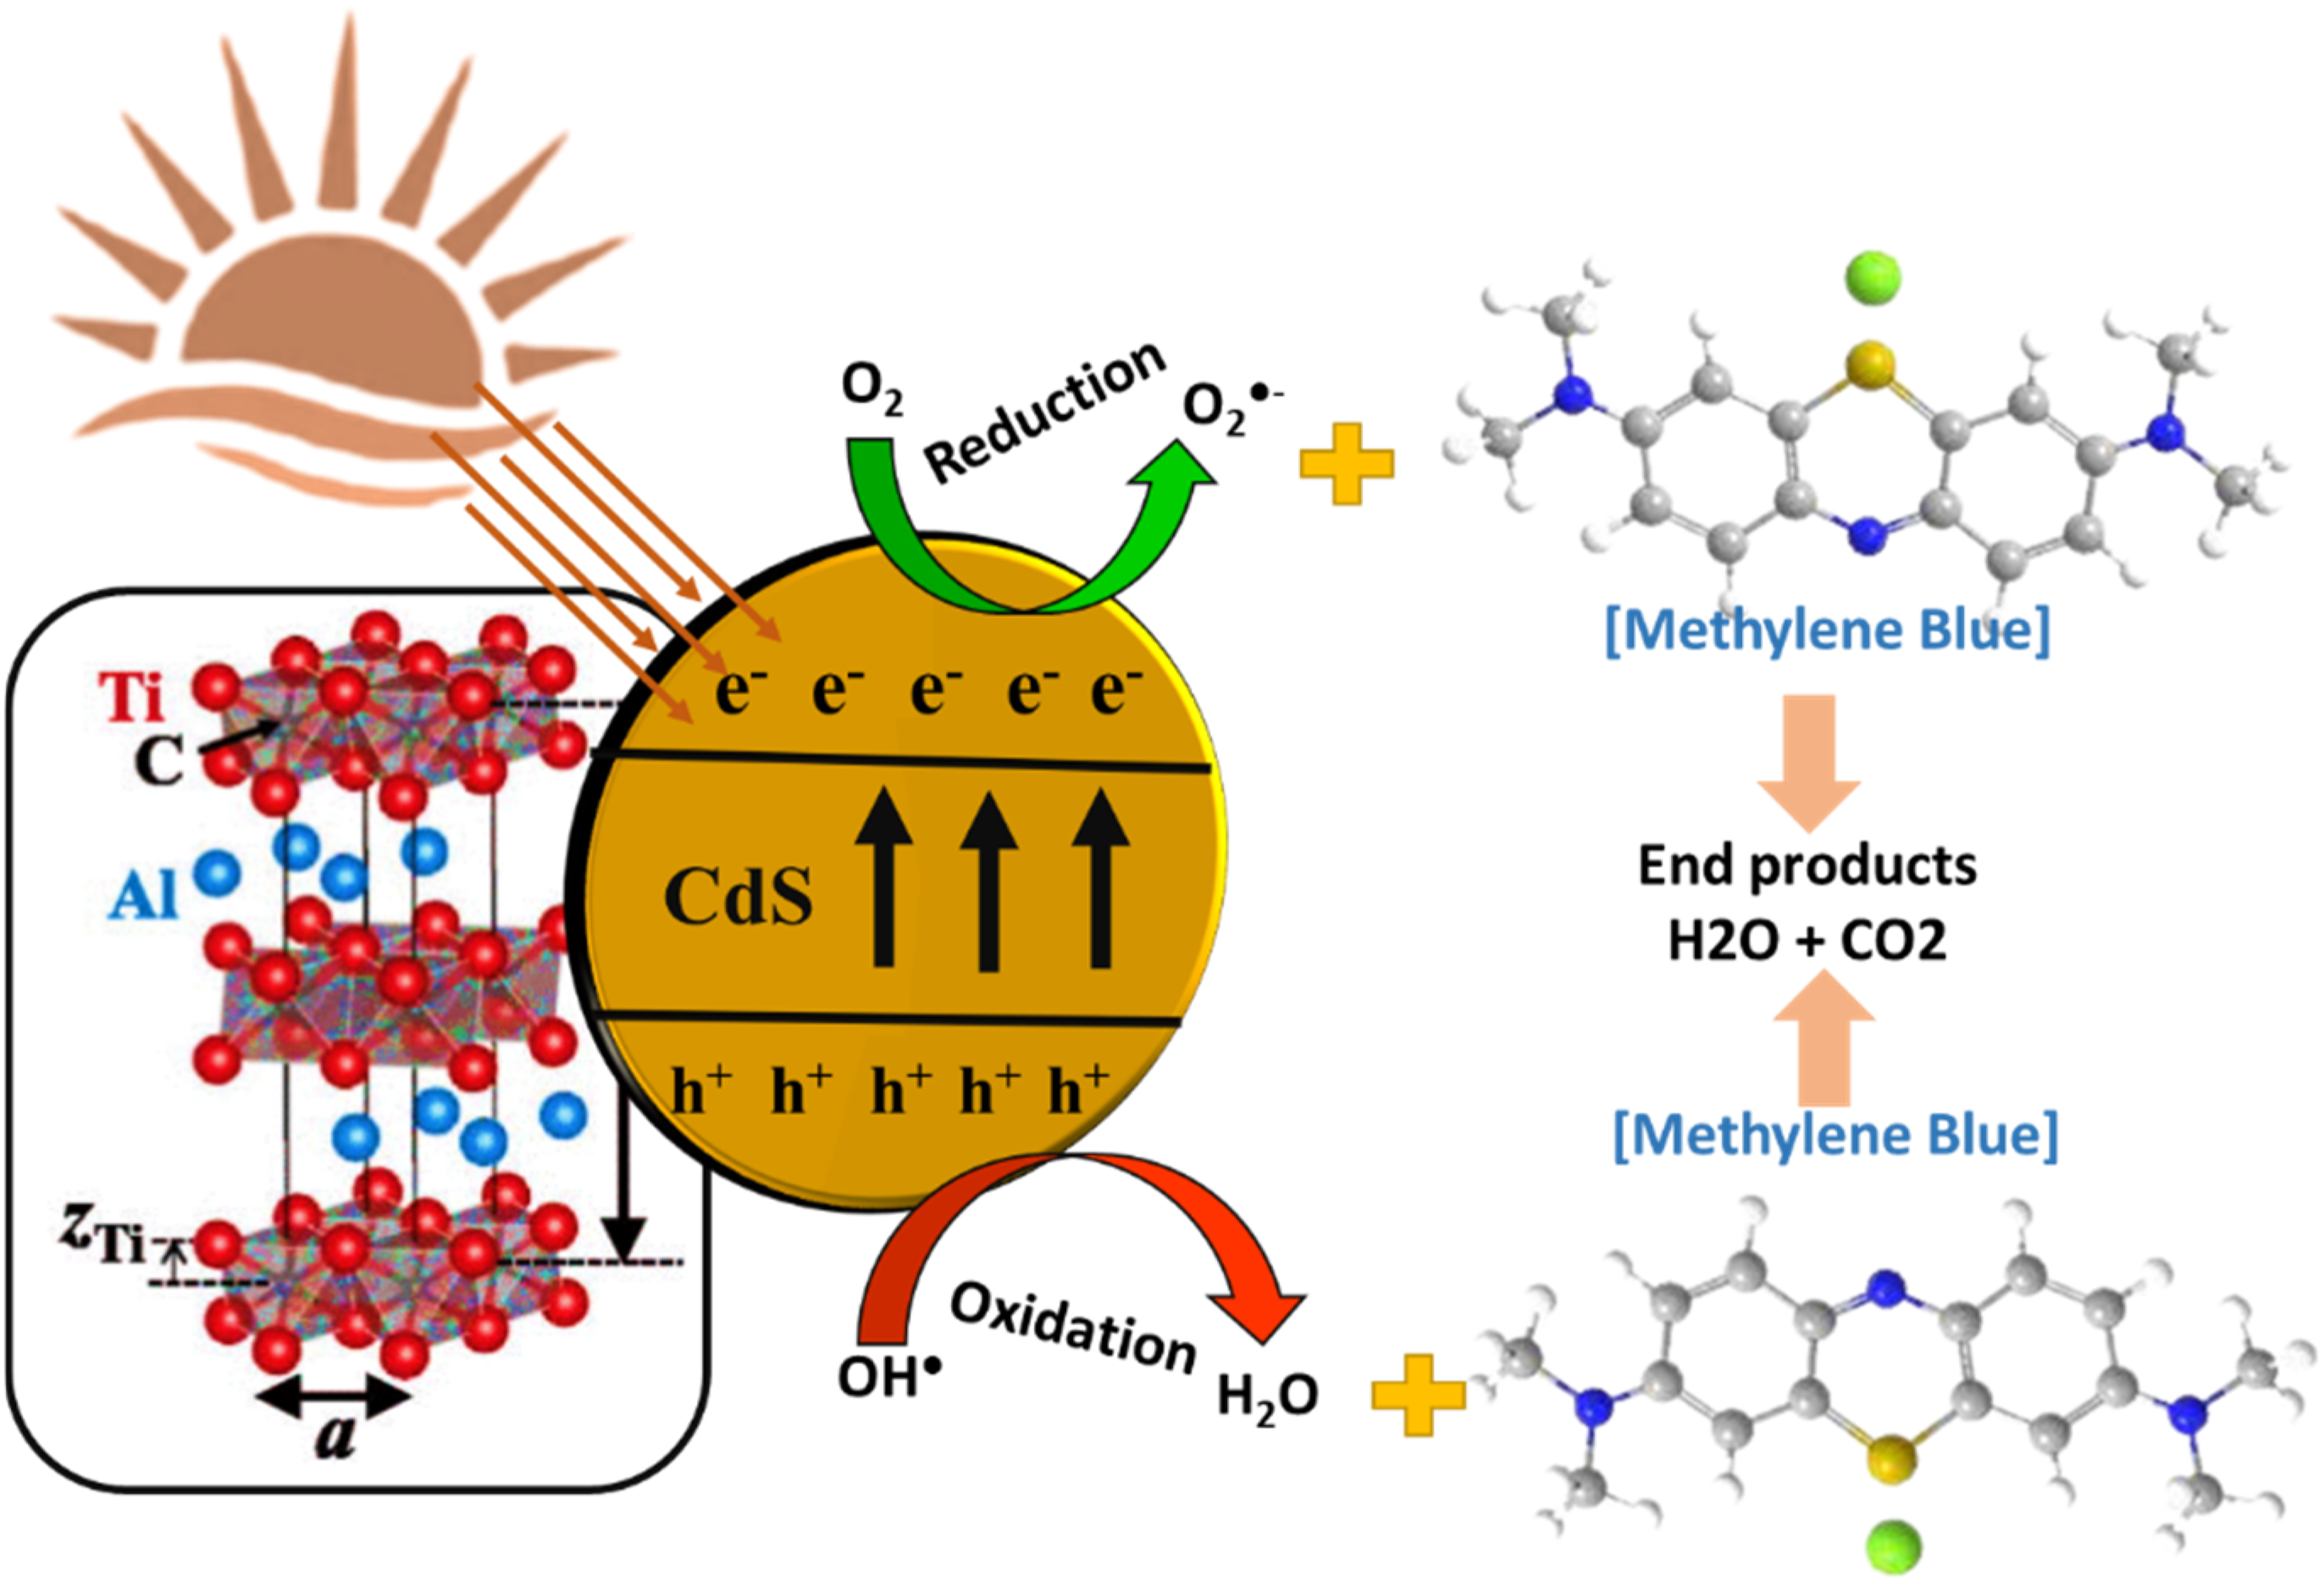
Schematic representation for the degradation mechanism of the methylene blue dye under visible light irradiation in the presence of MAX-Phase/CdS photocatalyst.


Conclusions
In conclusion, CdS nanoparticles and MAX-Phase/CdS nanocomposites were successfully synthesized using the thermal decomposition approach. The prepared samples were characterized by XRD, FT-IR spectroscopy, Raman spectroscopy, and FE-SEM analysis. The nanocomposites with different concentrations show good photocatalytic activity towards the photocatalytic degradation of Methylene Blue in aqueous solutions under a 10 W LED light. Photodegradation efficiency was obtained at about 83% and 13% for pure CdS and MAX-Phase while the nanocomposites MC-0.25, MC-0.5, and MC-1 showed 97%, 89% and 67% of MB in 60 min respectively. The nanocomposite showed better photocatalytic efficiencies than the parent compound. The photocatalytic degradation of MB follows 2nd order kinetics. Superoxide radicals and electrons have been identified as the main reactive species in the degradation process. The nanocomposites show higher stability without change in structure. The present investigation highlights issues associated with the extreme utilization of pollutants affecting the ecosystem and their remediation using MAX-Phase/CdS nanocomposites.
Footnotes
Acknowledgment
The authors would like to thank the Department of Chemistry, SRDC (Solar Research and Development Centre), and PDEU for support in characterization and analysis facilities.
Declaration of conflicting interests
The authors declared no potential conflicts of interest with respect to the research, authorship, and/or publication of this article.
Funding
The authors received no financial support for the research, authorship, and/or publication of this article.