
Abstract
Vacuum arc melting technology was employed to prepare FeCrMnAlCux (x = 2.0, 1.5, 1.0, 0.5, 0) high-entropy alloys. The phase structure of the alloys and their microstructure before and after corrosion were characterized, and the corrosion performance of the alloys in 3.5% NaCl solution was analyzed. The research results indicated that the presence of the Cu element favored the formation of a face-centered cubic phase in the alloy. The corrosion type of the alloy was intergranular corrosion. The corrosion resistance of the alloy improved with the decrease in the Cu content. Specifically, at x = 0, the alloy displayed the lowest corrosion current density, while the corrosion potential was maximum (−0.382 V).
Introduction
In recent years, high-entropy alloys, also referred to as complex concentrated alloys, have emerged as a novel class of materials containing multiple principal elements.1,2 High-entropy alloys, one of the breakthroughs in alloy design, are composed of five or more elements with atomic ratios close to equiatomic or ranging between 5% and 35% for each major element.3,4 Compared with traditional metallic materials, high-entropy alloys exhibit various superior properties, including hardness, strength, oxidation resistance, frictional performance, and corrosion resistance,2,5–8 endowing them with significant potential applications and broad prospects.
Corrosion refers to the process in which materials undergo chemical (electrochemical) reactions with the environment, resulting in their degradation during use. Corrosion has a significant economic impact, amounting to over 3% of the world's gross domestic product. This underscores the critical importance of conducting research on corrosion behavior and creating corrosion-resistant materials.9,10 Owing to their excellent corrosion resistance, high-entropy alloys have become an active research area for corrosion-resistant materials. M et al. 11 investigated the corrosion behavior of AlxCoCrFeNi high-entropy alloys. The research results indicated that an increase in Al content led to element segregation, and the corrosion current density increased with the molar ratio of Al elements, resulting in reduced corrosion resistance of the alloy. Ren et al. 12 investigated the corrosion behavior of CoCrxCuFeMnNi high-entropy alloys and found that the alloy mainly consisted of two face-centered cubic phases. With increasing Cr content, the corrosion current density and average corrosion rate of the alloy decreased, indicating improved corrosion resistance. This enhancement was primarily due to the formation of a dense Cr2O3 passivation film, which reduced Cu segregation in the FCC2 phase. Some studies have deviated from traditional high-entropy alloy designs by incorporating small amounts of alloying elements to optimize performance. 4 Zhang et al. 13 modulated the distribution of Cu elements in the CoCrFeNiCu0.3 high-entropy alloy and found that the alloy exhibited good mechanical and corrosion resistance properties under uniform Cu element distribution. Meng et al. 14 investigated the influence of the Cu content on the microstructure and properties of CoCrFeNiCux-series high-entropy alloy coatings. With increasing Cu content, grain refinement occurred in the high-entropy alloys. Additionally, the passivation behavior of the high-entropy alloy varied with the Cu content. The combined effect of increased Cu-rich phases and grain boundary density strengthened the localized galvanic corrosion mechanism of the high-entropy alloy. Passivation started to fail along the grain boundaries, reducing the corrosion resistance of the high-entropy alloy. The corrosion current density of the CoCrFeNiCu1.5 high-entropy alloy after Cu addition was 7.978 × 10⁻⁶ A·cm−2, which was an order of magnitude higher than that of the high-entropy alloy without Cu elements. Wang et al. 15 investigated the influence of Cu elements on the microstructure and corrosion resistance of AlCrFeNi3Cux high-entropy alloys. They found that in a 3.5 wt.% NaCl solution, the corrosion rate and corrosion current density initially increased and then decreased with increasing Cu content. The AlCrFeNi3Cu0.4 alloy exhibited the highest corrosion resistance owing to the formation of a dense Cr2O3 passivation film, with a self-corrosion potential of −0.463 V. According to the above studies, the Cu element, as an important constituent in the design of high-entropy alloys, plays a significant role in the corrosion resistance of the alloy.
The group investigated the effect of Cu element on the mechanical properties of FeCrMnAlCux (x = 2.0, 1.5, 1.0, 0.5, 0) high entropy alloy in the previous work, 16 and it was found that the alloy has good mechanical properties. On this basis, this paper further provides an in-depth study on the corrosion resistance of FeCrMnAlCux high-entropy alloy. The present study employed a vacuum arc melting furnace to prepare FeCrMnAlCux (x = 2.0, 1.5, 1.0, 0.5, 0) high-entropy alloys. The corrosion resistance of FeCrMnAlCux-series high-entropy alloys was thoroughly investigated in a simulated seawater corrosion environment, a 3.5% NaCl solution. Furthermore, the corrosion process, mechanism, and regularities of the alloys were explored in detail.
Experimental method
Preparation of alloy samples
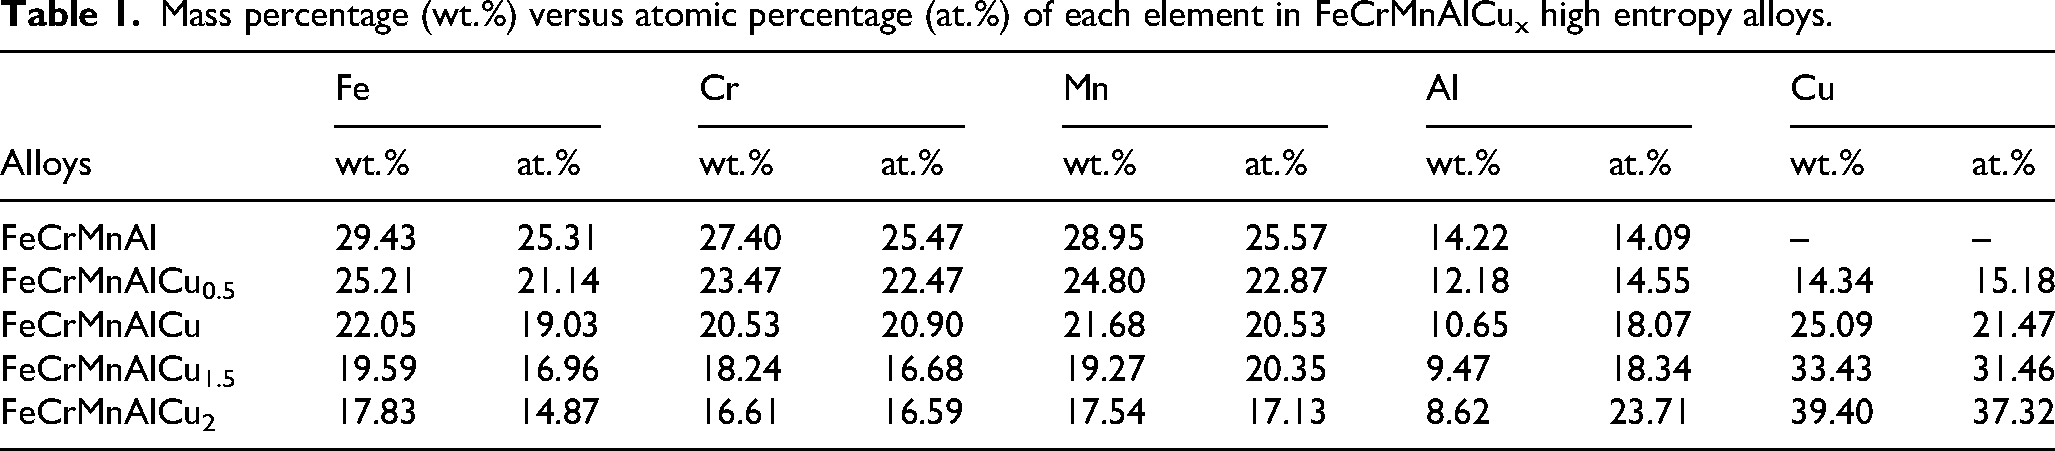
FeCrMnAlCux (x = 2.0, 1.5, 1.0, 0.5, 0) high-entropy alloys were prepared using a non-consumable vacuum arc melting furnace. Metal particles with a purity of 99.99%, including Fe, Cr, Mn, Al, and Cu, were selected as the melting raw materials. The materials were weighed according to the mass percentages of each element (Table 1). During the melting process, the raw materials were placed in the furnace in the order of decreasing melting point. The melting process was repeated four to five times, with each repetition involving flipping to ensure the uniformity of the high-entropy alloy composition. Considering that manganese has a relatively high vapor pressure, it was placed at the bottom of the vacuum arc furnace to reduce evaporation. The prepared sample blocks were cut into 10 mm × 10 mm × 3 mm dimensions using a wire-cutting machine. Subsequently, the samples were polished using sandpaper with different roughness levels and then cleaned and dried thoroughly. Furthermore, the sample surfaces were etched with aqua regia (HCl:HNO3 = 3:1), and the microstructure of the alloy was observed using an optical microscope (BH200M) at various magnifications. This allowed for clear observation of the microstructure for subsequent experiments.
Mass percentage (wt.%) versus atomic percentage (at.%) of each element in FeCrMnAlCux high entropy alloys.
Microstructural characterization
The phase structure of the alloy was analyzed via X-ray diffraction (XRD, XPert Pro MPD). The X-ray diffractometer bombarded a Cu target with free electrons at an acceleration voltage of 40 kV. The scanning parameters were set as follows: a speed of 4 °/min, a step size of 0.02°, and a current of 40 mA. The 2θ range scanned was from 20° to 90°. The obtained XRD patterns were analyzed using Jade software for phase identification. Subsequently, the microstructure of the prepared samples was observed using a scanning electron microscope (FEI QUANTA FEG250), and the alloy composition was analyzed via energy-dispersive X-ray spectroscopy (EDS).
Electrochemical measurements
Electrochemical measurements were conducted using a CHI 660 D electrochemical workstation. The samples were sealed with epoxy resin, with an exposed area of 10 mm × 10 mm. Before each test, the samples were polished using sandpaper of 200–5000 grit, followed by polishing with 1 μm diamond paste. Subsequently, all samples were ultrasonically cleaned in anhydrous ethanol for 30 min and dried using a dryer. For each experimental group, three samples were selected and tested in parallel to avoid experimental variability. Potentiodynamic polarization tests were conducted in a typical three-electrode cell setup. The FeCrMnAlCux high-entropy alloy served as the working electrode, a saturated calomel electrode served as the reference electrode, and a platinum foil served as the auxiliary electrode. First, the open-circuit potential (OCP) was measured by immersing the sample in the electrolyte for 3600 s to obtain a stable OCP. Subsequently, electrochemical impedance spectroscopy (EIS) testing was conducted over a frequency range of 105 Hz to 0.005 Hz, with a sinusoidal wave amplitude of 10 mV. Afterward, potentiodynamic polarization curves were recorded within the voltage range of −1 V to 1.5 V at a scan rate of 0.01 mV/s. 17 Following the completion of the electrochemical tests, the sample surfaces were observed using a scanning electron microscope.
Immersion measurements
To further investigate the corrosion resistance of the high-entropy alloy, immersion testing was conducted by immersing the samples in a 3.5 wt.% NaCl solution for 168 h. Before immersion, the initial mass of the samples was measured using an electronic balance with an accuracy of 0.0001 g. During the immersion process, the samples were weighed every 24 h, and the data were recorded. After immersion, the samples were washed with deionized water and dried in a drying oven. Subsequently, the corroded samples were ultrasonically cleaned to remove loosely adhered corrosion products. After the immersion test, the morphology of the corroded sample surfaces was characterized.
White light interferometry measurement
After the immersion test, the three-dimensional morphology of the alloy surface was measured using a white light interferometer (SuperView W3). The scanning range was from 0 to 10 nm, with a vertical travel of 100 nm. The accuracy was 0.75%. The test data were processed and analyzed using XtremeVision Pro 1.2 software.
Characterization of passivation film
The composition of the passivation film on the alloy surface was analyzed via X-ray photoelectron spectroscopy (XPS, Thermo ScientificTM K-AlphaTM). A monochromatic Al Kα (λ = 1486.6 eV) X-ray source was used, with an operating voltage of 15 eV. The calibration was performed using the C1 s peak at a binding energy of 284.8 eV. Experimental peaks were fitted using Avantage software. All elements were fitted according to the National Institute of Standards and Technology (NIST) database. 18
Experimental results and discussion
Phase structure of the FeCrMnAlCux high-entropy alloy
Figure 1 shows the XRD pattern of the FeCrMnAlCux high-entropy alloy. The phase structure of the FeCrMnAlCux high-entropy alloy consisted of both body-centered cubic (BCC) and face-centered cubic (FCC) phases. With the decrease in the Cu content, the diffraction peaks of the BCC phase first increased and then decreased, while the diffraction peaks of the FCC phase continuously decreased. Additionally, the intensity of the diffraction peaks of the BCC phase remained higher than that of the FCC phase. High-entropy alloys containing Al and Cr elements are prone to form nanoscale surface oxides (Al2O3, Cr2O3) during preparation or exposure, and the characteristic peaks of these oxides appear in the low-angle region, such as in Figure 1, with a very small peak at about 25°. At x = 2.0–0.5, the alloy exhibited a dual-phase BCC + FCC structure. At x = 0, the alloy exhibited a single-phase BCC structure. This indicates that the absence of Cu led to the transformation of the FeCrMnAlCux high-entropy alloy from a dual-phase BCC + FCC structure to a single-phase BCC structure. Among them, the BCC phase structure contains Fe and Cr elements, the FCC phase structure is enriched with Cu elements, and Mn and Al elements are distributed throughout the grains.The variation of the Cu content has a significant effect on the phase structure of FeCrMnAlCux high-entropy alloys. 19
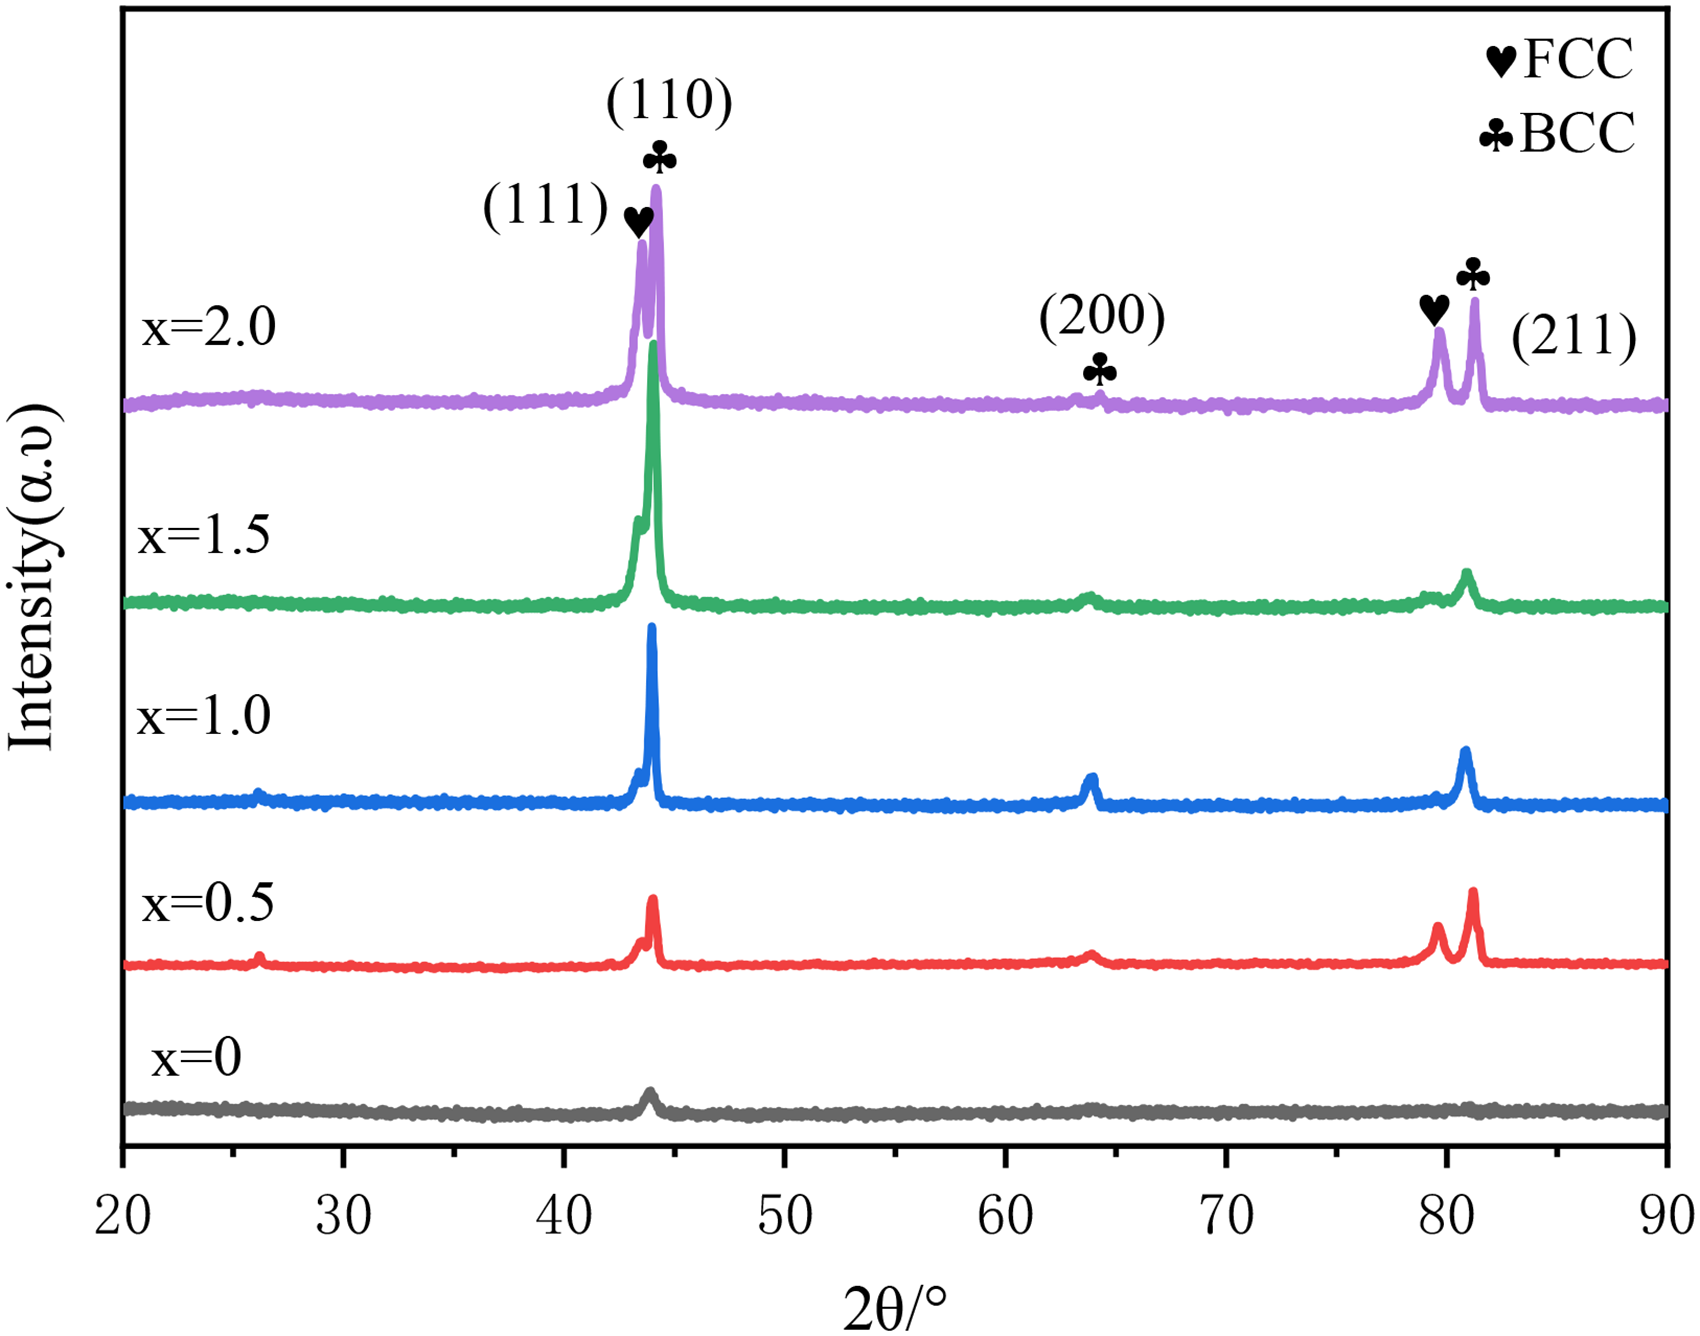
XRD pattern of the FeCrMnAlCux high-entropy alloy.
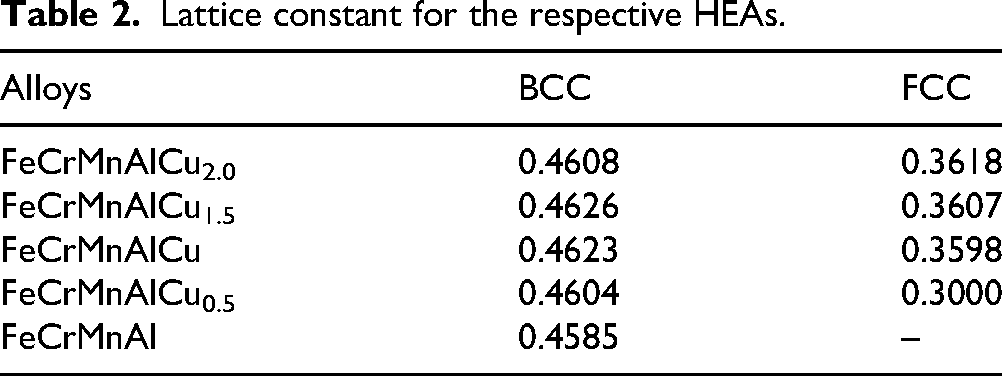
The lattice constants of the alloys were calculated by jade 6.0 software as shown in Table 2. In FeCrMnAlCux (x = 0, 0.5, 1.0, 1.5, 2.0) high entropy alloys, The lattice constant of the BCC phase increases and then decreases with decreasing Cu content.
Lattice constant for the respective HEAs.
Microstructure observation
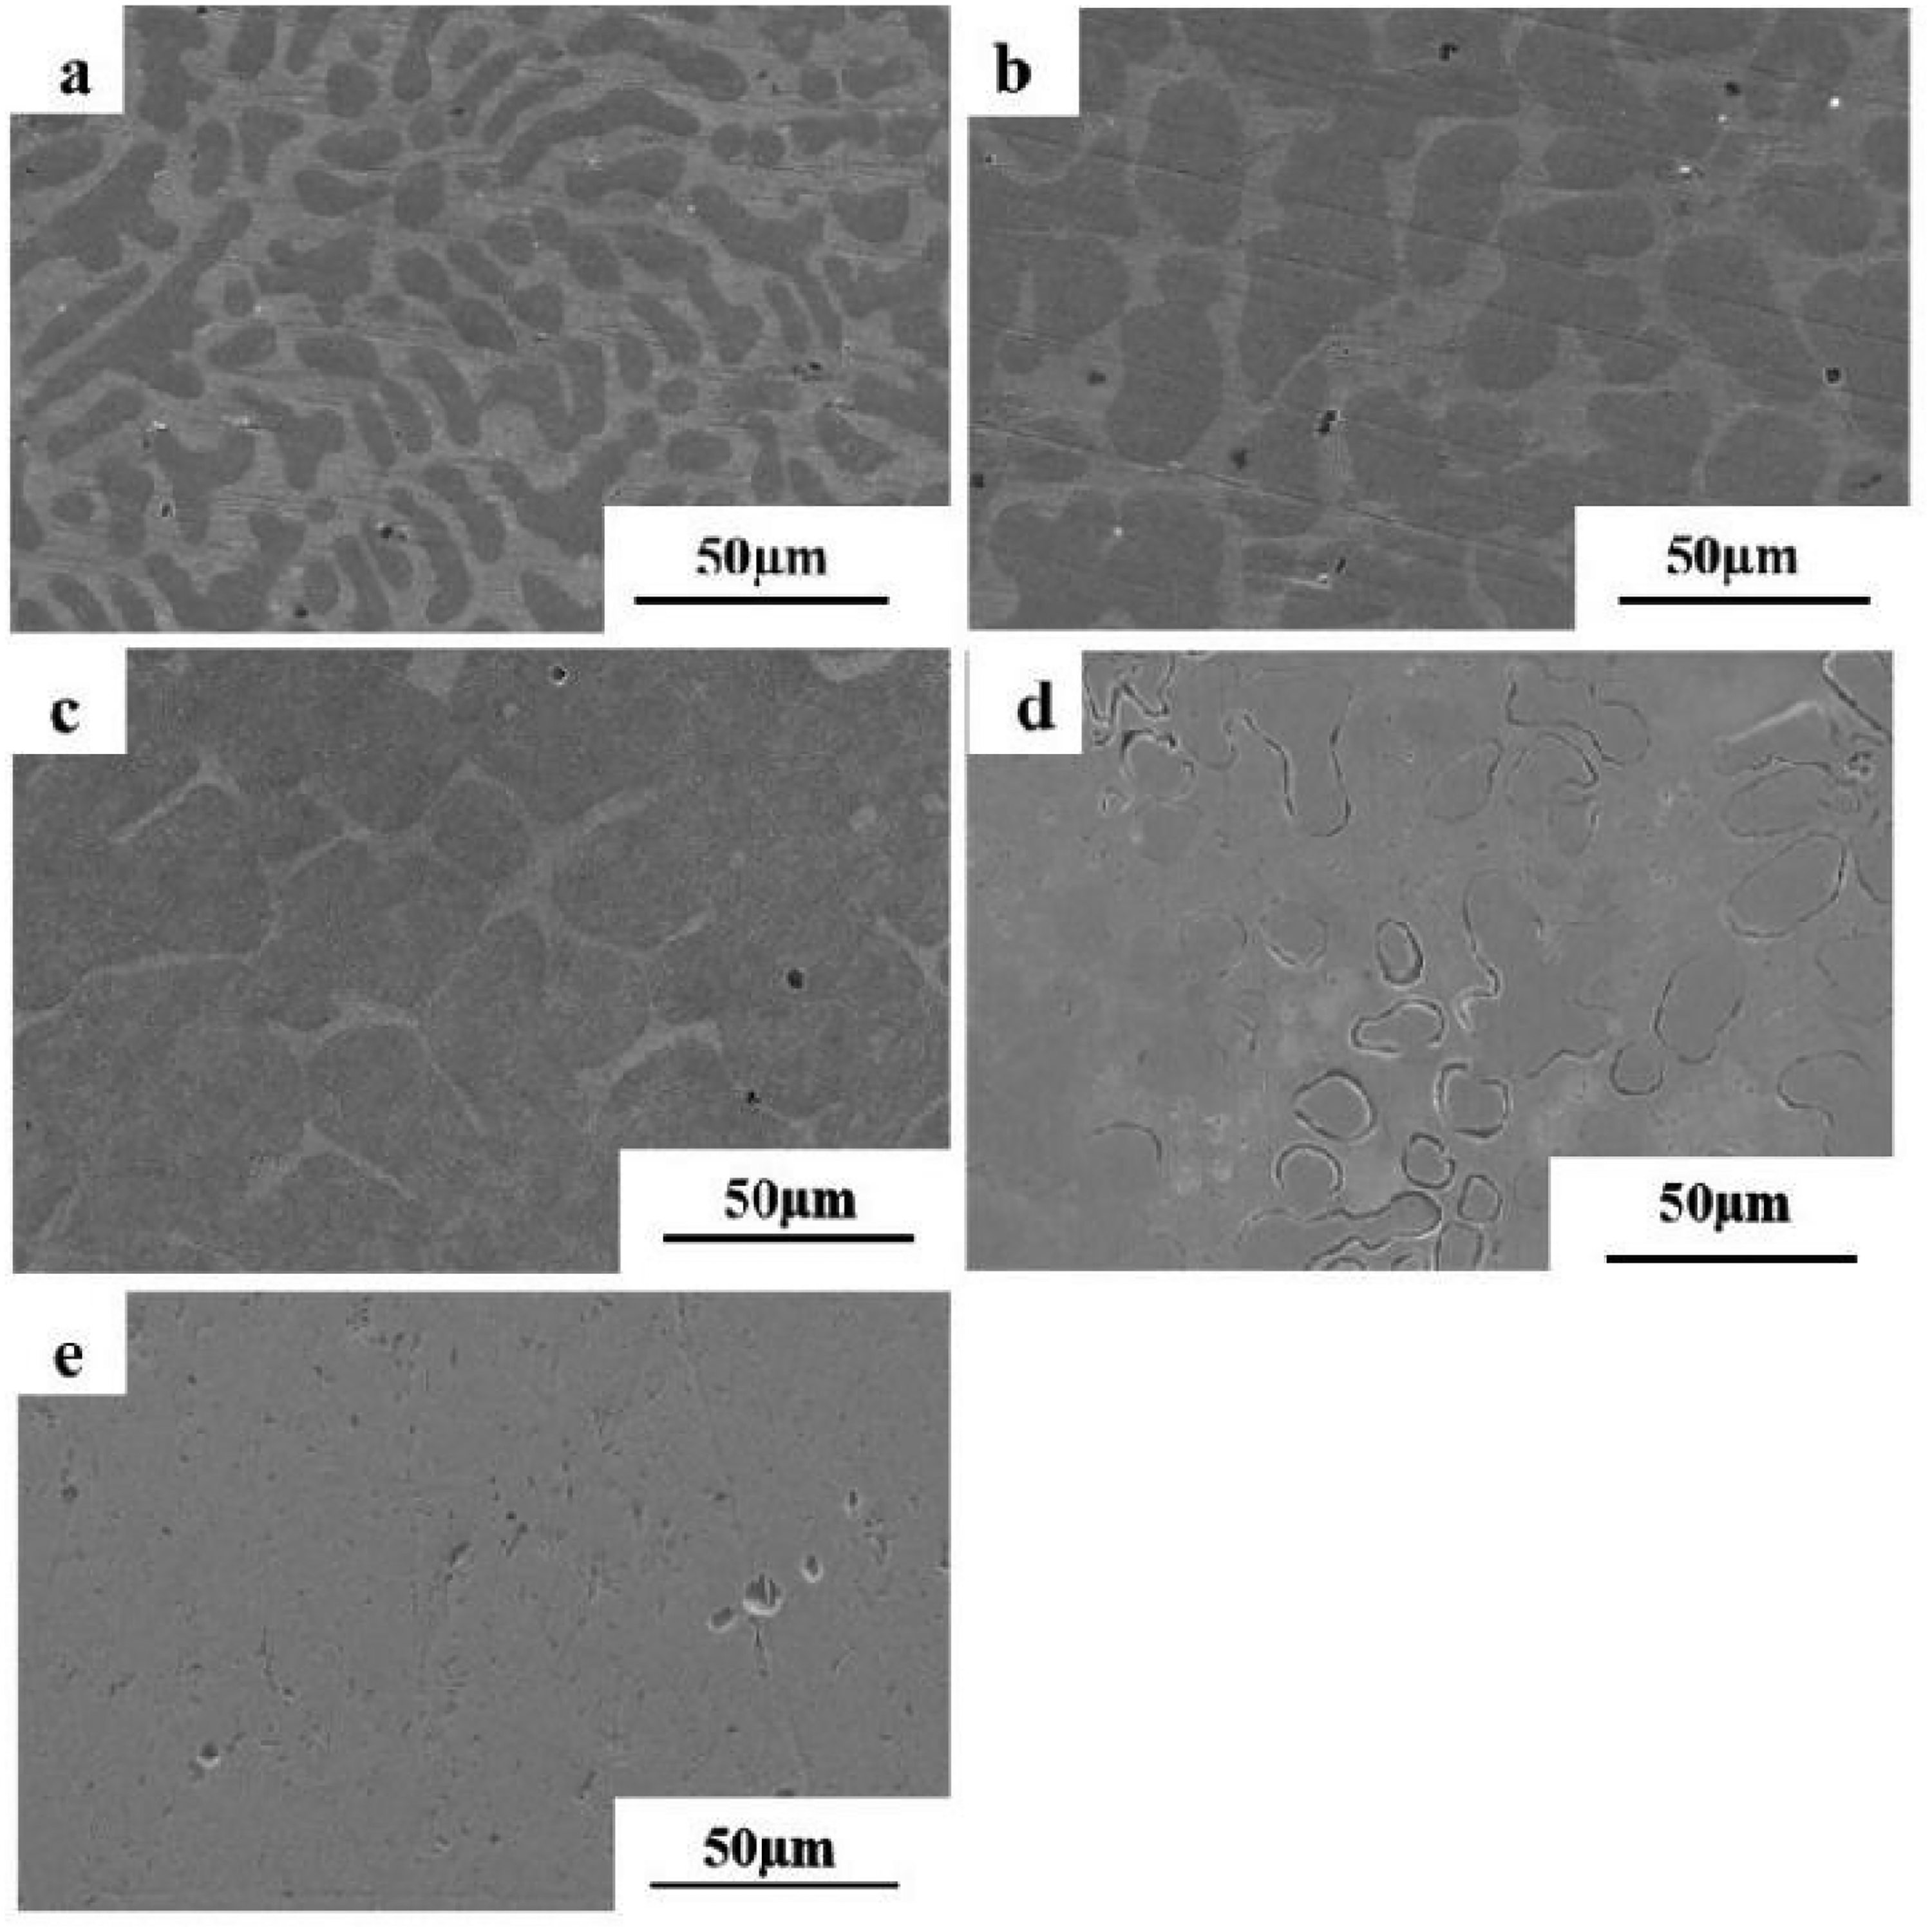
Figure 2 shows the microstructure morphology of the FeCrMnAlCux high-entropy alloy. The alloy exhibited a typical dendritic morphology. The variation in the Cu element content led to significant changes in dendrite size. As the Cu content decreased, the size of the dendritic regions (DR) continuously increased, while the size of the interdendritic regions continuously decreased. At x = 2.0–1.5, the grain size was relatively small. At x = 1–0.5, the grain size gradually increased, and at x = 0, the alloy exhibited the largest grain size. This indicates that higher Cu levels tended to result in grain size refinement.
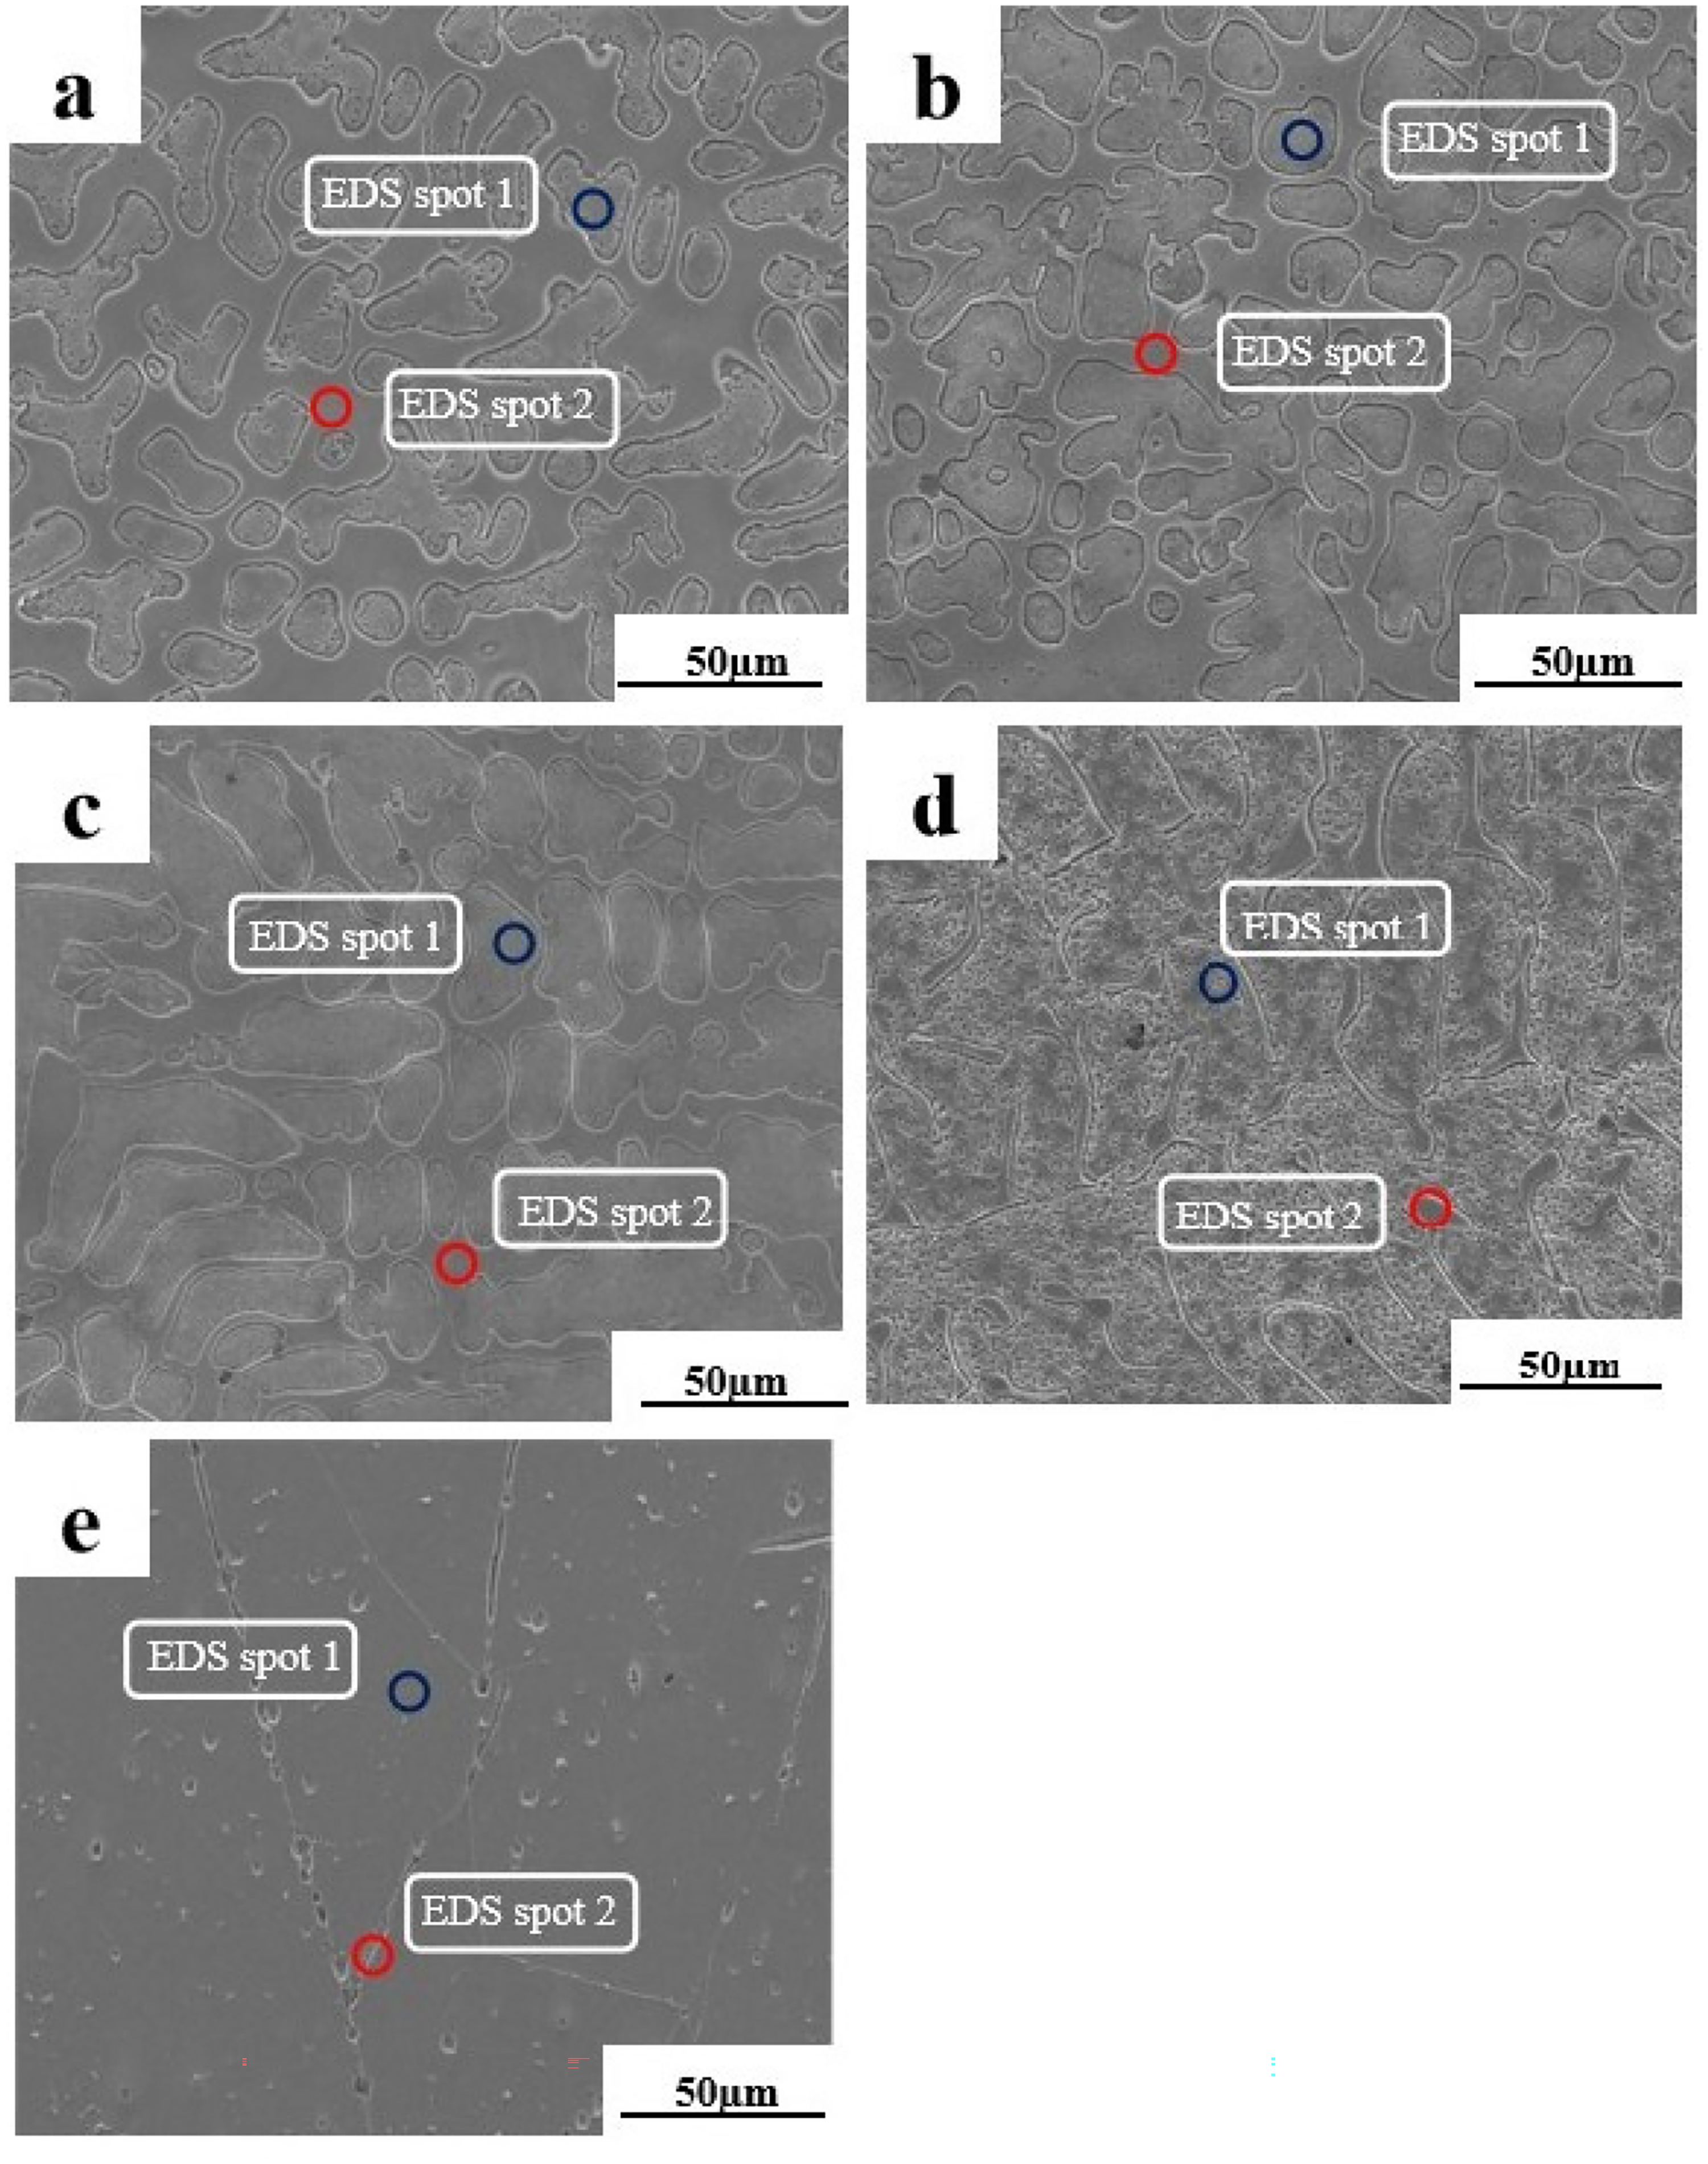
Scanning electron microscopy image of the FeCrMnAlCux high-entropy alloy: (a) x = 2.0, (b) x = 1.5, (c) x = 1.0, (d) x = 0.5, and (e) x = 0.
Figure 3 shows the EDS image of the FeCrMnAl high-entropy alloy surface, while Figure 4 depicts the EDS image of the FeCrMnAlCu high-entropy alloy surface. The EDS image of the alloy surface at x = 2.0, 1.5, and 0.5 was similar to that at x = 1.0 and is thus not described again in the text. Table 3 presents the point-scan EDS results of the FeCrMnAlCux high-entropy alloy. The surface scan EDS images combined with the point-scan EDS results revealed that in the Cu-containing alloy, the dendritic regions were mainly enriched with Fe and Cr elements. Owing to the relatively high positive mixing enthalpy between Cu and Fe, Cr, and Mn elements, Cu atoms segregated at the dendritic boundaries (ID) and grain boundaries, resulting in the dendritic boundaries becoming Cu-enriched regions and the dendritic regions becoming Cu-depleted regions. 20 This phenomenon is consistent with the uneven distribution of elements observed in multiphase high-entropy alloys.21–23 In the Cu-free FeCrMnAl high-entropy alloy, Fe, Cr, Mn, and Al were distributed almost uniformly throughout the entire grain.
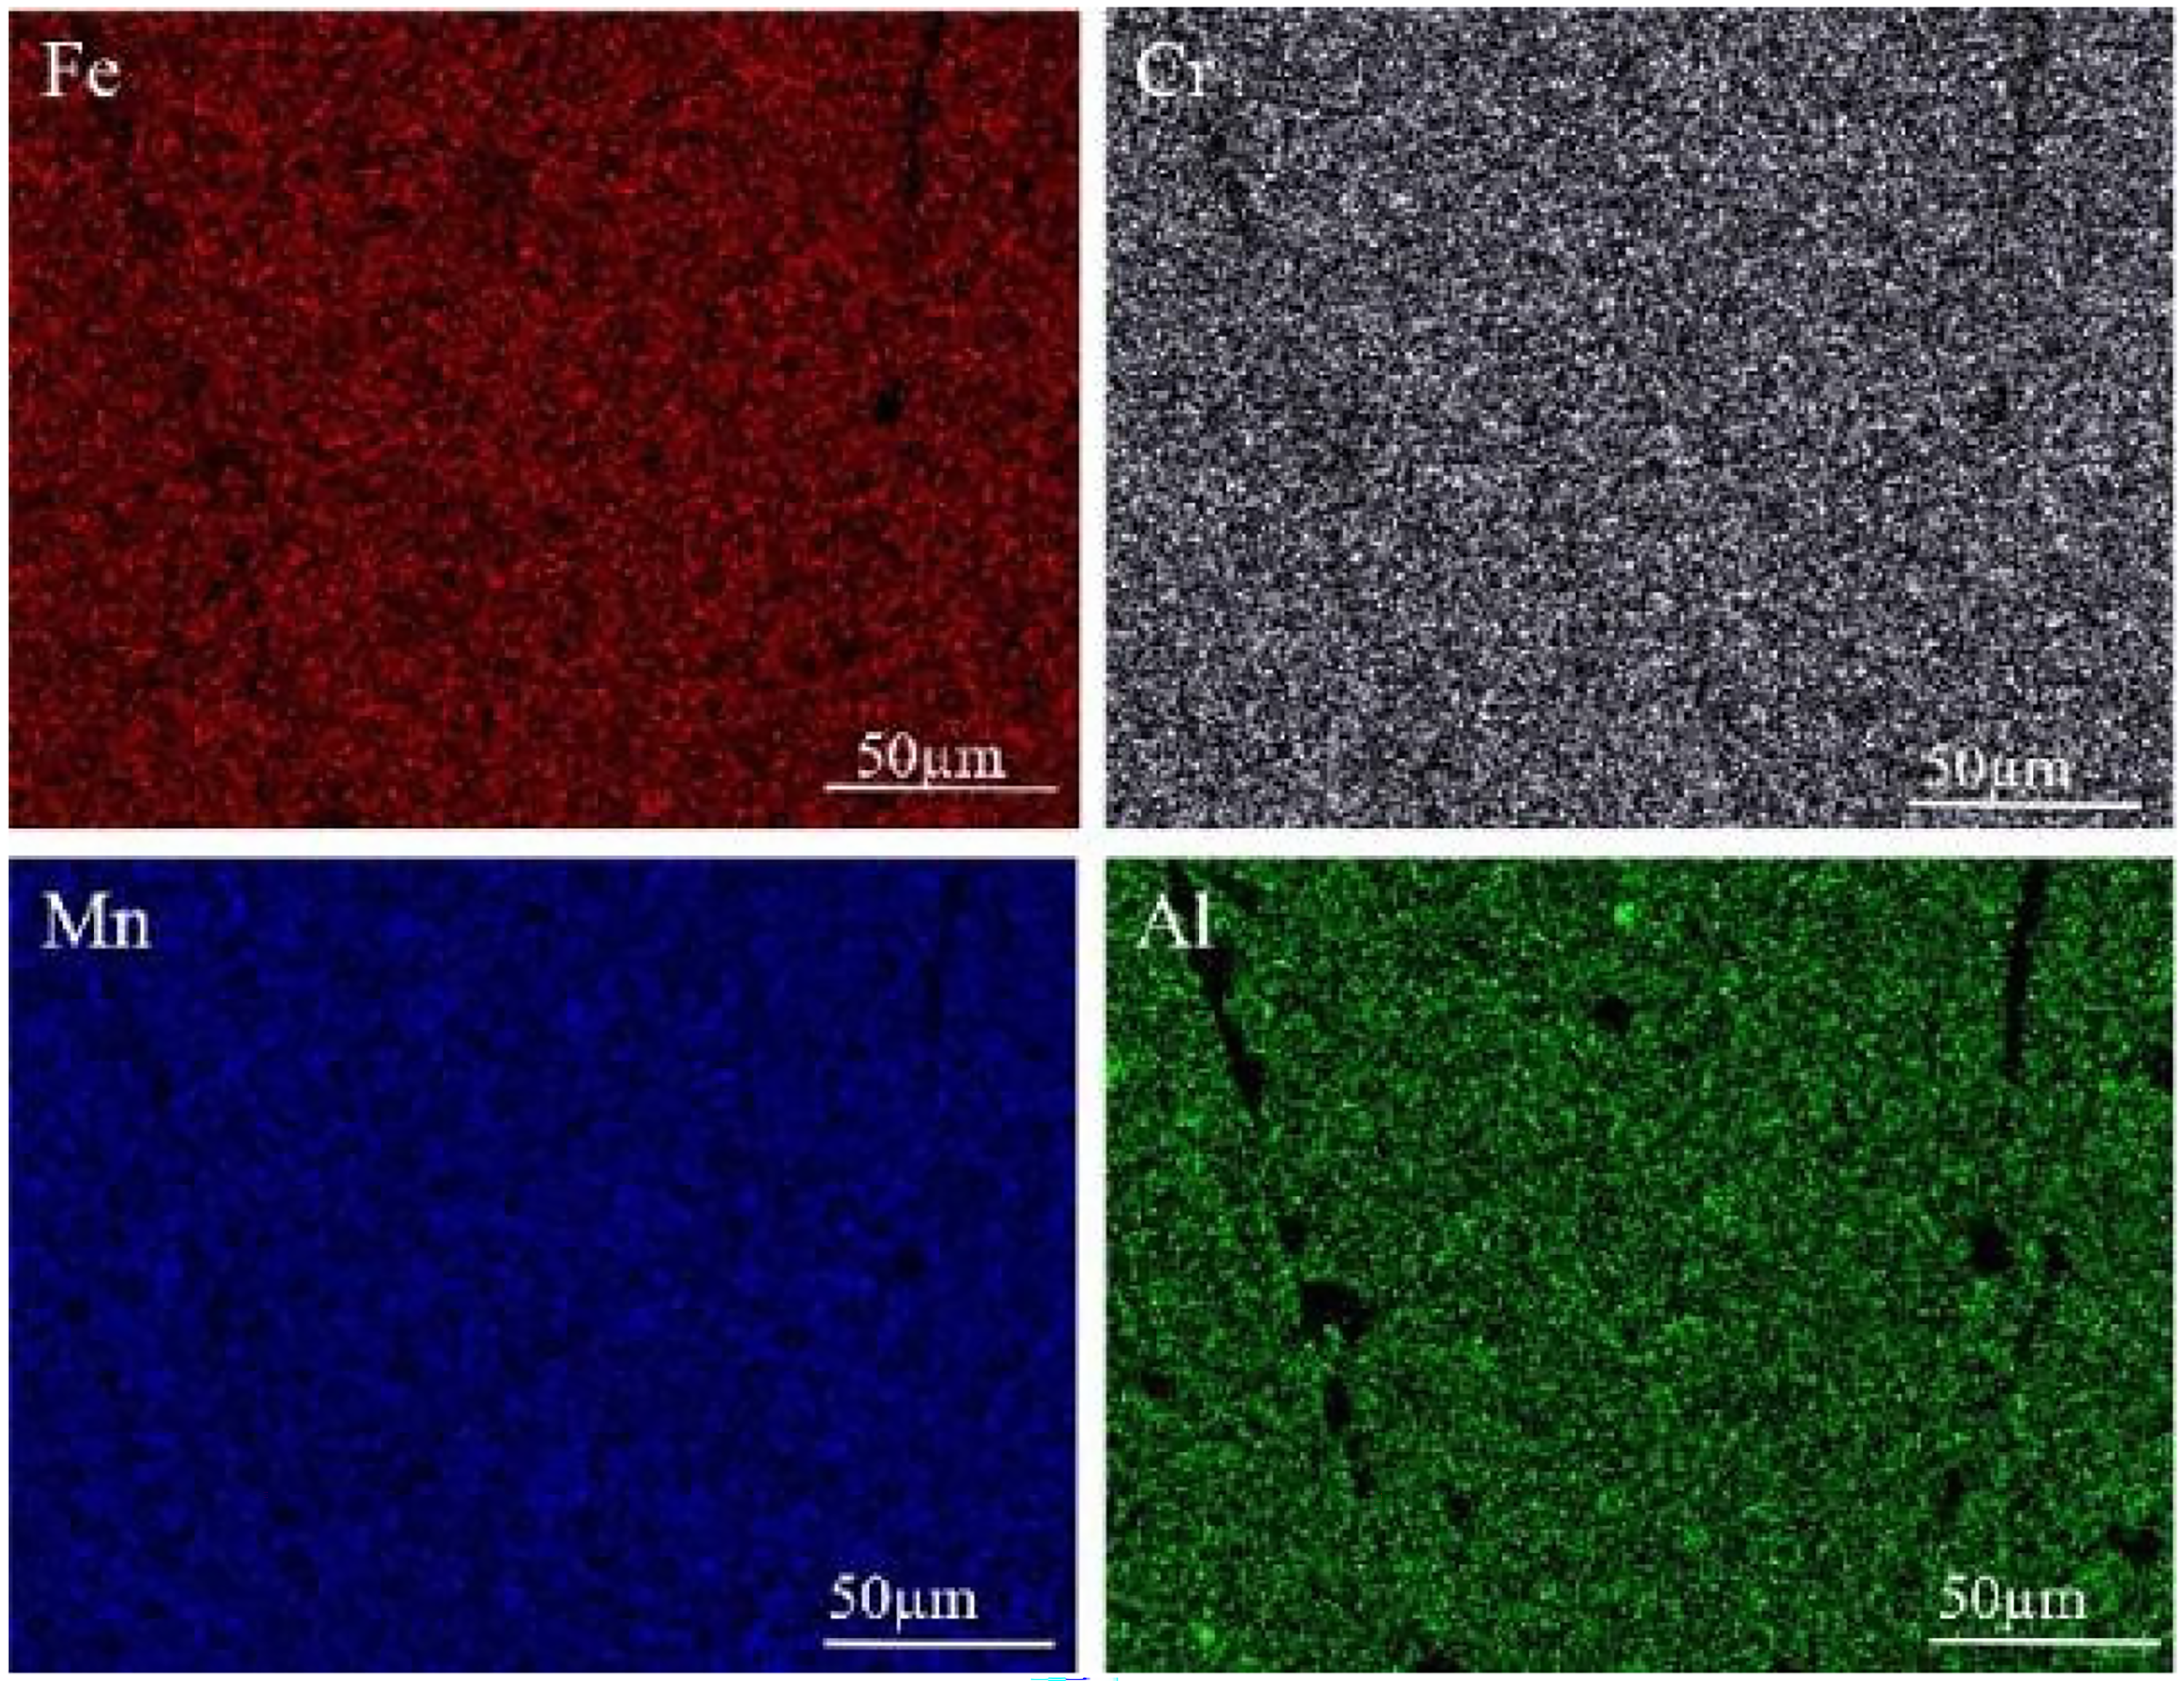
EDS diagram of the FeCrMnAl high-entropy alloy surface.

EDS diagram of the FeCrMnAlCu high-entropy alloy surface.
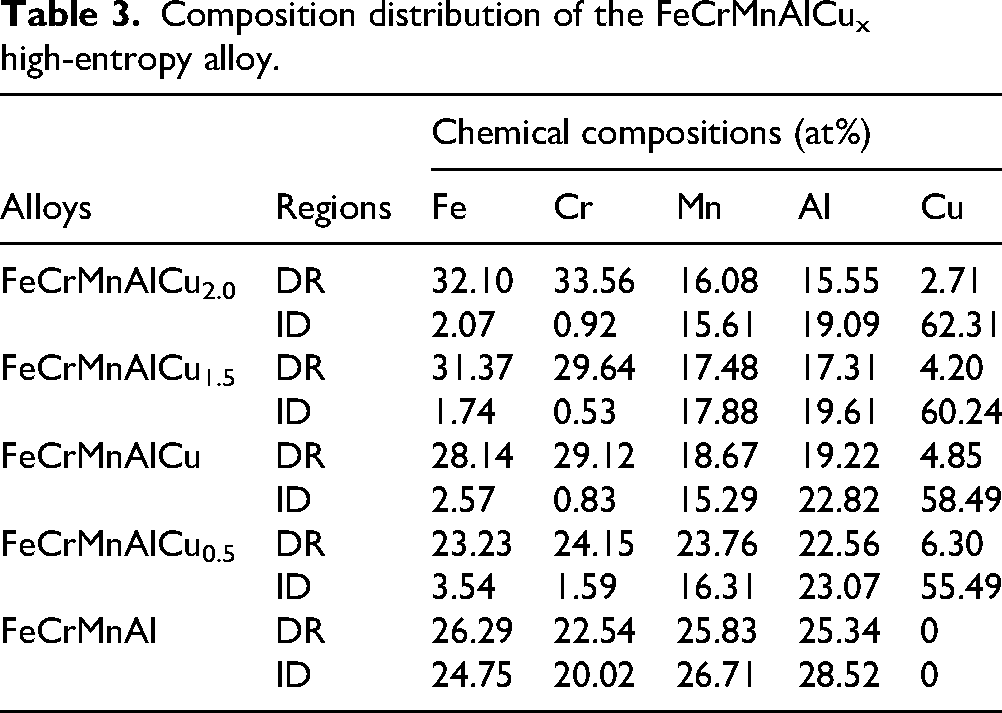
Composition distribution of the FeCrMnAlCux high-entropy alloy.
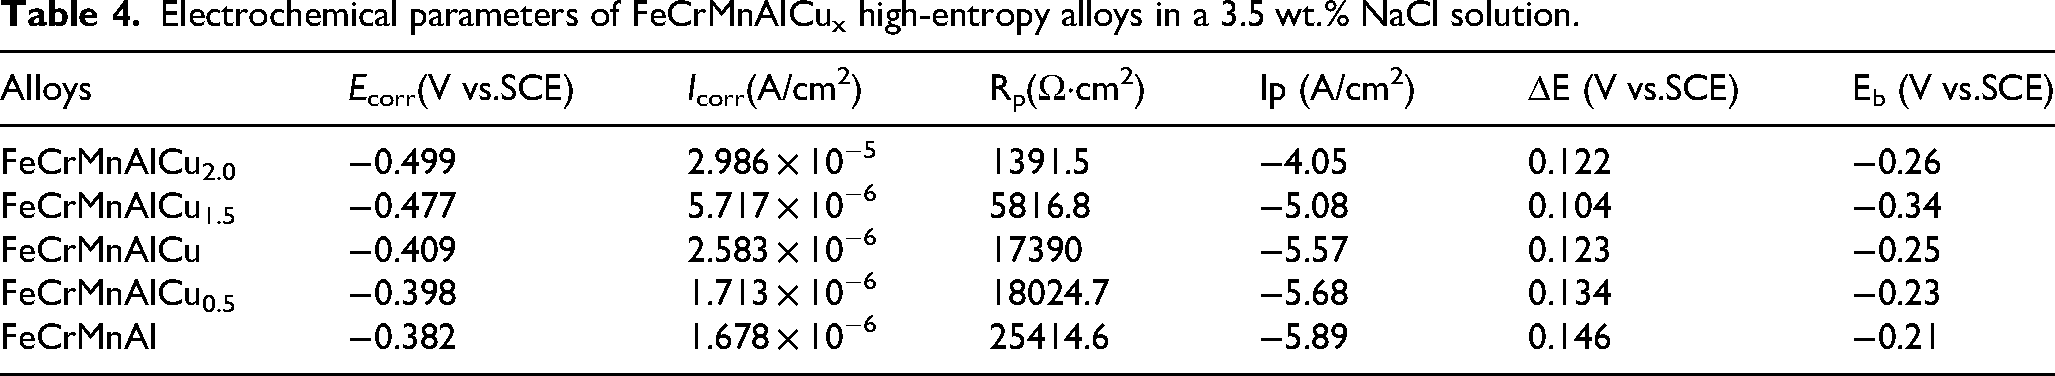
Electrochemical parameters of FeCrMnAlCux high-entropy alloys in a 3.5 wt.% NaCl solution.
Electrochemical corrosion performance of the FeCrMnAlCux high-entropy alloy
Figure 5 shows the potentiodynamic polarization curves and EIS plots of the FeCrMnAlCux high-entropy alloy in a 3.5 wt.% NaCl solution. Figure 5(a) depicts the potentiodynamic polarization curves of the FeCrMnAlCux high-entropy alloy. The corrosion potential (Ecorr), corrosion current density (Icorr), and polarization resistance (Rp) results obtained from the potentiodynamic polarization curves are presented in Table 4. With the decrease in the Cu content, the corrosion potential of the alloy shifted toward a more positive direction, and the corrosion current density decreased (Figure 5(a)). At x = 2.0, the corrosion potential of the alloy was the lowest, with a value of −0.499 V. At x = 0, the corrosion potential of the alloy was the highest, with a value of −0.382 V. Additionally, with the decrease in the Cu content, the polarization resistance of the alloy continuously increased. At x = 0, the alloy exhibited its highest polarization resistance compared with the other alloys. Comparative studies revealed that the FeCrMnAl high-entropy alloy exhibited the most positive corrosion potential, the lowest corrosion current density, and the highest polarization resistance. Therefore, FeCrMnAl exhibited the highest corrosion resistance, indicating that the reduction in the Cu content was beneficial to the corrosion resistance of the FeCrMnAlCux high-entropy alloy.
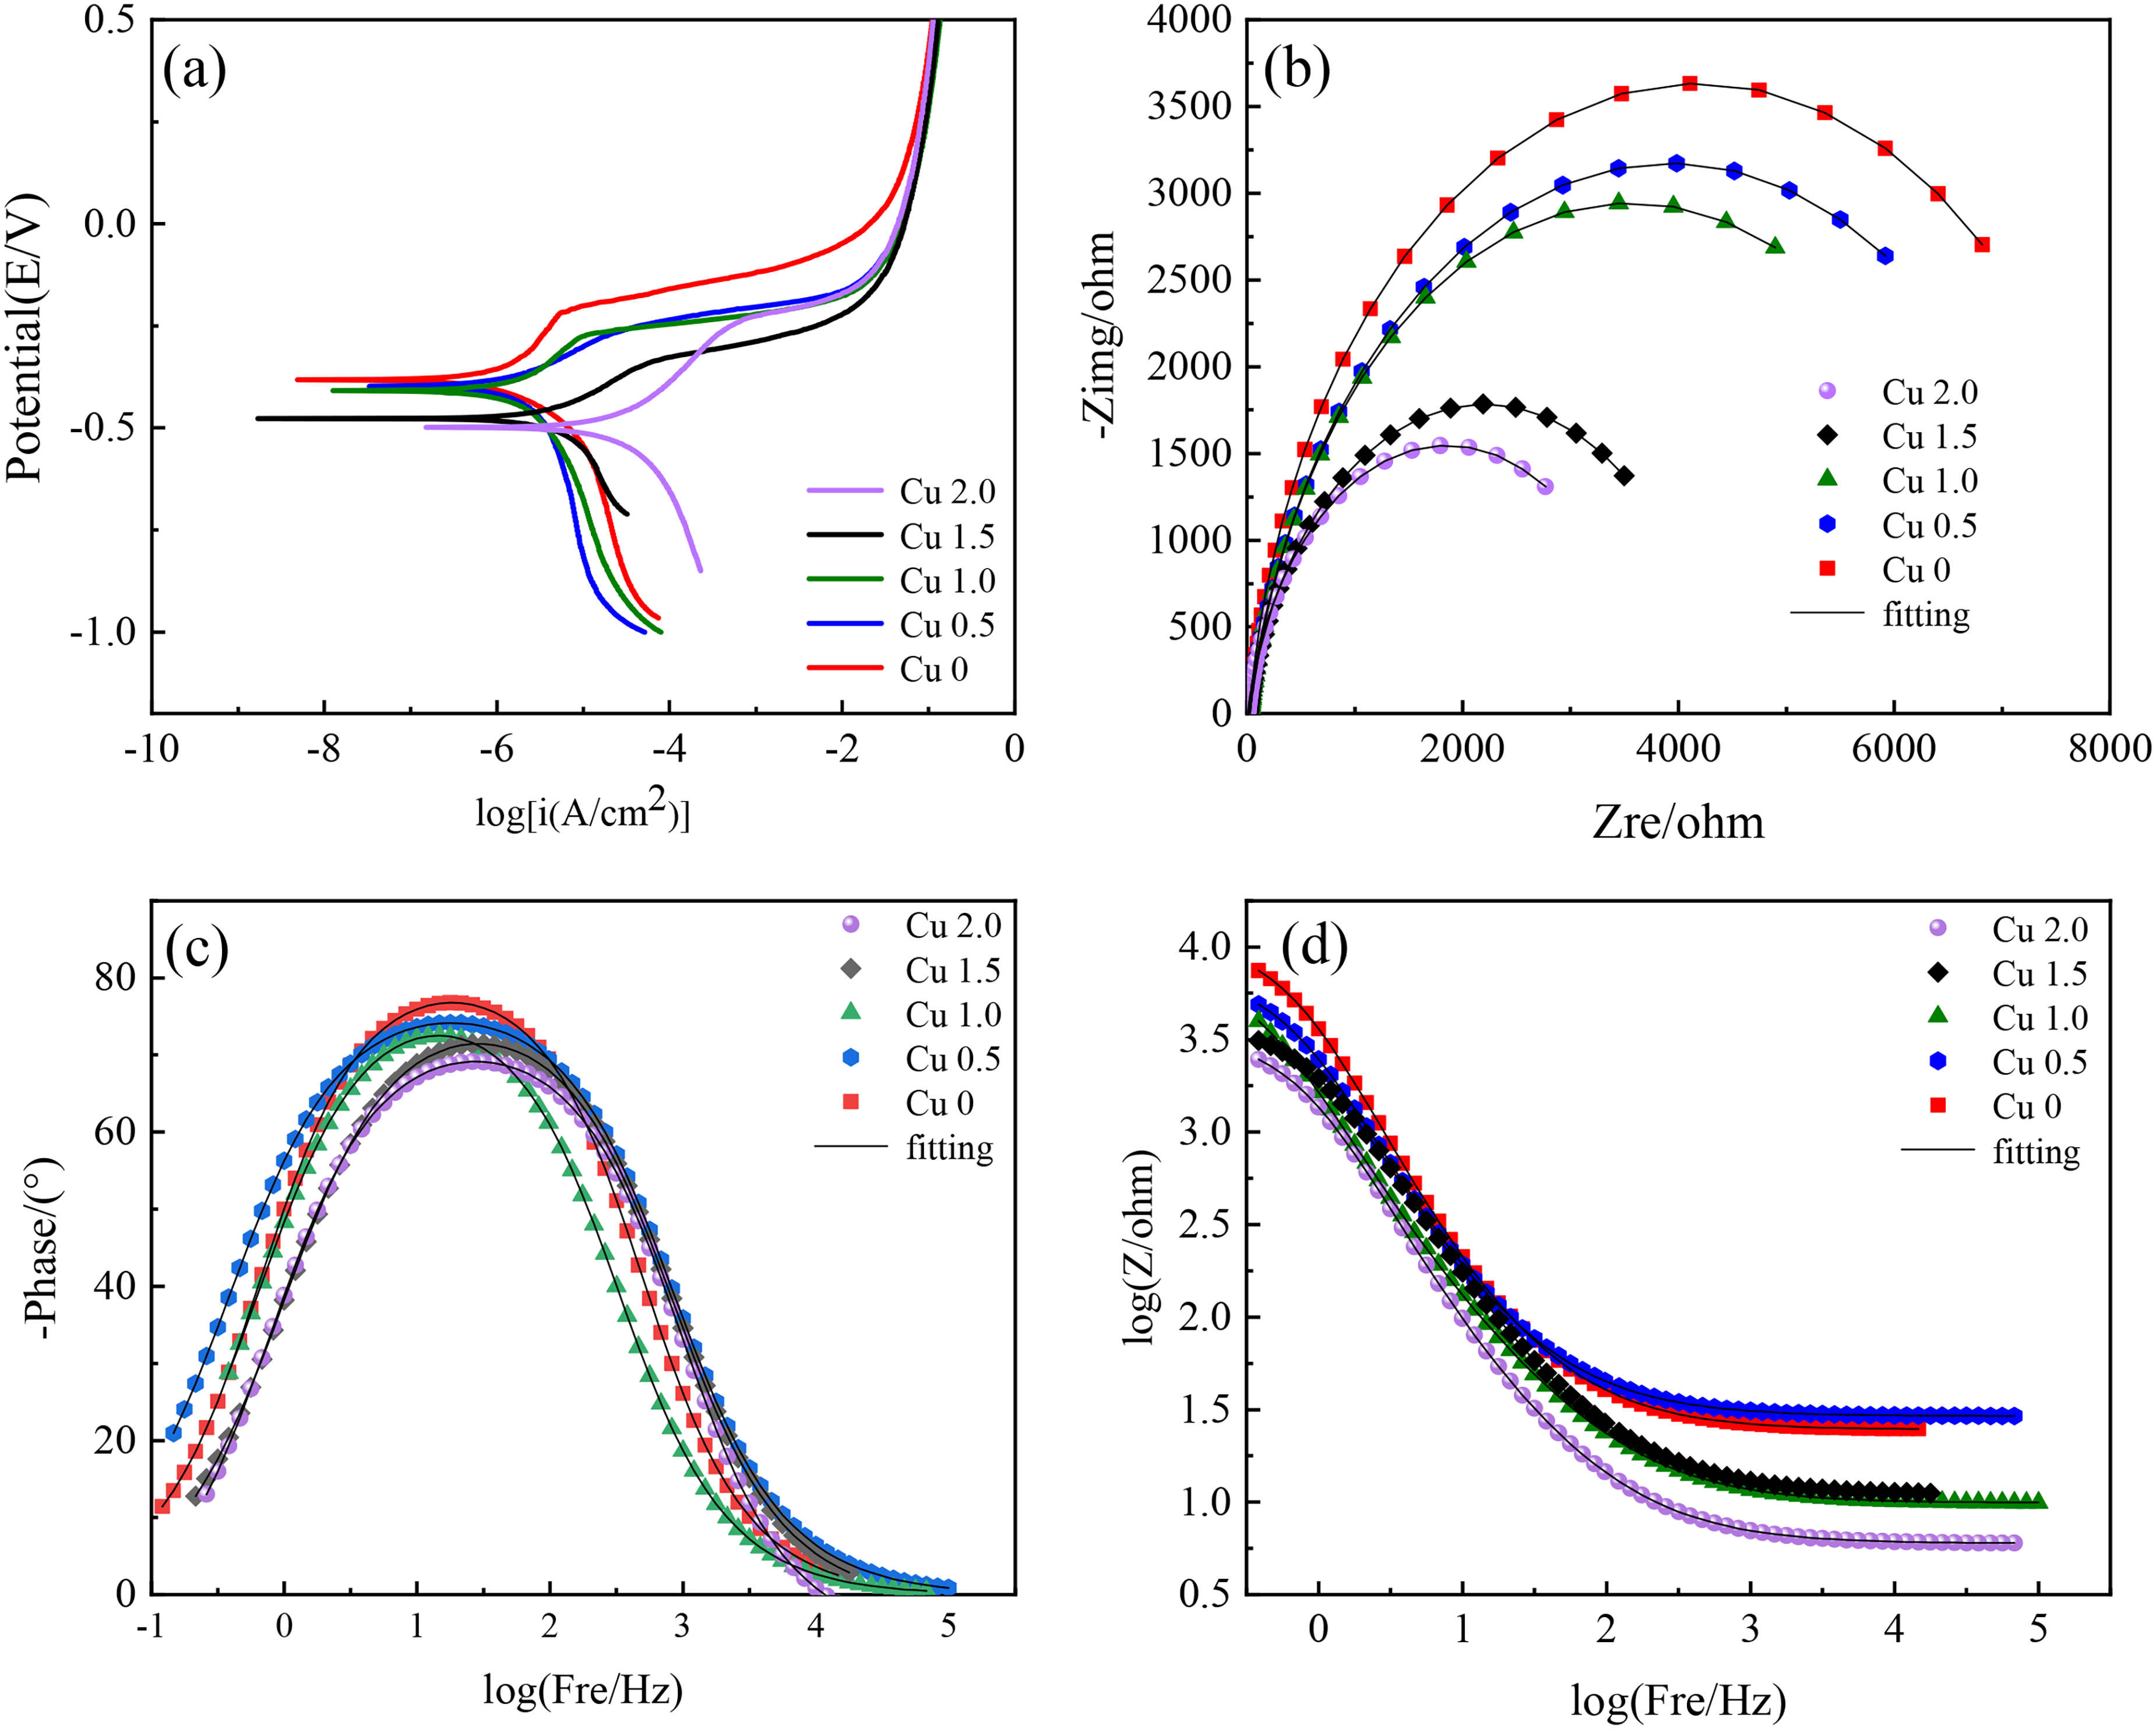
Potentiodynamic polarization curve and EIS impedance of the FeCrMnAlCux high-entropy alloy in a 3.5 wt.% NaCl solution: (a) polarization curve; (b) Nyquist plot; (c, d) Bode plot.
Equivalent circuit parameters of EIS results.
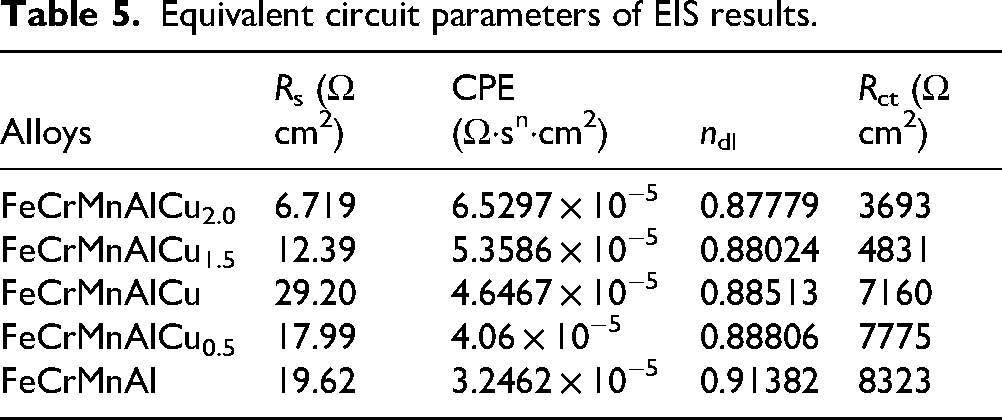
Figure 5(b) shows the Nyquist plot of the FeCrMnAlCux high-entropy alloy. The graph reveals that as the Cu content decreased, the impedance arc radius of the FeCrMnAlCux high-entropy alloy gradually increased: FeCrMnAl > FeCrMnAlCu0.5 > FeCrMnAlCu > FeCrMnAlCu1.5 > FeCrMnAlCu2.0. The FeCrMnAl high-entropy alloy exhibited the largest impedance arc radius, demonstrating the good corrosion resistance of the alloy. Figure 5(c) and (d) show the Bode plots of the FeCrMnAlCux high-entropy alloy. With the decrease in the Cu content, the phase angle and impedance modulus of the FeCrMnAlCux high-entropy alloy gradually increased. The Cu-free alloy exhibited the highest phase angle and the maximum impedance modulus. This indicates that the FeCrMnAl high-entropy alloy possessed the most outstanding corrosion resistance, consistent with the polarization curve results.
To further analyze the electrochemical behavior of the FeCrMnAlCux high-entropy alloy in a 3.5 wt.% NaCl solution, the electrochemical impedance data of the FeCrMnAlCux high-entropy alloy were fitted using the equivalent circuit model shown in Figure 6. In the equivalent circuit model, Rs represents the solution resistance, and Rct represents the charge-transfer resistance of the electrode. CPE denotes a constant-phase element that replaces an ideal capacitor. It is used to eliminate deviations between double-layer capacitance and pure capacitance, thereby allowing for a more accurate study of the alloy's impedance behavior. 24 Table 5 presents the impedance data fitted using the ZView software. n (0 ≤ n ≤ 1) represents the fitting exponent. n = 0 indicates pure resistance, while n = 1 indicates pure capacitance. The n values in the table are all greater than 0.8, indicating that the surface condition of the alloy was uniform. With the decrease in the Cu content, the CPE capacitance of the FeCrMnAlCux high-entropy alloy gradually decreased, while the n value gradually increased. The Cu-free FeCrMnAl high-entropy alloy exhibited the lowest CPE and the highest n. The Rct value gradually increased with the decreasing Cu content. The higher the Rct value, the higher the corrosion resistance of the alloy. At x = 0, the alloy exhibited the highest Rct value (8323 Ω·cm²). This indicates that the FeCrMnAl high-entropy alloy exhibited outstanding corrosion resistance.
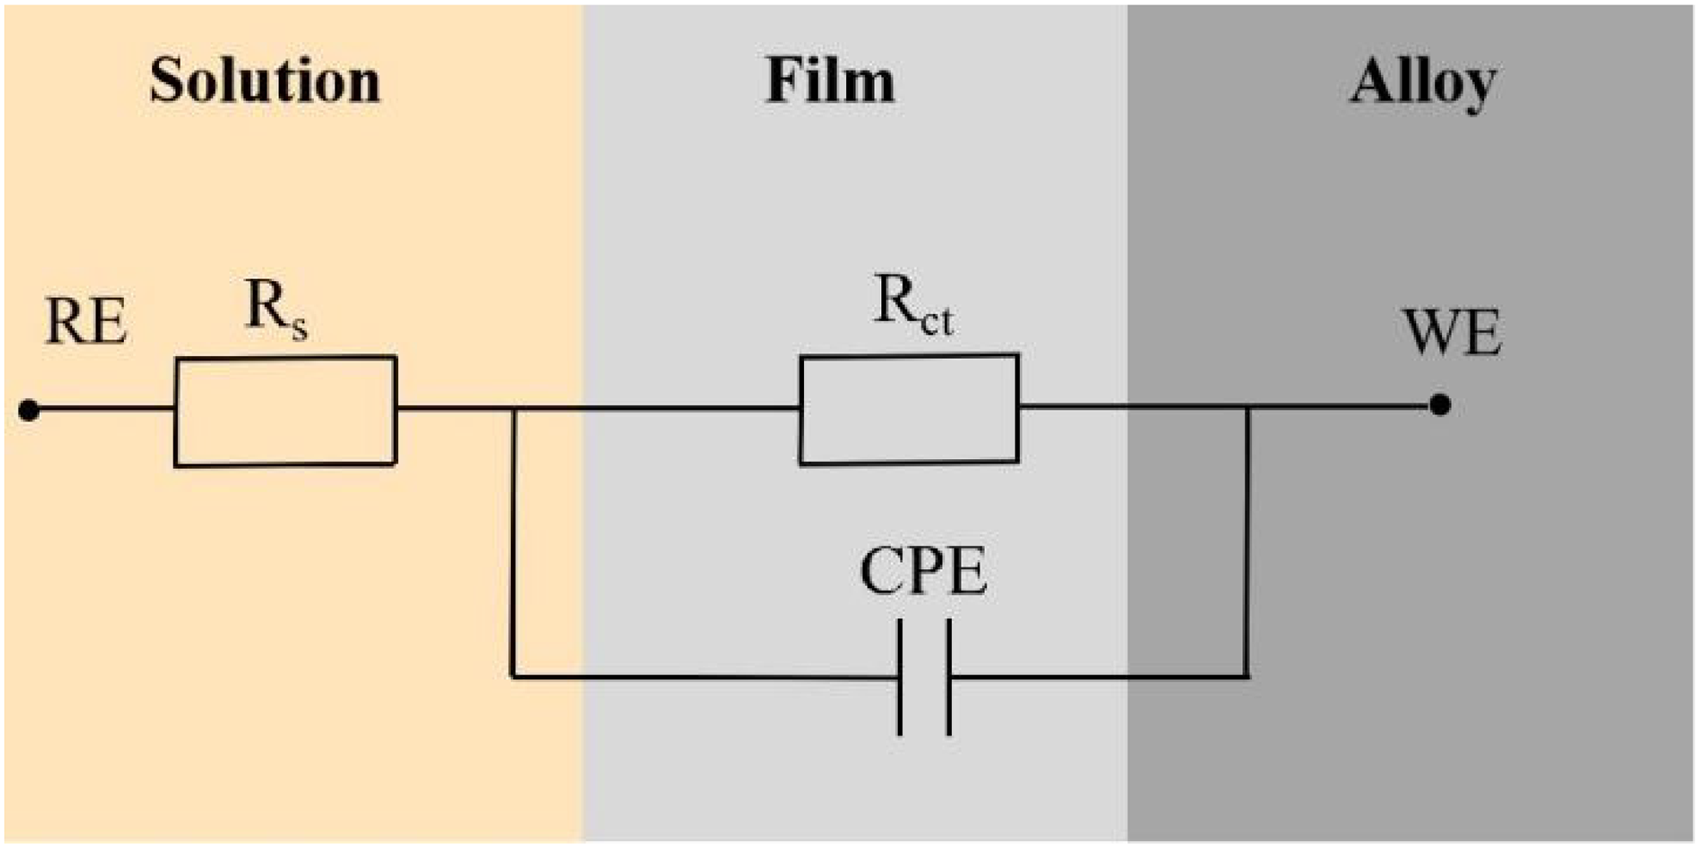
Equivalent circuit model of the FeCrMnAlCux high-entropy alloy.
Percentage of substance content in each element on the surface of FeCrMnAlCux(x = 2.0,1,0,0) high-entropy alloy.
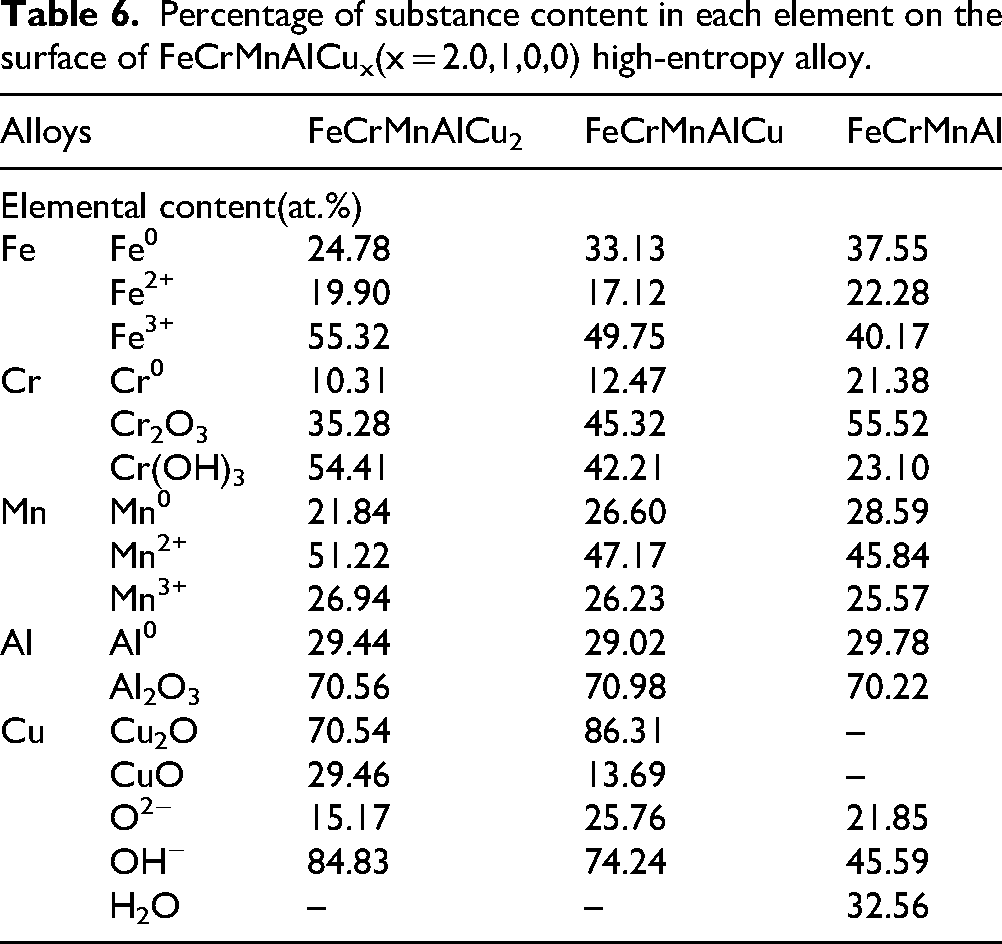
Figure 7 shows the surface morphology of the FeCrMnAlCux high-entropy alloys after electrochemical corrosion in a 3.5 wt.% NaCl solution. The FeCrMnAlCux high-entropy alloys underwent selective corrosion, primarily in the interdendritic regions (Figure 7(a)–(e)). At a relatively high Cu content, severe corrosion marks occurred on the alloy surface, accompanied by wider corrosion fissures. With the decrease in the Cu element content, the corrosion area of the FeCrMnAlCux high-entropy alloys decreased, and the corrosion degree of the alloy significantly decreased. At x = 0, the alloy surface exhibited only slight corrosion traces and a small number of corrosion spots. This indicates that the FeCrMnAl high-entropy alloy exhibited excellent corrosion resistance, consistent with the polarization test results.
Surface morphology of the FeCrMnAlCux high-entropy alloys after electrochemical testing: (a) x = 2.0, (b) x = 1.5, (c) x = 1.0, (d) x = 0.5, and (e) x = 0.
Immersion corrosion of the FeCrMnAlCux high-entropy alloy
Figure 8 shows the corrosion cross section and EDS images of FeCrMnAlCux (x = 2.0, 1.0, 0) high-entropy alloys after immersion for 168 h. An oxide layer existed on the corrosion cross section of the FeCrMnAlCux (x = 2.0, 1.0, 0) high-entropy alloys. According to the EDS results, the dendritic regions of the FeCrMnAlCux (x = 2.0, 1.0) high-entropy alloys were mainly composed of Cr, Fe, and Mn elements. The interdendritic regions were mainly enriched with Cu elements, while Al elements were distributed almost uniformly.

Corrosion cross section and EDS diagram of FeCrMnAlCux (x = 2.0, 1.0, 0) high-entropy alloy after soaking for 168 h.
According to Equation (1), the average corrosion rates of the FeCrMnAlCux high-entropy alloys were calculated as follows: FeCrMnAl (0.0465 mm/a) < FeCrMnAlCu0.5 (0.0560 mm/a) < FeCrMnAlCu (0.0583 mm/a) < FeCrMnAlCu1.5 (0.0728 mm/a) < FeCrMnAlCu2.0 (0.1 mm/a). The FeCrMnAl high-entropy alloy exhibited the lowest corrosion rate (0.0465 mm/a). Figure 9 shows the average corrosion rates of the FeCrMnAlCux high-entropy alloys after immersion in a 3.5 wt.% NaCl solution for 168 h. The corrosion rate of the alloys gradually decreased with decreasing Cu content. At x = 0, the corrosion rate of the alloy reached its minimum value, indicating that the FeCrMnAl high-entropy alloy exhibited the highest corrosion resistance.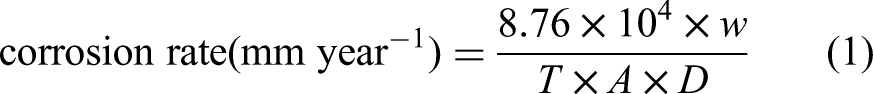
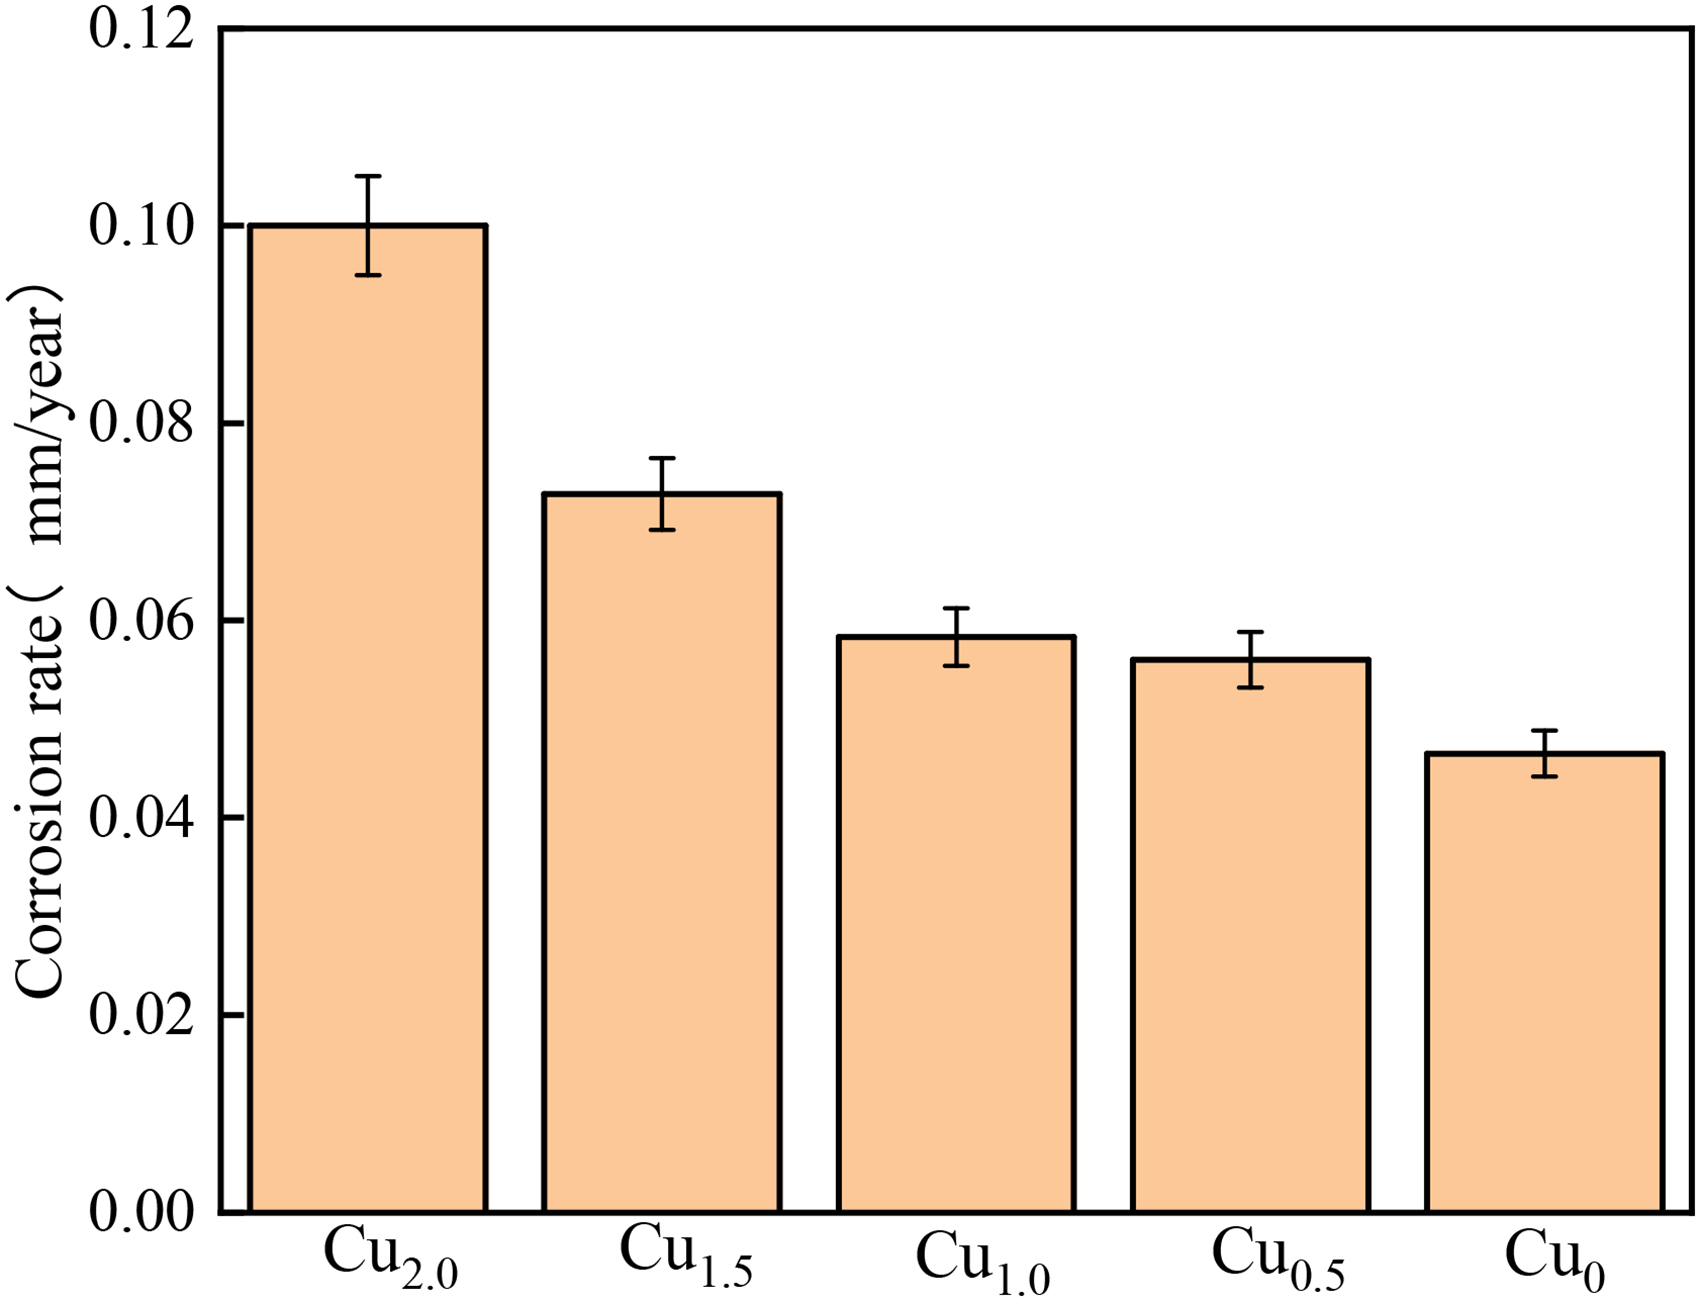
Average corrosion rate of FeCrMnAlCux after immersion of high-entropy alloy: (a) x = 2.0, (b) x = 1.5, (c) x = 1.0, (d) x = 0.5, and (e) x = 0.
Here, W represents the difference in the mass of the sample before and after corrosion (g), T represents the immersion time of the sample in the corrosive solution (h), A represents the exposed surface area of the sample in the corrosive solution (cm2), and D represents the density of the alloy sample (g/cm3).
Figure 10 shows the surface topography of the FeCrMnAlCux high-entropy alloy after immersion in a 3.5 wt.% NaCl solution for 168 h. The decrease in the Cu content led to a gradual reduction in the corrosion of the alloy. The maximum corrosion depth of the FeCrMnAlCu2 high-entropy alloy reached 14 µm (Figure 10(a)). As the Cu element content decreased continuously (Figure 10(c)) the maximum corrosion depth of the alloy decreased. At x = 1.0, the maximum corrosion depth of the alloy was 5 µm, and at x = 0 (Figure 10(e)), the maximum corrosion depth was the smallest (991 nm). This indicates that the Cu content significantly influenced the corrosion resistance of the alloy. At x = 0, the alloy exhibited the highest corrosion resistance, consistent with the electrochemical experiment results.

Surface three-dimensional morphology of the FeCrMnAlCux high-entropy alloy after 168-h immersion: (a) x = 2.0, (b) x = 1.5, (c) x = 1.0, (d) x = 0.5, and (e) x = 0.
Corrosion product analysis of the FeCrMnAlCux high-entropy alloy
Figure 11 shows the XPS spectra of FeCrMnAlCux (x = 2.0, 1.0, 0) high-entropy alloys in a 3.5 wt.% NaCl solution. The spectra displayed O1s, Fe 2p3/2, Cr 2p3/2, Mn 2p3/2, Al 2p, and Cu 2p3/2 peaks, and corresponding compounds were identified according to comparison with the NIST database. Figure 11 reveals that the Fe 2p3/2 spectrum was divided into Fe, Fe3+, and Fe2+ peaks, corresponding to elemental iron and the respective oxides and hydroxides. The Cr 2p3/2 spectrum can be decomposed into three peaks corresponding to metallic Cr, metal oxide Cr2O3, and metal hydroxide Cr(OH)3. The Mn 2p3/2 spectrum consisted of three components: Mn, Mn2+, and Mn3+. Mn2+ and Mn3+ were related to the oxides and hydroxides of Mn. The Al 2p spectrum can be divided into peaks corresponding to metallic Al and Al2O3. The Cu 2p spectrum consisted of Cu+ and Cu2+, corresponding to Cu2O and CuO, respectively. The O 1 s spectra of the FeCrMnAlCu2 and FeCrMnAlCu high-entropy alloys were mainly composed of O2− and OH− species, respectively corresponding to the oxides and hydroxides of Fe, Cr, Mn, Al, and Cu elements. The O 1 s spectrum of the high-entropy alloy FeCrMnAl can be resolved into three peaks corresponding to O2−, OH−, and H2O, indicating the presence of bound water, with a binding energy of 532.8 eV. The XPS results indicated that the composite protective film formed by the oxides and hydroxides of various elements on the surface of the high-entropy alloy effectively slowed down the corrosion ion attack on the alloy, thereby enhancing the corrosion resistance of the alloy.
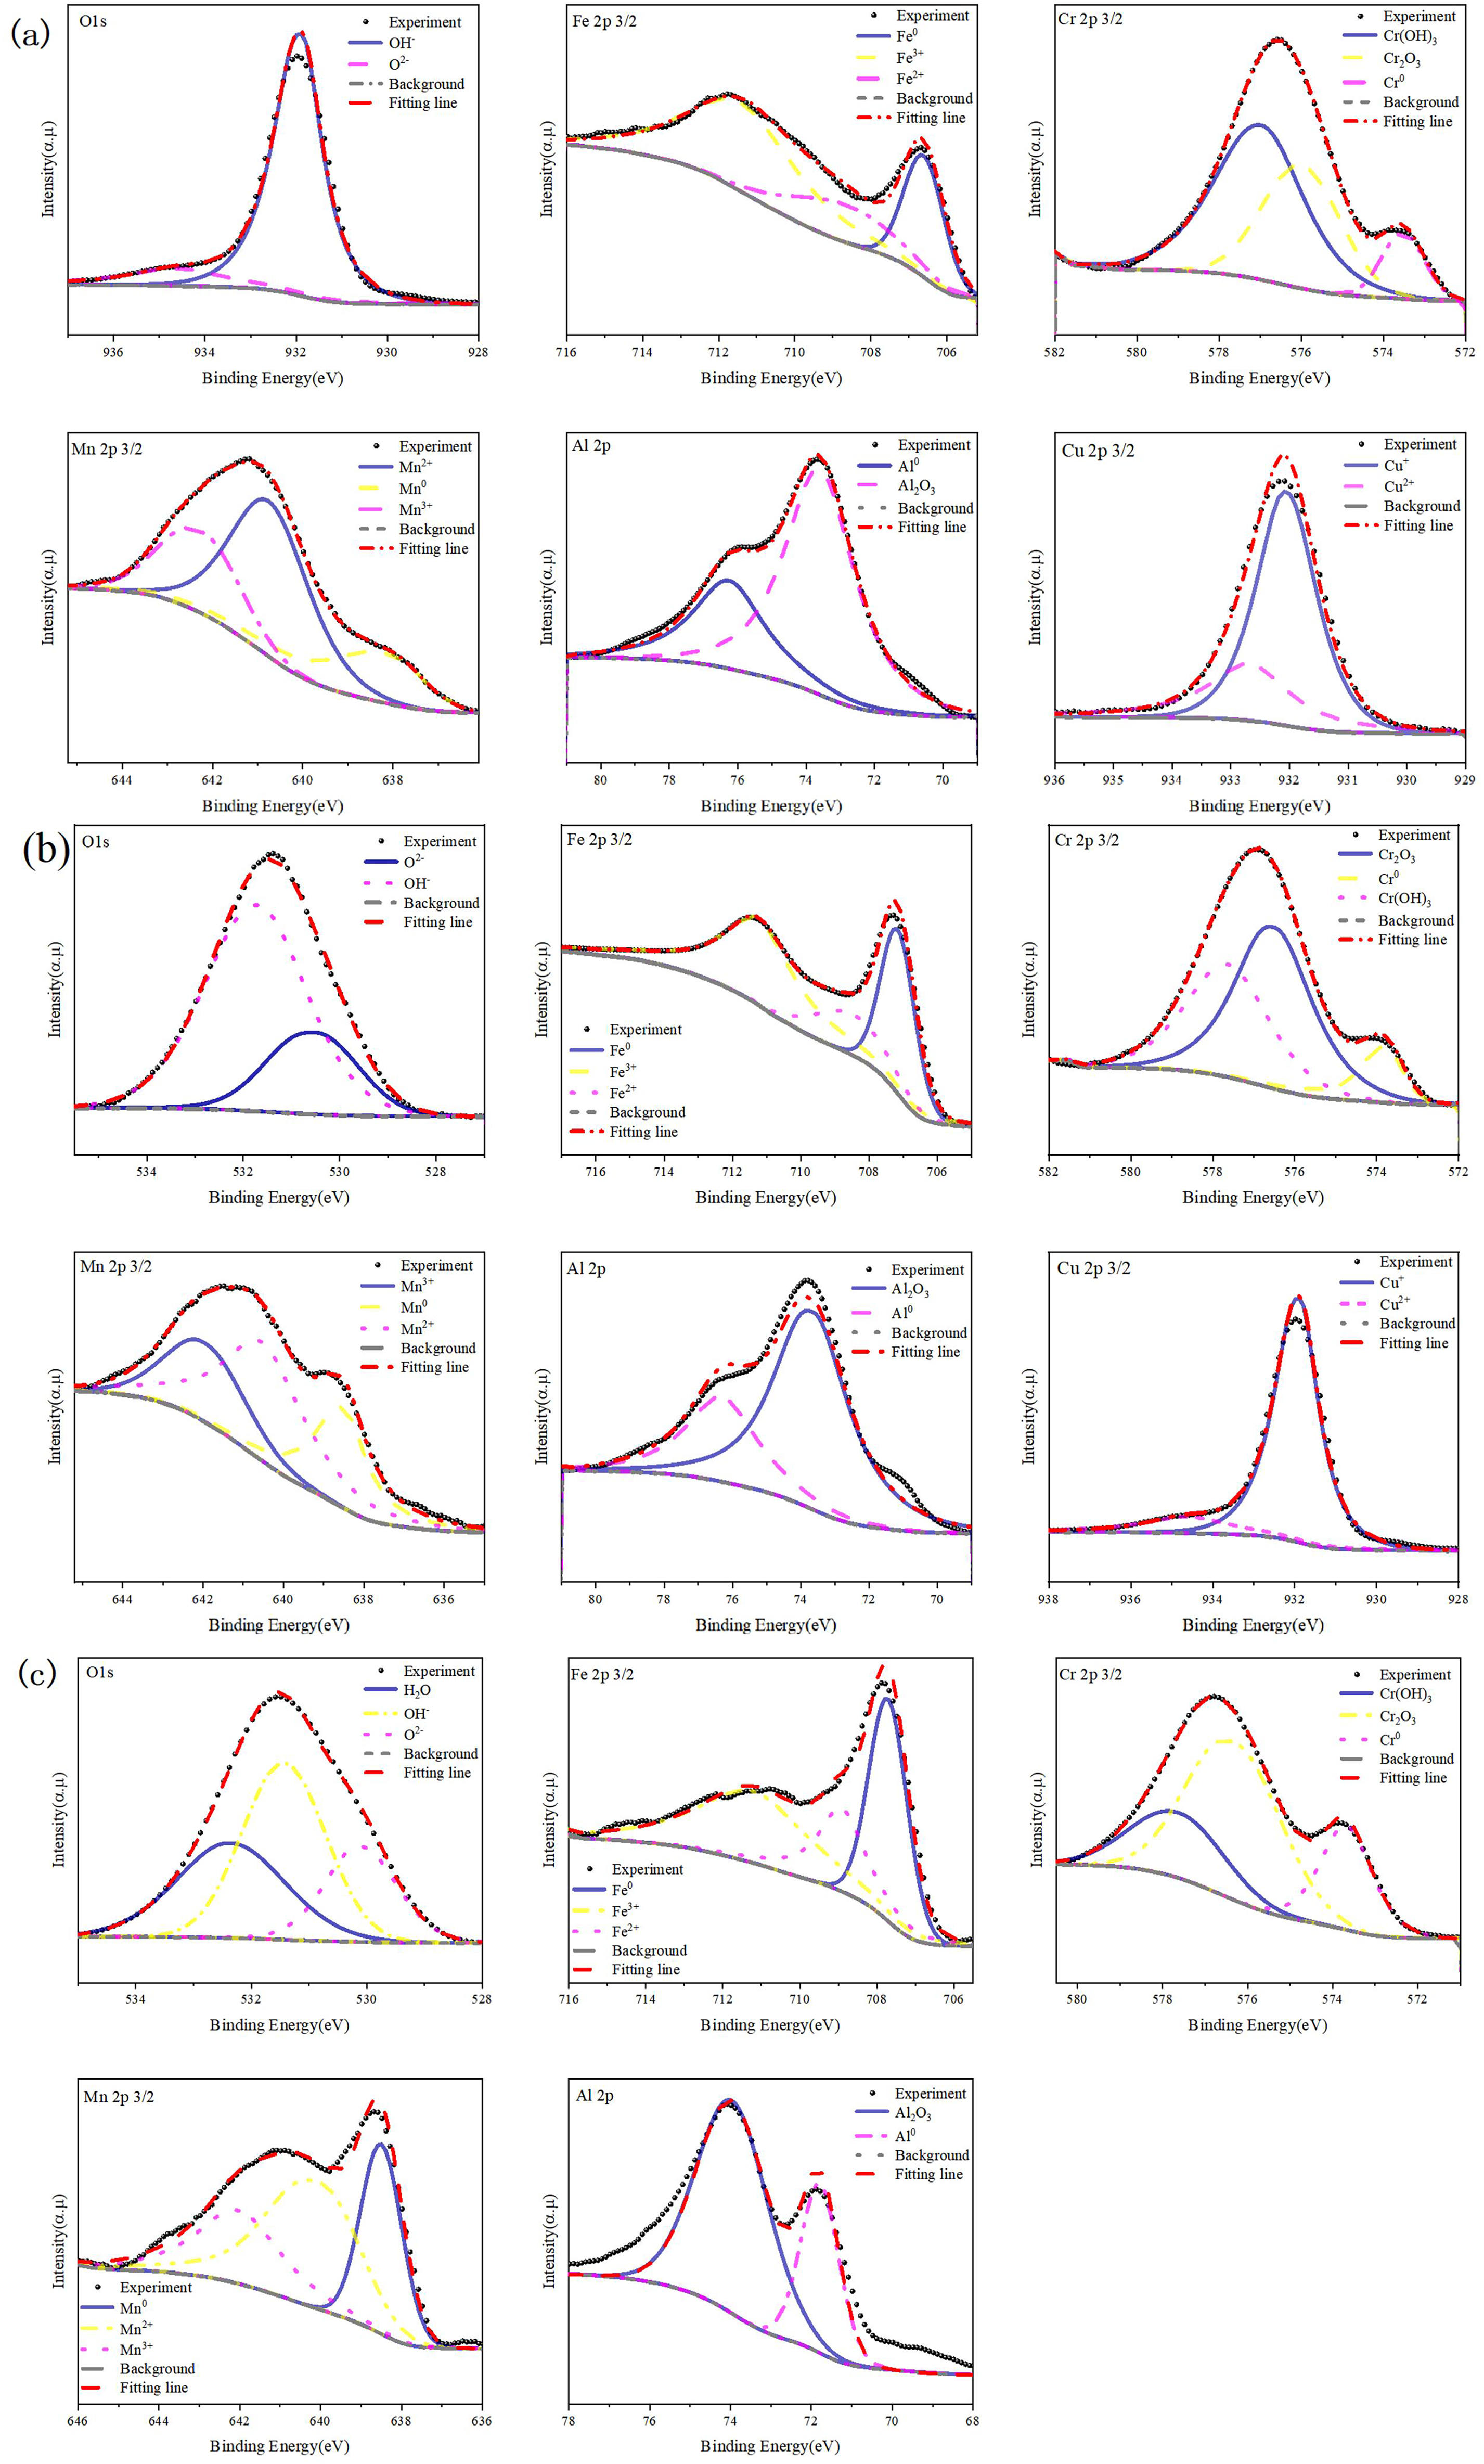
XPS spectra of FeCrMnAlCux in a 3.5 wt.% NaCl solution: (a) x = 2.0, (b) x = 1.0, (c) x = 0.
The atomic percentage contents of component peaks in the Fe 2p3/2, Cr 2p3/2, Mn 2p3/2, Al 2p, Cu 2p3/2, and O1s spectra of the FeCrMnAlCux (x = 2.0, 1.0, 0) high-entropy alloys are shown in Figure 12. As the Cu content in the alloy decreased, the metallic Fe content slightly increased, and the metallic Cr content also increased. Moreover, the Cr2O3 content, which is an important component of the protective film on the alloy surface, significantly increased, thereby enhancing the corrosion resistance of the alloy. The contents of Mn and Al elements and their oxides and hydroxides remained relatively stable, indicating their stability within the alloy. The Cu2O content increased as the Cu element content decreased, and the FeCrMnAlCu high-entropy alloy exhibited a significantly higher Cu2O proportion than the FeCrMnAlCu2 high-entropy alloy. As the Cu content decreased, the OH− content gradually decreased, while the O2− content increased. Additionally, bound water, beneficial to the corrosion resistance of the alloy, occurred in the FeCrMnAl high-entropy alloy. Table 6 shows the Percentage of substance content in each element on the surface of FeCrMnAlCux (x = 2.0,1,0,0) high-entropy alloy.In summary, the composition and content of the oxide film continuously changed with the variation in the Cu content, which has a certain influence on the corrosion resistance of the alloy.
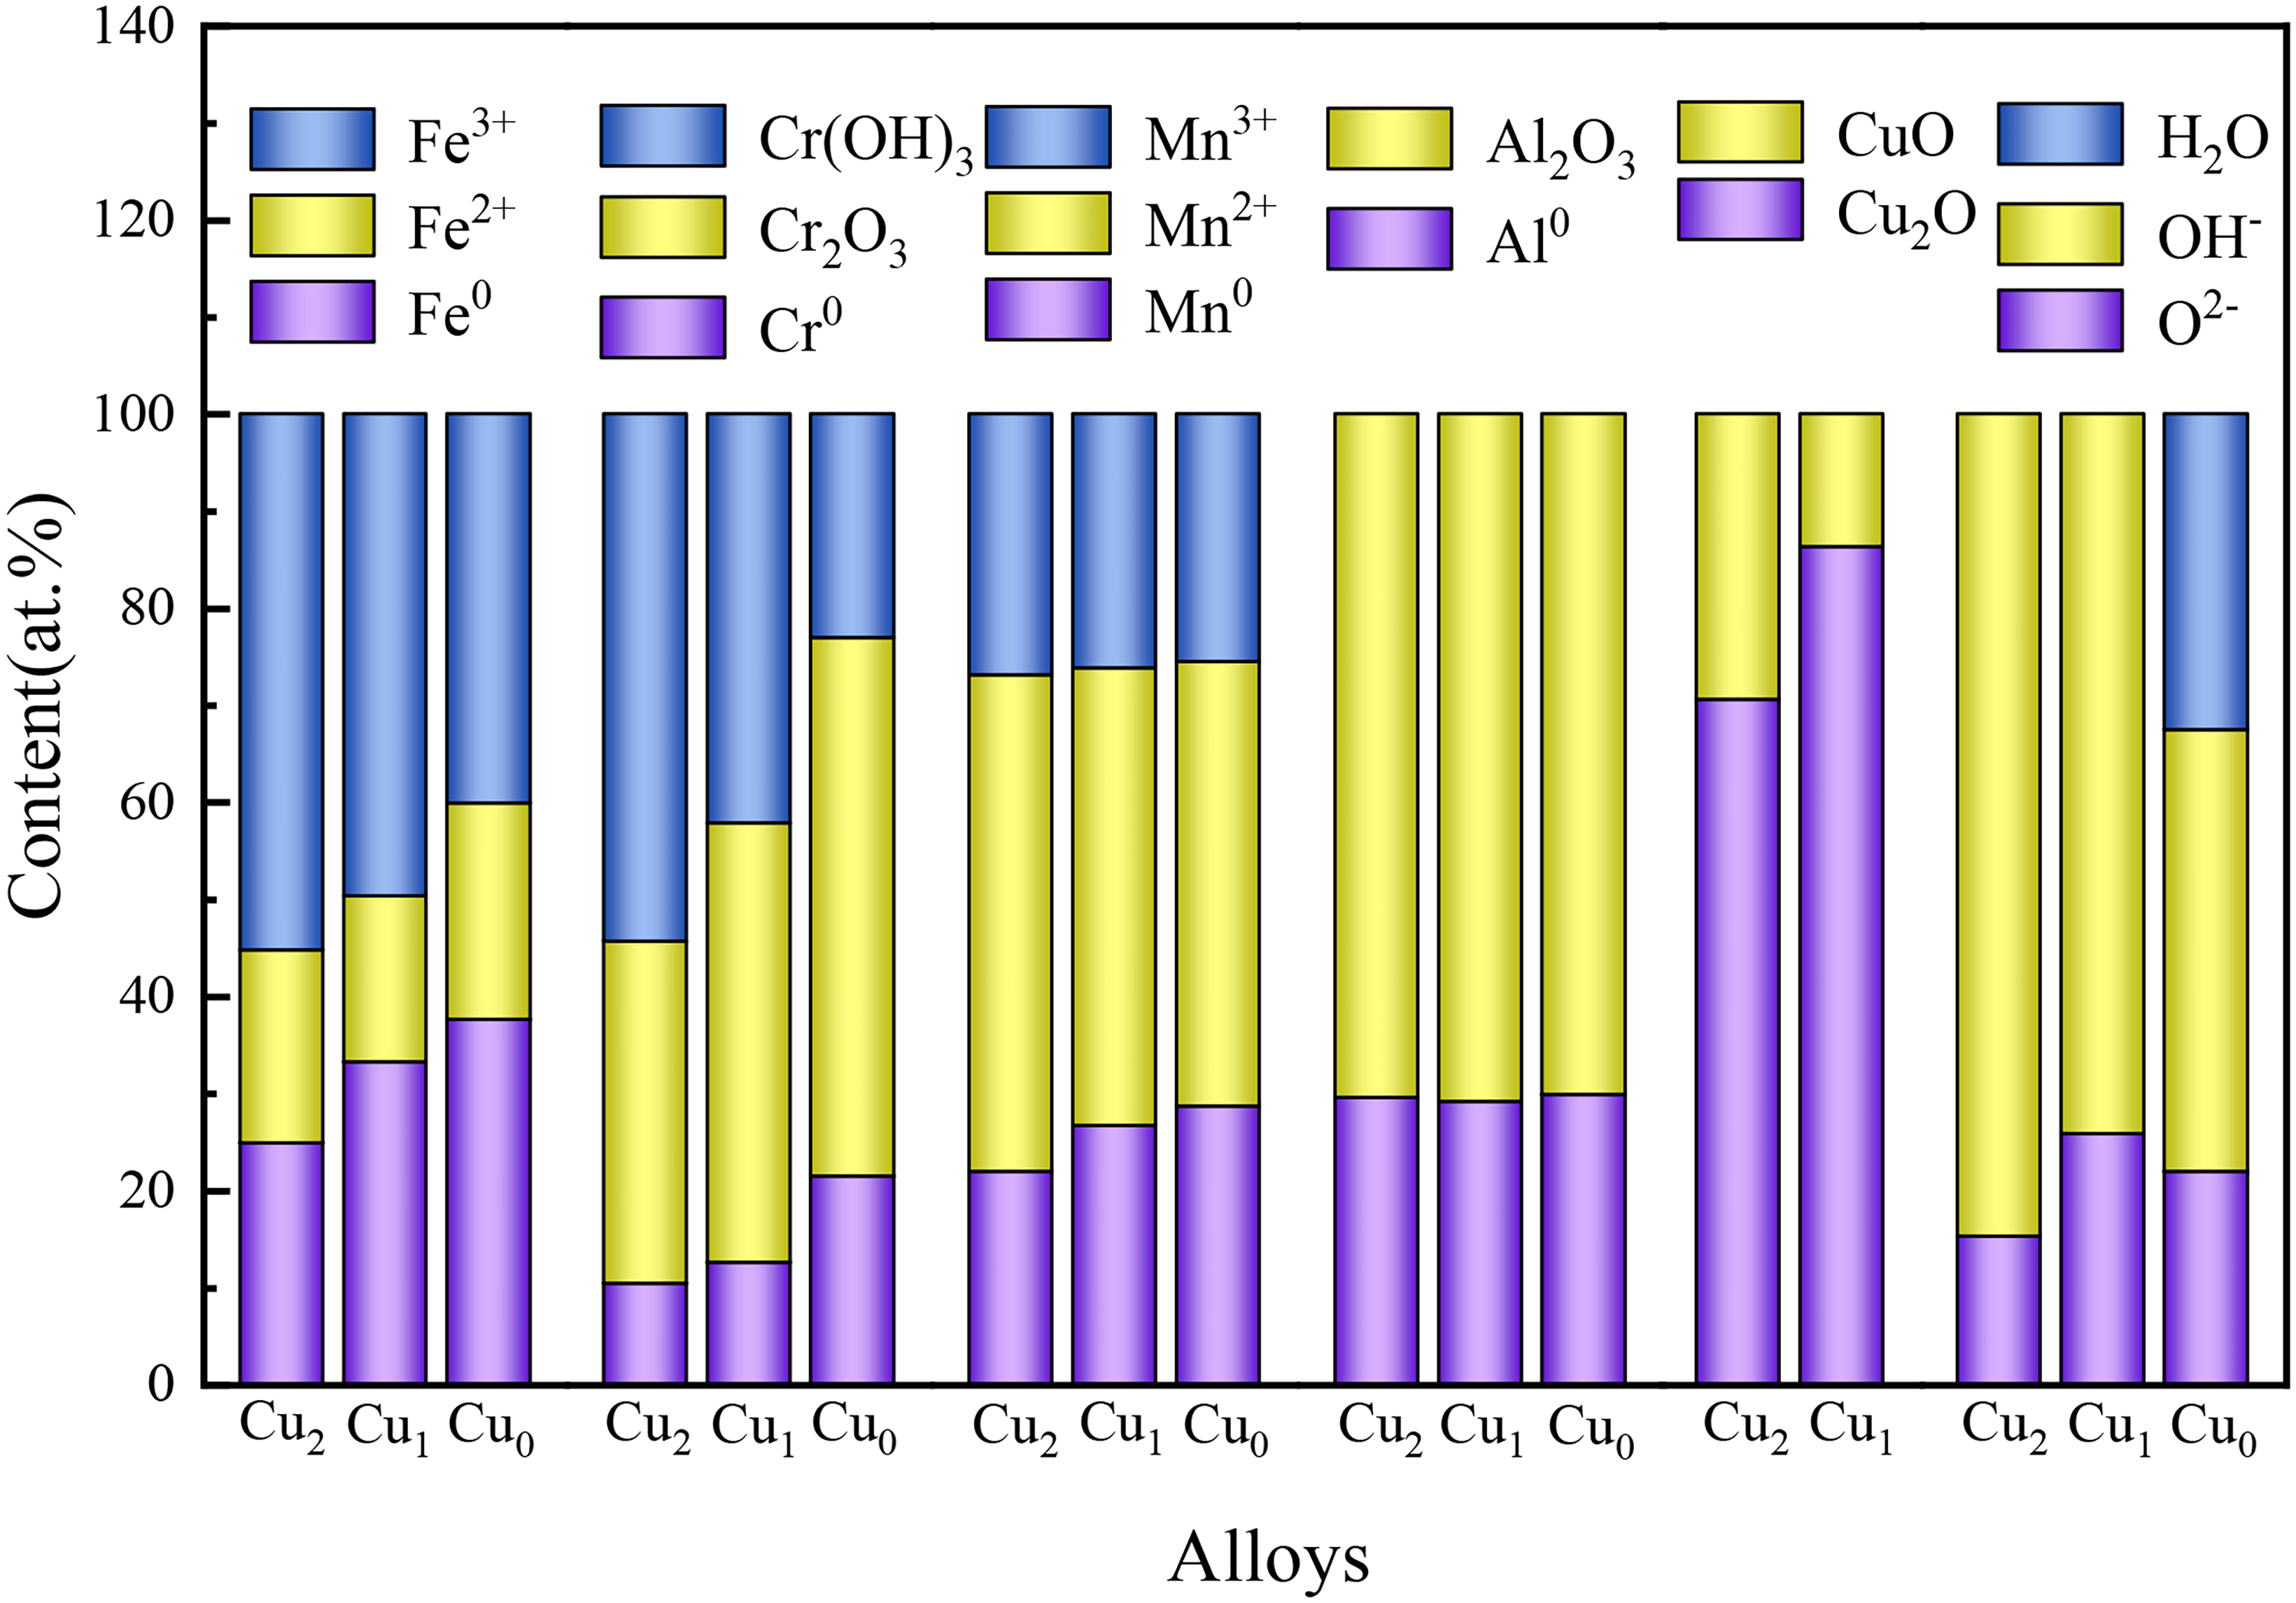
Percentage of substance content in each element on the surface of FeCrMnAlCux (x = 2.0,1,0,0) high-entropy alloys
Corrosion mechanism of the FeCrMnAlCux high-entropy alloy
During the corrosion process of the FeCrMnAlCux high-entropy alloy, corrosion initially occurred preferentially in the vulnerable areas of the alloy surface, where the grain boundaries were relatively weak. Corrosion first occurred at the grain boundaries, where the corrosive solution caused anodic dissolution, leading to alloy dissolution (Equation 2).
17
As the corrosion progressed, the metal ions dissolved from the alloy reacted with oxygen to form corresponding oxides. These oxides combined to form a complex oxide protective film on the alloy surface (Equation 3). According to the results depicted in Table 3 Figures 3 and 4, the dendritic regions were mainly enriched with Fe and Cr elements. Owing to Cu segregation, the interdendritic regions of the alloy were enriched with Cu, making them Cu-rich phases, while the dendritic regions became Cu-poor phases. The XPS results indicated that the oxides and hydroxides of various elements formed a composite protective film. The interdendritic regions were mainly composed of Cu2O and Al2O3 oxide films, while the dendritic regions mainly consisted of Fe2O3, Cr2O3 and Al2O3 oxide films. According to the percentage composition shown in Figure 12, as the Cu content decreased, the FeO content gradually increased, the Cr2O3 content significantly increased, while the Mn oxide content gradually decreased. Moreover, the Cu2O content significantly increased with the decrease in the Cu content. Water molecules bound to the Cu-free alloy. These oxides and their concentrations significantly impacted the stability of the passive film. The oxide of Fe2+ (FeO) had a more favorable effect on the corrosion resistance of the alloy, indicating that with increasing FeO content, the alloy had a denser protective film.25–27 The presence of the metal oxide Cr2O3 played a crucial protective role on the alloy surface.28,29 The Mn oxide reduced the stability of the protective film on the alloy surface, thereby reducing the corrosion resistance of the alloy.
30
According to Deng et al.,
31
Cu2O can prevent corrosion ions from damaging the passive film, and Cu2O is denser and more stable than CuO and will thus provide protection to the alloy. The bound water can capture dissolved metal ions, thereby forming a protective film with better corrosion resistance.
32
Therefore, reducing the Cu content can enhance the protective effect of the passivation film on the alloy matrix (Figure 13).

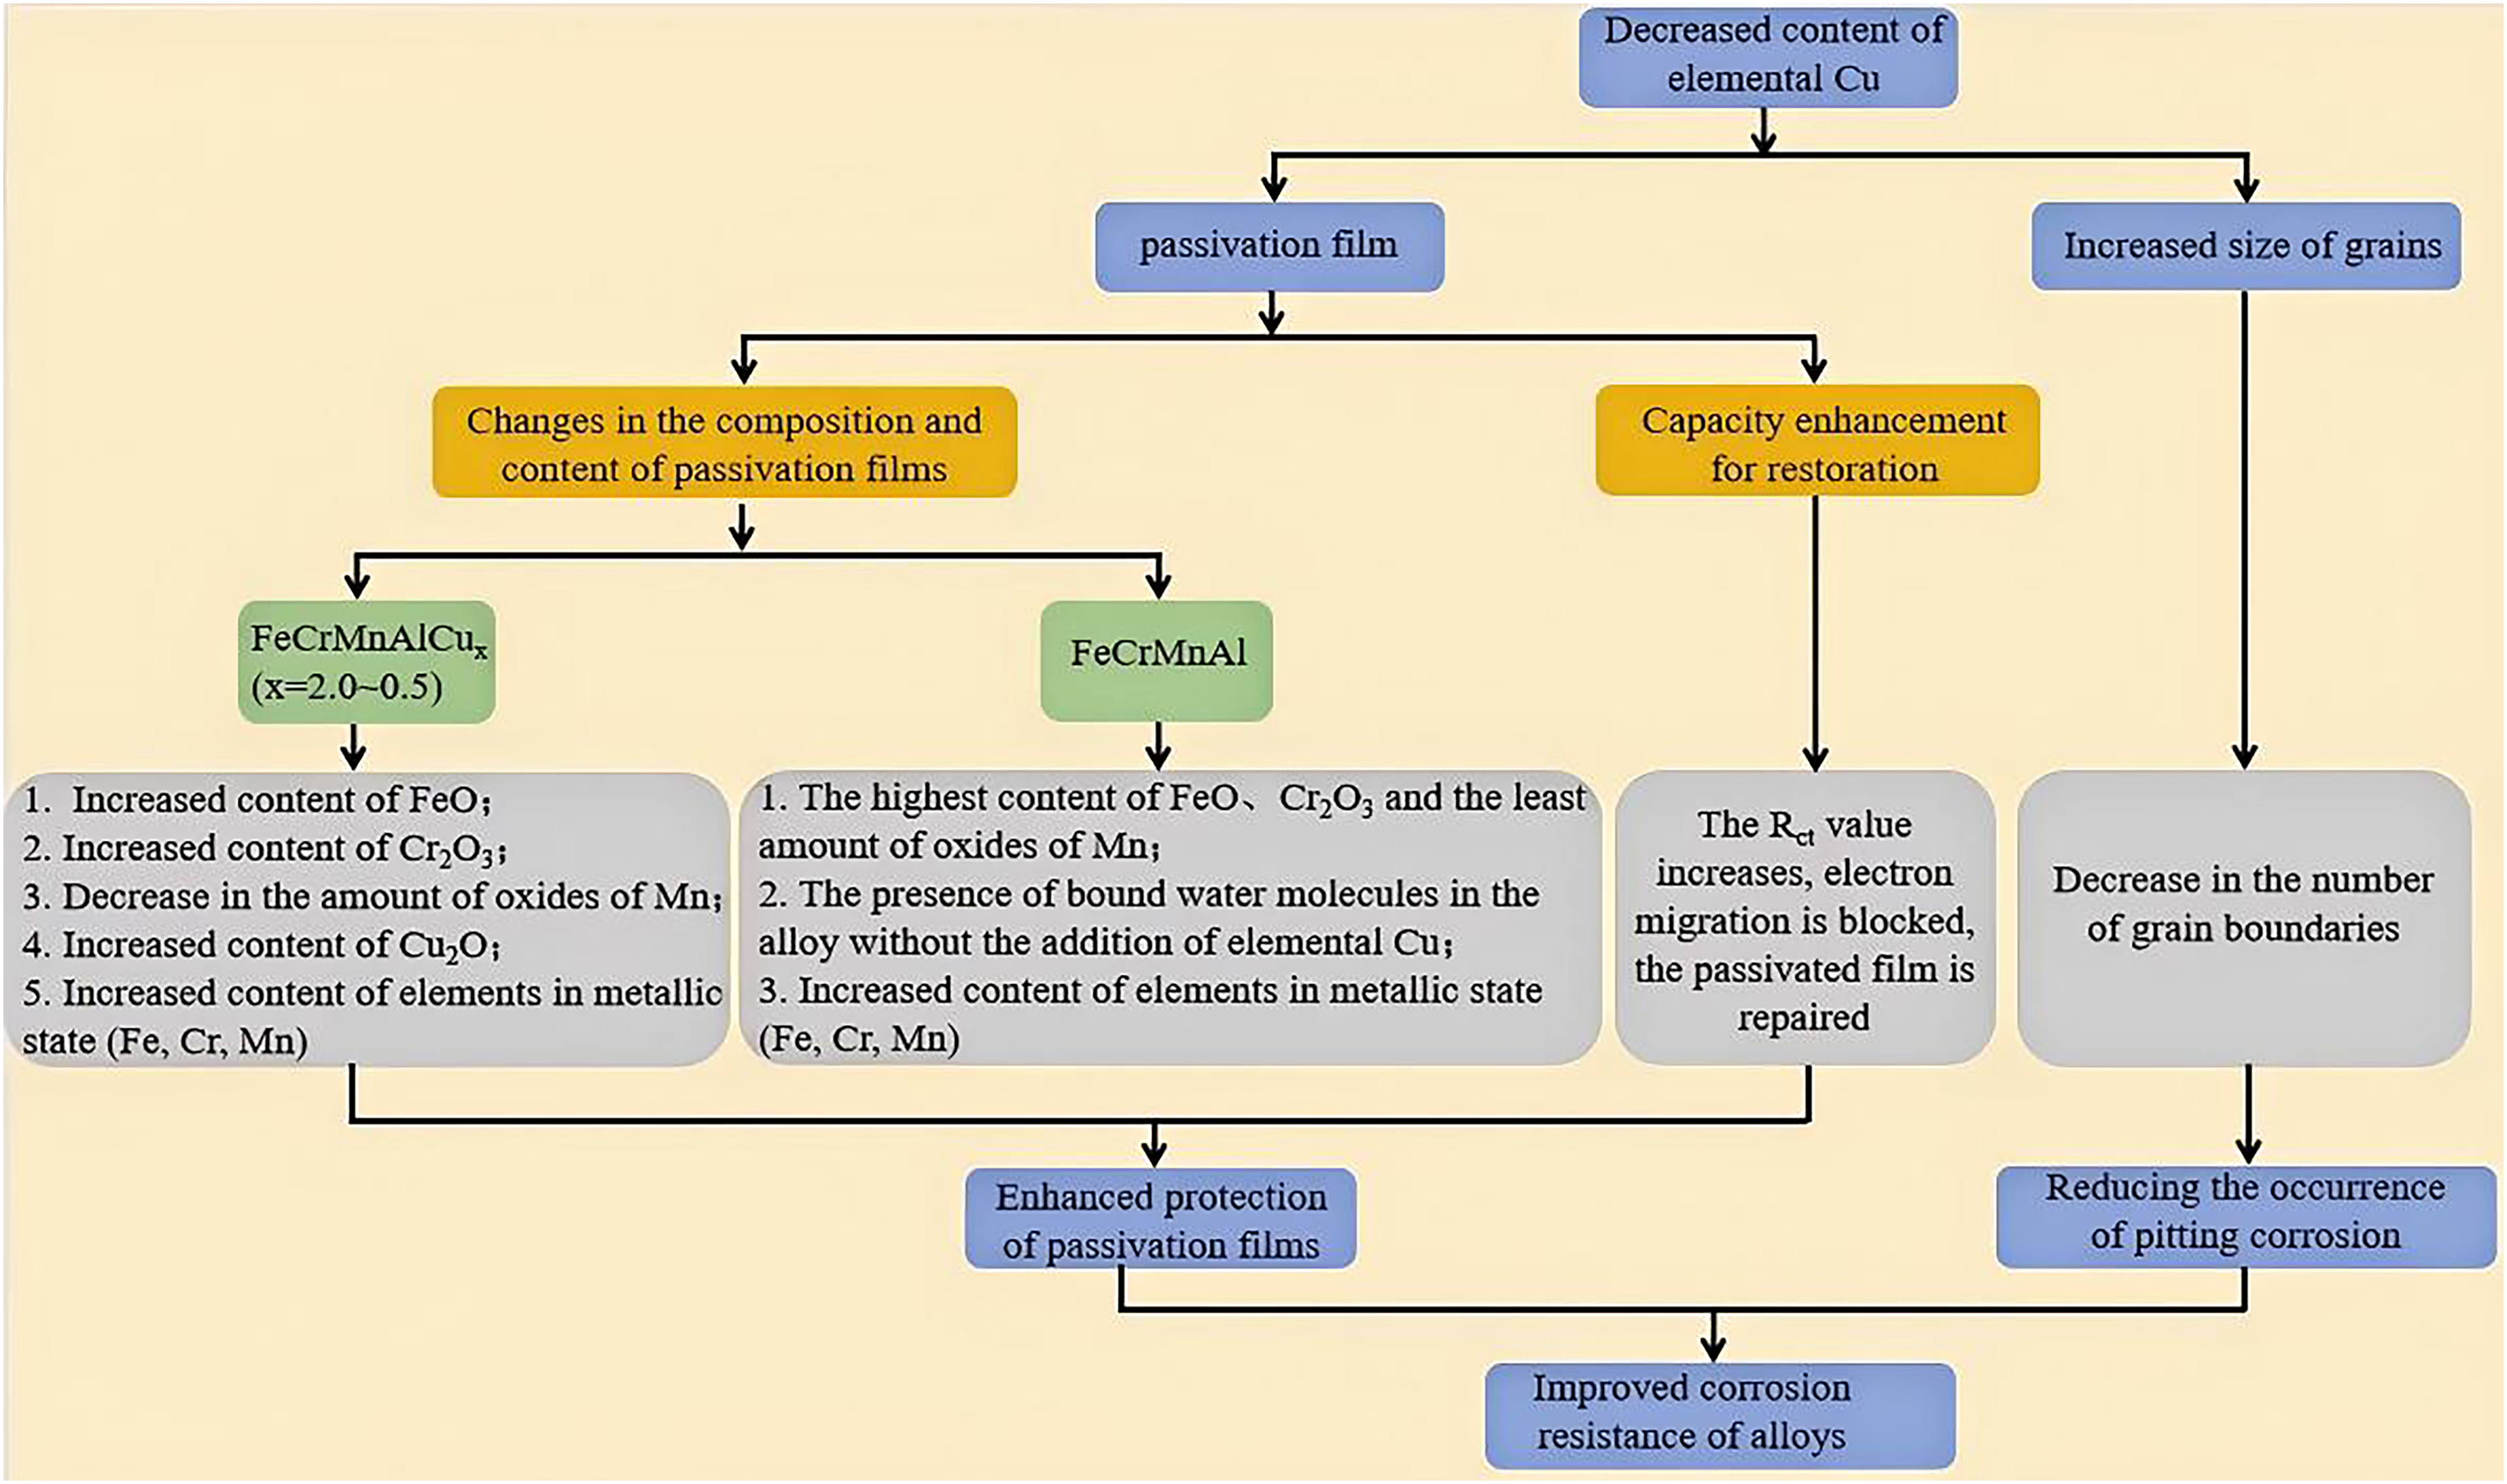
Mechanism of the effect of the Cu element content on the corrosion performance of the FeCrMnAlCux high-entropy alloy
Figure 7 shows selective corrosion in the interdendritic regions of the alloys. According to the study by D et al., 33 the oxide film primarily composed of Cr2O3 in the dendritic region was denser and more stable than the Cu2O and Al2O3 oxide films in the interdendritic region, because the Cu and Al oxides formed loose and porous oxide films, leading to weaker protection of the interdendritic region compared with the dendritic region. Consequently, Cl− could more easily penetrate through the loose and porous oxide film and corrode into the interdendritic regions, where the protective capability was relatively weaker. Moreover, as found in reference, 34 the formation of Al2O3 and Cr2O3 oxide films could create microgalvanic cells, leading to severe corrosion. The distribution of elements in the dendrites differed from that in the interdendritic regions, resulting in a significant potential difference. The dendrites acted as the cathode, while the interdendritic regions acted as the anode, making the latter prone to corrosion. Moreover, according to references,35,36 Cr2O3 and Fe2O3 in the dendritic region provided some protection for the metals in the corrosive environment. Additionally, according to reference, 37 a high Cu content enhanced galvanic corrosion, because Cu combined with dissolved oxygen, to form an unstable oxide film. Owing to the lack of a sufficiently stable oxide film (such as Cr2O3), the unstable oxide film was prone to further decomposition, thereby accelerating anodic dissolution. According to the results depicted in Figure 7, as the Cu content decreased, the grain size increased, leading to an improvement in the corrosion resistance of the alloy. According to reference, 15 a high Cu content led to grain refinement in the alloy, thereby introducing more grain boundaries and accelerating pitting corrosion. With the decrease in the Cu element content, the impedance arc radius of the alloy increased (Figure 5(b)), indicating an increase in the charge-transfer resistance of the alloy. According to Table 5, the Rct value increased with the decrease in the Cu content. As indicated by references,17,38 the Rct value represents the migration of electrons during the electrochemical corrosion process. An increase in the Rct value indicates that electrons were hindered during the migration process. The protective film on the alloy surface underwent repair owing to the shift in the ion migration rate, thereby enhancing the corrosion resistance of the alloy.
Conclusion
FeCrMnAlCux (x = 2.0, 1.5, 1.0, 0.5, and 0) high-entropy alloys were prepared via vacuum arc melting technology, and their microstructure and corrosion resistance in a 3.5 wt.% NaCl solution were investigated. The main conclusions are summarized below:
The decrease in the Cu element content of the alloy led to a change in the alloy's phase structure, which transitioned from a dual-phase BCC + FCC mixture to a single-phase BCC structure. The Cu-free alloy exhibited a single-phase BCC structure, indicating that the presence of Cu was conducive to the formation of the FCC phase in the alloy. The FeCrMnAlCux high-entropy alloys exhibited typical dendritic morphology, with the grain size gradually increasing as the Cu content decreased. The corrosion current density of the FeCrMnAlCux high-entropy alloys decreased with the decrease in the Cu content, with the minimum corrosion current density being 1.678 × 10⁻⁶ A/cm2. As the Cu content decreased, the corrosion potential of the FeCrMnAlCux high-entropy alloys continually increased. The FeCrMnAl high-entropy alloy exhibited the lowest self-corrosion current density and the highest corrosion potential, with a maximum corrosion potential of −0.382 V. The average corrosion rates of FeCrMnAlCux high-entropy alloys after immersion for 168 h were calculated by the weight loss method, and they are 0.1 mm/a, 0.0728 mm/a, 0.0583 mm/a, 0.0560 mm/a, and 0.0465 mm/a, respectively. The FeCrMnAl high-entropy alloy exhibited the lowest corrosion rate, indicating its superior corrosion resistance. The corrosion type of the FeCrMnAlCux high-entropy alloy was intergranular corrosion, owing to the differences in elemental distribution between the grains and the grain boundaries, which resulted in the generation of potential differences. The intergranular regions serving as anodes were more susceptible to corrosion, and the galvanic corrosion induced by high Cu content led to the formation of unstable oxide films on the alloy surface, accelerating corrosion at the grain boundaries. In the 3.5 wt.% NaCl solution, the FeCrMnAl high-entropy alloy exhibited superior corrosion resistance, primarily owing to the formation of a composite oxide protective film on the alloy surface after corrosion. This film effectively prevented the corrosion ions from damaging the alloy. Moreover, the reduction in the Cu element content inhibited electron migration, increasing the charge-transfer resistance of the alloy and enhancing its corrosion resistance.
Footnotes
Author contribution(s)
Funding
The authors disclosed receipt of the following financial support for the research, authorship, and/or publication of this article: This research was financial supported by Gansu Provincial Youth Doctoral Fund project(2021QB-043); The Fourth Batch of Gansu Leading Talents Fund Project(ZZ2023G50100013).
Declaration of conflicting interests
The authors declared no potential conflicts of interest with respect to the research, authorship, and/or publication of this article.