
Abstract
La−modified CrFeNi2Lax (x = 0, 0.05, 0.15, 0.25) medium−entropy alloys were investigated to reveal La's effects on phase evolution and mechanical properties. Thermodynamic and experimental analyses demonstrated that La addition transformed the single FCC phase into dual FCC + HCP phases, with HCP volume fraction increasing alongside La content. Grain refinement occurred from 412 to 245 μm with higher La concentrations. Mechanical properties improved significantly: hardness rose from 125 to 325 HV, yield strength surged from 110 to 839 MPa, and optimal fracture strength (1317 MPa) was achieved at 3.6 at.% La. These enhancements stemmed from combined effects of HCP phase formation, grain refinement, and La−induced strengthening mechanisms.
Introduction
Metal materials, serving as foundational components in aerospace engineering, precision electronics, and biomedical devices, drive technological breakthroughs through their exceptional mechanical properties and extreme temperature stability, while simultaneously elevating human living standards via energy-efficient applications and sustainable infrastructure solutions. Since the Industrial Revolution, a series of metal alloy systems have been developed, such as stainless steel, titanium alloys, copper alloys, and cobalt alloys. The design concept of these traditional alloys is centered on a primary component, which serves as the solvent, along with a minor quantity of additives that function as solutes.1–3 However, with the in-depth research conducted by scientists, the performance of these traditional composite materials has reached its limits and fails to meet the demands of modern society. 4 It was not until 2004 that medium and high entropy alloys (M/HEAs) garnered significant attention from researchers due to their entirely new design concept,4,5 which included four or more principal components. Due to the special four core effects6–8: high entropy effect, slow diffusion effect, lattice distortion effect, and the cocktail effect, M/HEAs exhibit comprehensive properties, including high strength and hardness, excellent ductility, corrosion resistance, wear resistance, and high-temperature stability.9–11 Due to their enormous potential for enhanced performance, M/HEAs have a broad range of applications in the industrial field.12–14
Although M/HEAs exhibit excellent comprehensive properties, there are still many issues to be resolved in practical applications. Single-phase FCC-structured M/HEAs, such as CrCoFeNi HEAs and CrCoNi MEAs, have excellent ductility but insufficient strength.15–19 Moreover, the high cost of Co significantly increases the alloy's production cost, hindering its widespread application in structural engineering. To address the issues of low strength and high cost, researchers have undertaken extensive studies. Elemental addition is an effective approach to improve the properties of single-phase M/HEAs. Lu et al. 20 achieved a strength-ductility balance in CrCoFeNi HEA by introducing a BCC phase through the addition of Al. In this system, solid solution strengthening and secondary phase precipitation strengthening were the main mechanisms for improving alloy performance. Gao et al. 21 induced a second σ phase in CrCoFeNi HEA by alloying Si. The σ phase refined the grain size, leading to a significantly increasing in the strength. In addition, elements such as W, Mo, Nb, and Ti have been utilized to further improve the performance of HEAs.17,22–24 Simultaneously, the cost of M/HEAs can be effectively reduced by eliminating Co or replacing it with other cost-effective elements. This has led to the development of a series of new Co-free alloy systems, such as CrFeNi, 25 CrFe2Ni, 26 and CrFeNi2 27 MEAs. These researches indicated that the addition of specific strengthening elements to these systems can further enhance their comprehensive properties, even outperforming some Co-containing M/HEAs, thereby attracting significant attention from researchers in recent years.
Rare earth elements, known as “industrial gold,” possess excellent physical properties that can significantly enhance the quality and performance of materials. 28 In recent years, rare earth elements have been successfully applied to improve the strength of M/HEAs. Zhang et al. 29 investigated the effect of the rare earth element Y on CoCrFeNiY x HEAs and found that as the Y content increased, the yield strength improved from 202 (x = 0) to 1440 MPa (x = 0.3), the hardness increased from 146 (x = 0) to 400 HV (x = 0.3). Zhang et al. 30 studied the influence of the rare earth element Gd on the microstructure and mechanical properties of CoCrCuFeNiGd x HEAs, reporting that the addition of Gd increased the yield strength from 320 (x = 0) to 1132 MPa (x = 0.3). Hong et al. 31 enhanced the yield strength and ultimate tensile strength of (CrCoNi)100−xY x MEAs (x = 1) by approximately 87.5% and 49%, respectively, through the addition of a small amount of Y to CrCoNi MEA. Li et al. 32 also examined the impact of Y on the mechanical properties of FeCoNi1.5CuBY x HEAs, reporting improvements of 75.4%, 19.9%, and 37% in yield strength, compressive strength, and maximum compressive strain, respectively, after Y addition. In addition, Chan et al. 19 improved the strength of CrCoNi MEA by adding trace amounts of La, increasing the yield strength, ultimate tensile strength, and hardness of (CrCoNi)100−xLa x MEAs(x = 0.2) by approximately 56%, 26.4%, and 8.4%, respectively. Qu et al. 33 demonstrated that with increasing La content, the grain size of CoCrFeMnNiLa x HEAs decreased, resulting in an gradual increasing in mechanical properties. In addition, other studies have also shown a grain refinement effect with the addition of La in Al-Cu and Al-Si alloys, leading to improved mechanical properties in both alloy systems.34,35 Therefore, enhancing the strength of M/HEAs by adding rare earth elements is a feasible and effective design strategy.36–38
Inspired by the aforementioned research findings, in this study, we prepared a serials of novel Co-free CrFeNi2La x (x = 0, 0.05, 0.15, 0.25) MEAs alloy by adding La. We replaced the expensive Co with Ni to reduce production costs. Meanwhile, we increased strength by introducing a second HCP phase into the FCC-structured CrFeNi2 MEA through the adding of La. Combining of the thermodynamic calculations and experimental characterization, we thoroughly investigated the effects of La on the microstructural evolution and mechanical properties of CrFeNi2 MEA. Furthermore, the corresponding strengthening mechanisms were also explored.
Experimental methods
Sample preparation
We prepared four non-equiatomic CrFeNi2La x (x = 0, 0. 05, 0.15, 0.25) MEA ingots with a diameter of 40 mm by using a vacuum arc melting furnace. The raw materials of Cr, Fe, Ni, and La had a purity of >99.95 wt%. To ensure compositional homogeneity, the alloy ingots were flipped and melted at least 5 times during the melting process, and subsequently subjected to homogenization treatment to ensure uniformity. Homogenize in a pure Ar atmosphere at 1273 K for 24 h, followed by water quenching. Two samples were cut from the center of each alloy ingot. One sample, with dimensions of 10 × 10 × 5 mm³, was used for hardness, XRD, and SEM/EBSD tests, while the other, with dimensions of Ø4 × 6 mm, was used for compression tests. For simplicity, the samples were denoted as La0, La0.05, La0.15, and La0.25 according to their La content.
Tissue characterization
The phase composition and lattice constants of the La0, La0.05, La0.15, and La0.25 samples were analyzed using a TD-3500X X-ray diffractometer (Cu target, wavelength 0.15406 nm with a scanning range of 20°–100° and a step size of 4°/min). To further investigate the effect of different La contents on the microstructure and composition of the samples, the microstructure was analyzed using an APREO scanning electron microscope (SEM) with EBSD capabilities. The chemical composition of the samples was determined using energy-dispersive spectroscopy (EDS) attached to the SEM. Point scans were performed to analyze the phase compositions in the samples, with 10 measurements for each phase, and the average value was used as the final result. The volume fractions of each phase in the SEM images were statistically analyzed using ImageJ software. Additionally, the samples were mechanically polished and subsequently vibratory polished to prepare EBSD specimens. The EBSD test selects two different multiples for testing. The low-magnification test step size is selected as 6 μm for observing the grain size and orientation. The high-magnification test step size is selected as 0.2 μm for observing the phase distribution and orientation. The obtained data were analyzed using OimA software. The structure of phases in all four samples were by analyzed by Transmission Electron Microscopy (TEM).
Performance testing
The microhardness of the La0, La0.05, La0.15, and La0.25 samples was measured using an HVS-1000 micro-Vickers hardness tester. Ten measurements were performed for each sample, and the average value was taken as the final result. The test load was 300 g, with a dwell time of 15 s. Prior to hardness testing, all samples were polished to remove surface scratches. At room temperature, compression tests were conducted to each sample using an AGX-V precision universal testing machine, with a strain rate of 5 × 10⁻⁴/s. Each composition was tested in three times, and the average value was used as the final result.
Result
Effect of La on the structure and composition
Figure 1(a) showed the XRD patterns of the La0, La0.05, La0.15, and La0.25 samples over a scanning angle range of 20° to 100°. The results indicated that the La0 sample, without La addition, contained only an FCC phase. After the addition of La, HCP precipitates were detected in the La0.05, La0.15, and La0.25 samples. Some researchers reported that the volume fraction of phase was increased as the intensity of the diffraction peak increased. 39 Our results showed that with increasing La content, the intensity of the HCP diffraction peaks gradually increased, indicating a corresponding increase in the volume fraction of the HCP phase. To analyze the changes in the lattice constant of the FCC phase after La addition, the scanning angle was set to 40°~50°. The results showed that the FCC diffraction peaks shifted downward with the addition of La, and the shift became more pronounced as the La content increased, indicating the lattice constant of the FCC matrix phase increased with increasing La content. Zhaolong et al. reported that alloyed larger atomic radius Mo to FeCrCo alloys resulted in an increase in the lattice constant of the modulated structure. 40 Similarly, in our alloys, the addition of La, which has a larger atomic radius (Table 1), is the primary reason for the observed increase in the FCC lattice constant after La addition.
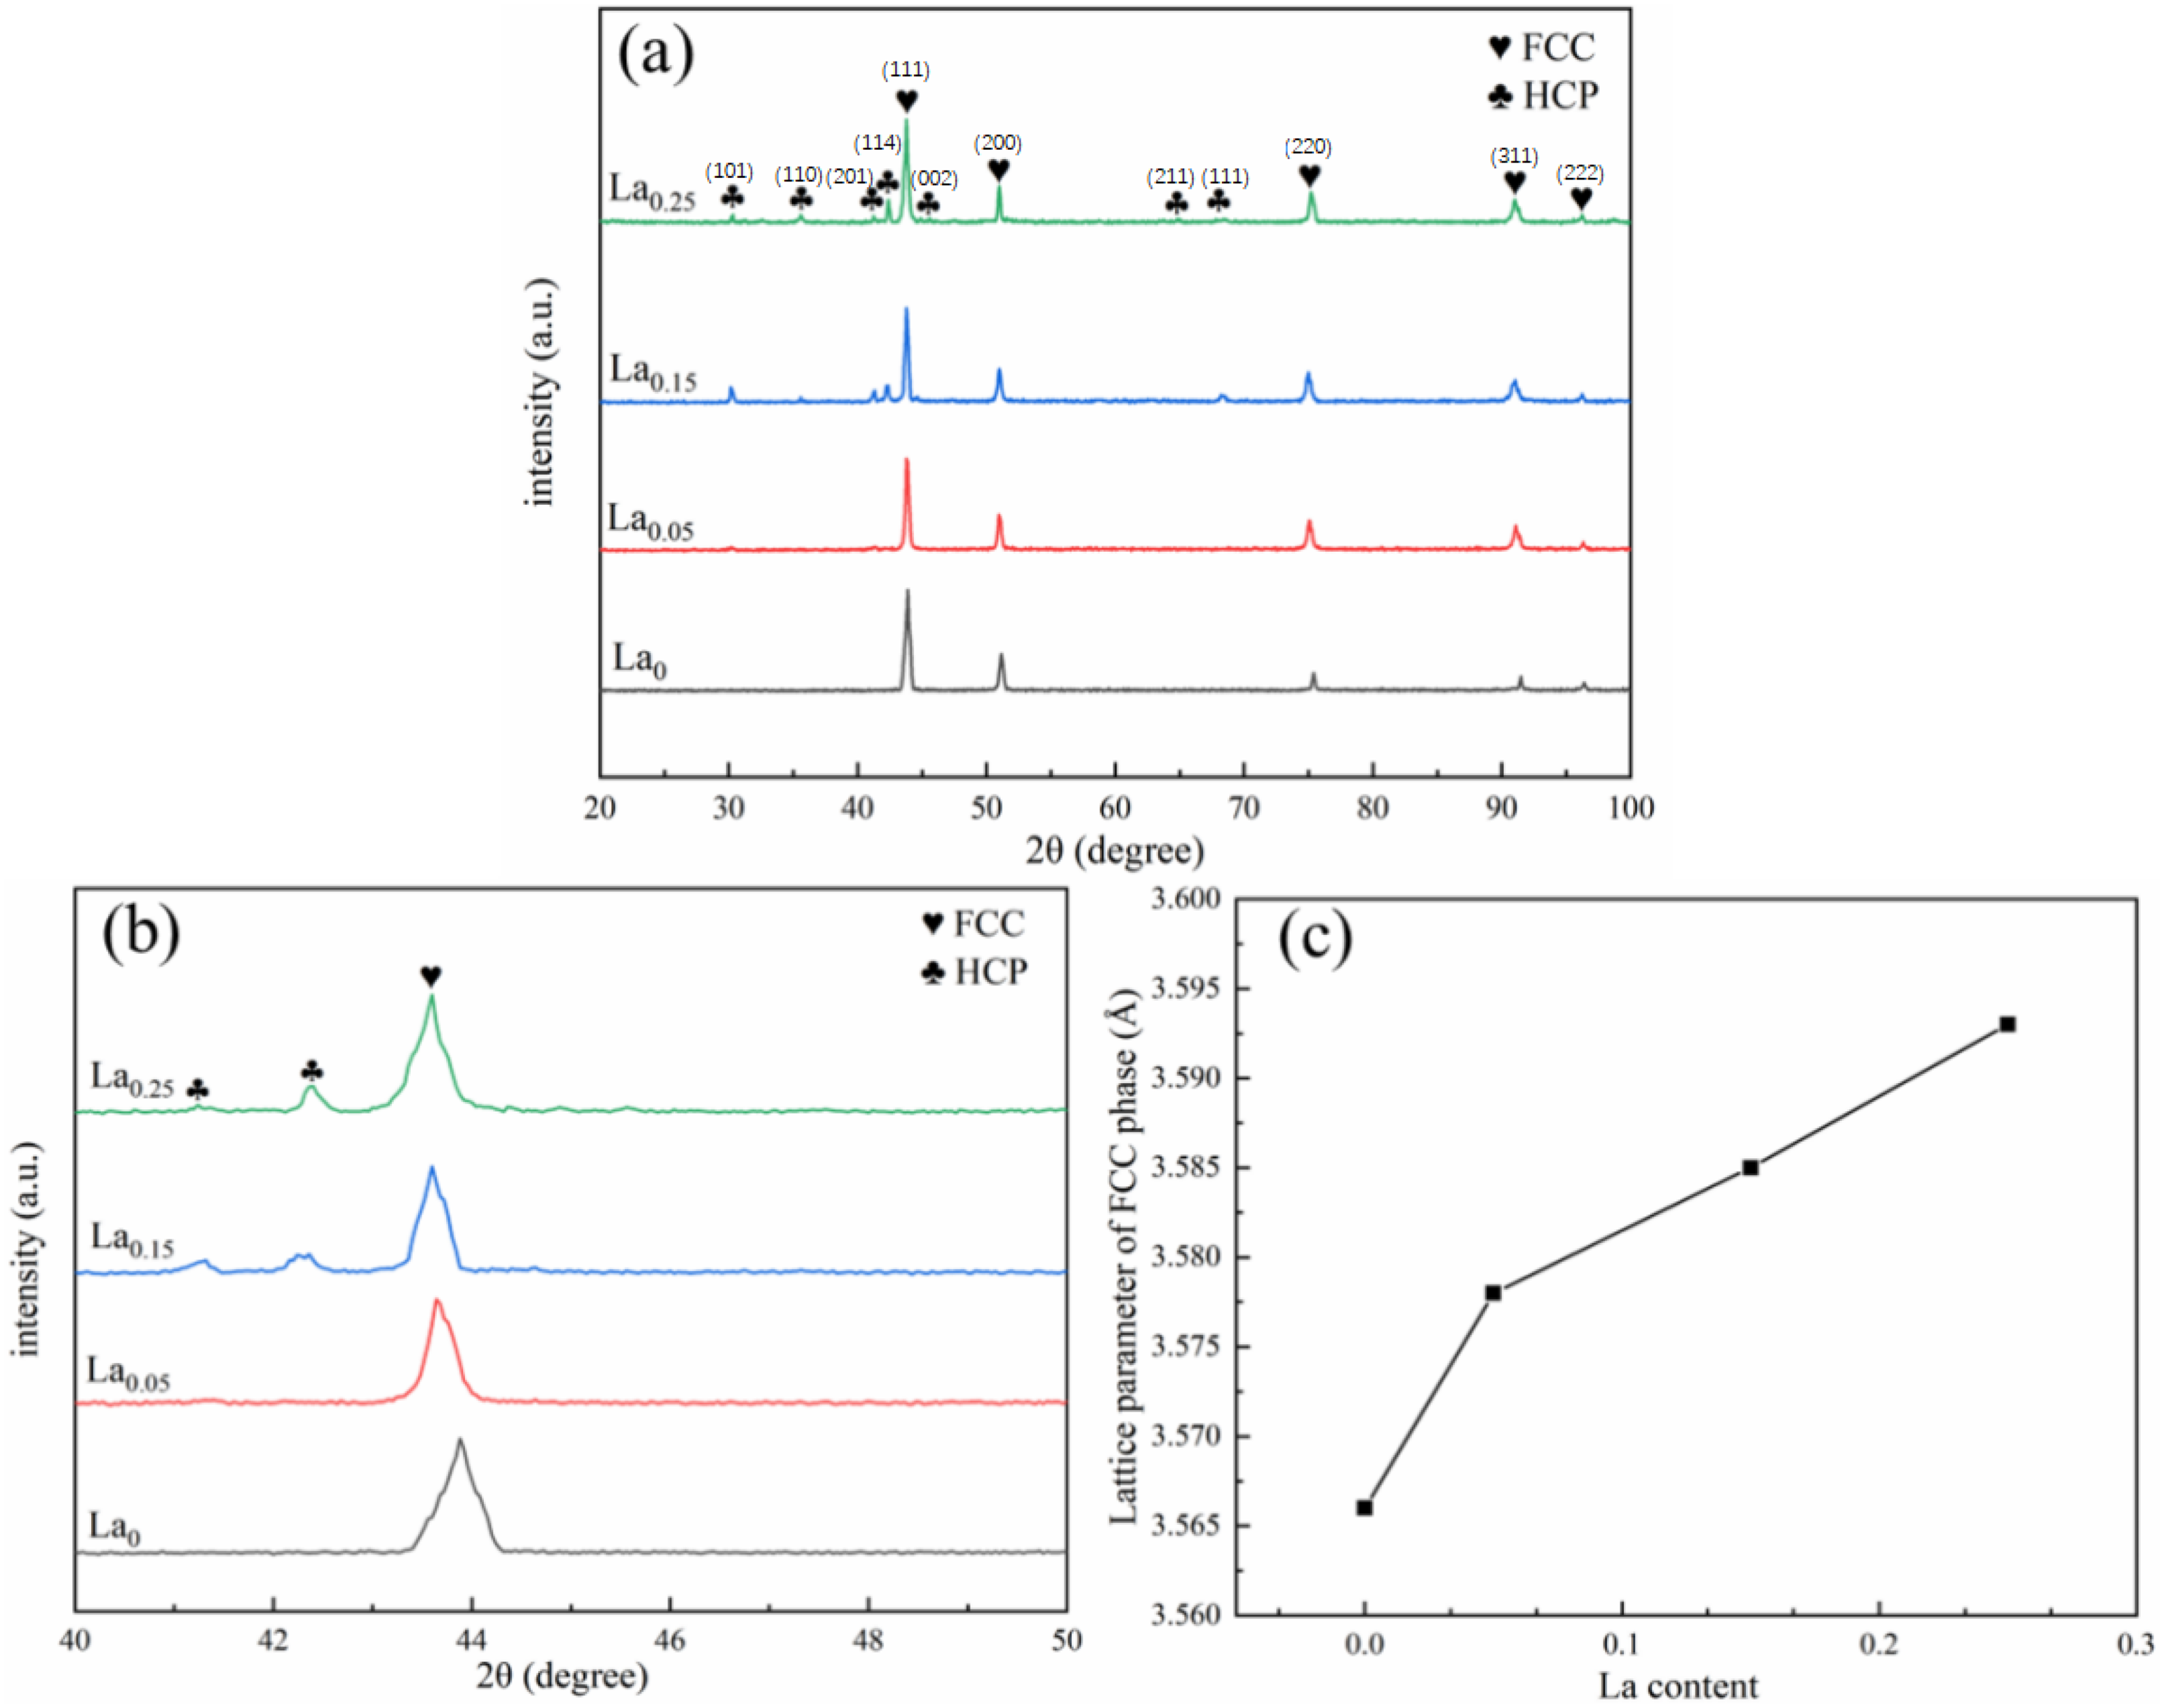
The XRD spectra of samples La0, La0.05, La0.15, and La0.25 and lattice constants of the FCC phase in samples La0, La0.05, La0.15, and La0.25. (a) XRD pattern, scanning angle ranging from 20° to 100°; (b) XRD pattern, scanning angle of 40° to 50°; (c) Lattice constant of FCC phase in each sample.
Physical parameters of each element in CrFeNi2Lax MEAs and the mixing enthalpy (ΔHmix AB, kJ/mol) of different binary components.
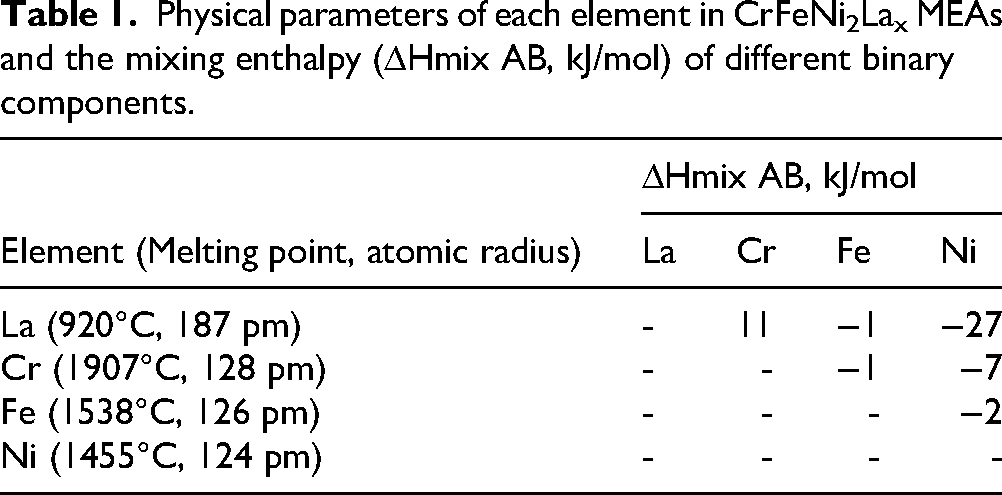
Table 1 presented the physical parameters of each element and the mixing enthalpy between different atomic pairs. The atomic radius of La is significantly larger than that of Cr, Fe, and Ni, which induced substantial lattice distortion in CrFeNi2La x MEAs. Additionally, the more negative the direct mixing enthalpy between elements, the more likely it is for a phase structure to form. 41 This was the reason why the volume fraction of the second HCP increased gradually with the addition of La.
Figure 2 showed the SEM images of the La0, La0.05, La0.15, and La0.25 samples. The results indicated that prior to the addition of La, sample La0 contained only a single FCC phase. When we added 0.05 at.% La into sample La0.05, a new second phase precipitated along the grain boundaries. Based on the XRD results, the crystal structure of this new phase was identified as HCP. 19 With further increases in La content, more HCP phases were observed to precipitate along the grain boundaries in samples La0.15, and La0.25 (Figure 2(b)–(e)). Statistical analysis of the volume fraction of the HCP phase revealed that it increased from 10.32% in the La0.05 sample to 36.91% in the La0.25 sample (Figure 2f). The gradual increase in the volume fraction of the HCP phase with increasing La content also led to an increase in the width of the HCP phase.
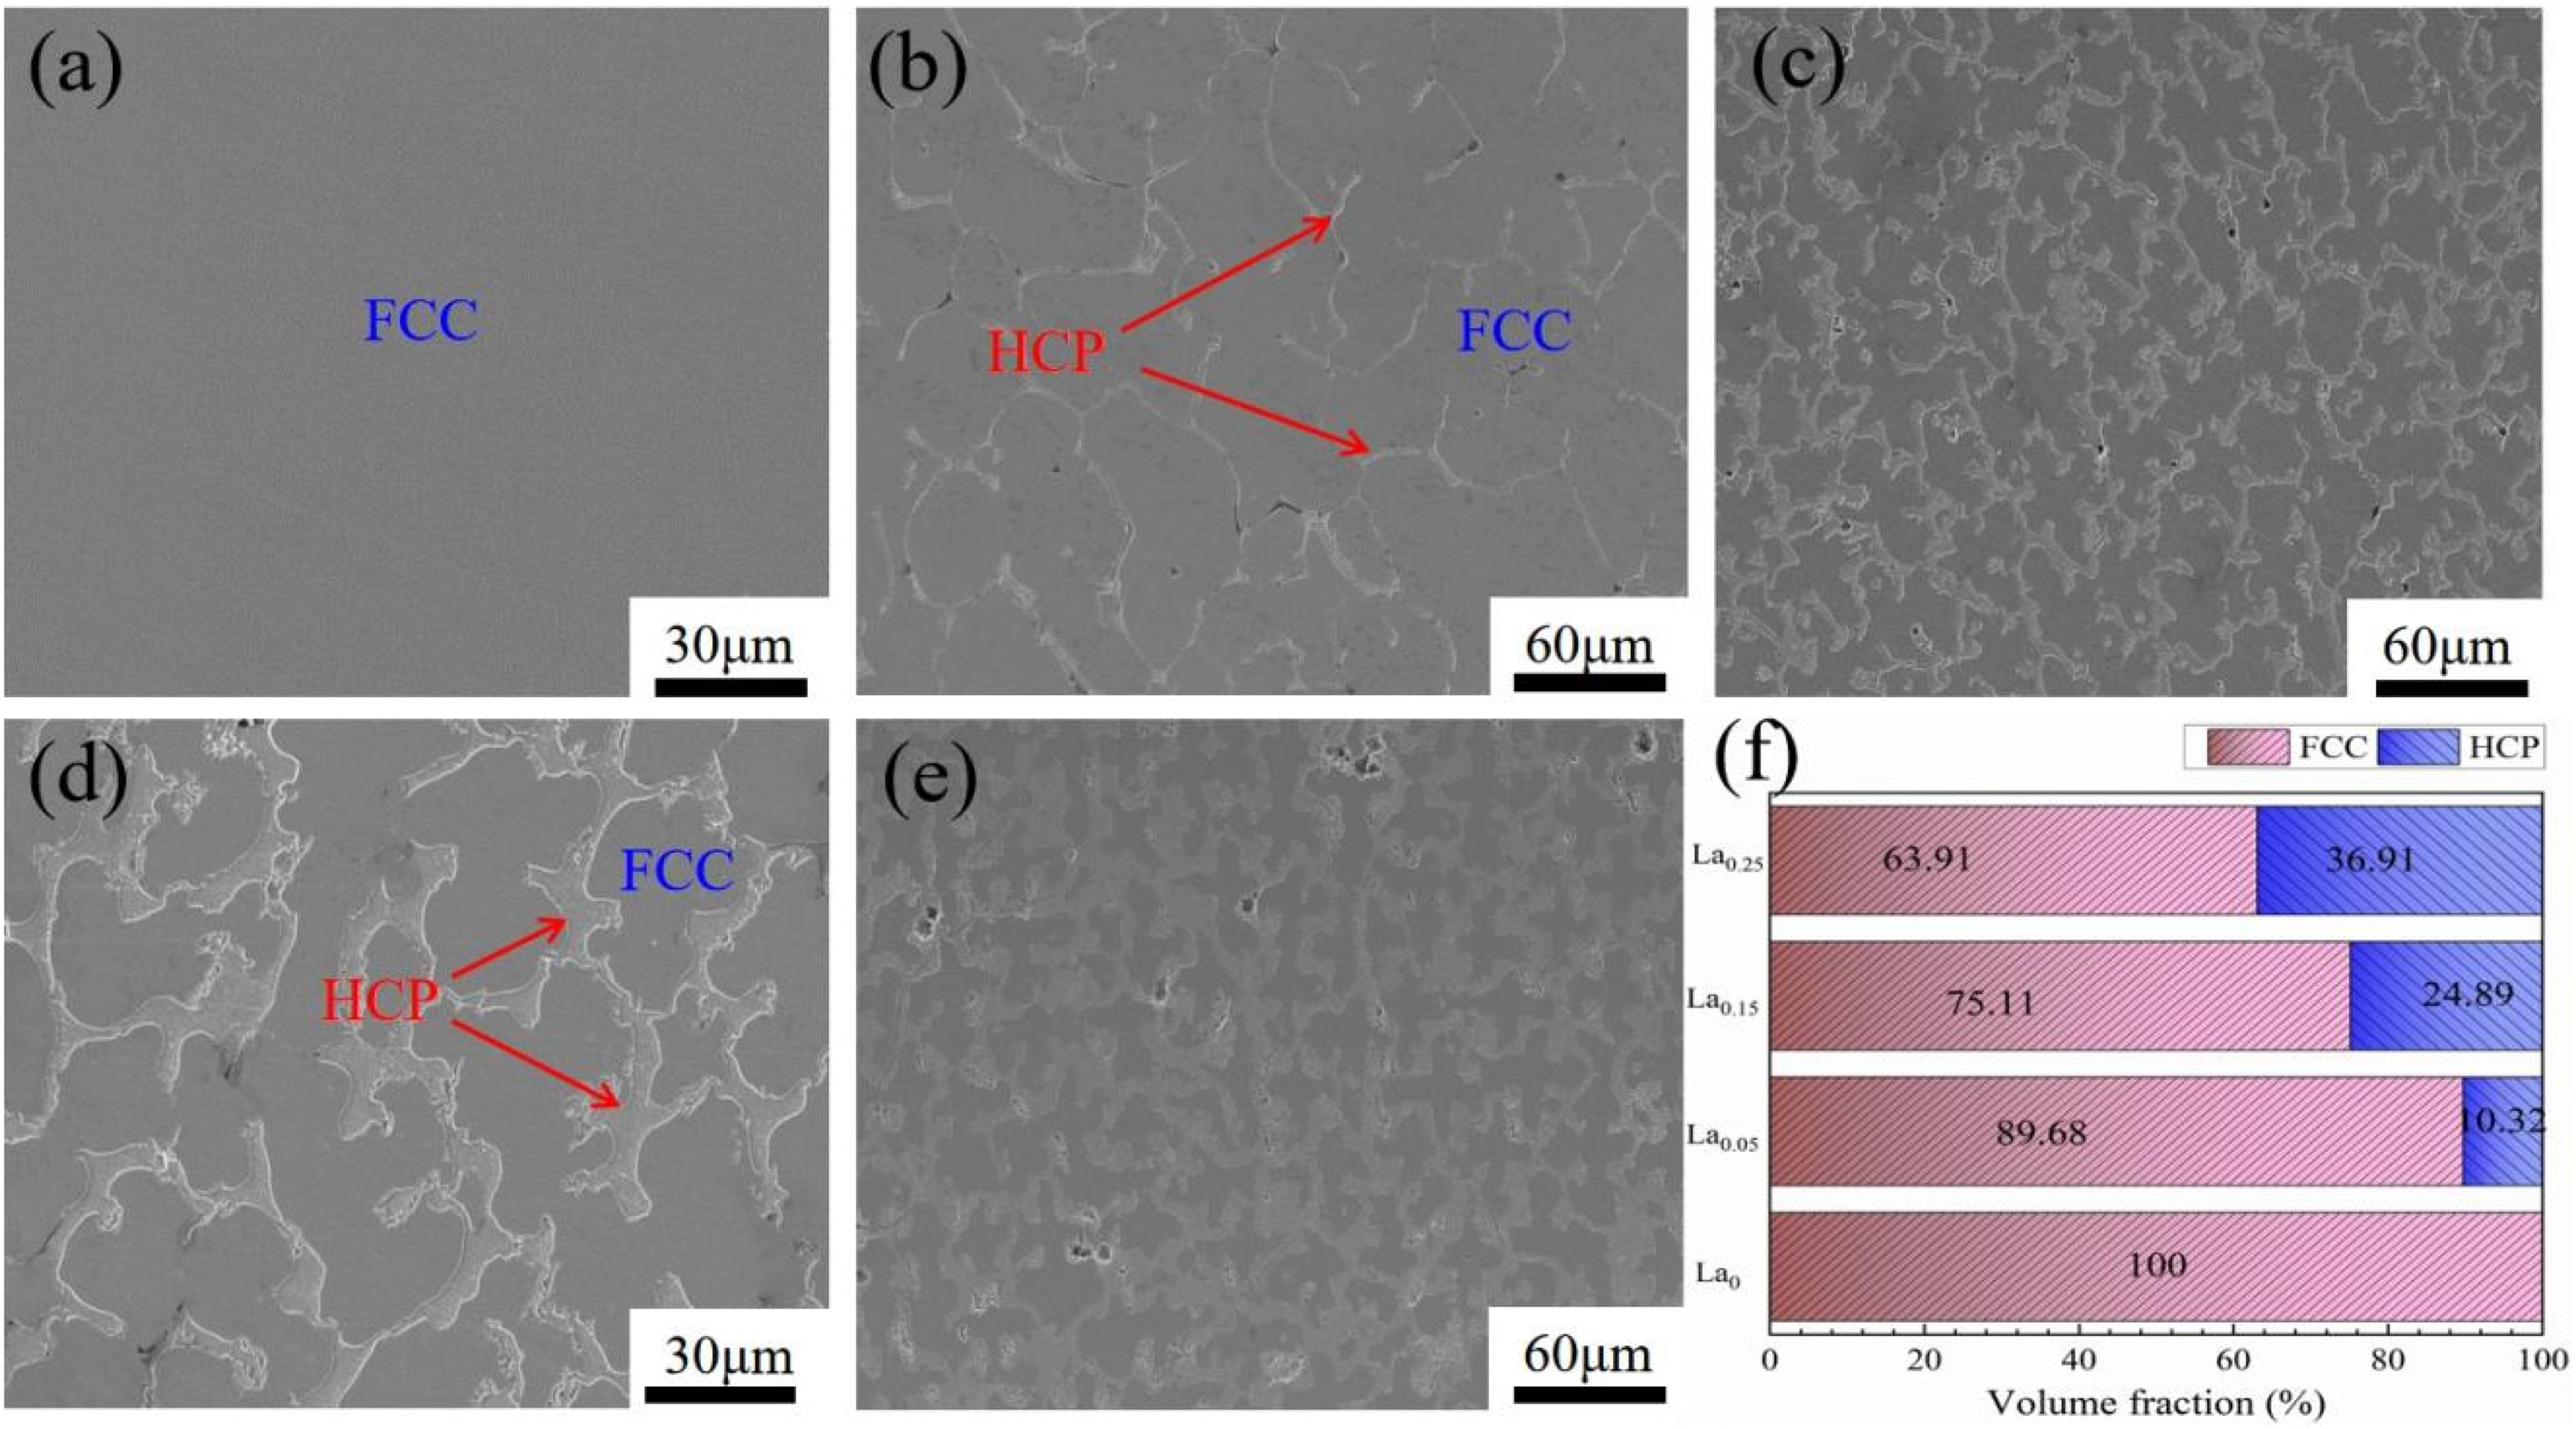
SEM images of the samples La0, La0.05, La0.15, and La0.25, and the volume fractions of the FCC and HCP phases: (a) Sample La0; (b) La0.05; (c, d) La0.15; (e) La0.25; (f) Volume fractions of FCC and HCP phases.
To determine the composition of the FCC and HCP phases, SEM-EDS mapping analysis was performed on the La0, La0.05, La0.15, and La0.25 samples, as shown in Figure 3. The results indicated that La and Ni were enriched in the HCP phase, which was associated with the significantly negative mixing enthalpy between Ni and La (Table 1). 42

SEM images and SEM-EDS surface scanning maps of the samples La0, La0.05, La0.15, and La0.25: (a) Sample La0; (b) Sample La0.05; (c) Sample La0.15; (d) Sample La0.25.
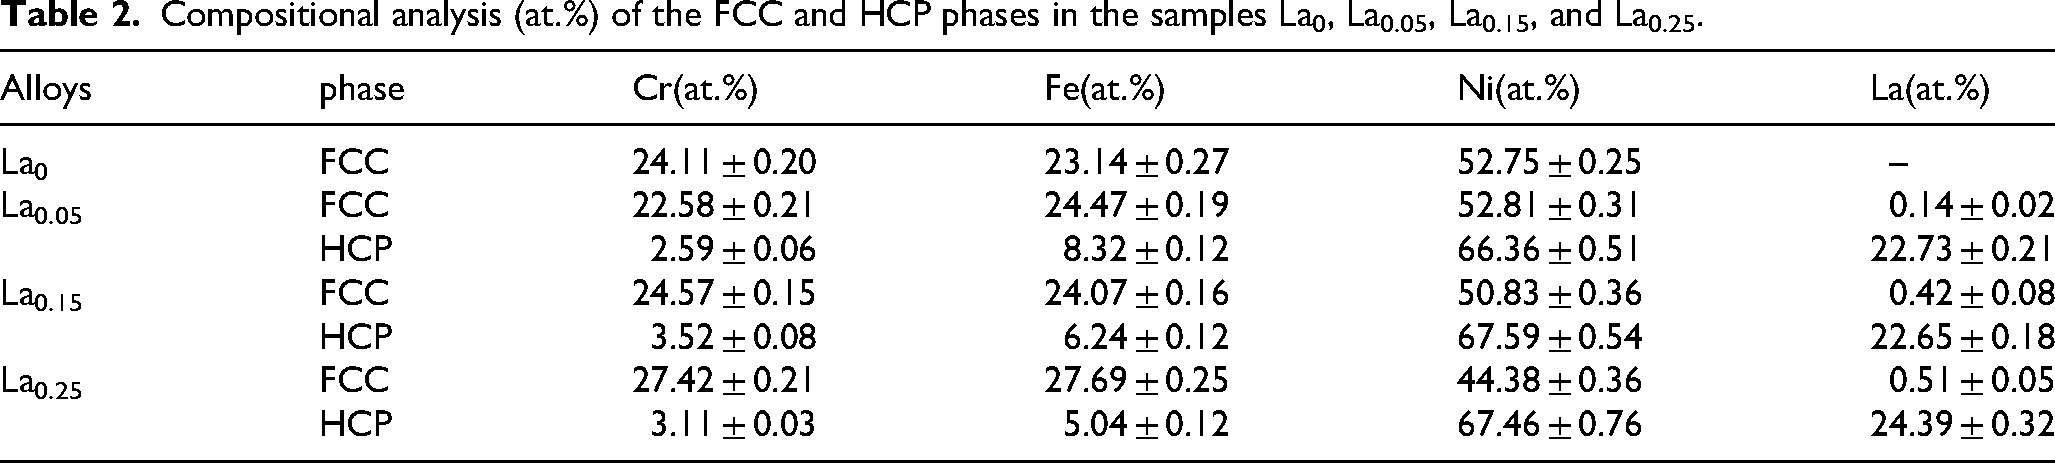
To further quantify the composition of the FCC and HCP phases in the La0, La0.05, La0.15, and La0.25 samples, EDS point analyses were conducted on all samples (Table 2). The results indicated that in the La0 sample, the FCC matrix phase contains 24.11 at.% Cr, 23.14 at.% Fe, and 52.75 at.% Ni. After the addition of La, the formation of the HCP phase altered the elemental distribution in the FCC phase. With an increasing in La content, the Cr and Fe concentrations in the FCC phase gradually increased, while the Ni concentration decreased. In the La0.25 sample, the Cr and Fe contents reached 27.42 at.% and 27.69 at.%, respectively, while the Ni content decreased to 44.38 at.%. These results indicated that an increasing amount of Ni segregated into the HCP phase, leading to a redistribution of atoms within the FCC phase. Furthermore, the La content in the FCC phase increased from 0.14 at.% in the La0.05 sample to 0.51 at.% in the La0.25 sample. This increasing in La concentration in the FCC phase is a key factor contributing to the observed increase in the FCC lattice constant (Figure 1).
Compositional analysis (at.%) of the FCC and HCP phases in the samples La0, La0.05, La0.15, and La0.25.
It is well known that grain size has a significant impact on the mechanical properties of alloys. To investigate the effect of La content on grain size, inverse pole figure (IPF) analyses were performed on the La0, La0.05, La0.15, and La0.25 samples using SEM-EBSD techniques (Figure 4). The results showed that prior to the addition of La, the La0 sample exhibited a large grain size. As the La increased, an increasing number of small HCP phases precipitated from the matrix and along the grain boundaries or within the grains. The measured grain sizes based on Figure 4 were presented in Figure 4(e). The results showed that, the La0 sample exhibited a large grain size of approximately 412 ± 20 µm, which is unfavorable for the alloy's overall performance. As La increased, the grain size of the samples decreased significantly, particularly in the La0.15 and La0.25 samples. Compared to the La0 sample, the grain size was reduced by 33.5% and 40.5% in the La0.15 and La0.25 samples, respectively. Theses results indicated that the addition of La could significantly refined the grain structure of the CrFeNi2 alloy. Especially in sample La0.25, the average grain size was only 245 µm, approximately half that in sample La0. Furthermore, as shown in Figure 4, the grain boundaries of the alloy exhibited irregular morphologies. This is attributed to phase transformation induced by the addition of La, which caused distortion and displacement of the grain boundaries. As depicted in Figure 4, the volume fraction and average grain size of the HCP phase exhibited opposite trends as La increased.
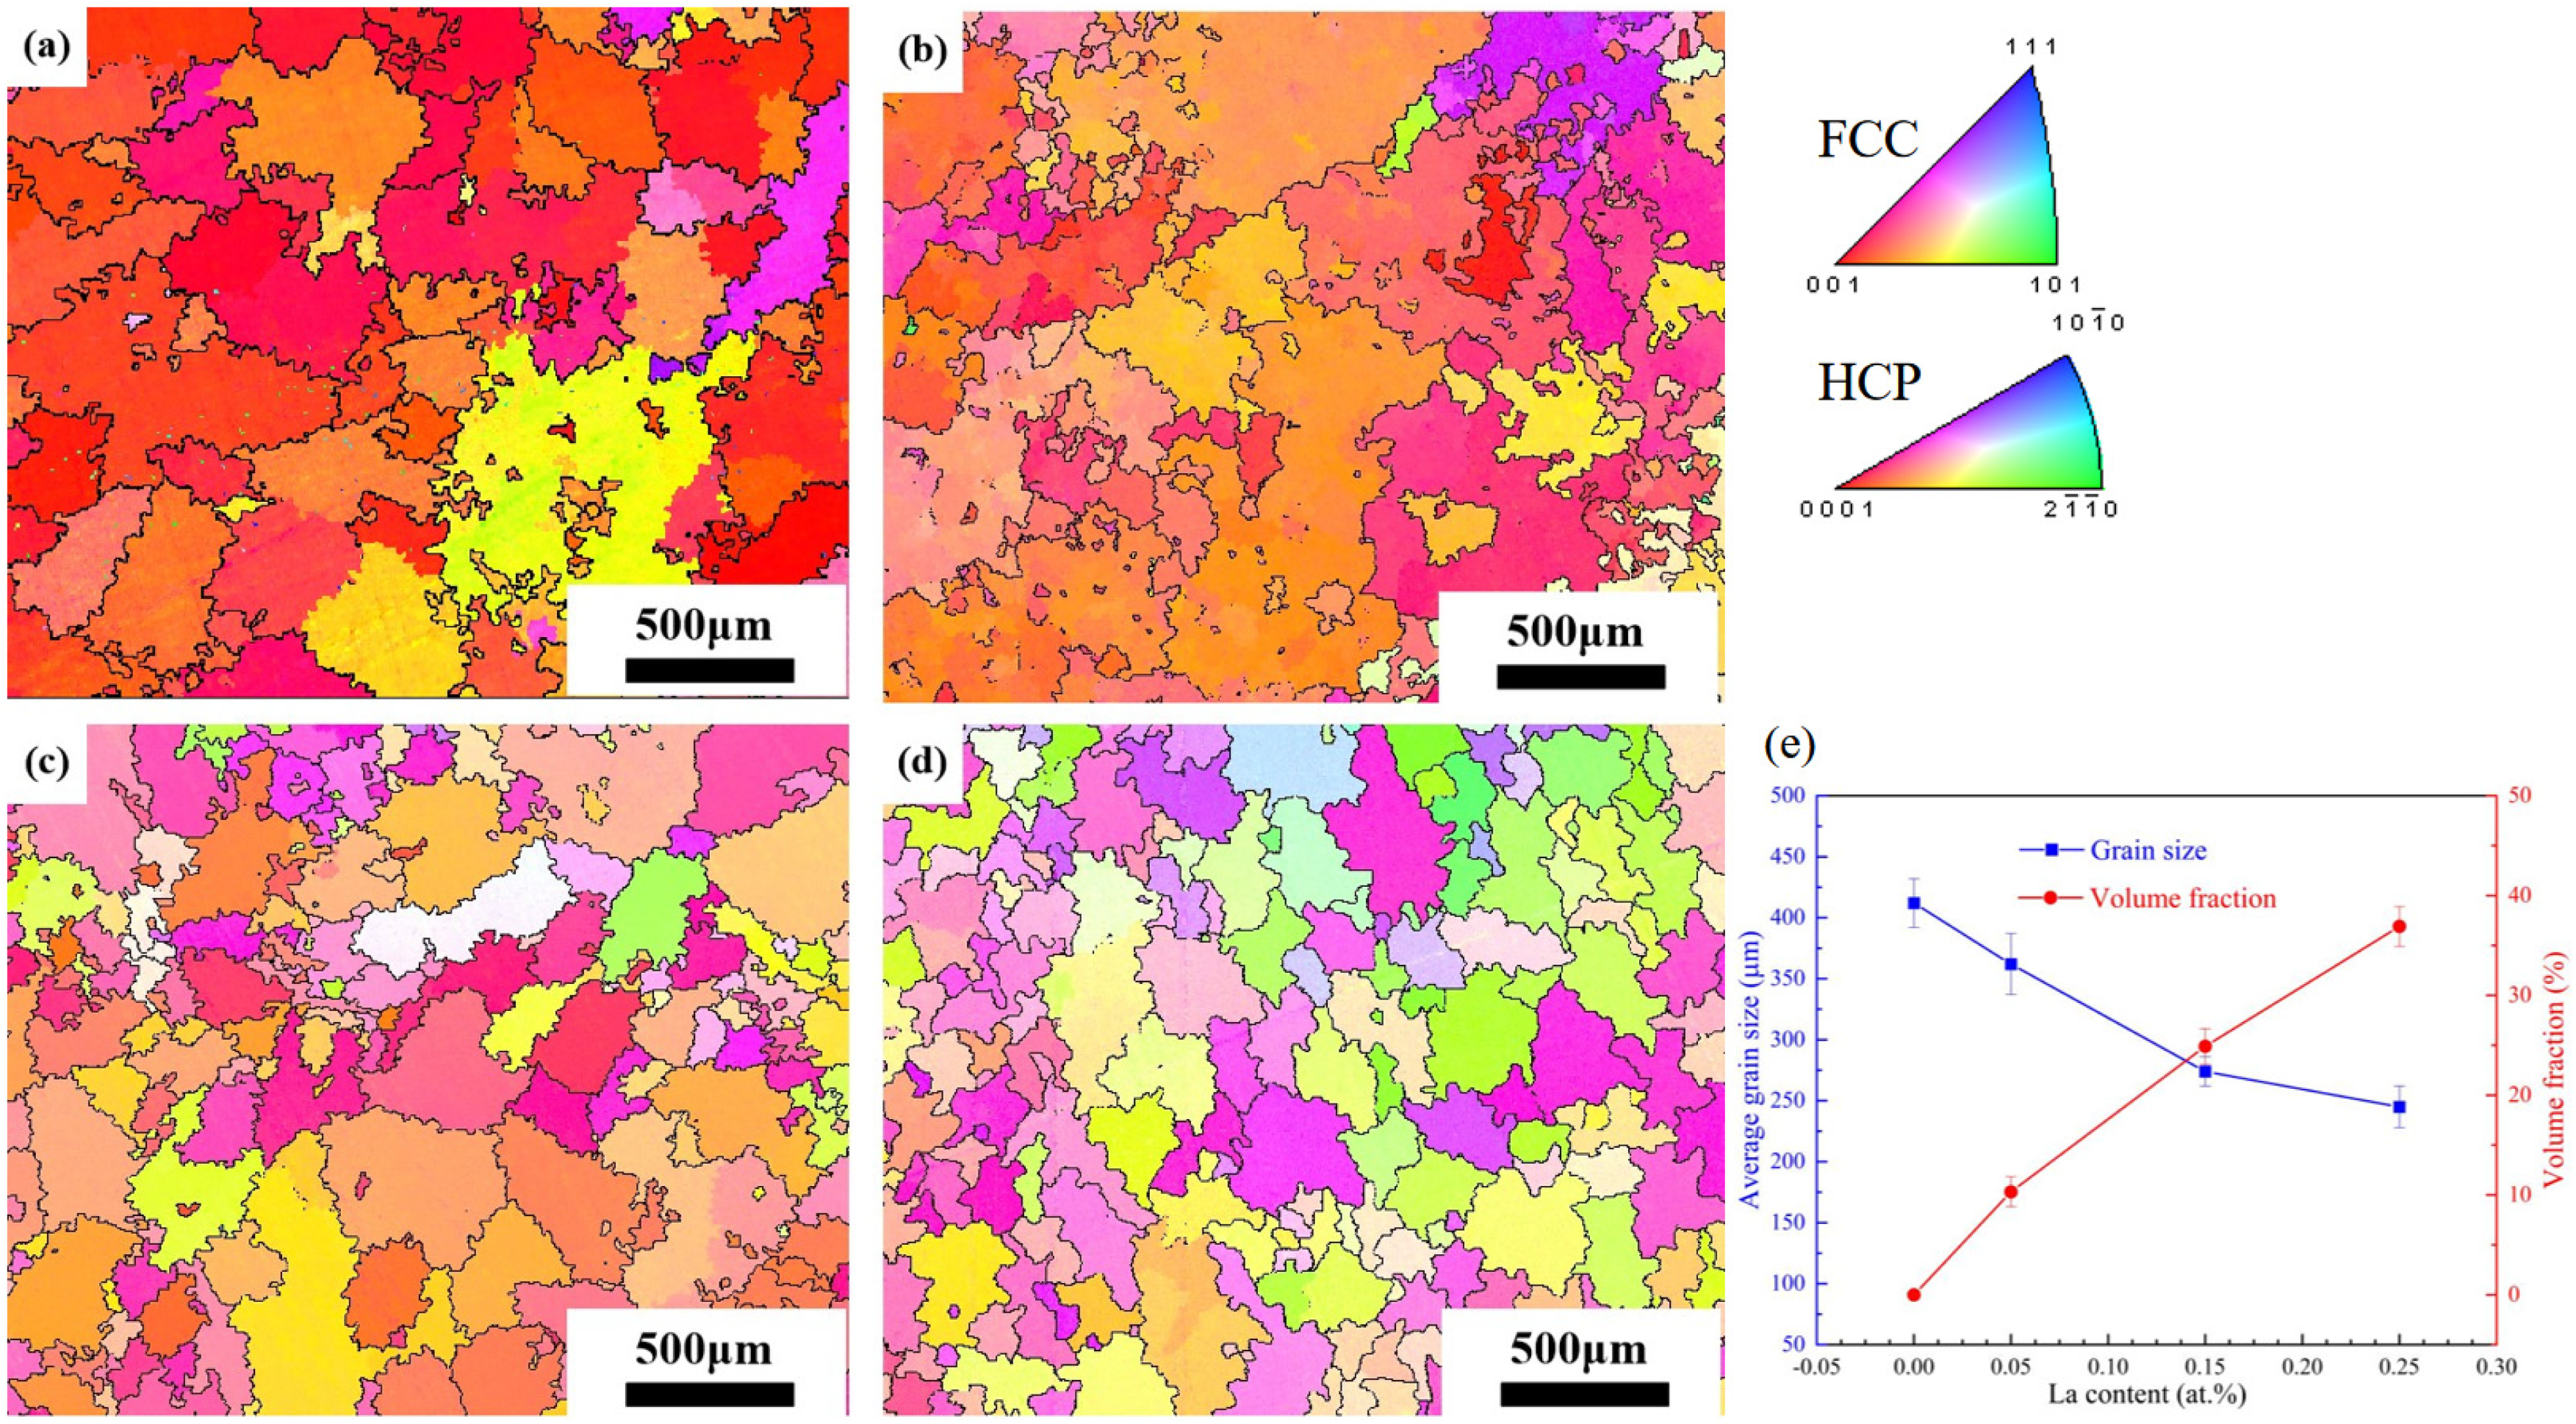
IPF maps of the samples La0, La0.05, La0.15, La0.25: (a) La0; (b) La0.05; (c) La0.15; (d) La0.25;(e) Analysis of average grain size and volume fraction of HCP phase in samples La0, La0.05, La0.15, and La0.25.
In order to better describe the distribution and orientation of the HCP phase in alloys. EBSD tests were conducted on La0.05, La0.15 and La0.25 alloys at high multiples. As shown in Figure 5, (a1), (b1) and (c1) are the IPF diagrams of the three alloys, and the orientation color diagram is on the left. (a2), (b2) and (c2) are phase diagrams of three alloys, among which the green area represents the FCC phase and the yellow area represents the HCP phase. It can be found that its phase diagram distribution is similar to that of the SEM image (Figure 3). Unlike Figure 4, the HCP phase can be clearly observed in Figure 5. It is speculated that the reason for this is that the average grain size of this series of alloys is relatively large, and the scanning step size in Figure 4 is 6 μm, while the width of the HCP phase is approximately 6 μm. Therefore, the HCP phase was not clearly observed in Figure 4 of the low-magnification scan. (a3), (b3) and (c3) show the KAM diagrams of the alloy. The KAM plots provide a visual depiction of internal deformation irregularities and the corresponding distribution of dislocation or defect density. 43 It can be observed that the distribution of KAM values is relatively uniform, and the areas with high KAM values are in good agreement with the phase boundaries. This reflects the ideal homogenization effect of the alloy
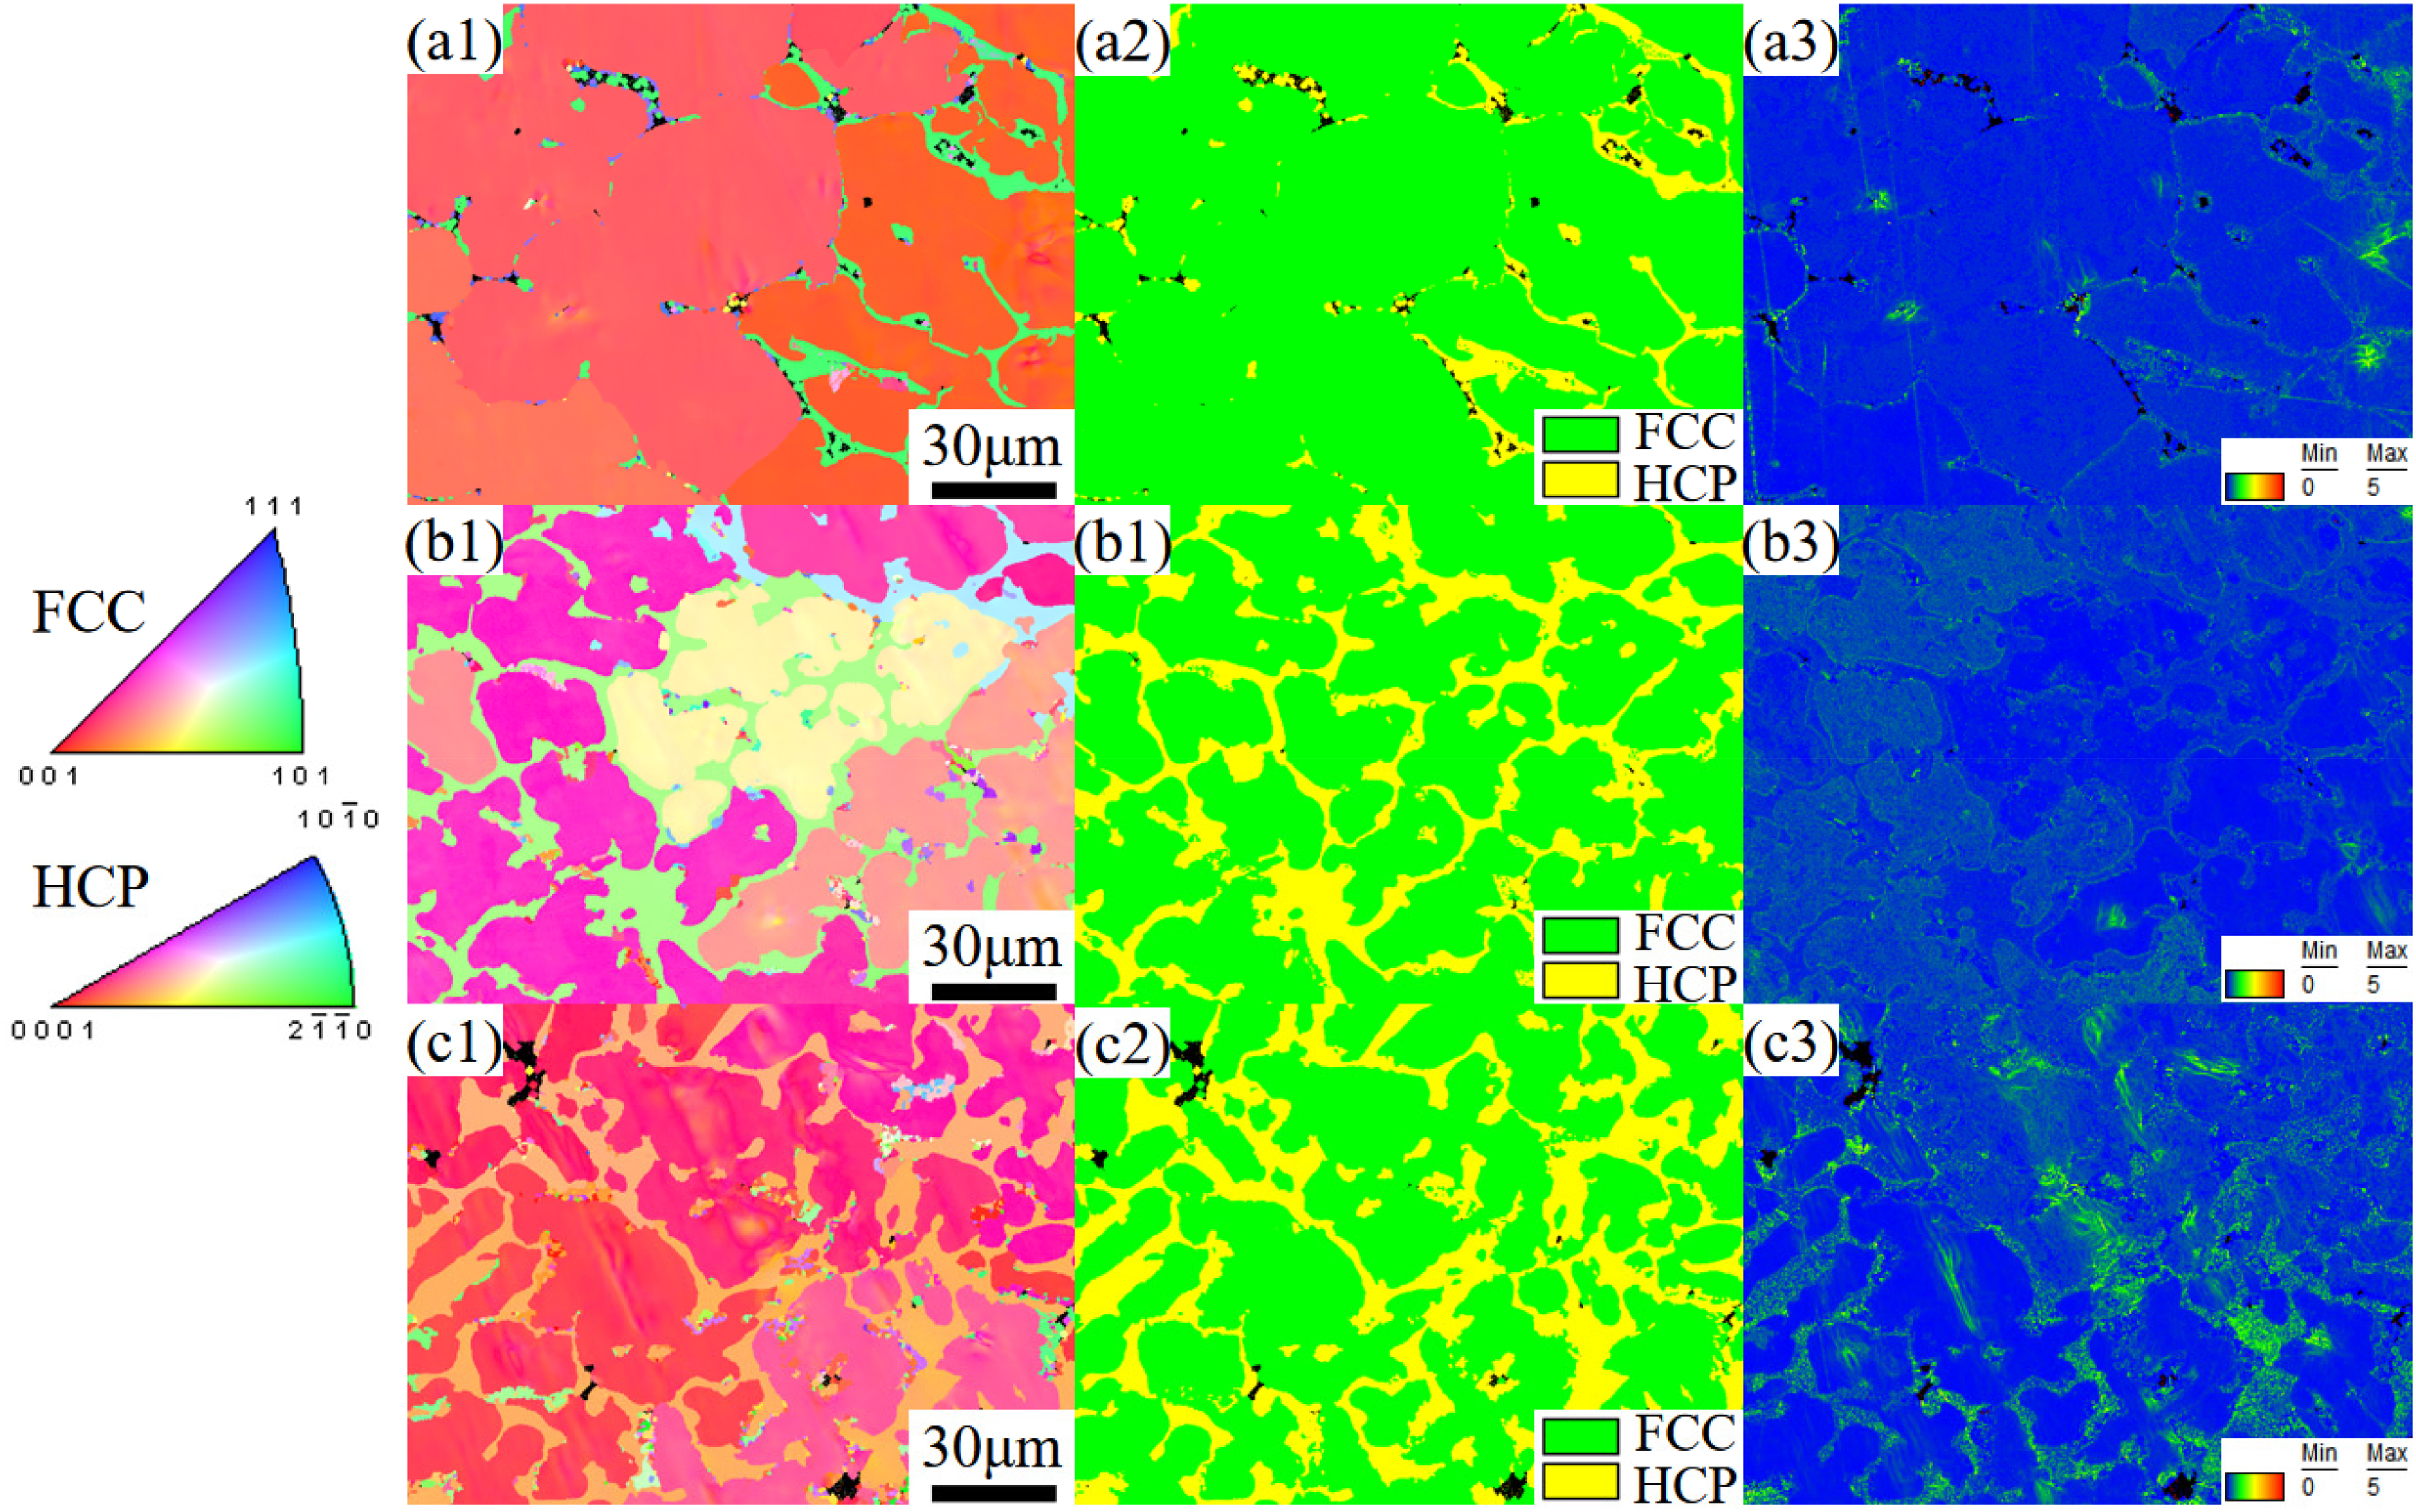
EBSD IPF, KAM and Phase maps of three alloys: (a1–a3) La0.05; (b1–b3) La0.15; (c1–c3) La0.25.
Using TEM, we further investigated the precipitation behavior of precipitated phase and phase structure in sample La0.15 (Figure 6(a)). The results clearly revealed that the precipitated second phase was precipitated along grain boundaries or within the grain. The selected area diffraction patterns (SADPs) showed the structure of precipitated phase is HCP, while matrix is FCC, which was consistent with the results of XRD. Based on the indexing and symmetry of the diffraction spots, the HCP structure can be identified as the 2H-type HCP (ABAB stacking, space group P6₃/mmc). 44 Moreover, the TEM analysis further confirmed that the HCP phase was precipitated within the grain interiors or at the grain boundaries. The presence of the HCP phase effectively hindered grain boundary migration, thereby suppressing grain growth. In conclusion, the addition of La significantly refined the grains of the CrFeNi2 alloy by introducing the HCP phase, and grain refinement is beneficial for enhancing the mechanical properties of the alloy.
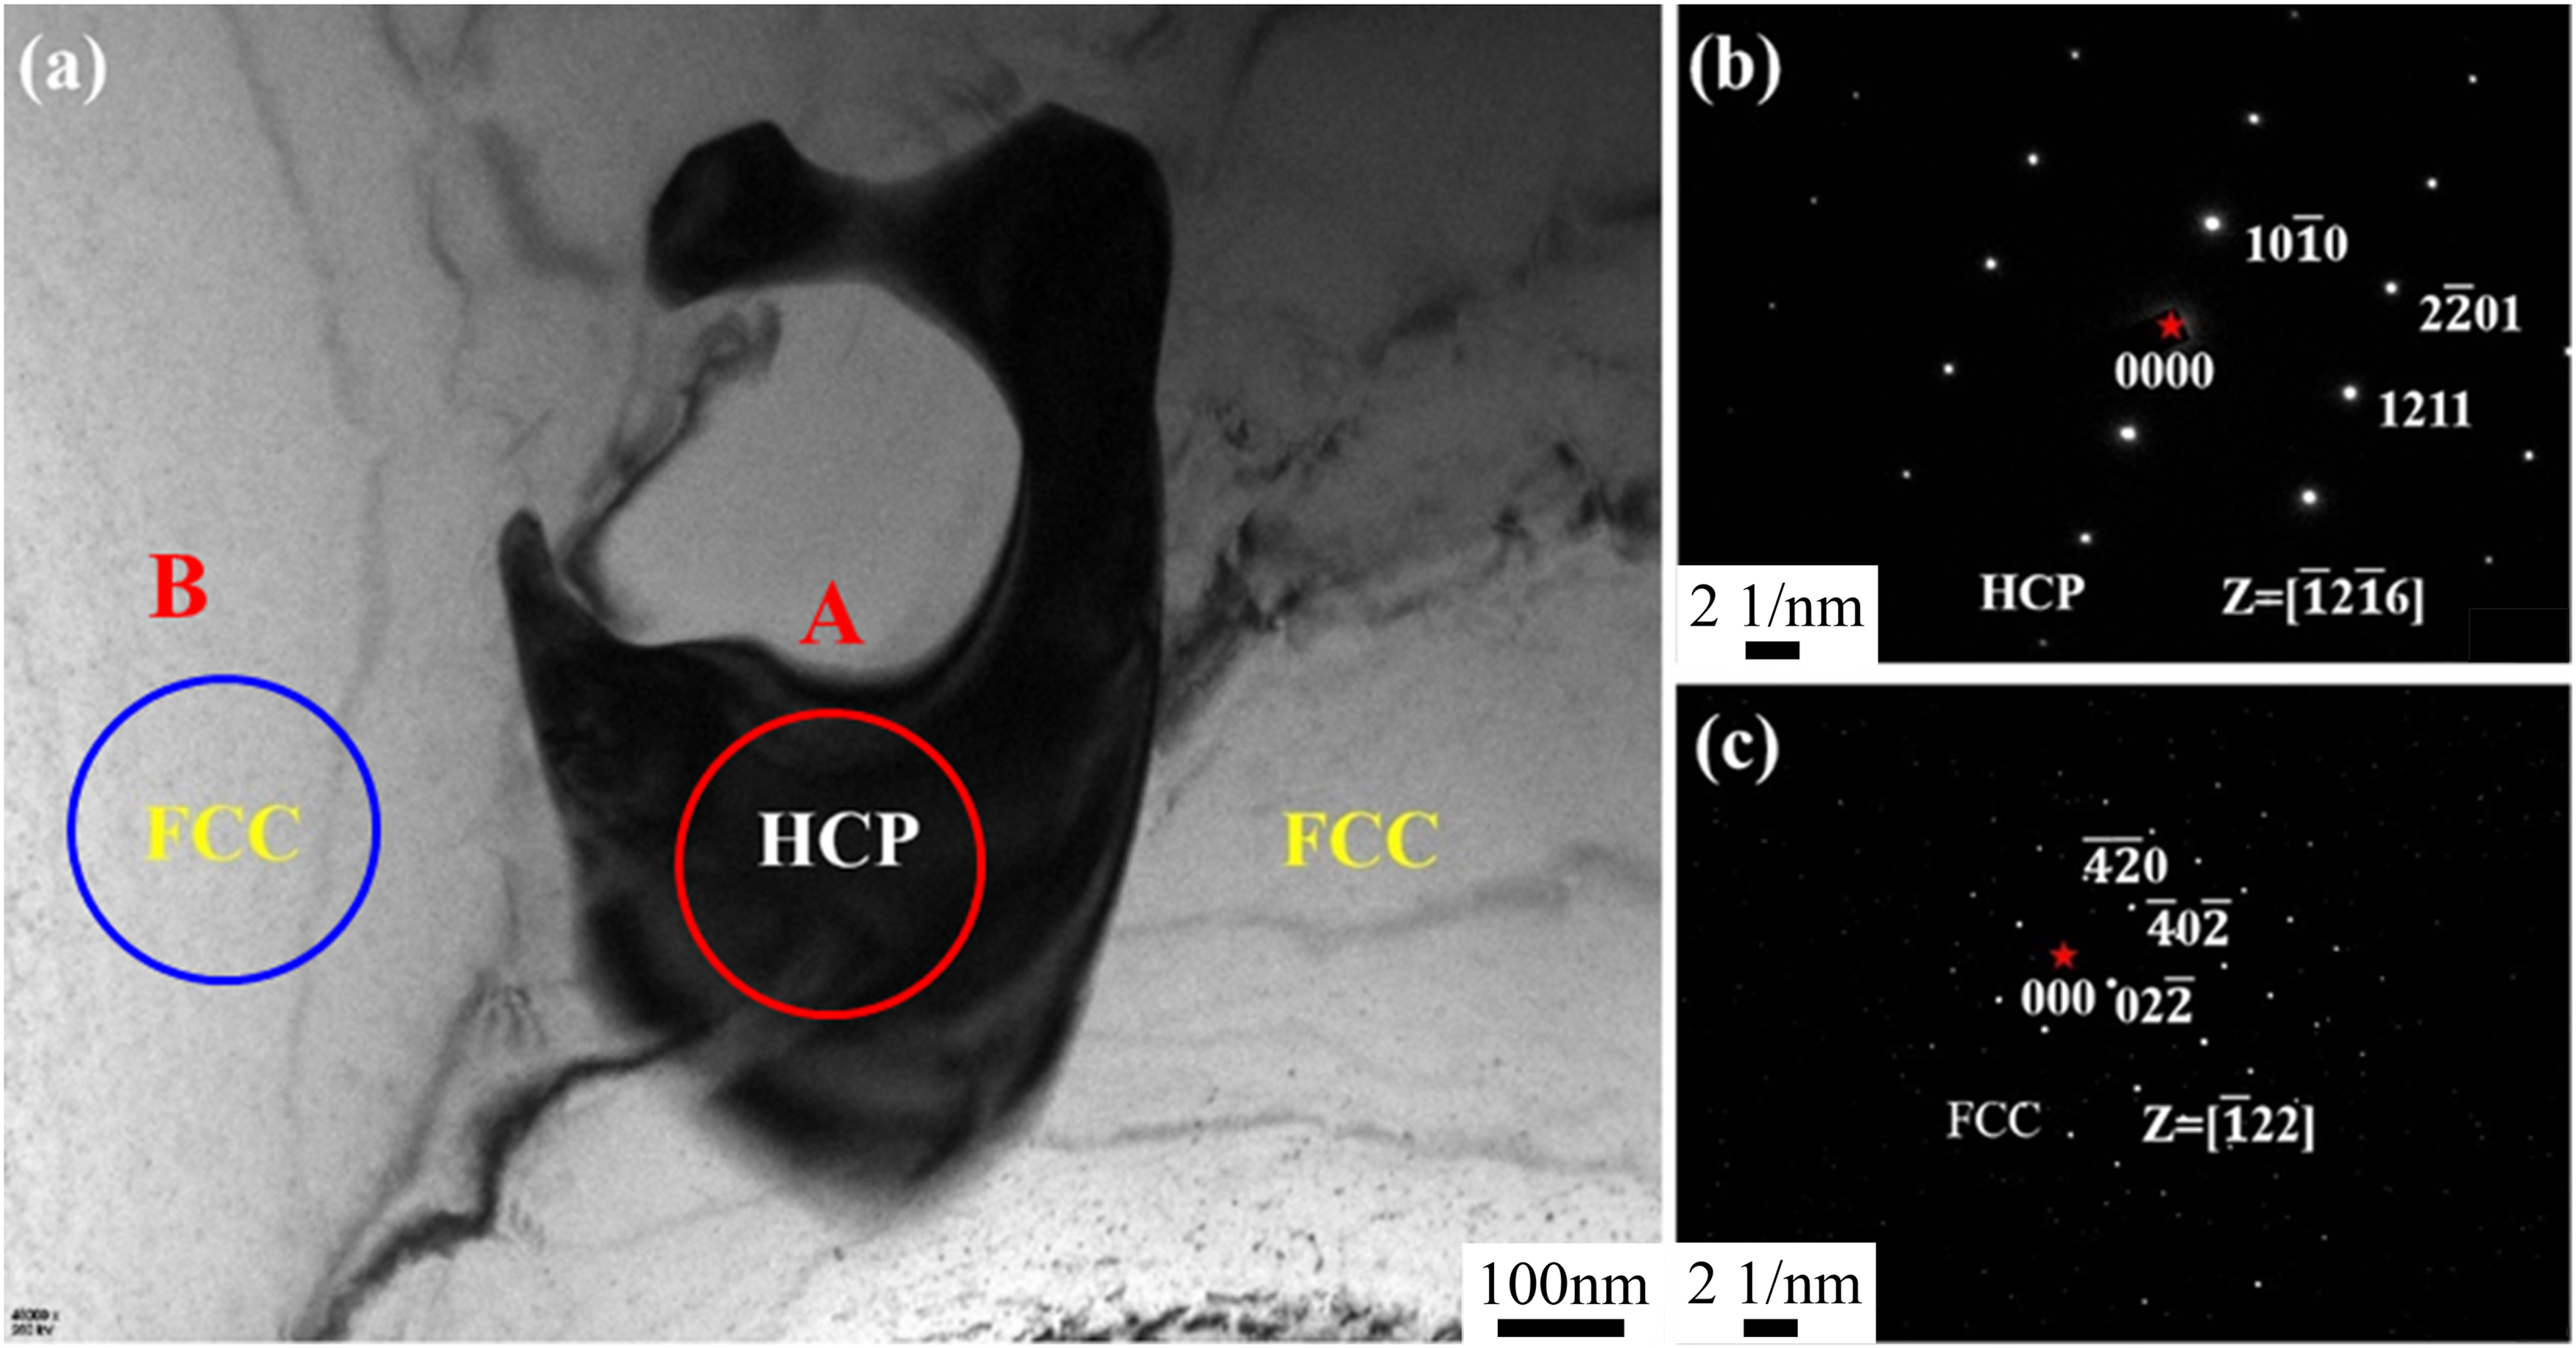
TEM results of the sample La0.15: (a) TEM image; (b) and (c) Corresponding selected area electron diffraction (SAED) patterns of selected areas A and B, respectively, as indicated in Fig. a.
Prediction of phase transition based on thermodynamic calculations
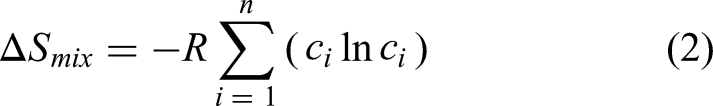
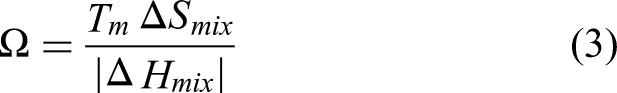
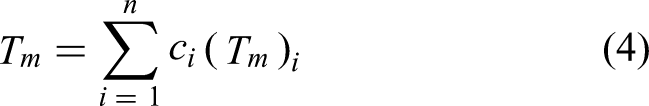
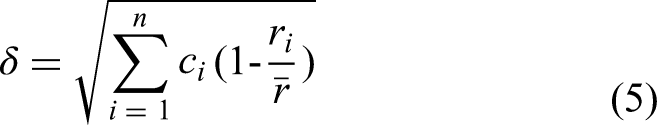
It is well known that the phase composition of an alloy has a significant impact on its performance. Therefore, predicting the phase transformation and phase stability of CrFeNi2La alloys provides important theoretical guidance for designing CrFeNi2La medium-entropy alloys with excellent mechanical properties. In this study, the phase stability of CrFeNi2La alloys will be predicted using the following thermodynamic formulas42,45: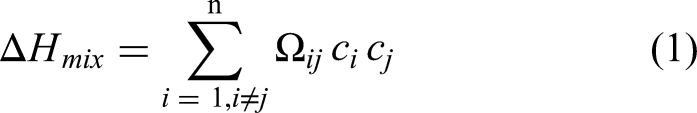
Calculated parameters ΔSmix, ΔHmix, Ω, δ, VEC, Δχ, and Λ for the CrFeNi2Lax MEA studied.
From the perspective of elemental chemical compatibility, the electronegativity difference can be used as a characterization parameter to evaluate the phase formation potential in the CrFeNi2La
x
MEAs system. The electronegativity difference (Δχ) is defined by the formula
Effect of adding La on the mechanical properties
To investigate the effect of La addition on the mechanical properties of CrFeNi2La x alloys, Vickers hardness tests and room-temperature compression experiments were conducted on samples La0, La0.05, La0.15, and La0.25. Figure 7 showed the Vickers hardness values of the samples La0, La0.05, La0.15, and La0.25. The results indicated that the hardness of the La0 sample is 125 HV. After the addition of La, the hardness of the samples significantly increased. Compared to the La0 sample, the hardness of the La0.05, La0.15, and La0.25 samples increased by 34.4%, 96%, and 160%, respectively.
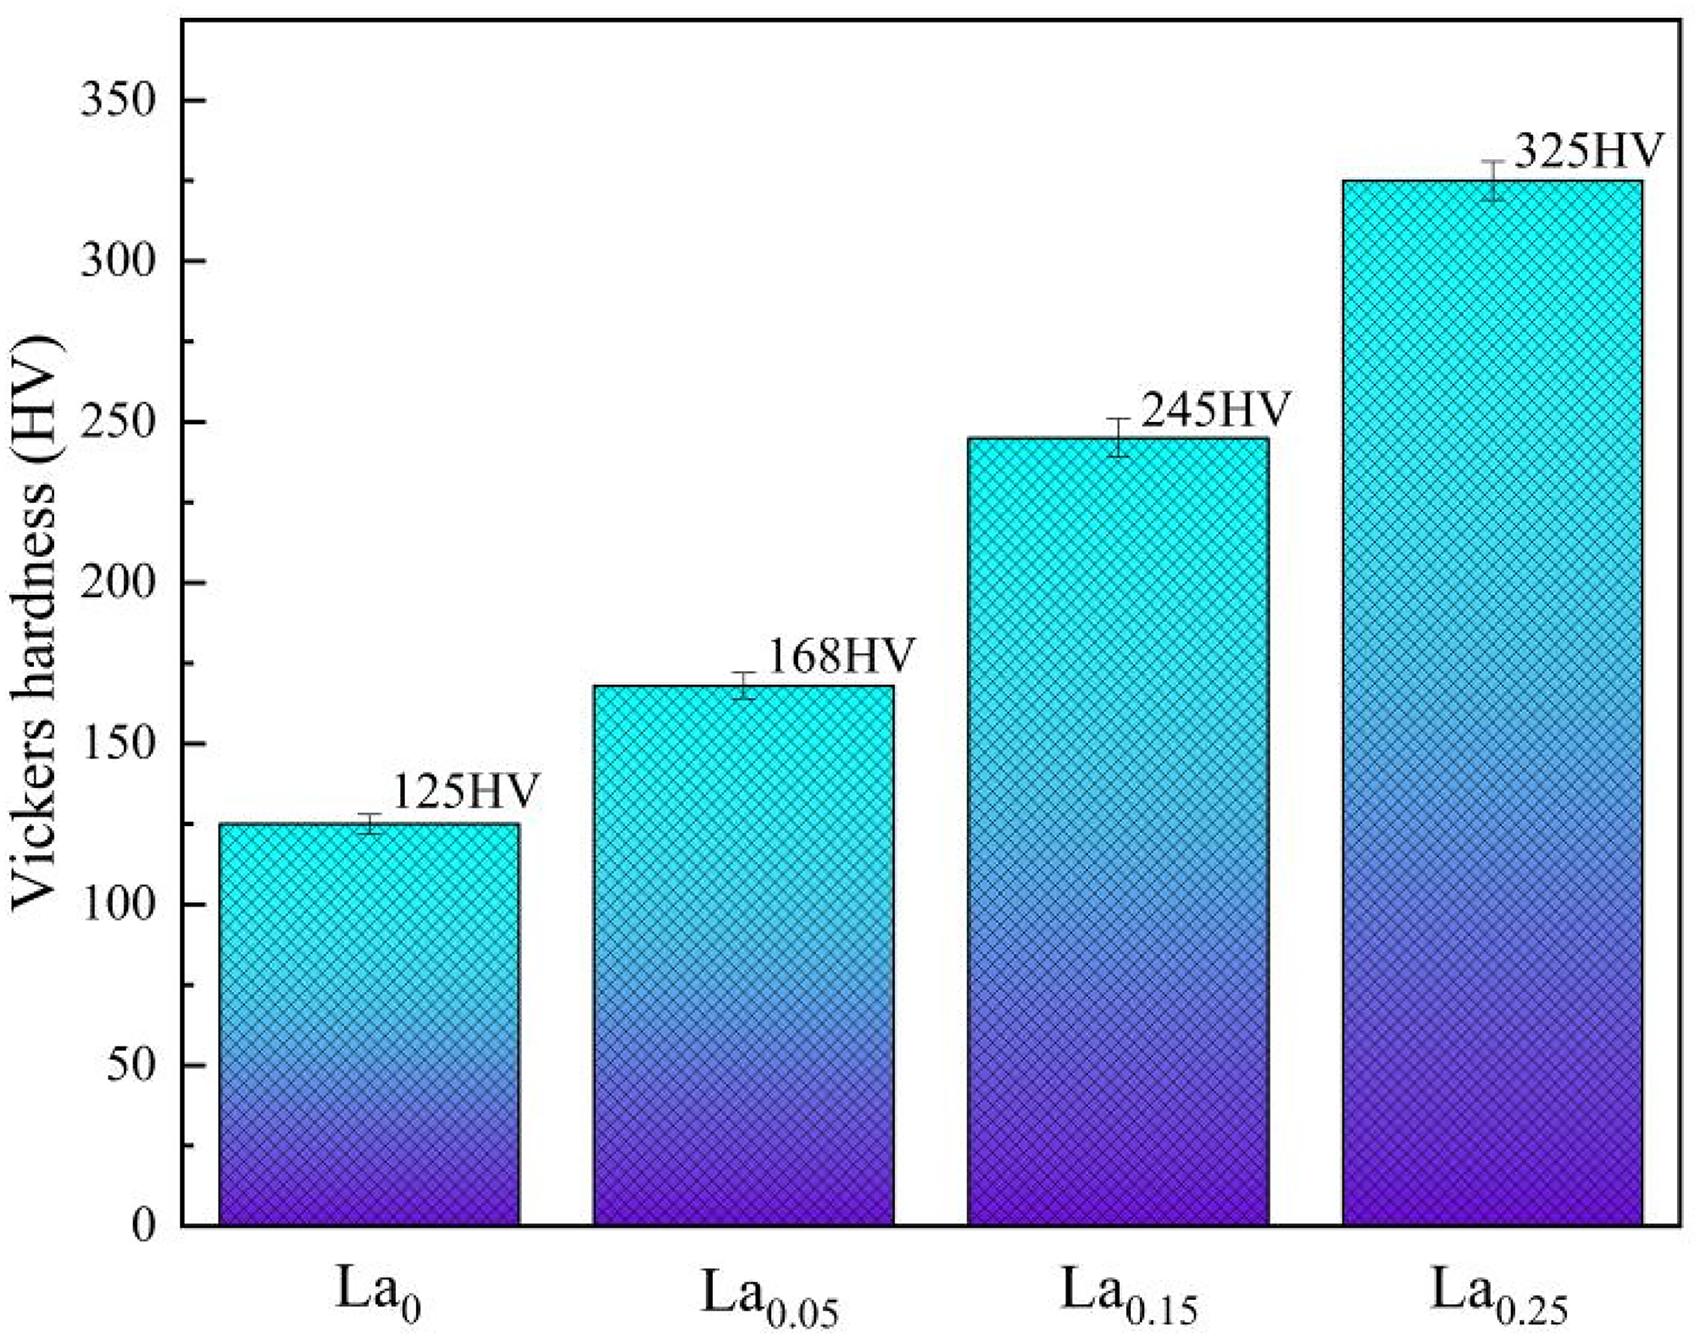
Vickers hardness of samples La0, La0.05, La0.15, and La0.25.
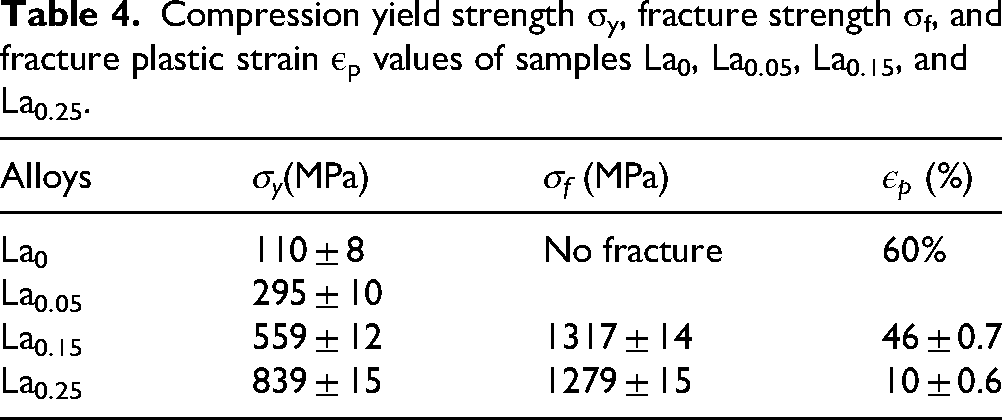
Figure 8 showed the compression engineering stress-strain curves of the samples La0, La0.05, La0.15, and La0.25. The compression yield strength (σy), fracture strength (σf), and fracture plastic strain (εp) values were obtained from the curves, as shown in Table 4. The results indicated that the yield strength of the La0 sample was only 110 MPa, but it exhibited good compressive plasticity, and could be compressed to 60% strain without fracture. After adding with 1.2 at.% La, the La₀.₀₅ sample exhibited an increased yield strength of 295 MPa while maintaining excellent ductility, with no fracture observed during compression. As the La content increased, the yield strength demonstrated a progressive enhancement, the La₀.₁₅ sample achieved a yield strength of 559 MPa, a fracture strength of 1317 MPa, and retained 46% plastic strain. When the Co content was increased to 5.9 at.%, The yield strength of the La0.25 sample increased to 839 MPa, but the fracture strength and plasticity decreased by 2.9% and 10%, respectively. The changes in these properties were primarily related to the volume fraction of the HCP phase, which will be discussed in detail in Discussion.
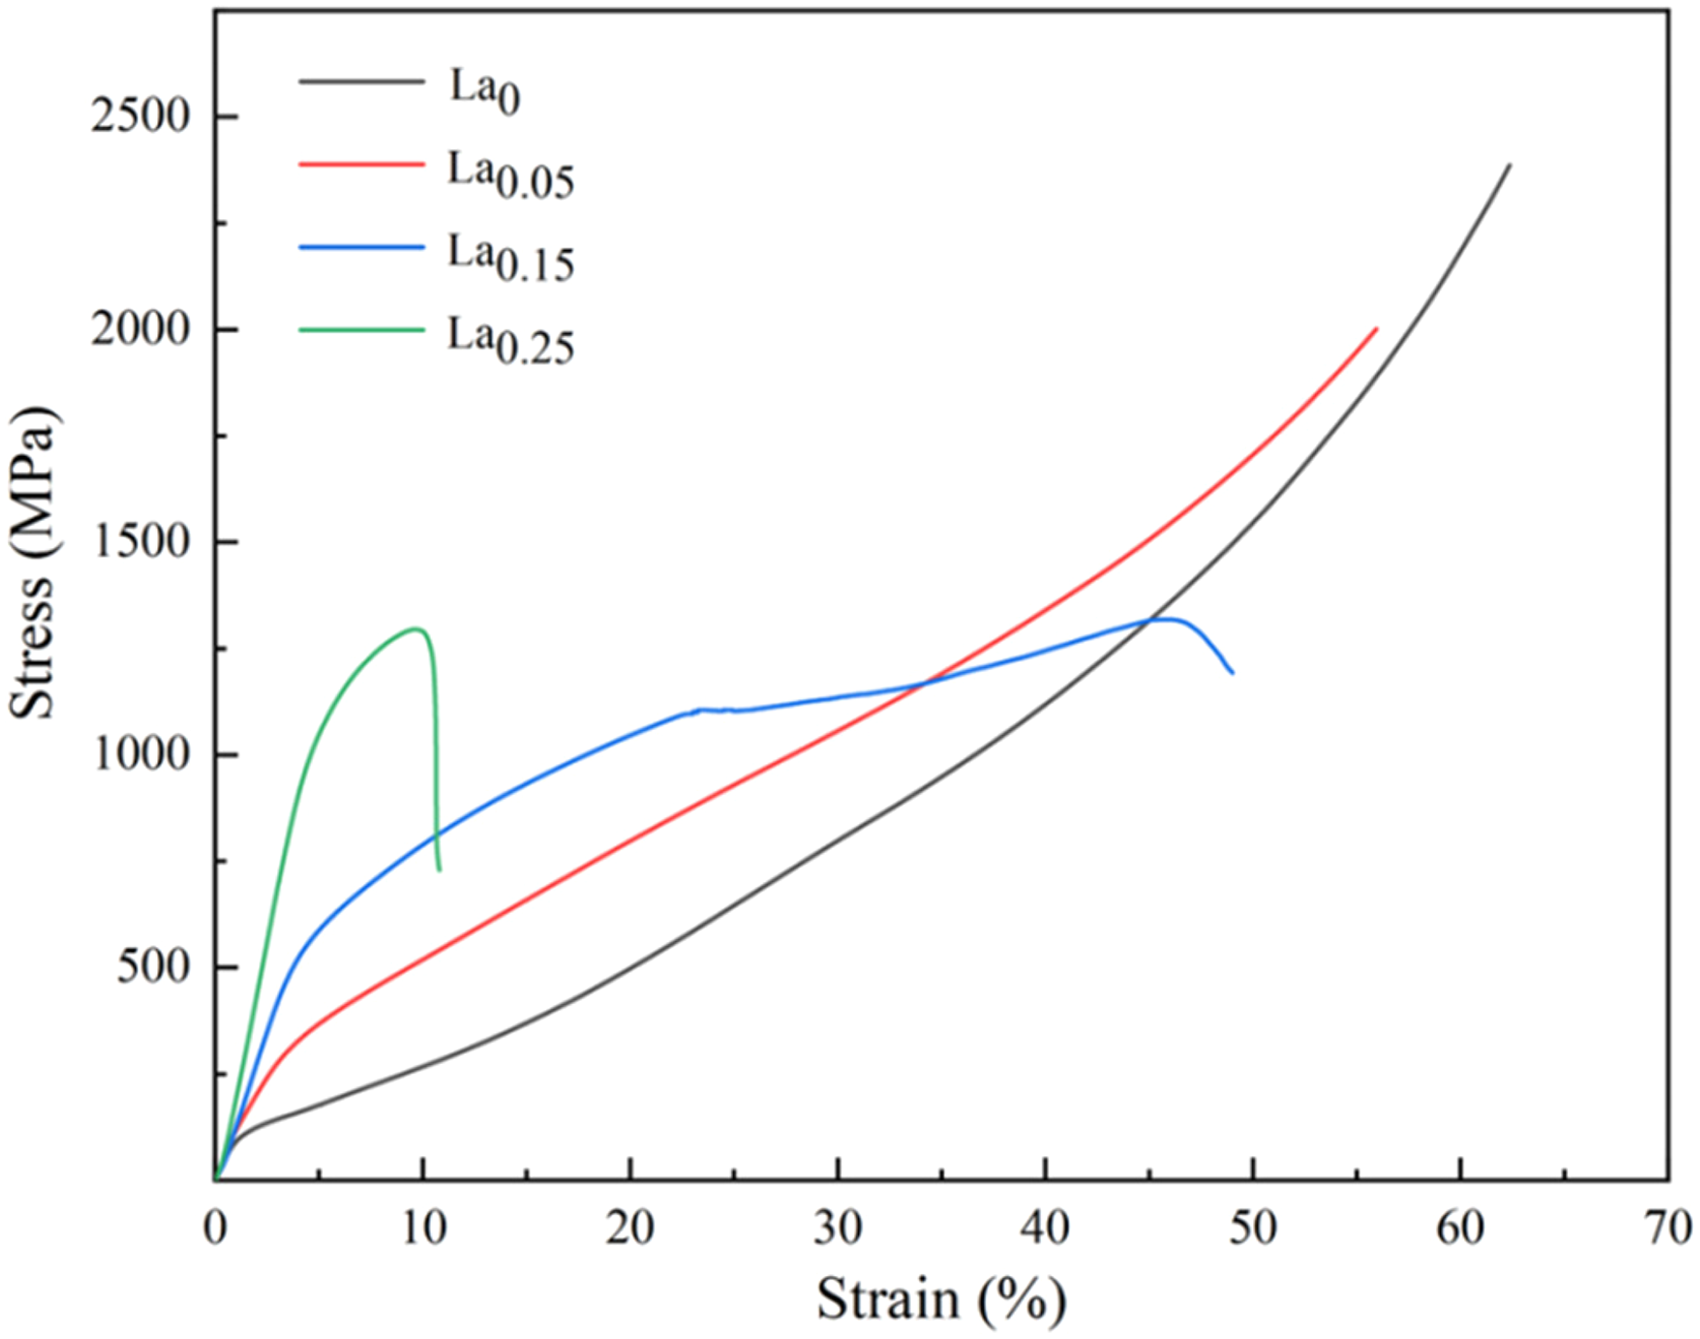
Compression engineering stress-strain curves of samples La0, La0.05, La0.15, and La0.25.
Compression yield strength σy, fracture strength σf, and fracture plastic strain εp values of samples La0, La0.05, La0.15, and La0.25.
Discussion
The mechanical properties data for the samples La0, La0.05, La0.15, and La0.25 showed that, after the addition of La, both the hardness and strength increased, and gradually increased as La content creased. The addition of La might have contributed to the enhancement in mechanical properties by improving the volume fraction of the HCP phase, solubility, and the grain size of the FCC phase. Ma et al. found that as the Hf content increased, the Vickers hardness and compressive yield strength of the CoCrFeNi HEA improved due to second-phase strengthening. 50 Lin et al. observed that the ɛ-martensitic transformation from the FCC phase to the HCP phase in an Fe17.5Mn10Co12.5 Cr5Ni5Si MEA, leading an increasing in mechanical properties. 51 In addition, Huang et al. found that the introduction of the HCP phase enhanced the yield stress, yield strain, and plastic flow stress of CoCrFeMnNi HEAs. 52 Therefore, we speculated that the increasing in hardness and strength in our alloys was closely related to the formation of the HCP phase. Figure 9 showed the curve fitting relationship between yield strength and hardness as a function of volume fraction of the HCP phase. The fitting results indicated that both yield strength and hardness exhibited a good linear relationship with the volume fraction of the HCP phase, indicating that the volume fraction of the second-phase HCP was the main reason for the enhancement of hardness and strength in CrFeNi2La x MEAs.
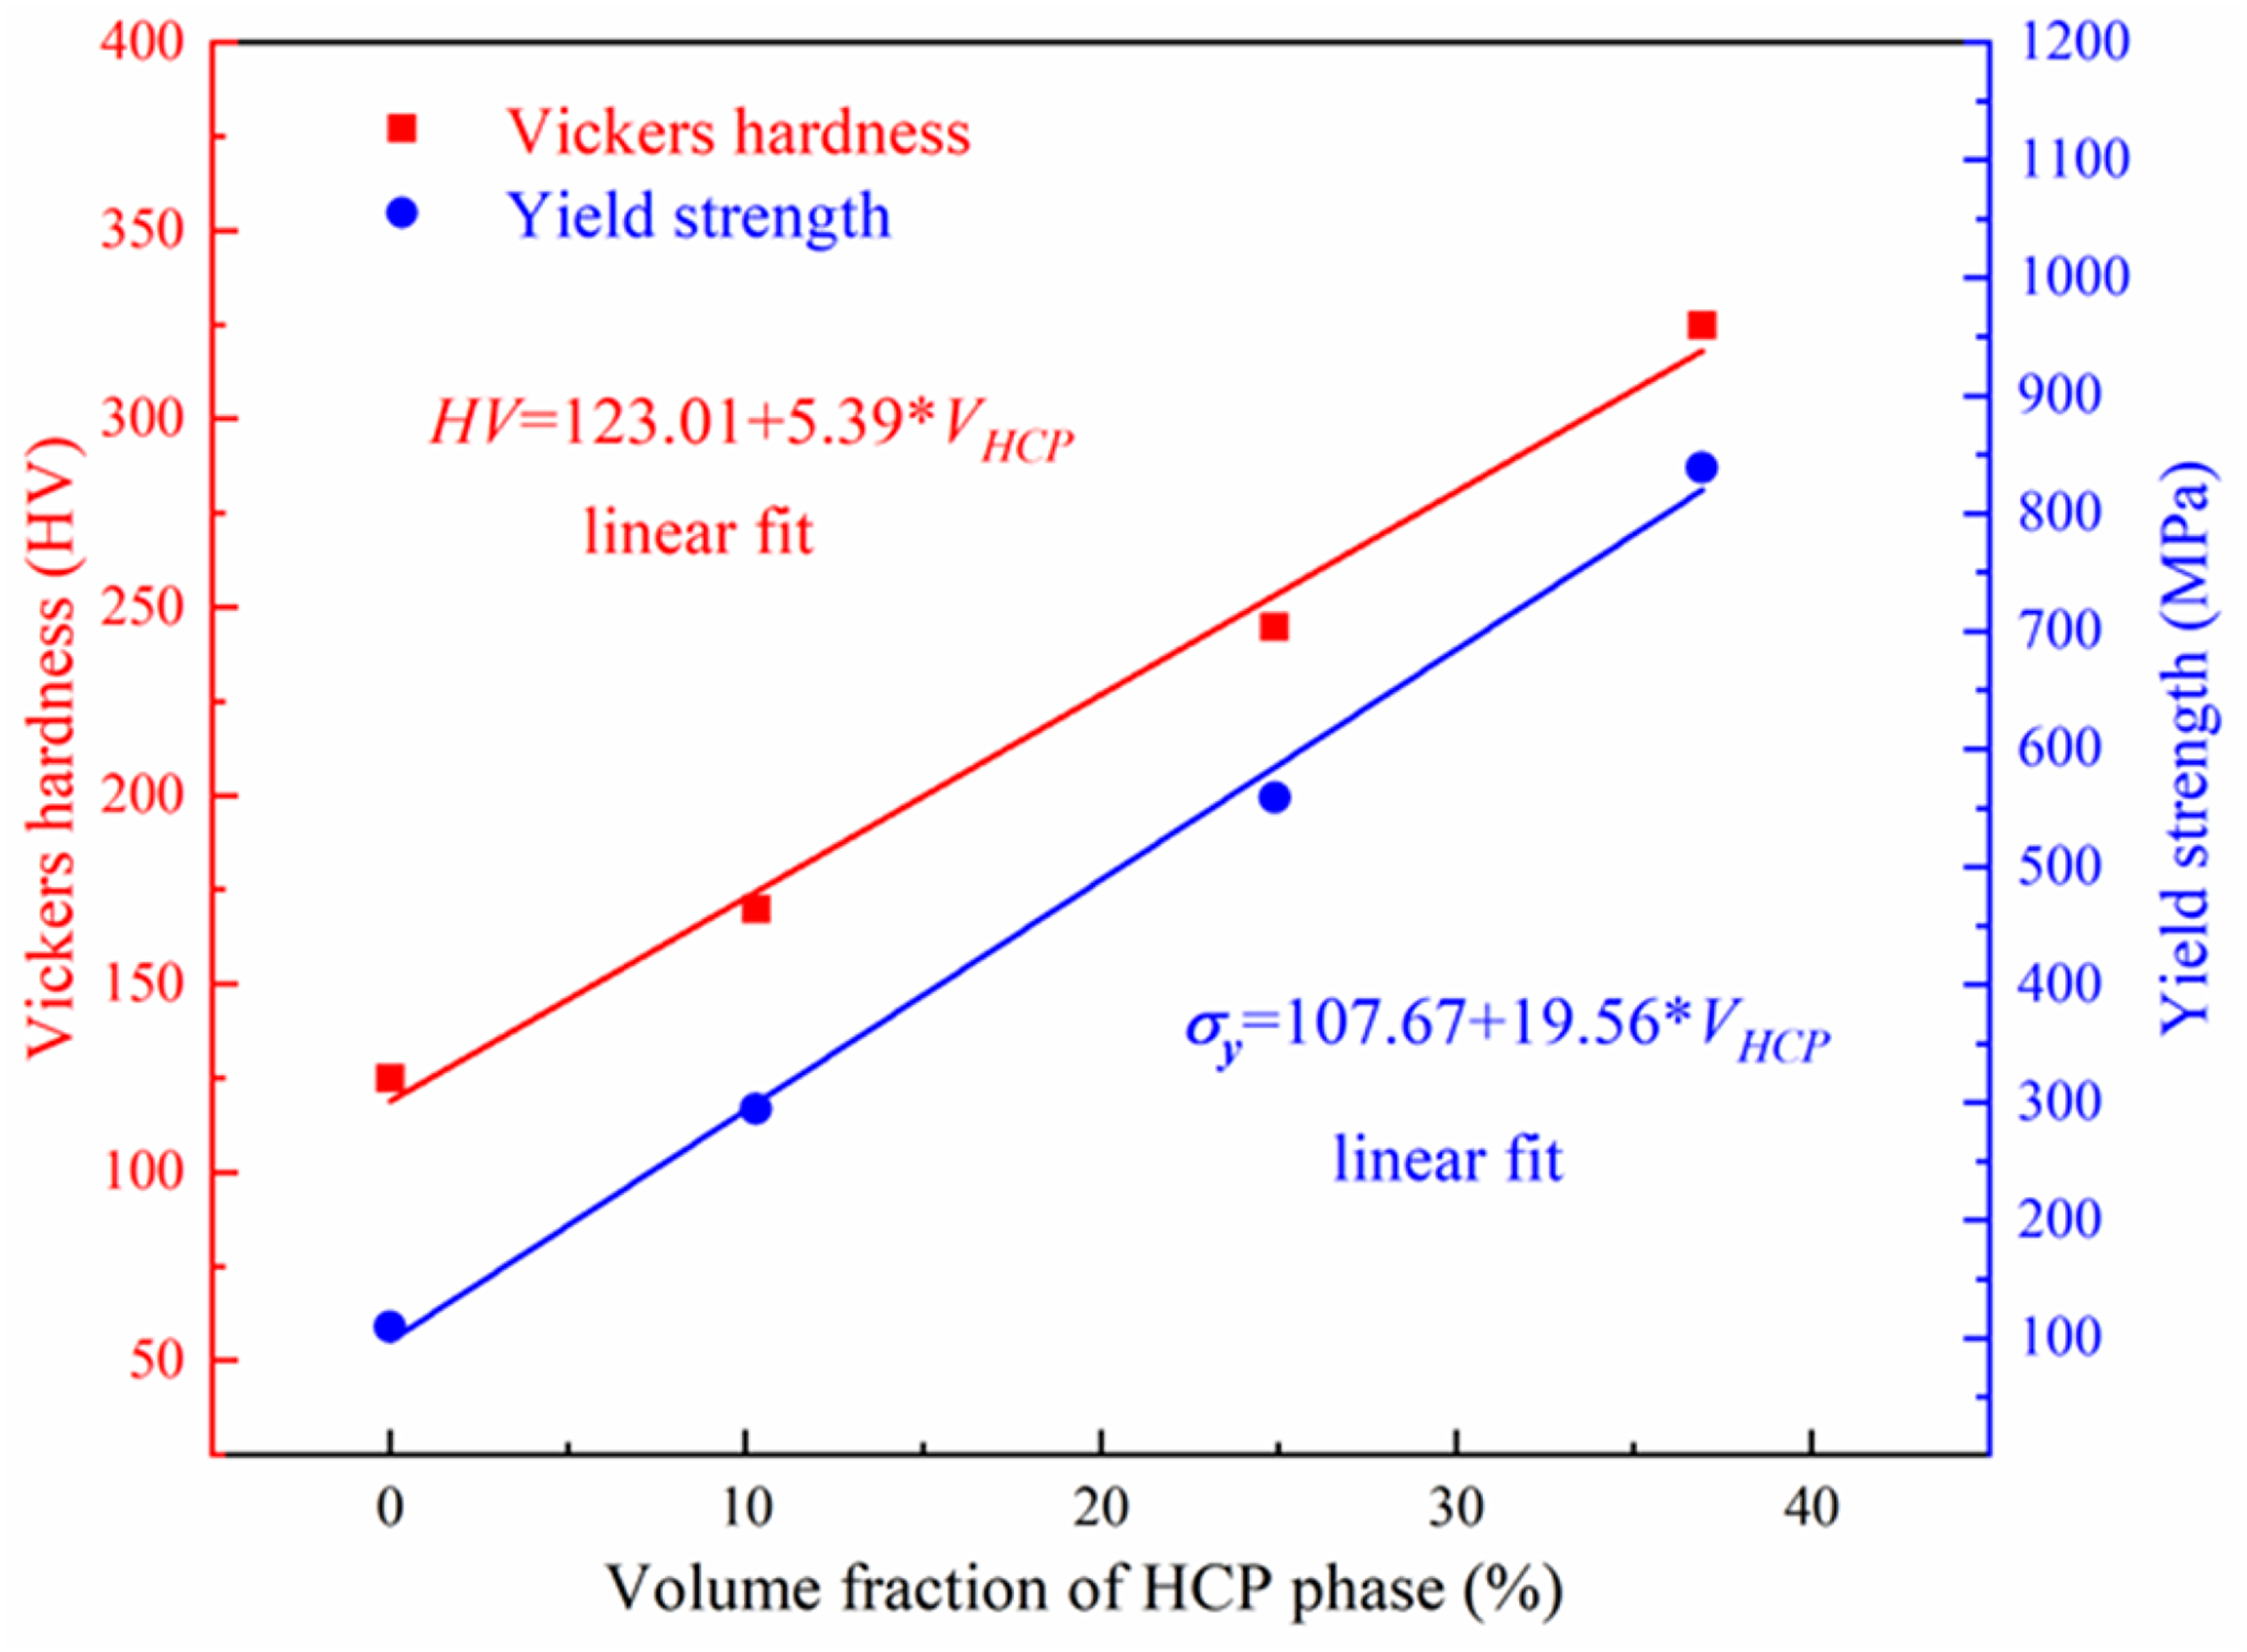
Linear fitting relationship between yield strength and hardness of samples La0, La0.05, La0.15, and La0.25 and HCP phase volume fraction.
Previous studies have shown that the HCP phase exhibited higher strength and hardness compared to the FCC phase.
53
The strength increment of the alloy can be expressed as:
In the equation, σFCC and σHCP represent the yield strengths of the FCC and HCP phases, respectively. VFCC and VHCP represent the volume fractions of the FCC and HCP phases, respectively. Considering that this alloy system contains only FCC and HCP phases, i.e., VFCC + VHCP = 1, Equation (6) can be rewritten as:
The variation relationship between the HCP phase volume fraction and σy expressed by Equation (7) matched well with the data in Figure 9, indicating that Equation (7) can effectively explained the yield strength increment of CrFeNi2La x MEAs.
Some research groups found that the strength of HEAs was closely related to solubility.54,55 In our alloy system, we considered the FCC matrix phase as the solid solution phase, while La atoms were regarded as solute elements. When the larger La atoms were dissolved into the FCC solid solution phase, lattice distortion occurred, leading to an increase in the hardness and strength of the alloy. In this study, the effect of the solubility of La on the hardness and strength of the alloy was calculated using the dislocation-solute elastic interaction model, and the calculation formula was as follows
29
:

Other research groups found that grain refinement could improve the strength of alloys.56,57 The SEM results revealed that the addition of La led to the refinement of the FCC grains in the samples La0.05, La0.15, and La0.25 (Figure 5). According to the classical Hall-Petch theory, the relationship between the yield stress increment (
In summary, we analyzed three strengthening mechanisms for enhancing the strength of CrFeNi2Lax MEAs, i.e. solid solution strengthening of the FCC matrix phase, grain refinement strengthening, and second−phase strengthening. Among these, second−phase strengthening was the primary strengthening mechanism, while solid solution strengthening and grain boundary strengthening contribute relatively little to the overall strength.
Conclusion
In this study, four novel CrFeNi2Lax (x = 0, 0.05, 0.15, 0.25) medium−entropy alloy ingots were prepared by vacuum arc melting. The effect of La on the microstructure and mechanical properties of the alloy was investigated. Our major results are as follows:
The addition of La had a significant impact on the phase composition of CrFeNi2 MEAs, transforming the structure from a single FCC phase to a dual−phase structure consisting of FCC and HCP phases. Meanwhile, the volume fraction of the HCP phase increased with the La content. The presence of the HCP phase effectively hindered grain boundary migration, resulting in a refinement in grain size, the refined grain size is approximately 245 µm. The hardness test results indicated that with the increase in La content, the hardness gradually increased. The increase in the volume fraction of the HCP phase may have contributed to a corresponding increase in hardness. Compression experiments showed that as the La content increased, both the yield strength and fracture strength were significantly enhanced. La0.15 has the best performance, with strength and plasticity of 1317MPa and 46%, respectively. However, the volume fraction of the brittle HCP phase in La0.25 continuously increased, leading to a reduction in both strength and plasticity. Three strengthening mechanisms, i.e. solid solution strengthening of the FCC matrix phase, grain refinement strengthening, and second−phase strengthening were applied for analyzed the increasing in strength for CrFeNi2Lax MEAs. Among these, second−phase strengthening played a primary role in contributing to the strength, while solid solution strengthening and grain boundary strengthening contributed relatively little to the strength.
Footnotes
Acknowledgements
This study was financially supported by Natural Science Foundation of Shandong Province (NO. ZR2020ME001, ZR2024ME238), the National Natural Science Foundation of China (No. 12272392), the Strategic Priority Research Program of the Chinese Academy of Sciences (No. XDB22040303), and the Youth Innovation Promotion Association of the Chinese Academy of Sciences (No. 2022020).
Author contribution(s)
Funding
The authors disclosed receipt of the following financial support for the research, authorship, and/or publication of this article: Natural Science Foundation of Shandong Province (grant number ZR2020ME001).
Declaration of conflicting interests
The author declared no potential conflicts of interest with respect to the research, authorship, and/or publication of this article.