
Abstract
This study compares the microstructure, mechanical properties, and corrosion behavior of CoCrFeNiMn high-entropy alloy (HEA) and 316L stainless steel fabricated by selective laser melting (SLM), with a specific focus on the influence of hot rolling post-treatment. The results showed that as SLM-fabricated HEA exhibited a higher microhardness (198.15 Hv) than the 316L, which was further increased to 228.53 Hv after hot rolling due to grain refinement and increasing dislocation density. However, electrochemical testing in 3.5 wt.% NaCl revealed that unrolled HEA had the poorest corrosion resistance, exhibiting severe pitting. Hot rolling improved the HEA's corrosion resistance by eliminating defects and refining its microstructure. In contrast, 316L stainless steel exhibits the optimal pitting corrosion resistance due to its high content of Cr and Mo elements and uniform structure.
Introduction
Additive Manufacturing (AM), especially the Selective Laser Melting (SLM) technology, has become a research hotspot in the field of advanced manufacturing due to its unique advantages in fabricating metal components with complex geometries.1–6 Among numerous printable materials, austenitic stainless steel 316L is one of the most widely studied and applied materials in SLM technology, owing to its excellent corrosion resistance and good weldability. 7 Corrosion issues have attracted widespread attention. 8 However, the inherent rapid melting and solidification process of SLM leads to a significantly different microstructure of 316L from that of traditionally forged materials. Although this may bring about a certain increase in strength, it is often accompanied by the deterioration of ductility, toughness, and corrosion resistance, which limits its application potential in load-bearing components used in harsh environments. 9 For instance, Sun et al. 10 investigated 316L fabricated by SLM. The results demonstrated that optimizing process parameters could increase the relative density to 99.99% and significantly enhance the forming rate, yet micro-pores and defects were difficult to eliminate completely. This directly affects the mechanical properties of the material. Kumar et al. 11 found that although 316L prepared via SLM had low porosity, its fatigue strength and ductility were notably inferior to those of cast 316L. Zhou et al. 12 studied the effect of heat treatment temperature on the corrosion resistance of SLM-fabricated 316L. The findings indicated that the molten pool boundaries of 316L without post-treatment contained a large number of agglomerated nano-inclusions, which resulted in reduced corrosion resistance. Therefore, exploring new types of SLM alloy materials with both excellent comprehensive mechanical properties and high corrosion resistance holds significant scientific and engineering importance.
In recent years, HEAs have attracted extensive attention because of their unique composition-design concept and the promising combination of high strength, high toughness, excellent wear and corrosion resistance.13–15 Among them, the CoCrFeNiMn alloy, a typical face-centered-cubic (FCC) HEAs, exhibits good SLM processability, remarkable work-hardening capacity and superior fracture toughness. Its as-SLM mechanical properties are usually better than those of SLM 316L stainless steel.16–18 This advantage makes SLM-produced CoCrFeNiMn HEAs highly attractive for structural applications that demand high load-bearing capability. However, the SLM process itself introduces a high density of dislocations, 19 residual stresses 20 and possible micro-pores and cracks, 21 all of which may pose potential threats to corrosion performance in aggressive service environments. To date, investigations of the corrosion behavior of SLM CoCrFeNiMn HEAs remain scarce, systematic comparisons with the well-established SLM 316L are still insufficient, and a deeper understanding of the underlying corrosion mechanisms is required.
To further enhance the comprehensive properties of SLM-fabricated CoCrFeNiMn HEAs, especially to address their potential shortcoming in corrosion resistance, the introduction of appropriate post-treatment processes is crucial. Thermomechanical processing (for example rolling) has been proven an effective approach to regulate the microstructure and properties of metallic materials.22–25 For example, Qiao et al. 26 subjected Al0.25CoCrFeNi HEAs to rolling treatment, the results showed that rolling could increase the yield strength from 126 MPa to 1000 MPa while maintaining a ductile fracture mode. Wang et al. 27 found that the rolling process slightly improved the electrochemical corrosion resistance of duplex cobalt-based alloys and significantly enhanced their hardness and strength-ductility balance. Naseri et al. 28 investigated the effect of rolling on the corrosion resistance of Fe35Mn27Ni28Co5Cr5 HEAs. The findings indicated that the corrosion resistance of the HEAs was improved because the increased rolling deformation led to higher uniformity, which optimized the surface conditions for oxide film formation; among the results, the corrosion current density (Icorr) was as low as 329 μA/cm2. For materials fabricated by SLM, rolling treatment is expected to not only retain the advantages of additive manufacturing in forming but also effectively improve the inhomogeneity of the as-deposited microstructure, thereby potentially synergistically enhancing both mechanical properties and corrosion resistance. However, research on the effect of rolling treatment on the corrosion resistance of SLM-fabricated CoCrFeNiMn HEAs is still in the exploratory stage.
In this study, a systematic comparative investigation was conducted on the microstructural characteristics, mechanical properties, and electrochemical corrosion behavior of 316L stainless steel fabricated by SLM, CoCrFeNiMn HEAs fabricated by SLM, and SLM-fabricated HEAs subjected to hot rolling. Scanning Electron Microscopy (SEM), Energy Dispersive Spectroscopy (EDS), and Electron Backscatter Diffraction (EBSD) techniques were employed to systematically analyze the microstructural features of different alloys. Corrosion characterization of the alloys was comprehensively performed using methods such as electrochemical corrosion, which collectively revealed the differences in corrosion resistance between SLM-fabricated 316L stainless steel and SLM-fabricated HEAs, as well as the mechanism by which hot rolling affects the corrosion performance.
Experimental procedure
Material preparation
The 3D printing equipment SLM-160 was used to fabricate 316L stainless steel and CoCrFeNiMn HEAs. As shown in Figure 1(a), the SLM fabrication process was carried out under an argon atmosphere. A bidirectional scanning strategy was adopted, wherein the scanning angle between adjacent tracks within the first layer was set to 180°, and the scanning direction was rotated by 180° between successive layers (Figure 1(b)). Figure 1(c) summarizes the process parameters of SLM, including laser power, layer thickness, scanning speed, and overlap ratio. Following the SLM process, the as-fabricated HEAs underwent hot rolling. An alloy block, initially 10 mm thickness, was preheated to 1200 °C in a resistance furnace in preparation for the hot rolling. The rolling was carried out with a reduction ratio of approximately 10% per pass, corresponding to a deformation of 0.5 mm per rolling pass, until final sheets with a thickness of 2 mm were obtained. For clarity, the following designations are used throughout: AM (the CoCrFeNiMn HEA fabricated by SLM), AMR (the additive manufactured CoCrFeNiMn HEA after hot rolling), and 316L (316L stainless steel fabricated by SLM), respectively.
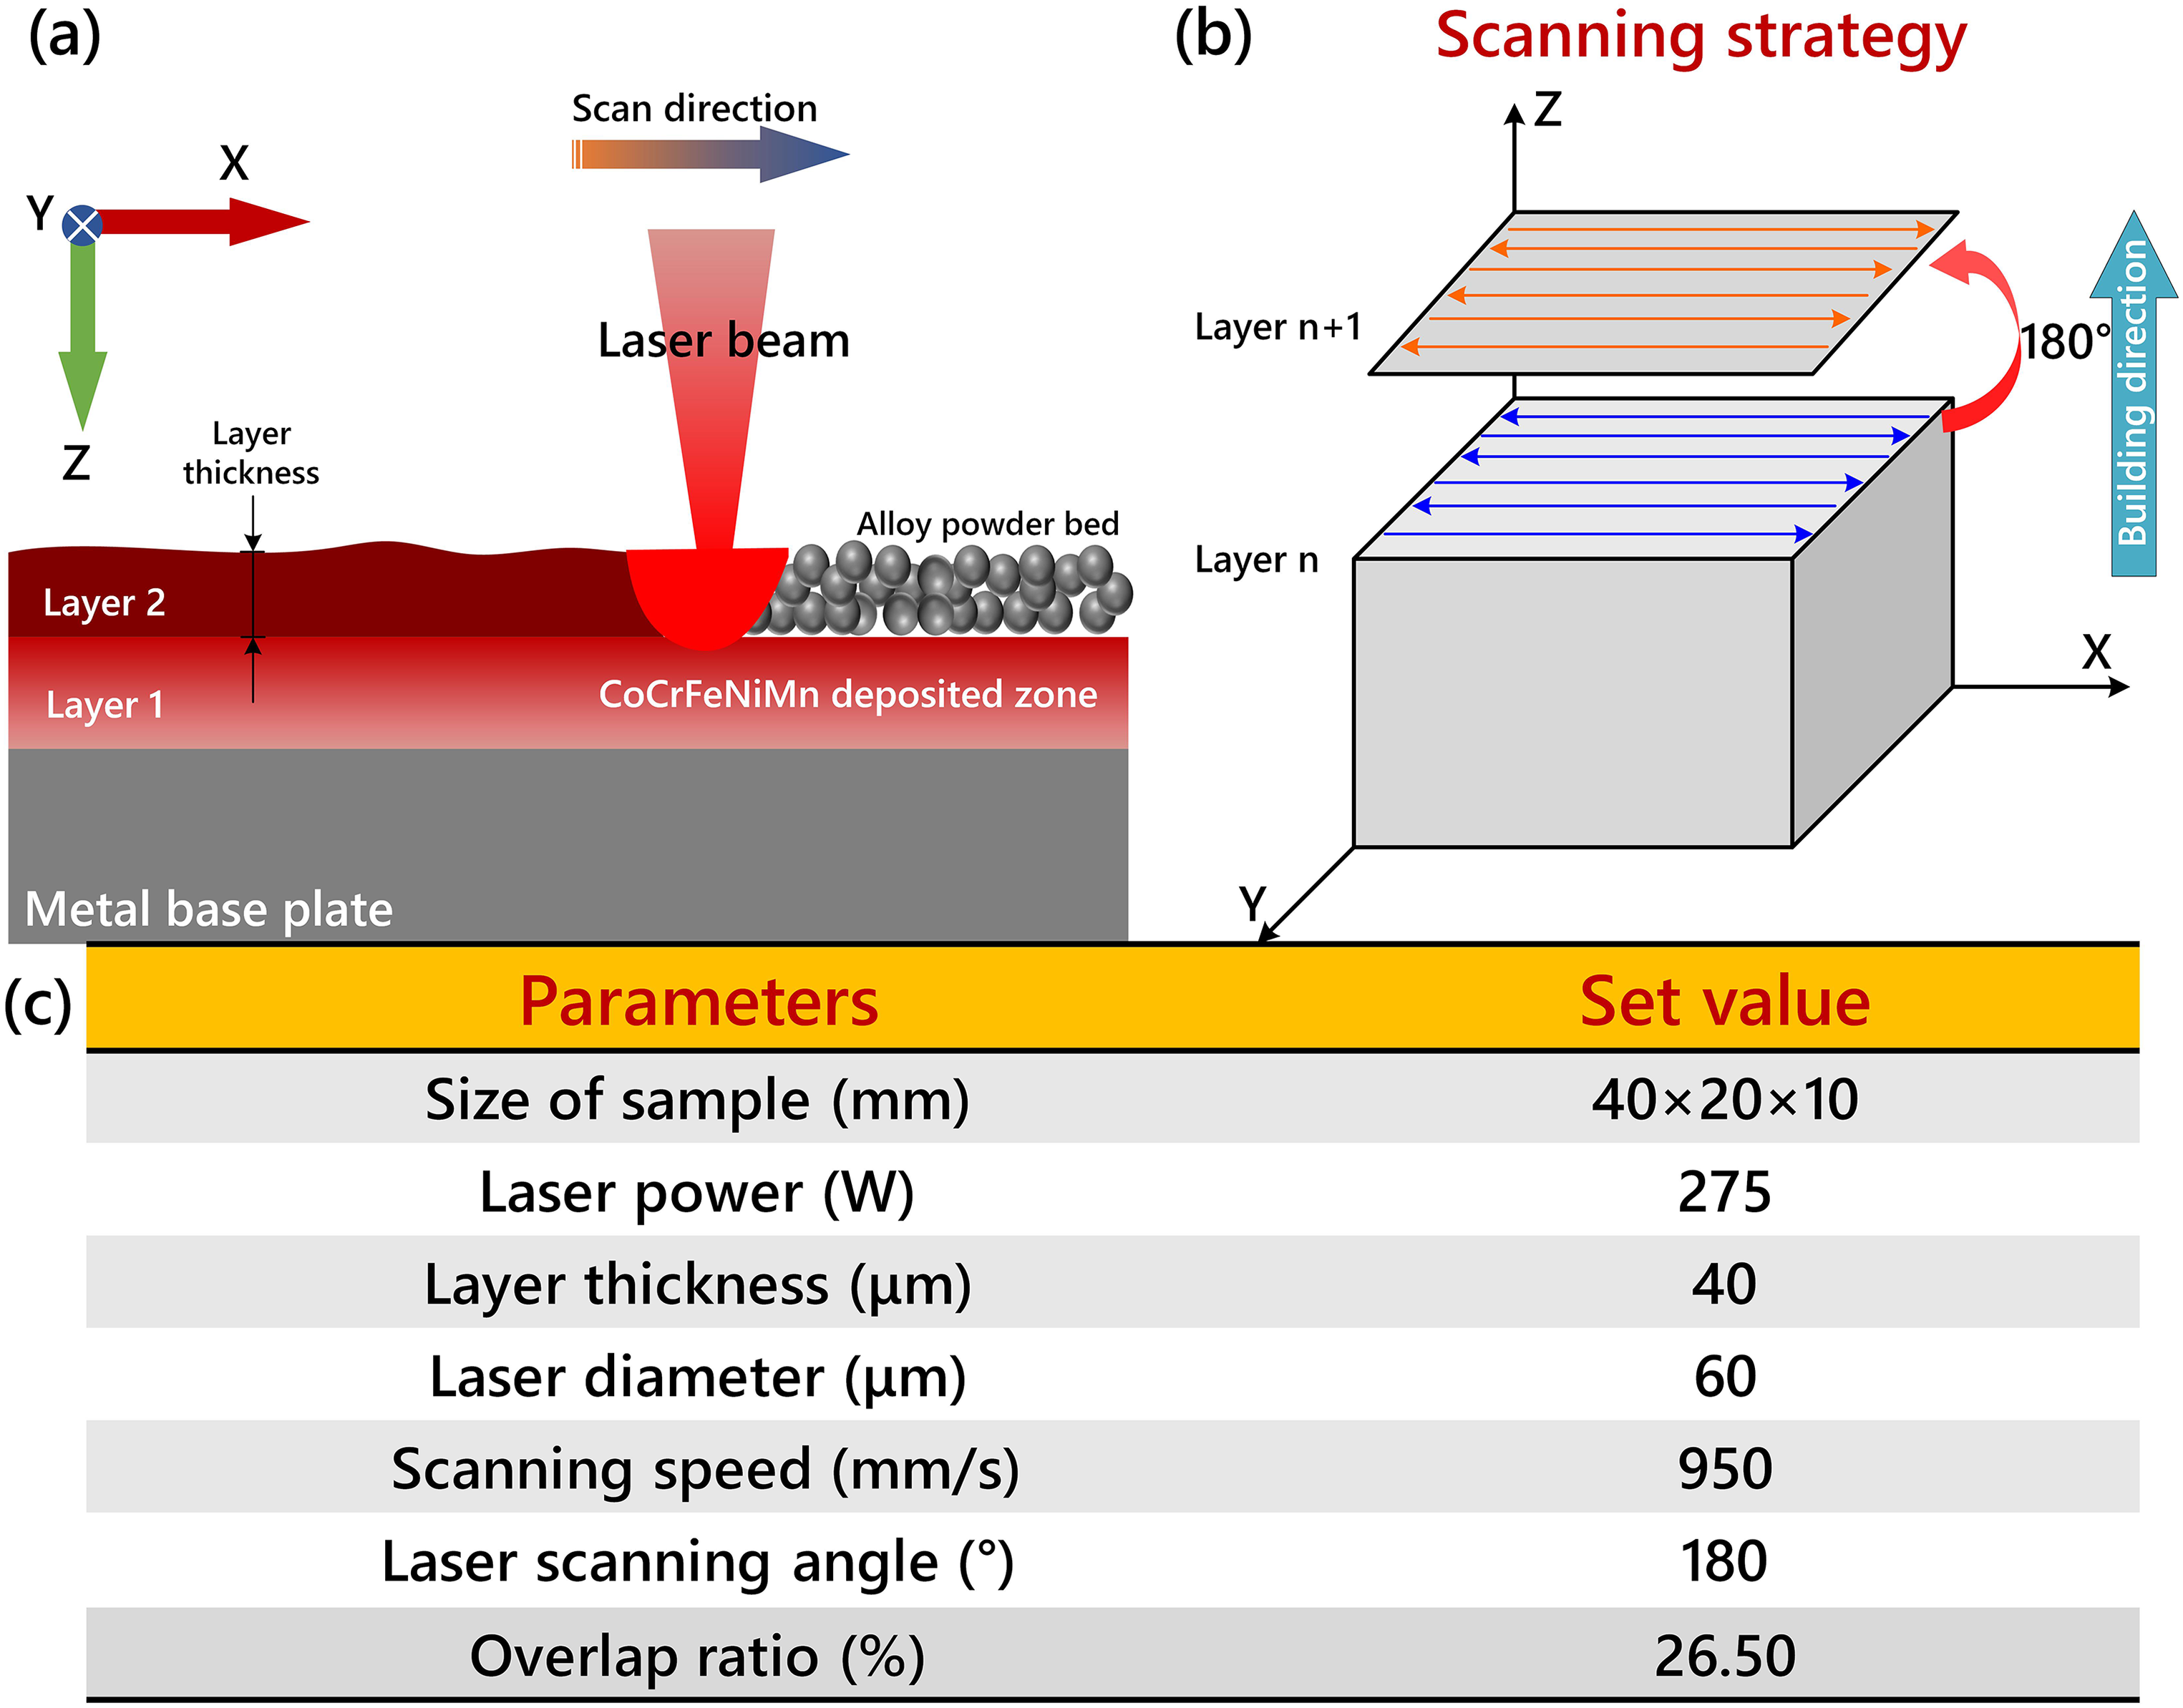
(A) SLM fabrication process, (b) scanning strategy, (c) SLM fabrication process parameters.
Microstructural characterization
The prepared samples were cut into 5 mm × 5 mm pieces using wire electrical discharge machining. Subsequently, these pieces were mounted in epoxy resin and subjected to sequential grinding and polishing. The resulting samples were electrochemically etched in a 10% oxalic acid solution at an applied potential of 6 Vref for 50 s to reveal the microstructure. The surface morphology of the alloys was examined using scanning electron microscopy (SEM). Elemental distribution and homogeneity were assessed via energy dispersive spectroscopy (EDS), employing both line and area scanning modes. X-ray diffraction (XRD) was utilized to examine the phase composition of the alloys, and EBSD was applied to characterize the grain size and grain orientation information.
Corrosion characterization
Electrochemical tests were conducted on the prepared samples using a standard three-electrode system, consisting of the working electrode (the alloy samples), a counter electrode (platinum sheet), and a reference electrode (Ag/AgCl). Prior to performing the potentiodynamic polarization test, the sample was immersed in a 3.5 wt.% NaCl solution for 2400 s to achieve a stable open-circuit potential (OCP). The polarization scan was conducted at a rate of 0.5 mV/s over a potential range from −0.5 VOCP to 1.5 Vref. After the electrochemical tests, the corroded surfaces were examined using SEM to assess the morphology of corrosion damage. The corrosion depth profiles were further quantified using a 3D laser confocal microscope. Electrochemical impedance spectroscopy (EIS) was measured in the frequency range from 10 kHz to 0.01 Hz with an AC amplitude of 10 mV. The EIS data were fitted to an equivalent circuit using ZSimpWin software. To evaluate pitting corrosion resistance, electrochemical noise (EN) was monitored over 24 h period with a data acquisition interval of 1 s. All electrochemical tests were repeated three times to eliminate data randomness.
Results and discussion
Microstructure analysis
Figure 2 presents the microstructural characterization results of the different samples. Figure 2a1-a2 show the surface morphology of the AM sample. Small pore-like defects are visible on the surface. Figure 2b1-b2 illustrate the surface morphology of the AMR sample. After hot rolling, the microstructure was significantly refined with no observed defects such as pores or cracks, indicating the effective elimination of microdefects by the rolling process. Figure 2c1 shows the microstructure of the 316L sample, where characteristic molten pool boundaries were evident. As shown in Figure 2c2, the microstructure of 316L exhibits obvious lamellar or banded characteristics. Elemental mapping was performed on the regions shown in Figure 2a2 and 2b2, with results presented in Figure 2c1 and 2c2. The maps indicate a homogeneous distribution of all elements without detectable segregation. Additionally, EDS line scanning results of the 316L sample (Figure 2c3) indicate uniform element distribution across different regions. These results demonstrate that the laser additively manufactured alloys exhibit uniform elemental distribution. Figure 3 displays the XRD patterns of the different samples. All samples exhibit diffraction peaks corresponding to a face-centered cubic (FCC) phase, confirming a single-phase FCC structure in each material.

SEM surface morphology: (a1-a2) AM, (b1-b2) AMR, (c1-c2) 316L, (a3) EDS surface scan results for AM, (b3) EDS surface scan results for AMR, (c3) EDS line scan results for 316L.
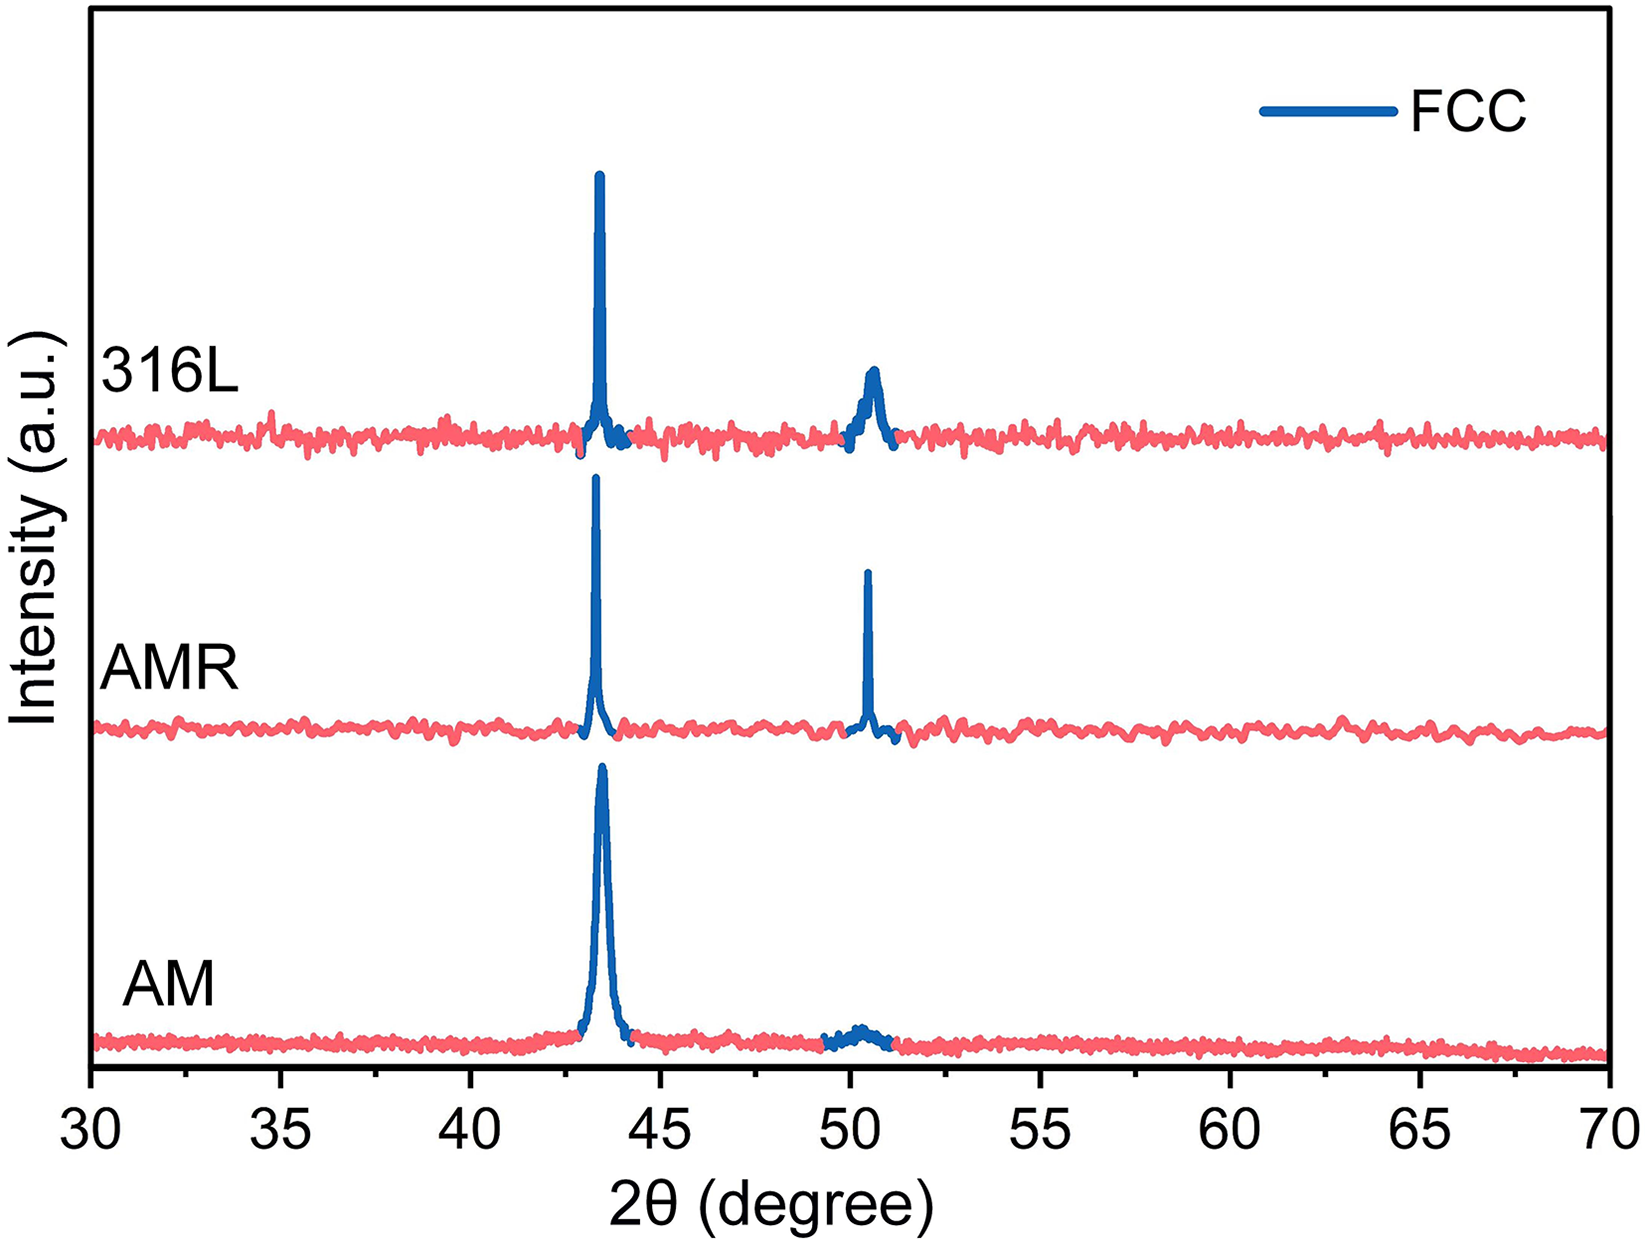
XRD patterns of different samples.
Figure 4 shows the grain structure and orientation distribution of different samples. As shown in Figure 4a1, the AM sample exhibits a microstructure dominated by prominent columnar grain. After hot rolling, these grains undergo significant refinement (Figure 4b1). The 316L sample displays a distinct fish-scale-like pattern aligned (Figure 4c1). Figure 4a2-c2 shows the band contrast (BC) maps of the samples. As shown in Figure 4a2, the AM sample surface has a small number of crack defects. After rolling, no defects are detected, and the grain boundary density is significantly increased (Figure 4b2). High grain boundary density can be observed in Figure 4c2 for the 316L sample. Figure 4a3-c3 show the phase distribution of the different samples. All samples consist of a single FCC phase structure, which is consistent with the XRD results presented in Figure 3. Figure 4a4-c4 present the grain size distributions for all samples. The average grain size of the AM sample is approximately 52.47 μm. After hot rolling, the grain size is significantly reduced to 25.19 μm. The average grain size of the 316L sample is approximately 52.17 μm, which is comparable to that of the initial AM sample.

EBSD microstructural characterization results: (a1-c1) inverse pole figure (IPF) of AM, AMR, 316L, (a2-c2) BC map for AM, AMR, and 316L, (a3-c3) phase distribution of AM, AMR, 316L, (a4-c4) grain size distribution of AM, AMR, 316L.
Microhardness analysis
Figure 5 presents the microhardness test results of all samples. The data show a narrow fluctuation range in hardness values for each sample, indicating good overall hardness uniformity. Specifically, the average microhardness of the 316L stainless steel is 184.22 Hv. In contrast, the AM sample exhibits a slightly higher average microhardness of 198.15 Hv. This difference may be attributed to lattice distortion caused by the multi-principal element alloy composition, which contributes to a strengthening effect. After rolling treatment, the microhardness of the AM sample further increases to 228.53 Hv. This significant improvement can be ascribed to microstructural refinement induced by the rolling process. To investigate the hardness evolution mechanism across the different materials, EBSD characterization was performed on all samples at the same magnification.
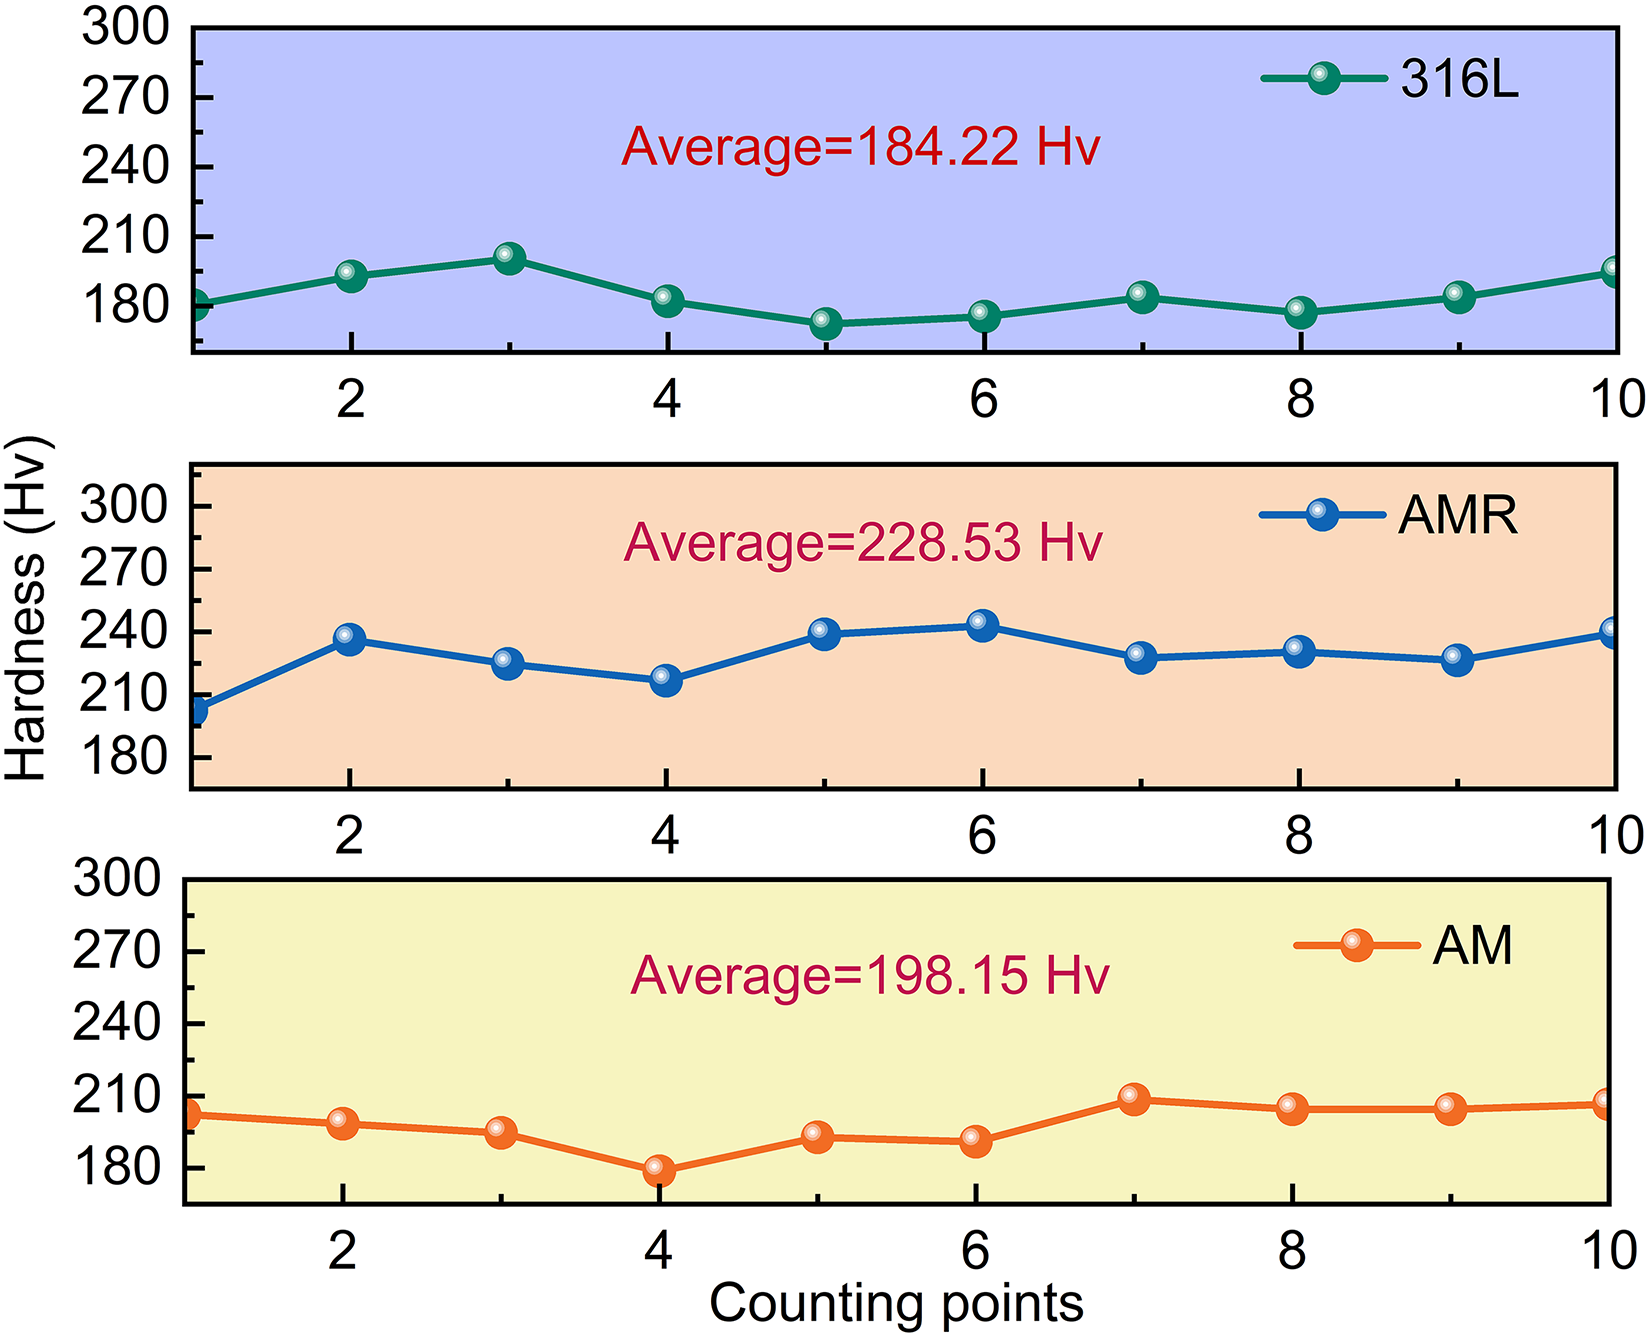
Microhardness of different samples.
Figure 6 shows the EBSD imaging results for the different materials under the same magnification. It can be observed from Figure 6a1-c1 that no obvious defects such as cracks or pores are found, indicating the high reliability of the SLM fabrication process. The local strain distribution was further analyzed using kernel average misorientation (KAM) maps (Figure 6a2-c2). The KAM value serves as an indicator of local strain. The AM sample shows clear strain concentration at the grain boundaries (Figure 6a2), while the rolled AMR sample displays extensive micro-strain, evidenced by a large green aggregation area (Figure 6b2). This is attributed to dislocation activation during rolling, which consequently leads to higher dislocation density and increased hardness.29–33 In contrast, the 316L sample exhibited the lowest KAM values, and limited and inhomogeneous strain at the grain boundaries. The KAM distribution density of the three samples is consistent with the hardness test results (Figure 5).

EBSD characterization of different samples: (a1-c1) IPF maps for AM, AMR and 316L, (a2-c2) KAM maps for AM, AMR and 316L.
Corrosion behavior
Electrochemical corrosion
Figure 7(a) presents the OCP curves of the different samples immersed in a 3.5 wt.% NaCl solution. As shown in Figure 7(a), the 316L sample exhibits the highest OCP value after stabilization, followed by the AMR sample, while the AM sample shows the lowest OCP value. A higher OCP value generally corresponds to a lower corrosion tendency. In addition, the OCP curve of the AM sample shows significant fluctuation, while those of the AMR and 316L samples are relatively stable. This disparity suggests that a higher susceptibility of the AM sample to localized corrosion. Figure 7(b) displays the potentiodynamic polarization curves of the different samples in a 3.5 wt.% NaCl solution. It can be seen that the corrosion potential (Ecorr) of the AM sample is more negative than that of the other two samples, while the Ecorr values of the AMR and 316L samples are relatively close. This indicates that the AM sample has the worst corrosion resistance.34–36 Figure 7(c) shows the corrosion current density (Icorr) values derived from Figure 7(b). As illustrated, the AM sample has the highest Icorr. After rolling treatment, the Icorr of the AMR sample decreases, and the 316L sample exhibits the lowest Icorr. A lower Icorr value is associated with better corrosion resistance.
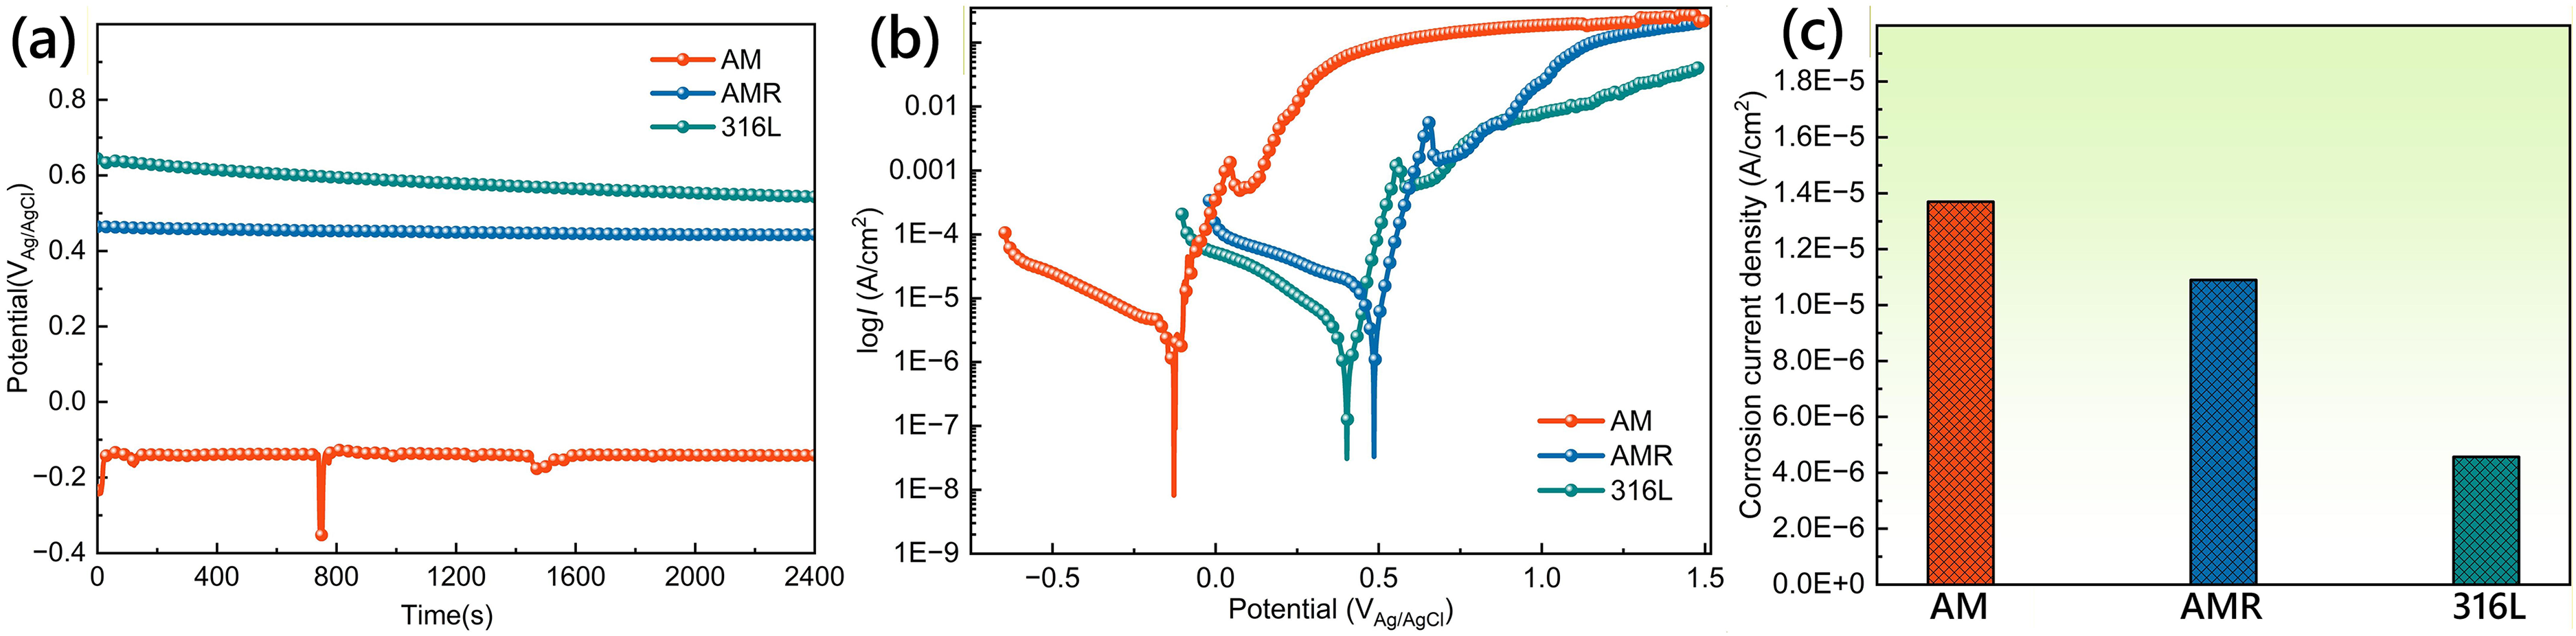
(A) OCP of different samples in a 3.5 wt.% NaCl solution, (b) Potentiodynamic polarization test of different samples in a 3.5 wt.% NaCl solution, (c) Corrosion current density of different samples.
Figure 8 shows the surface corrosion morphologies of the samples after polarization testing. Figure 8a1-a2 present the corroded surface of the AM sample at different magnifications. Large and interconnected corrosion pits are observed, some of which have undergone structural collapse. In contrast, the pits on the AMR sample are relatively small. The high-magnification image in Figure 8b2 reveals that these pits are both finer and shallower. Figure 8c1-c2 display the surface corrosion morphology of the additively manufactured 316L sample. Its surface remains relatively smooth and intact, exhibiting only a few isolated and shallow pits.
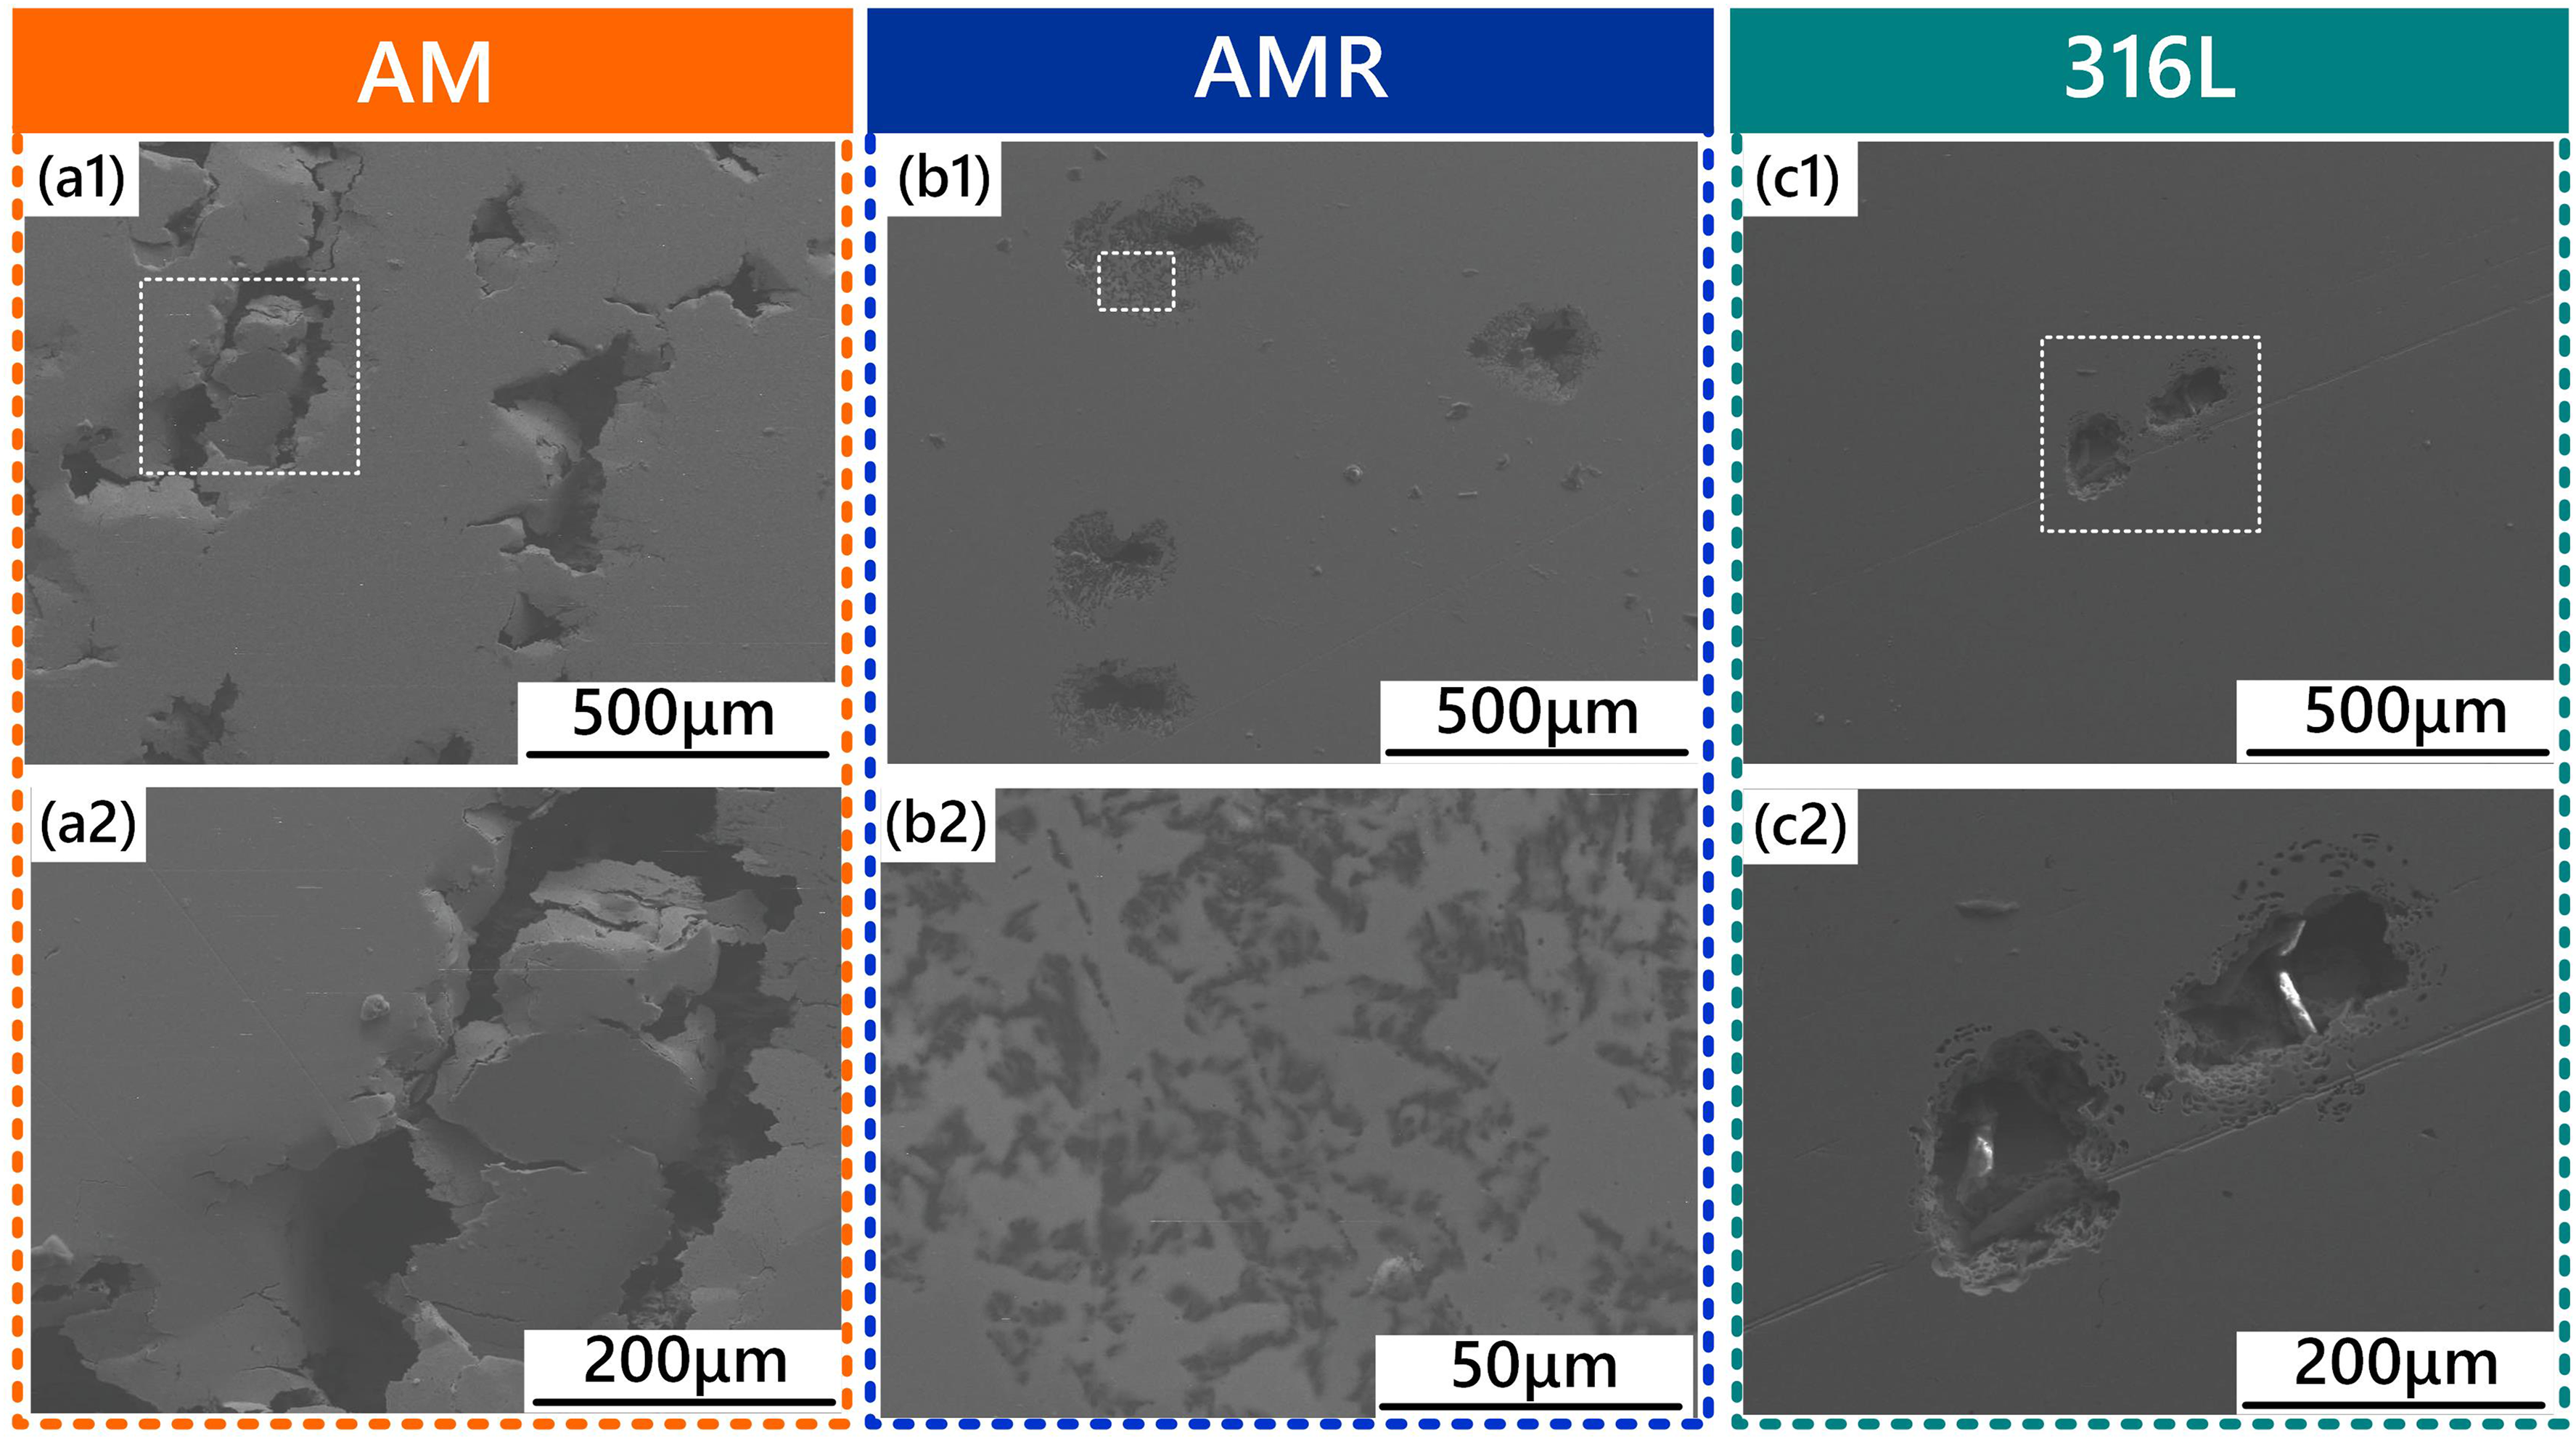
SEM morphology of different samples after Potentiodynamic polarization in a 3.5 wt.% NaCl solution: (a1-a2) AM, (b1-b2) AMR, (c1-c2) AM 316L.
Figure 9 shows the 3D scanning confocal microscopy images of the samples after polarization testing in 3.5 wt. % NaCl solution. As observed in Figure 9a1-a3, the AM sample exhibits extensive pitting corrosion, characterized by large and deeply penetrating pits. The corresponding 2D surface images reveal a high density of pits over a broad area. The cross-sectional depth results indicate severe localized attack, with a maximum pit depth of 63.78 μm. As shown in Figure 9b1-b3, AMR displays markedly improved corrosion morphology, characterized by notably smaller and shallower pits with the other samples. The maximum pit depth is reduced to approximately 20.69 μm. The additively manufactured 316L stainless steel (Figure 9c1-c3) demonstrates the best corrosion performance among the samples, maintaining a relatively flat surface topography with only minimal pitting. The maximum recorded pit depth is 14.68 μm. These results clearly indicates that the additively manufactured 316L stainless steel has superior corrosion resistance. Furthermore, the rolled HEAs exhibit better corrosion resistance than the unrolled HEAs.
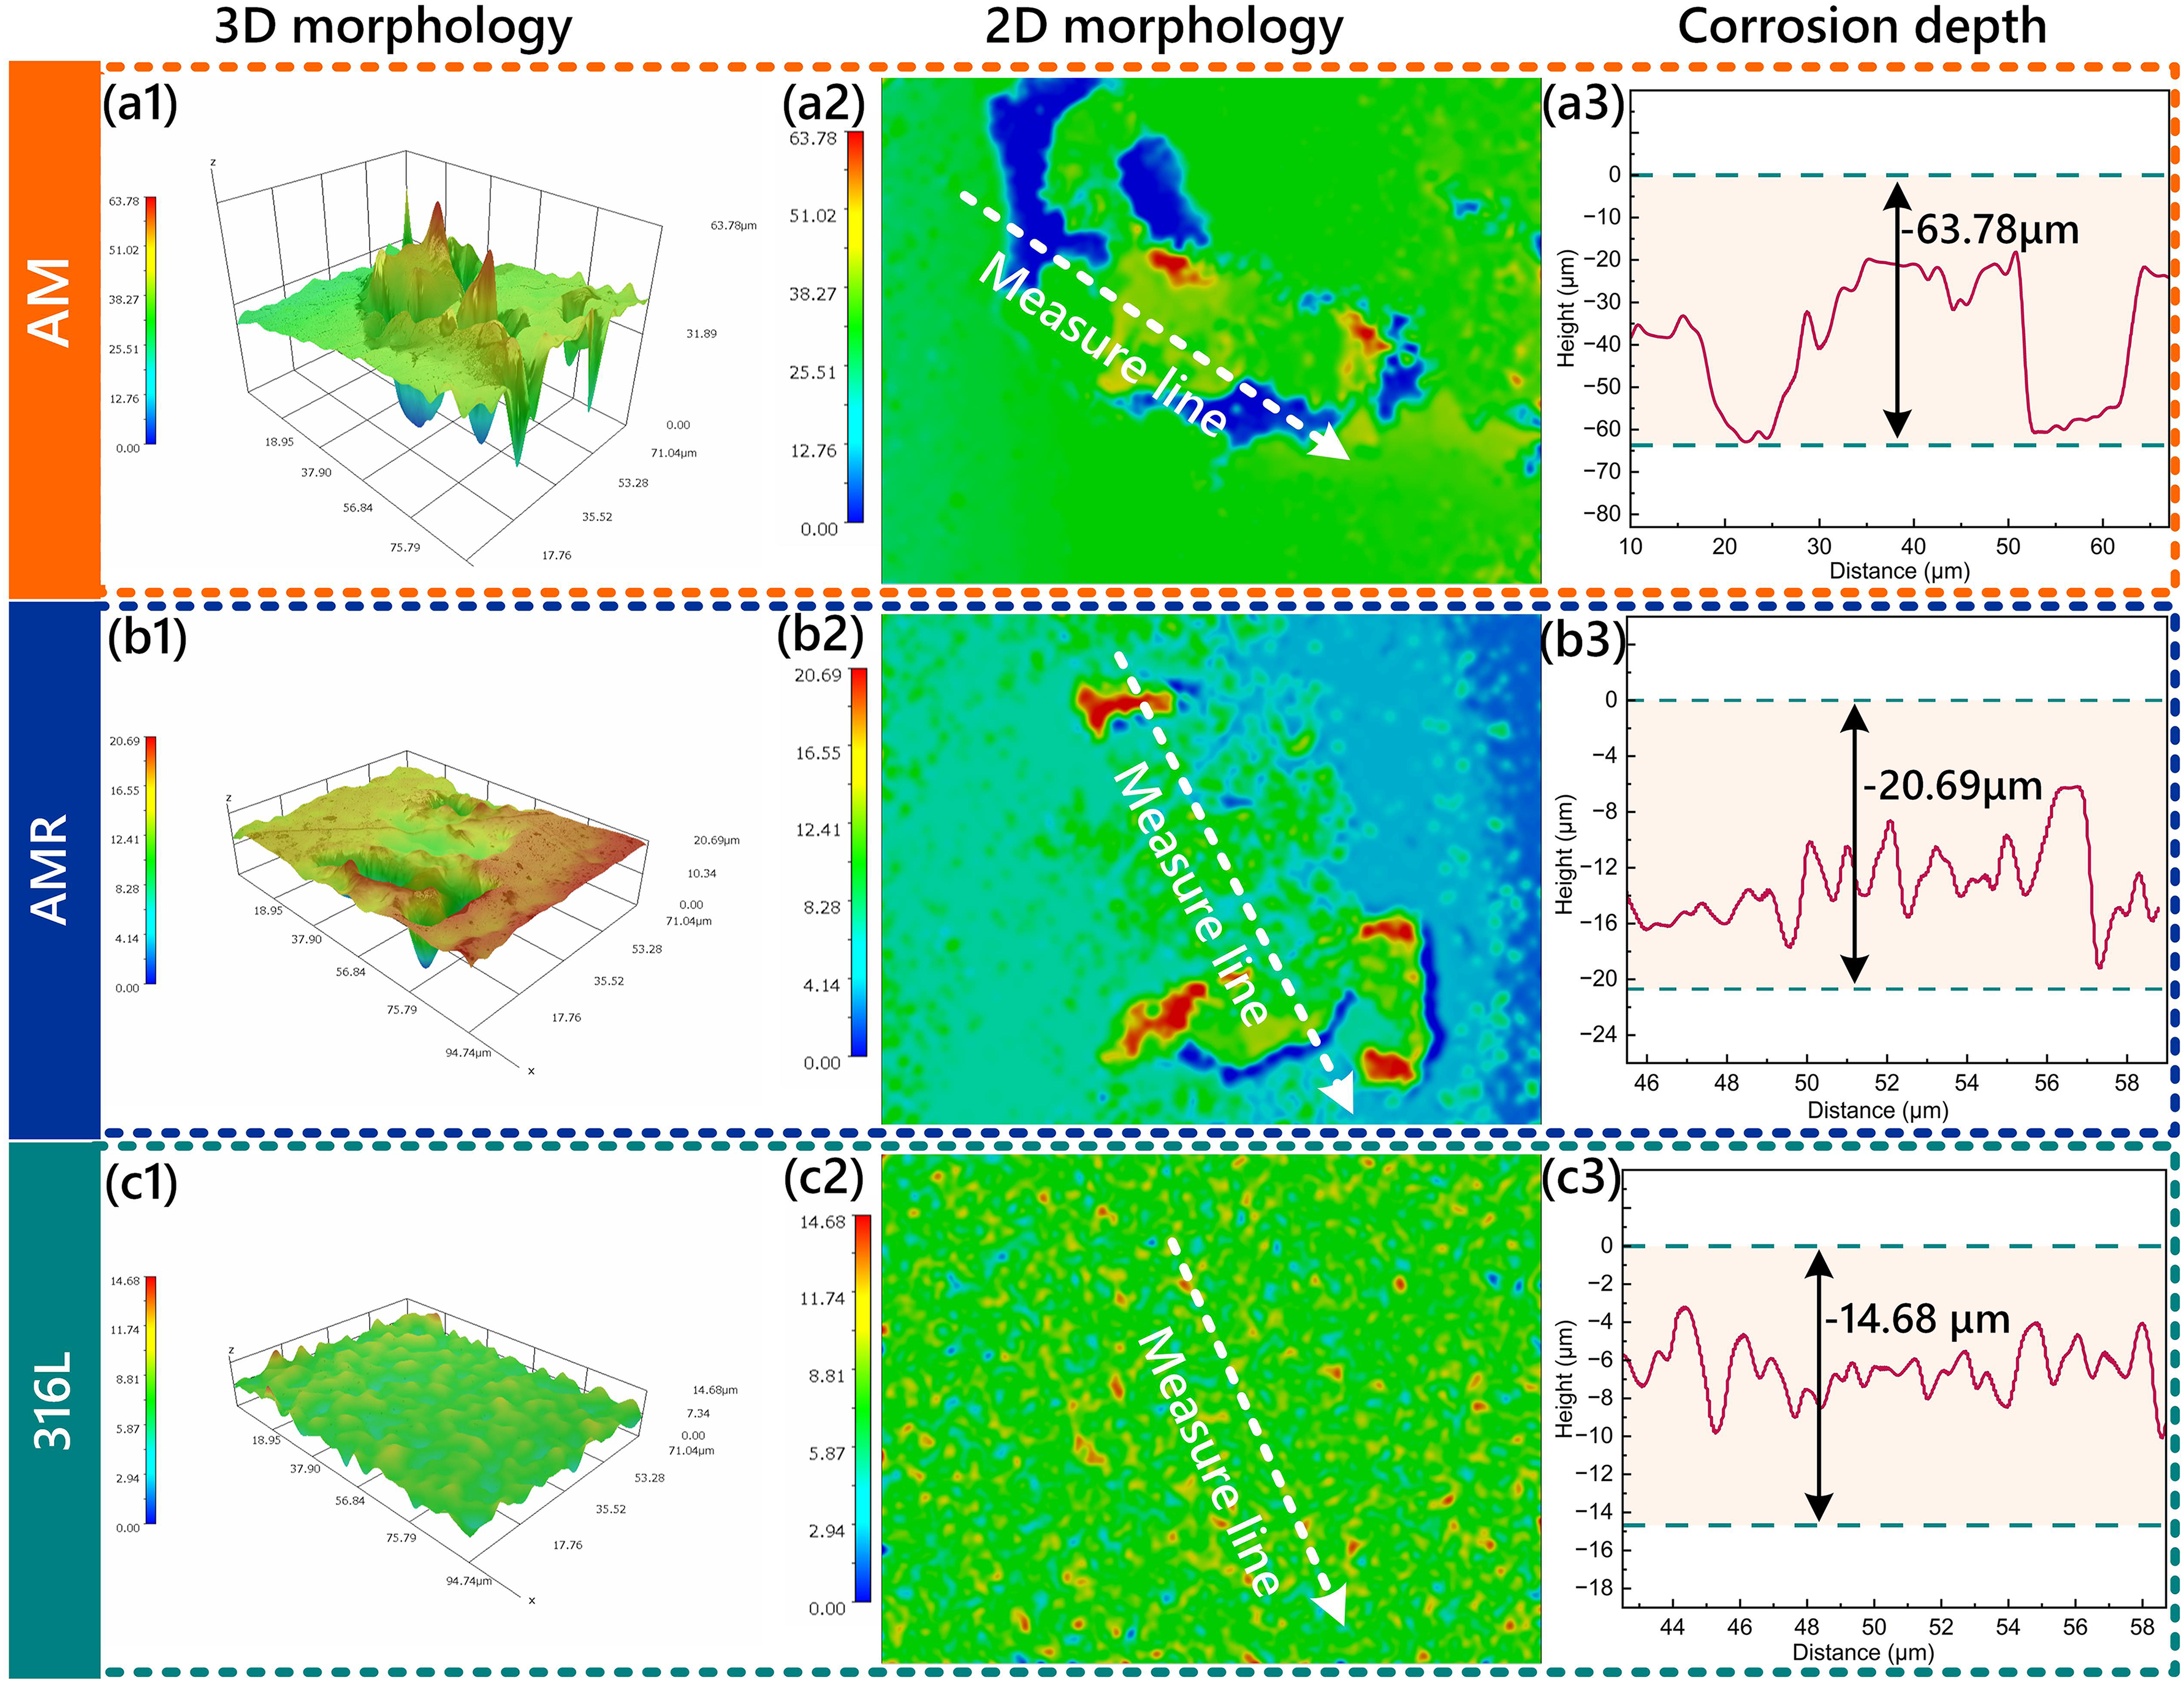
3D scanning confocal microscopy characterization results of different samples after potentiodynamic polarization in a 3.5 wt.% NaCl solution: (a1-a2) AM, (b1-b2) AMR, (c1-c2) 316L.
EIS analysis
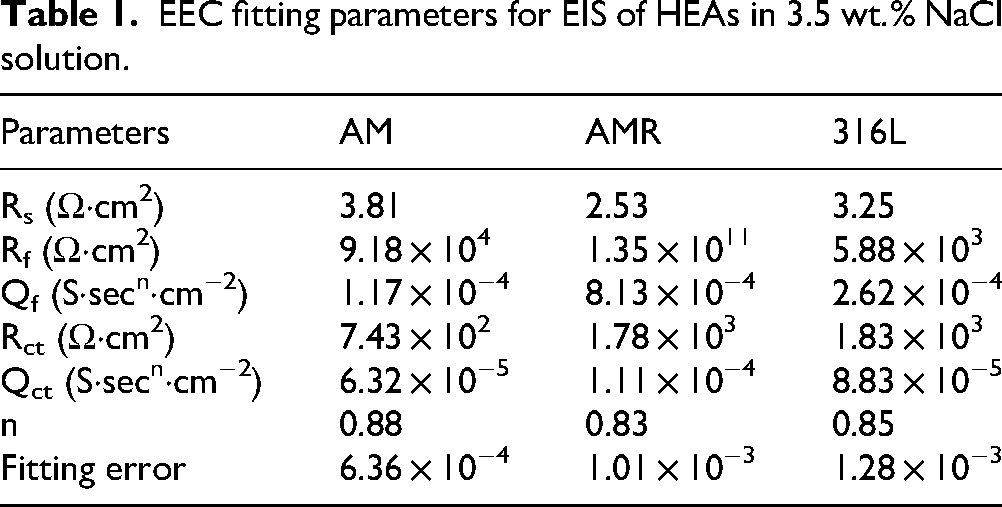
Figure 10 presents the EIS results of different samples in a 3.5 wt.% NaCl solution. Figure 10(a) shows the Nyquist plots for each sample. As illustrated, the additively manufactured 316L stainless steel exhibits a significantly larger capacitive arc radius compared to the other two alloys, while rolled HEA shows a larger radius than the unrolled HEA. A larger capacitive arc radius corresponds to better corrosion resistance.37–39 Figure 10(b) and (c) are the Bode plots of the samples. The impedance modulus values in low-frequency region increases in the order: AM<AMR<316L, indicating that the 316L sample has the highest corrosion resistance, while AM exhibits the lowest. The presence of a single peak in the phase angle plot (Figure 10(c)) suggests a single time constant behavior for all samples. Figure 10(d) shows the equivalent circuit model used to fit the EIS data, where Rs represents the solution resistance, Qf the film capacitance, Rf the passive film resistance, Qct the double-layer capacitance, and Rct the charge transfer resistance. As the passive film is unstable in a NaCl environment, the Rct value determines the alloy's corrosion resistance. The resulting electrochemical parameters are summarized in Table 1. The Rct values, increasing in the order of AM< AMR<316L, indicate that the electron transfer across the electrode-electrolyte interface becomes progressively more hindered. This increased impedance to charge transfer effectively slows down the corrosion reaction, confirming that the AM sample has the worst corrosion resistance, while the 316L sample has the best corrosion performance among the tested materials.
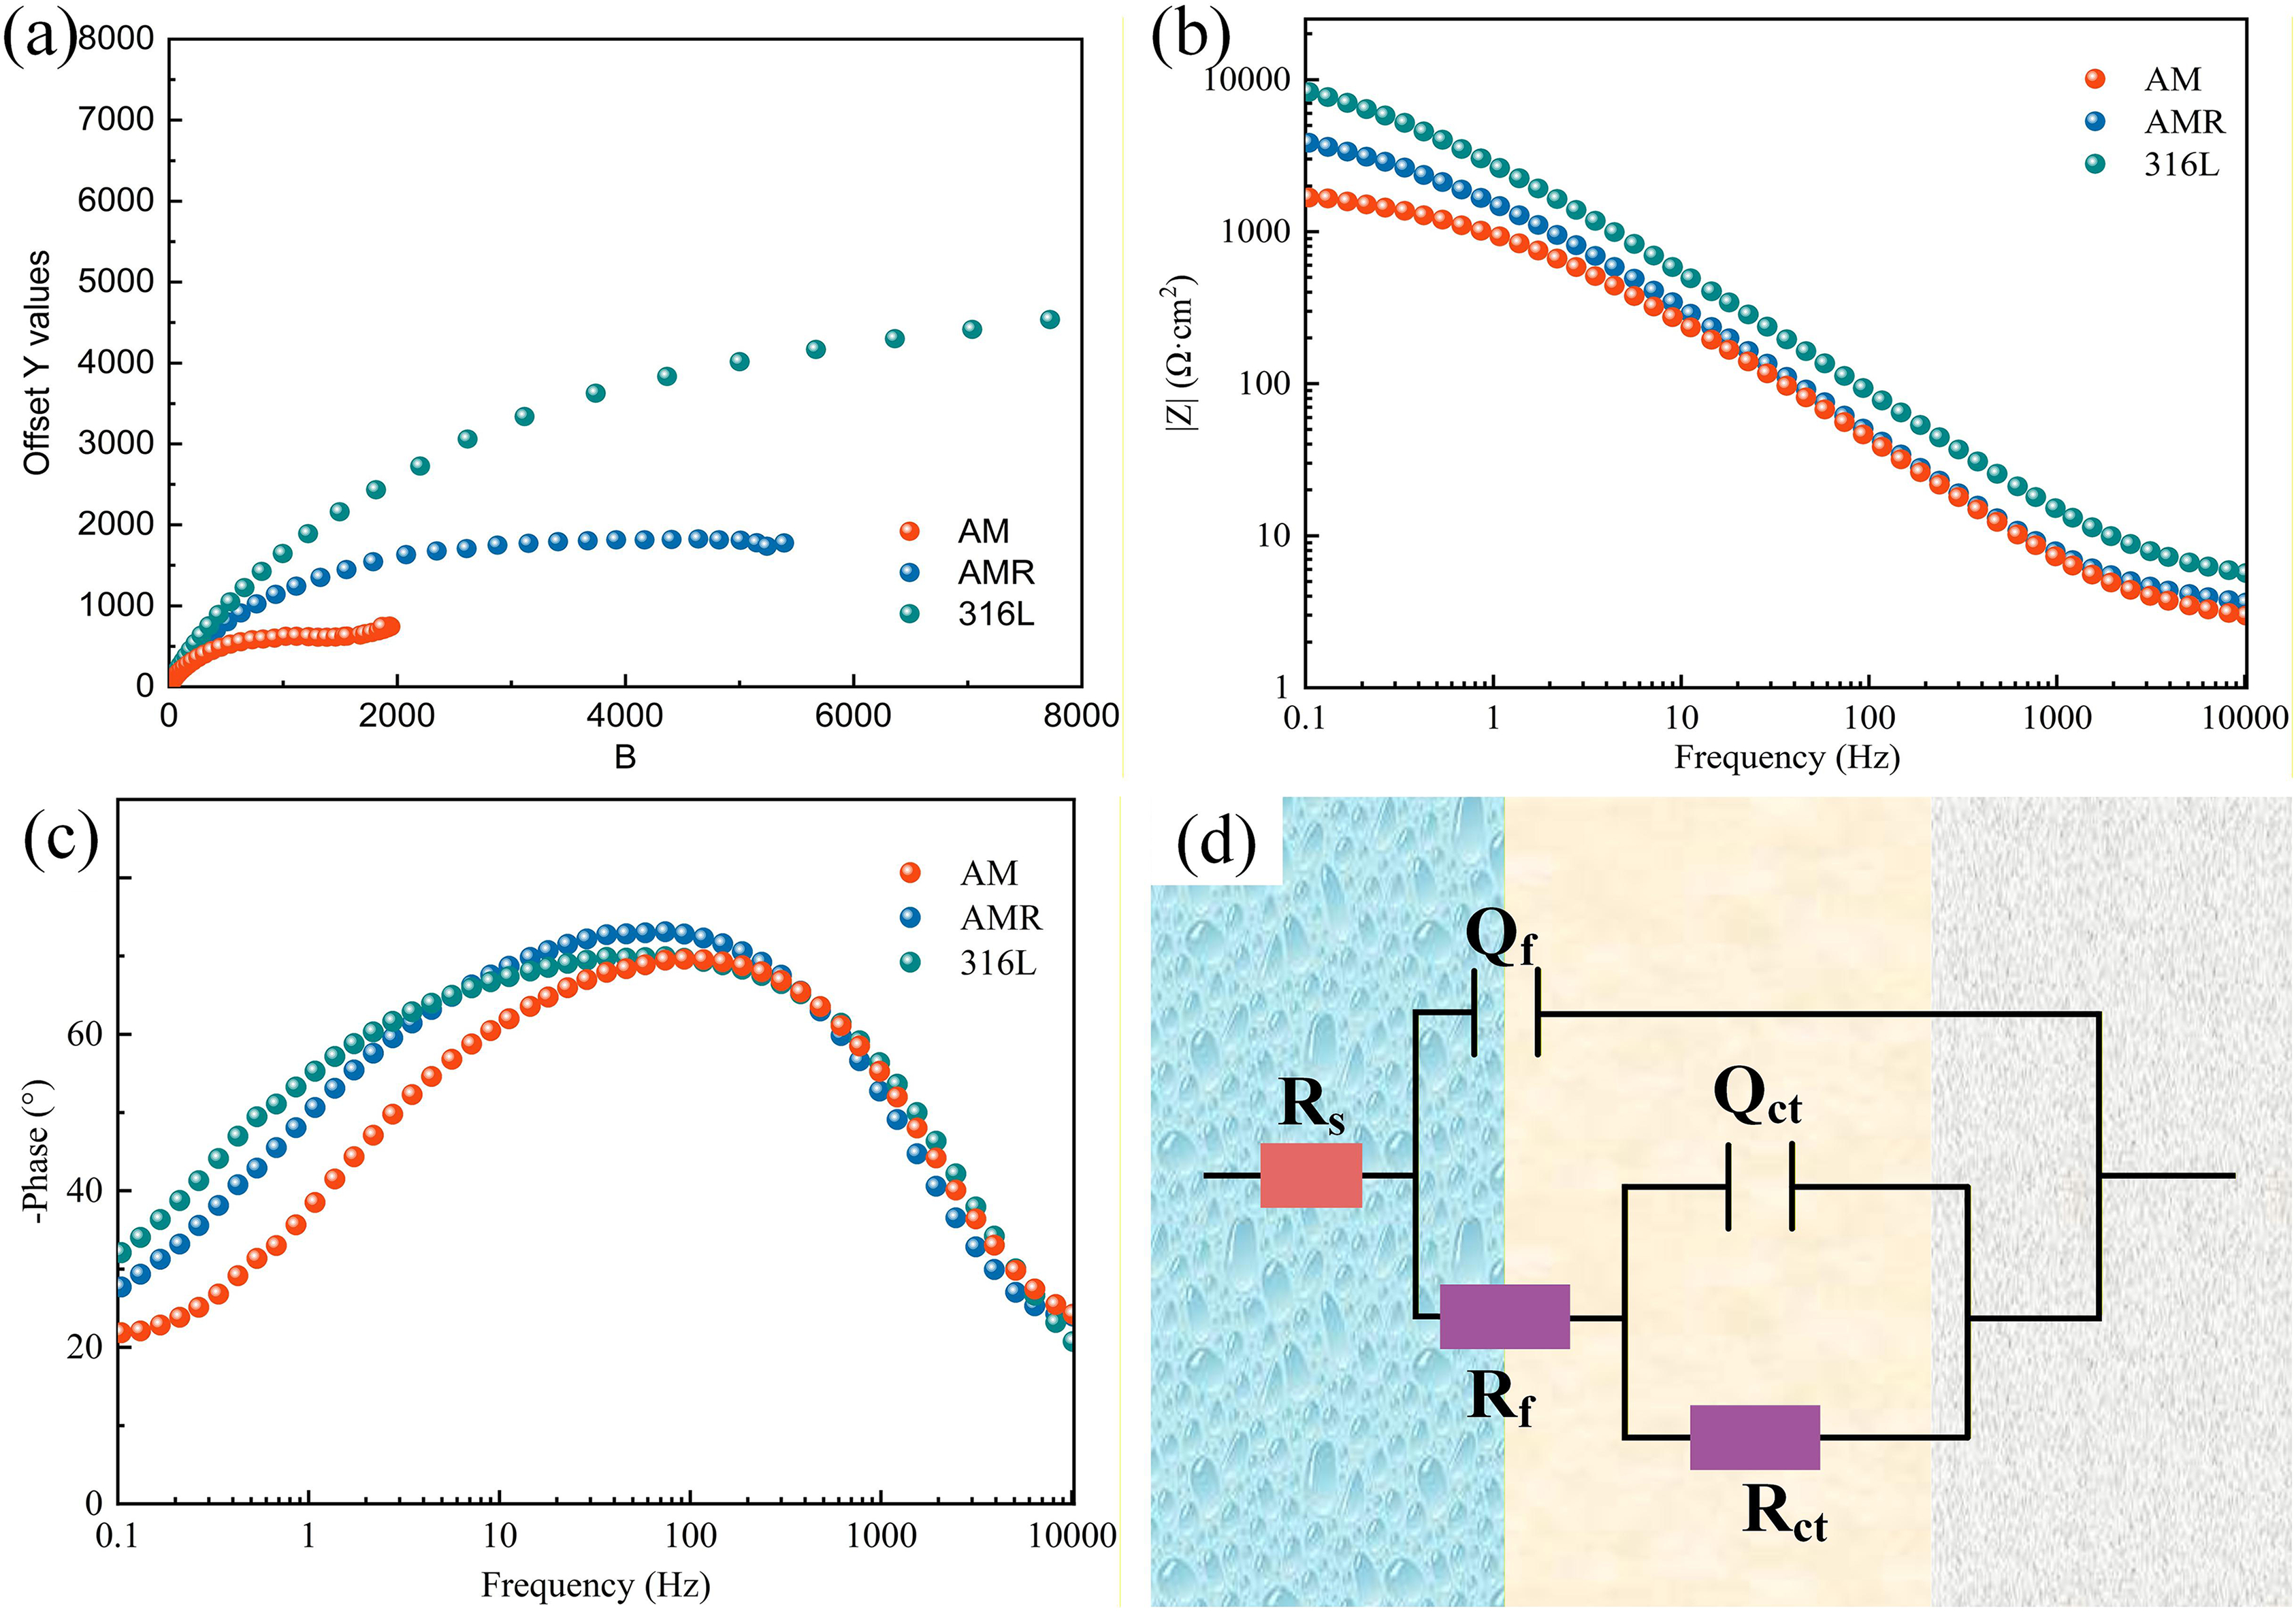
(a) Nyquist plots of different samples in a 3.5 wt.% NaCl solution, (b-c) Bode plots of different samples in a 3.5 wt.% NaCl solution, (d) Fitted circuits for EIS of different samples in a 3.5 wt.% NaCl solution.
EEC fitting parameters for EIS of HEAs in 3.5 wt.% NaCl solution.
Electrochemical noise analysis
To evaluate the long-term pitting corrosion behavior of materials in a 3.5 wt.% NaCl solution, electrochemical noise signals were recorded for 24 h. Figure 11 presents the time-domain voltage and current signals obtained from this acquisition. Figure 11(a) shows the time-domain signals for the AM material. As illustrated, the voltage exhibits a transient exceeding 9 × 10⁻³ V during the initial stage of testing, suggesting a high susceptibility to initial pitting events. Similarly, the current signal increases rapidly within the first 30,000 s, after which the current transients become relatively stable compared to the initial period. Figure 11(b) displays the results for the AMR material. Both voltage and current signals for the rolled sample fluctuate within a narrow range throughout the test, indicating minor pitting activity during the extended monitoring period. Figure 11(c) shows the corresponding signals for the 316L sample. Both voltage and current show minimal fluctuation, demonstrating the excellent resistance to pitting corrosion. Figure 11(d) summarizes the maximum transient amplitudes observed across the samples. The maximum transient values of voltage and current follow a consistent trend, increasing in the order of 316L<AMR<AM. This progression suggests that the probability of pitting corrosion occurrence decreases in the order of AM>AMR>316L. Consequently, it can be concluded that 316L exhibits strong pitting corrosion resistance, while AM has the poorest pitting corrosion resistance.
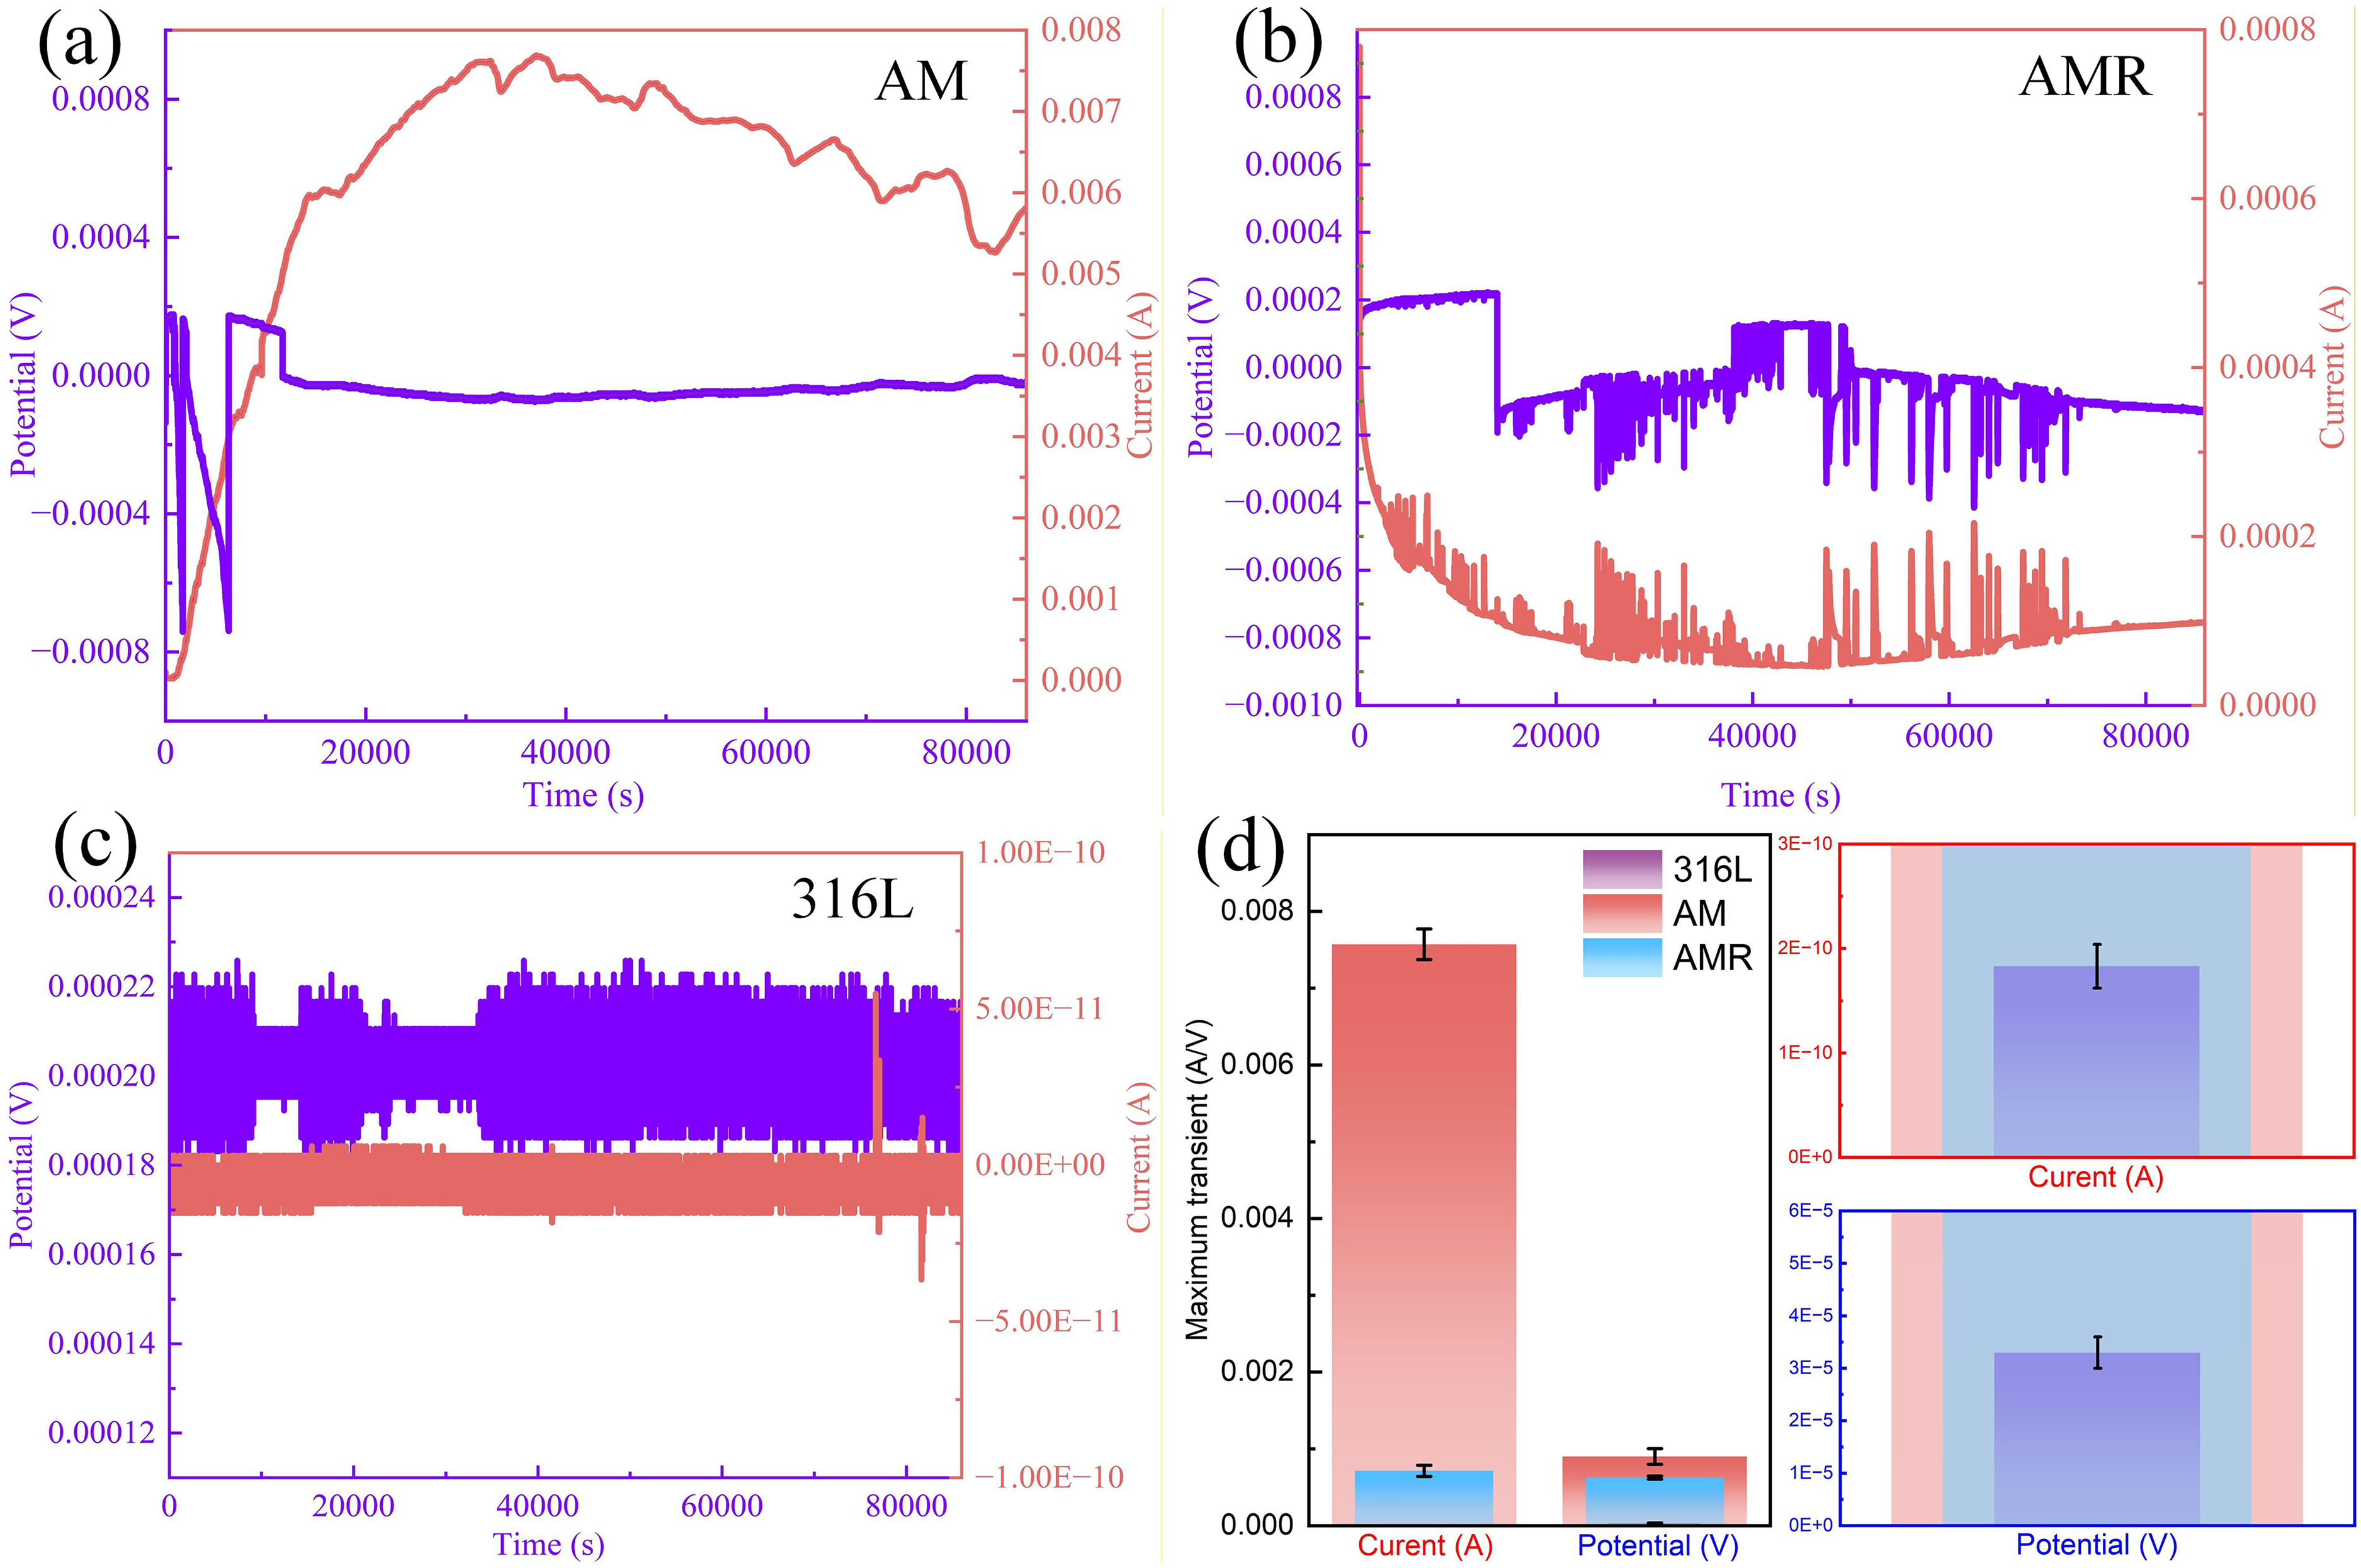
Electrochemical noise of voltage and current in the time domain: (a) AM, (b) AMR, (c) 316L, (d) Maximum current and voltage transient results for different materials.
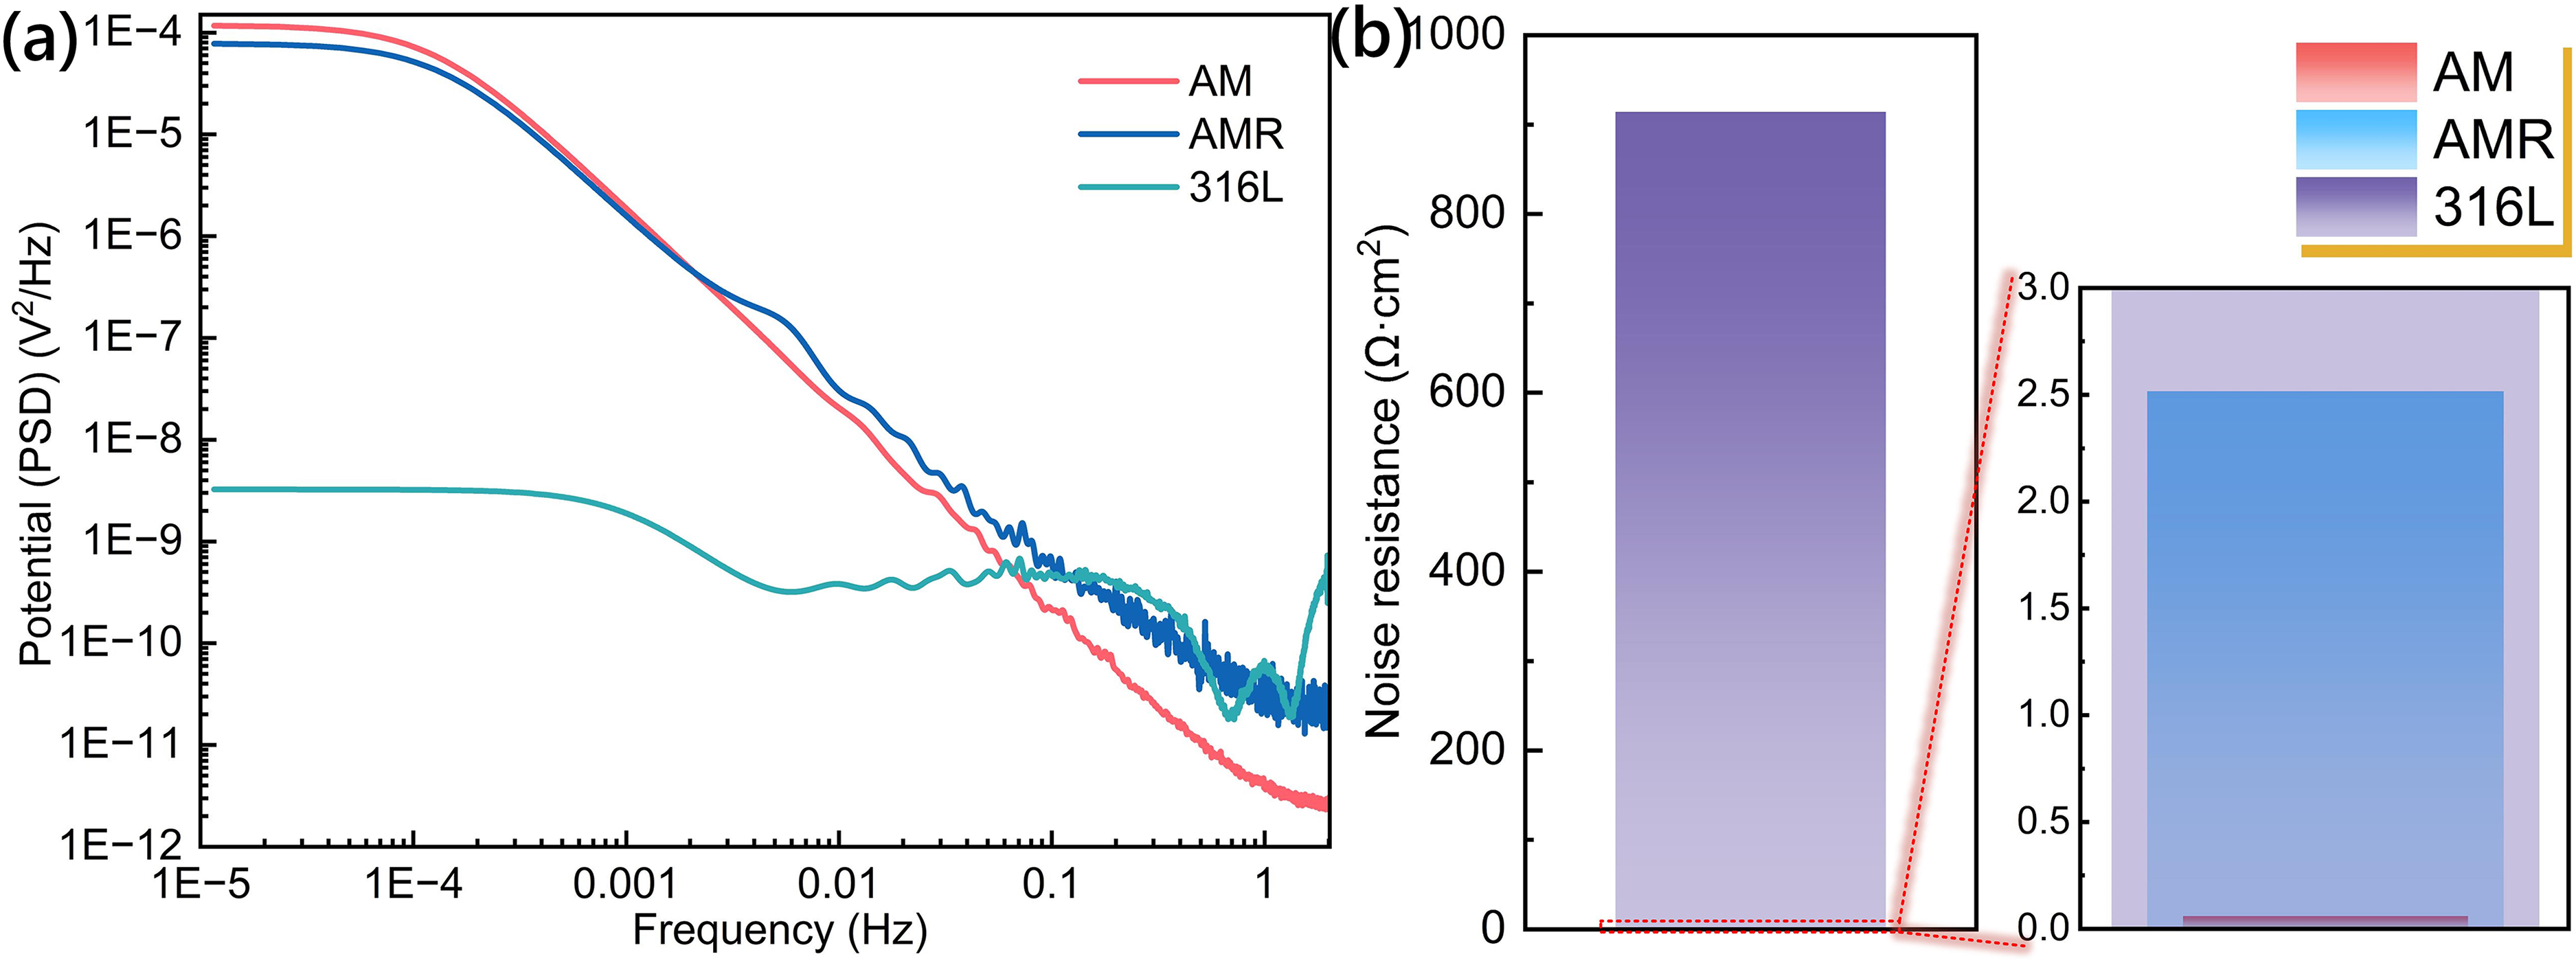
Figure 12(a) shows the power spectral density (PSD) of the electrochemical noise potential for different alloys, obtained via Fast Fourier transform (FFT) analysis. The white noise levels in the low-frequency region increases in the order of 316L<AMR<AM, indicating a corresponding increase in pitting corrosion activity. Notably, it is noteworthy that the white noise level of 316L is significantly lower than those of the other two materials, suggesting strongly inhibited anodic dissolution, highly stable electrode potential, and superior resistance to pitting corrosion. Figure 12(b) presents the noise resistance (Rn) results. The noise resistance of 316L is substantially higher than those of the AM and AMR samples, indicating greater polarization resistance, lower corrosion current, and excellent corrosion resistance.40–41 In contrast, the AM sample has the lowest Rn value, implying that even minor current fluctuations can induce significant potential fluctuations. The AM alloy system has low polarization resistance and large corrosion current, resulting in deteriorated corrosion resistance.
(A) Power spectral density for all samples, (b) Noise resistance results for the samples.
To further investigate the pitting susceptibility, the transient event frequency (fn) and charge (q) were analyzed. Figure 13 shows the cumulative distribution plots of fn and q for different alloys in 3.5 wt% NaCl solution. The values of fn and charge q were calculated using equations (1) and (2), respectively
42
:
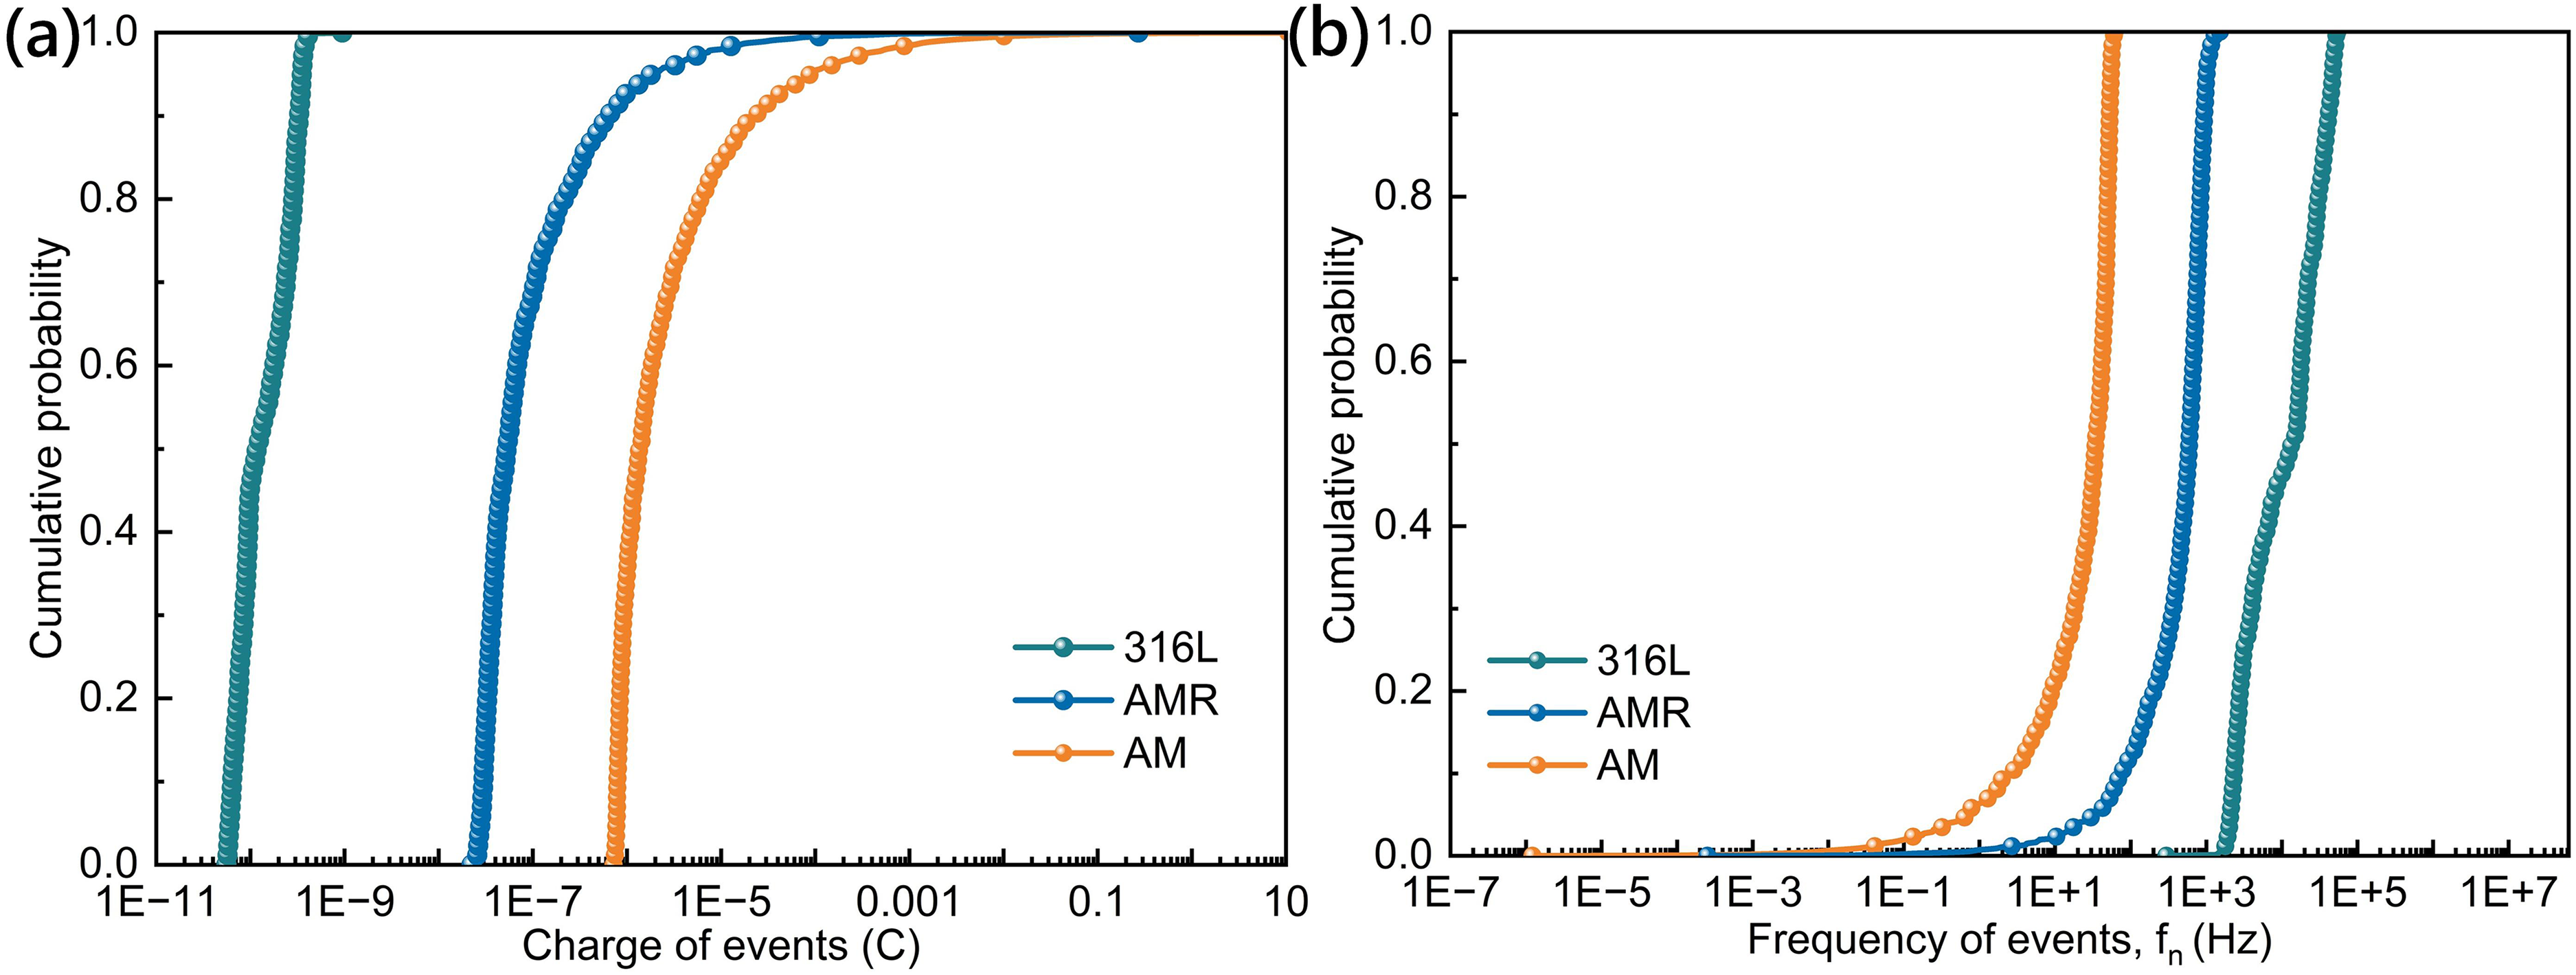
Cumulative distribution plots of events for different samples in 3.5 wt% NaCl solution: (a) frequency fn, (b) charge q.
Potentiostatic step analysis
Figure 14 shows the results of potentiostatic step tests conducted on all specimens in a 3.5 wt.% NaCl solution. At the beginning of the test, a constant potential selected from the passive region of potentiodynamic polarization curves (Figure 7(b)) was applied to each specimen. Potentials of 0.09 Vref, 0.72 Vref, and 0.62 Vref were applied to AM, AMR, and 316L respectively. As shown in the figure, in the first stage, the current density of all samples shows a decreasing trend, indicating the formation of a passive film. 44 After 100 s, a breakdown potential (denoted as potential A in Figure 14) was applied, resulting in rapid deterioration of passive state and a sharp increase in current density. Afterwards, a passive potential (denoted as potential B) was reapplied, leading to an immediate return to passivation characterized by a rapid decline in current density until stabilization. The stable-state current densities increase in the order of 316L<AMR<AM, indicating that the corrosion resistance decrease in the reverse order of 316L>AMR>AM. It is noteworthy that the application of the breakdown potential induces current spikes corresponding to metastable pitting events. The amplitudes of these transients increase in the order of 316L<AMR<AM, suggesting that smaller transient amplitudes correlate with a grater resistance to the initiation of pitting corrosion.
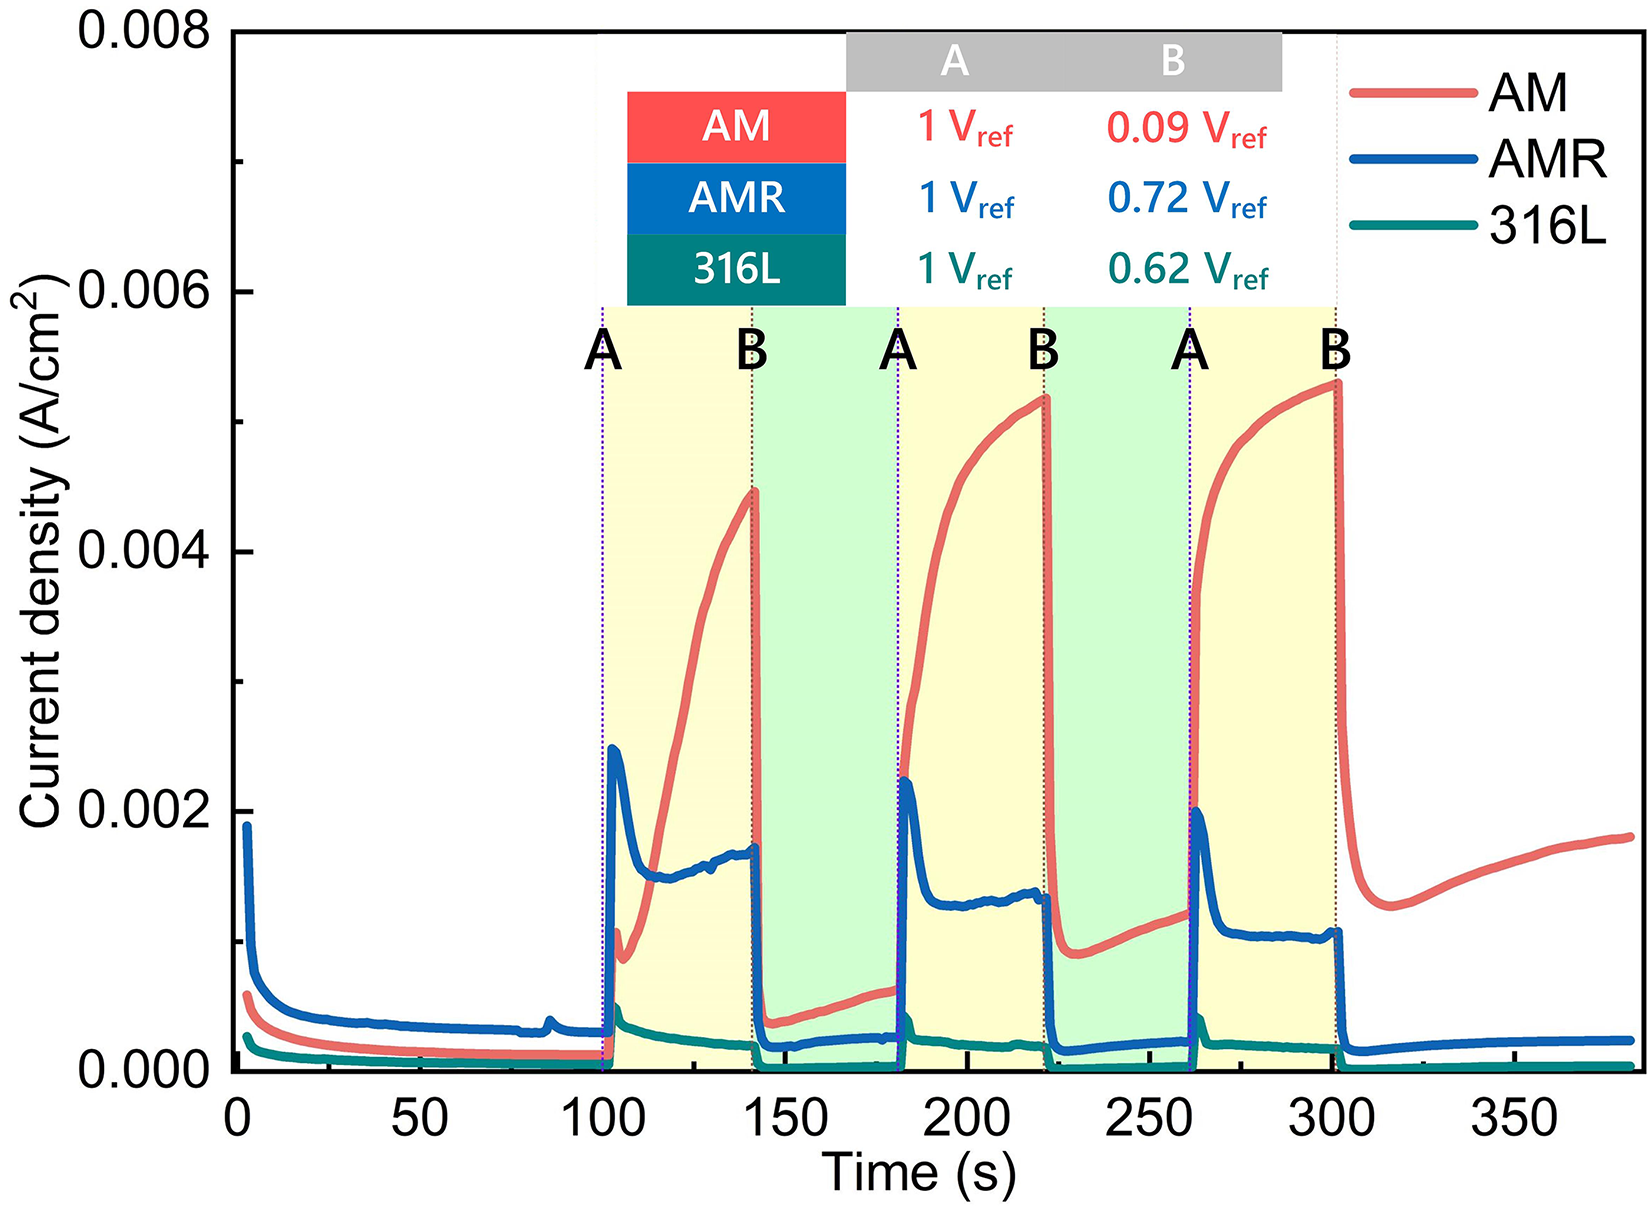
Potentiostatic step test of all specimens in a 3.5 wt.% NaCl solution.
Corrosion mechanism
The effect of rolling on corrosion resistance
Microstructural characterization confirms that hot rolling plays a critical role in refining the microstructure of the materials (Figure 2 and 4). During deformation, dynamic recovery occurs within the material, governing the evolution of grain morphology, dislocations, and other defects introduced during rolling. As the degree of deformation increases, the dislocation density in local regions reaches a critical value, thereby triggering dynamic recrystallization. This leads to the formation of new grains that and gradually replace the original deformed microstructure. This recrystallization process not only results in significant grain refinement (Figure a4-b4) but also effectively eliminates micropores and lack-of-fusion defects inherited from the SLM process. Concurrently, grain boundary density is substantially increased. Furthermore, dynamic recovery reduces stress concentration and provides a more uniform matrix for the alloy (Figure 6). These microstructural improvements contribute to enhanced overall electrochemical stability of the material.
Figure 15 schematically illustrates the corrosion mechanisms of the different alloys. The rolling process significantly improves the corrosion resistance of the CoCrFeNiMn HEA, primarily due to microstructural optimization induced by hot rolling, which improves the electrochemical stability. During the SLM process, rapid solidification introduces defects such as micropores and incomplete fusion (Figure 2a1), which act as preferential sites for corrosion initiation. As shown in Figure 2b1, rolling treatment effectively eliminates these micro-voids and cracks through severe plastic deformation and thermal effects, thereby reducing potential nucleation sites for corrosion. Moreover, the rolling process refines the grains (Figure 4) and significantly increases the grain boundary density. The fine-grained structure not only facilitates the formation of a denser and more uniform passive film, but also enhances the diffusion of protective elements along the grain boundaries, facilitating rapid repassivation after film damage. The electrochemical test results strongly support these microstructural improvements: the rolled sample exhibits a notably reduced corrosion current density (Figure. 7(c)), indicating a lower corrosion rate. Additionally, electrochemical noise analysis (Figure 11(d) and 12) shows decreased amplitudes of current and voltage transients and increased Rn, demonstrating a significant reduction in pitting corrosion sensitivity.
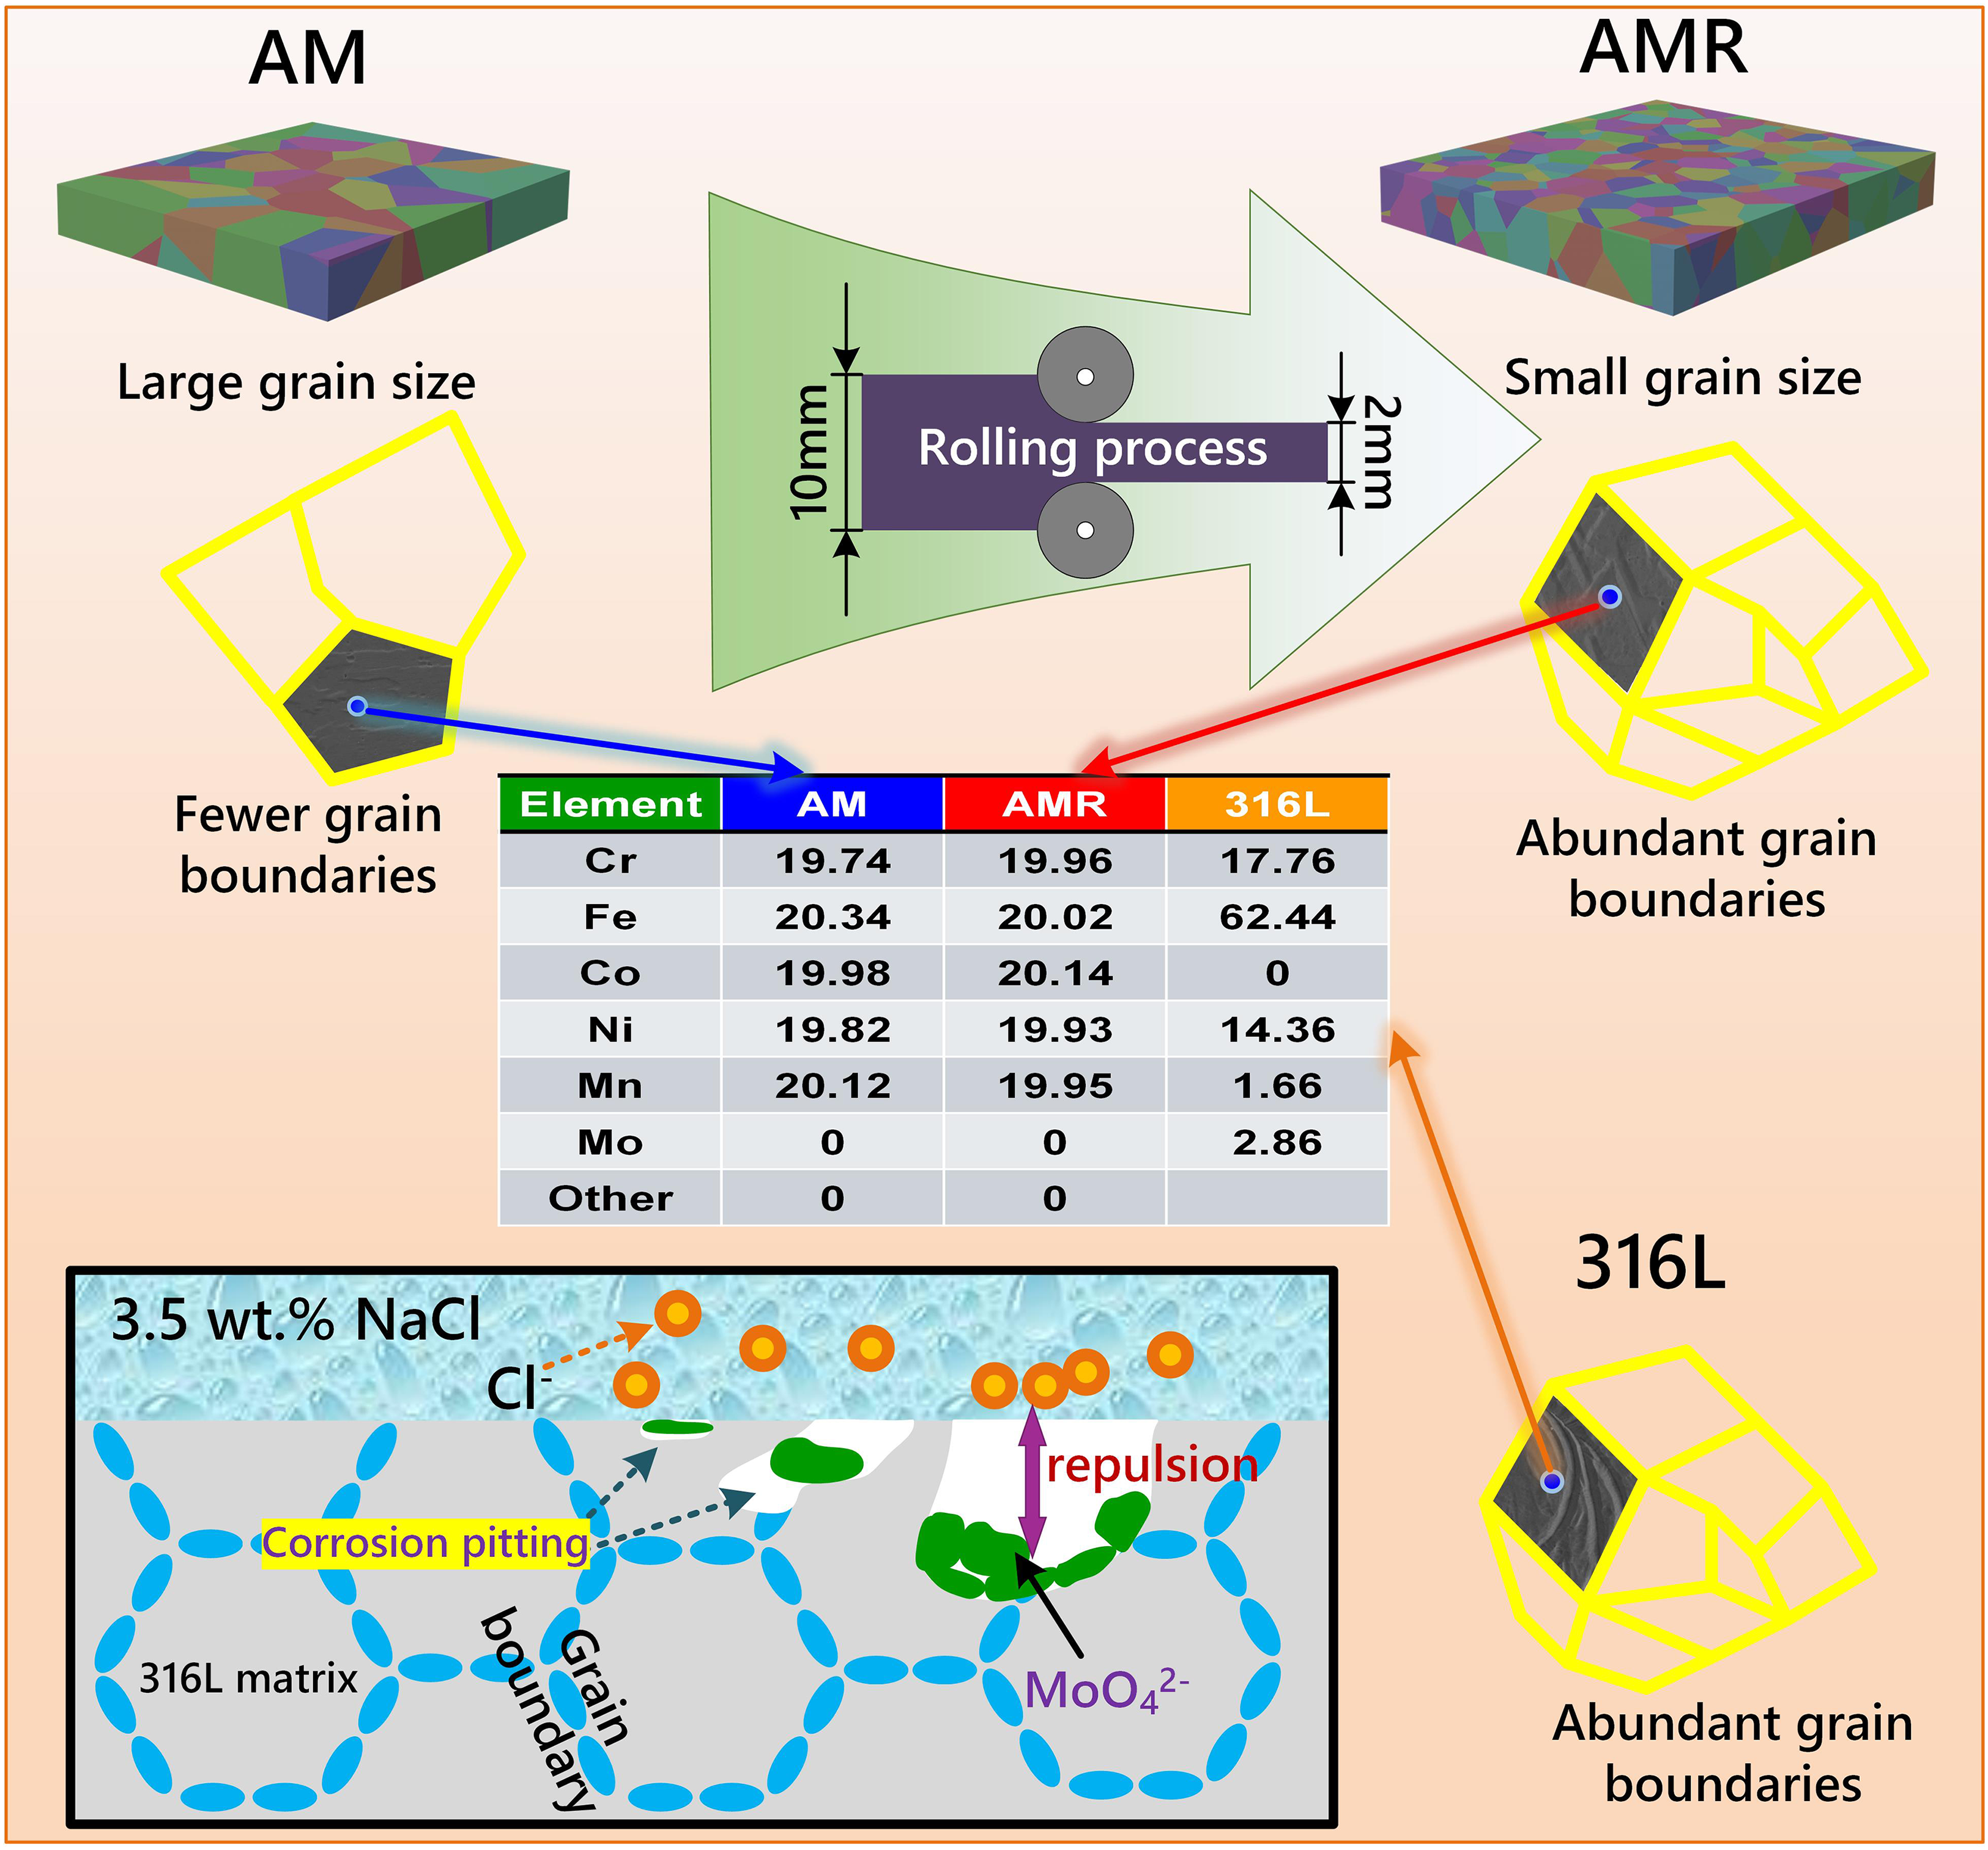
Schematic diagram of corrosion mechanism.
The superior corrosion resistance of 316L
Although rolling improves the performance of the HEA, its resistance remains inferior to that of SLM-fabricated 316L stainless steel, which demonstrates superior performance across all tests. The outstanding corrosion resistance of 316L stems from its optimized alloy composition and the relatively uniform microstructure achieved via SLM. As indicated in Figure 15, 316L contains approximately 17.76% Cr and 2.86% Mo (key elements) that significantly enhance pitting corrosion resistance by inhibiting both initiation and propagation.
The SLM-produced 316L stainless steel maintains a homogeneous elemental distribution without significant compositional segregation (Figure 2). This structural integrity provides a robust foundation for its corrosion resistance. A series of electrochemical test results consistently confirm its performance advantages: it has the lowest corrosion current density (Figure 7(c)), indicating the lowest corrosion rate. Its electrochemical noise signals are the most stable, with minimal transient amplitudes (Figure 11(c)-(d)). Additionally, it has the lowest white noise level in the PSD and the highest Rn (Figure 12). All these characteristics demonstrate exceptional surface stability and and a low probability of pitting nucleation. As shown in Figure 15, the presence 3.6% Mo enables the formation of molybdate in chloride-containing environments, which alters interfacial electrochemistry and effectively blocks aggressive Cl− ions. This mechanism contributes to the alloy's rapid repair capability and low steady-state current density observed during potentiostatic step testing (Figure 13). Furthermore, molybdate hinders chloride adsorption at potential pit sites, suppressing the development of stable pits. This explains why only non-propagating metastable pits are observed in Figure 9c1. This finding is consistent with the research by Liu et al. 45 Therefore, relying on the compositional advantages of high Cr and Mo content along with the dense and uniform microstructure prepared by SLM technology, the 316L stainless steel achieves comprehensive superior corrosion resistance.
Conclusion
This study systematically compared the mechanical properties and corrosion resistance of materials fabricated by SLM. The main conclusions are as follows:
(1). Microstructural analysis shows that minor defects are observed in the AM alloy. After rolling treatment, the material exhibits increased density, refined grain size, and higher dislocation density. The 316L samples display distinct melt pool boundary characteristics. (2). Hardness test results indicate that the average microhardness of the AM samples (198.15 Hv) is higher than that of the 316L samples (184.22 Hv). The hardness of the AMR samples is further enhanced, which is attributed to grain refinement and high dislocation density. (3). Electrochemical tests demonstrate that 316L has the optimal corrosion resistance, mainly benefiting from its pitting corrosion resistance (derived from high Cr and Mo content) and uniform microstructure. Furthermore, the corrosion resistance of the AMR samples is improved due to densification induced by the rolling process. (4). The relatively poor corrosion resistance of the AM samples is mainly attributed to their microdefects, which act as sensitive sites for pitting corrosion nucleation. Hot rolling improves corrosion resistance by reducing defects and refining grains. In contrast, the excellent corrosion resistance of the 316L samples is ascribed to their strong passivation ability (endowed by high Cr and Mo content) and uniform, fine microstructure.
Footnotes
Acknowledgements
This research was supported by the National Natural Science Foundation of China (No. 52405338) and the Young Elite Scientists Sponsorship Program by BAST (No BYESS2023040).
Author contribution(s)
Funding
The authors disclosed receipt of the following financial support for the research, authorship, and/or publication of this article: This work was supported by the National Natural Science Foundation of China, Young Elite Scientists Sponsorship Program by BAST, (grant number 52405338, BYESS2023040).
Declaration of conflicting interests
The authors declared no potential conflicts of interest with respect to the research, authorship, and/or publication of this article.