
Abstract
Ultrafine-grained commercial pure titanium (CP Ti) offers a superior strength-ductility balance for aerospace and biomedical applications, but conventional grain refinement often compromises integrity and efficiency. This study investigated cryogenic temperature large strain extrusion machining (CT-LSEM) to examine the effects of cutting speed (Vc) on microstructural evolution. Higher Vc promoted grain refinement and enhanced hardness and yield strength. EBSD revealed a 7% increase in dislocation density and formation of {10–12}, {11–22}, and {11–21} twins. Strengthening arose from fine-grain, dislocation, and twin-boundary mechanisms. These findings clarify the coupled effects of speed and cryogenic temperature on CP Ti microstructure, providing insights for high-performance, efficient processing.
Introduction
Commercial pure titanium (CP Ti) is extensively utilized in aerospace, biomedical, and chemical engineering owing to its remarkable corrosion resistance, high strength-to-weight ratio, and exceptional biocompatibility.1–4 However, its relatively low strength limits applications requiring superior surface and fatigue properties. 5 Traditional strengthening methods involve alloying, as in Ti-6Al-4V and Ti-6Al-7Nb, which are used in dental and orthopedic implants. 6 However, the Al and V elements are bio-toxic, restricting biomedical applications. 7 Another solution is producing ultrafine or nano-crystalline structures through severe plastic deformation (SPD),8,9 which enhances mechanical properties without harmful alloying. Major SPD techniques include equal channel angular pressing (ECAP), 10 high-pressure torsion (HPT), 11 accumulated rolling (ARB), 12 and large strain extrusion machining (LSEM).13–15 These methods refine grains through large strains, generating lattice defects and unique microstructures that improve material performance. 16
Compared to traditional SPD methods, such as ECAP and HPT, LSEM is a novel processing technique that offers advantages like low energy consumption, simple equipment, and high efficiency. These features make LSEM highly promising for practical industrial applications.
Compared to traditional SPD methods like ECAP and HPT, LSEM is a novel, cost-effective technique with low energy consumption, simple equipment, and high efficiency. It enables the preparation of ultrafine-grained materials through a single-step, continuous forming process. Cutting speed (Vc) is a critical parameter, affecting chip deformation, thermal effects, and microstructural evolution, including grain size, dislocation density, shear band morphology, and texture.17,18 Studies have shown that varying Vc alters material properties: Ku et al. 19 reported a 25% hardness increase in Ti-6Al-4V processed by LSEM; Wang et al. 20 observed a bimodal grain structure in chips; Yin et al. 21 noted significant surface changes; and Lu et al. 22 found that higher Vc reduces shear band width, modifying chip strain characteristics.
Most LSEM studies have focused on room-temperature processing. However, titanium's low thermal conductivity and high strain rates during cutting cause significant heat buildup, promoting dynamic recrystallization (DRX) and grain growth, which reduce strength and hardness.23,24 Low-temperature processing can mitigate these effects, improving machinability, tool life, and surface quality. 25 While research on low-temperature LSEM is limited, studies on Mg, Al alloys show that cold conditions suppress DRX and dynamic recovery, increase dislocation density, and enhance hardness and yield strength compared to room-temperature LSEM.21,26
This study systematically investigates the effect of Vc on the microstructural evolution and mechanical properties of commercial pure titanium (CP Ti) during cryogenic temperature large strain extrusion machining (CT-LSEM). By integrating CP Ti's DRX and strengthening mechanisms with a self-developed FORTRAN-based finite element simulation, grain size and hardness are precisely predicted. The study further examines how crystallite size, dislocation networks, and mechanical twinning influence microstructural evolution and property enhancement. Grain size strengthening is quantified using the Hall-Petch relation, validated by yield strength and hardness measurements. This work fills a research gap regarding the effects of cutting speed on LSEM under low-temperature conditions, demonstrates the effectiveness of low-temperature large-deformation processing in significantly enhancing the strength of CP Ti, and provides a continuous, environmentally friendly, and efficient production pathway for ultrafine-grained titanium strips.
Experiments and simulation
The mechanism of LSEM process
As illustrated in Figure 1(a), the LSEM process required the installation of an upper constraint adjacent to the tool's working surface. The critical chip thickness compression ratio was mechanically determined by the relative positioning between the extrusion block and the tool face. The process mechanism involved three sequential phases: chip formation, surface separation, and guided entry into the extrusion channel. There, it was subjected to the combined action of shear and extrusion of the constraint in the shear deformation zone. This results in the formation of a strip of chips with various shapes and sizes. The thickness of the chip was determined by the vertical distance between the extrusion block and the tool. Therefore, the chip compression ratio (
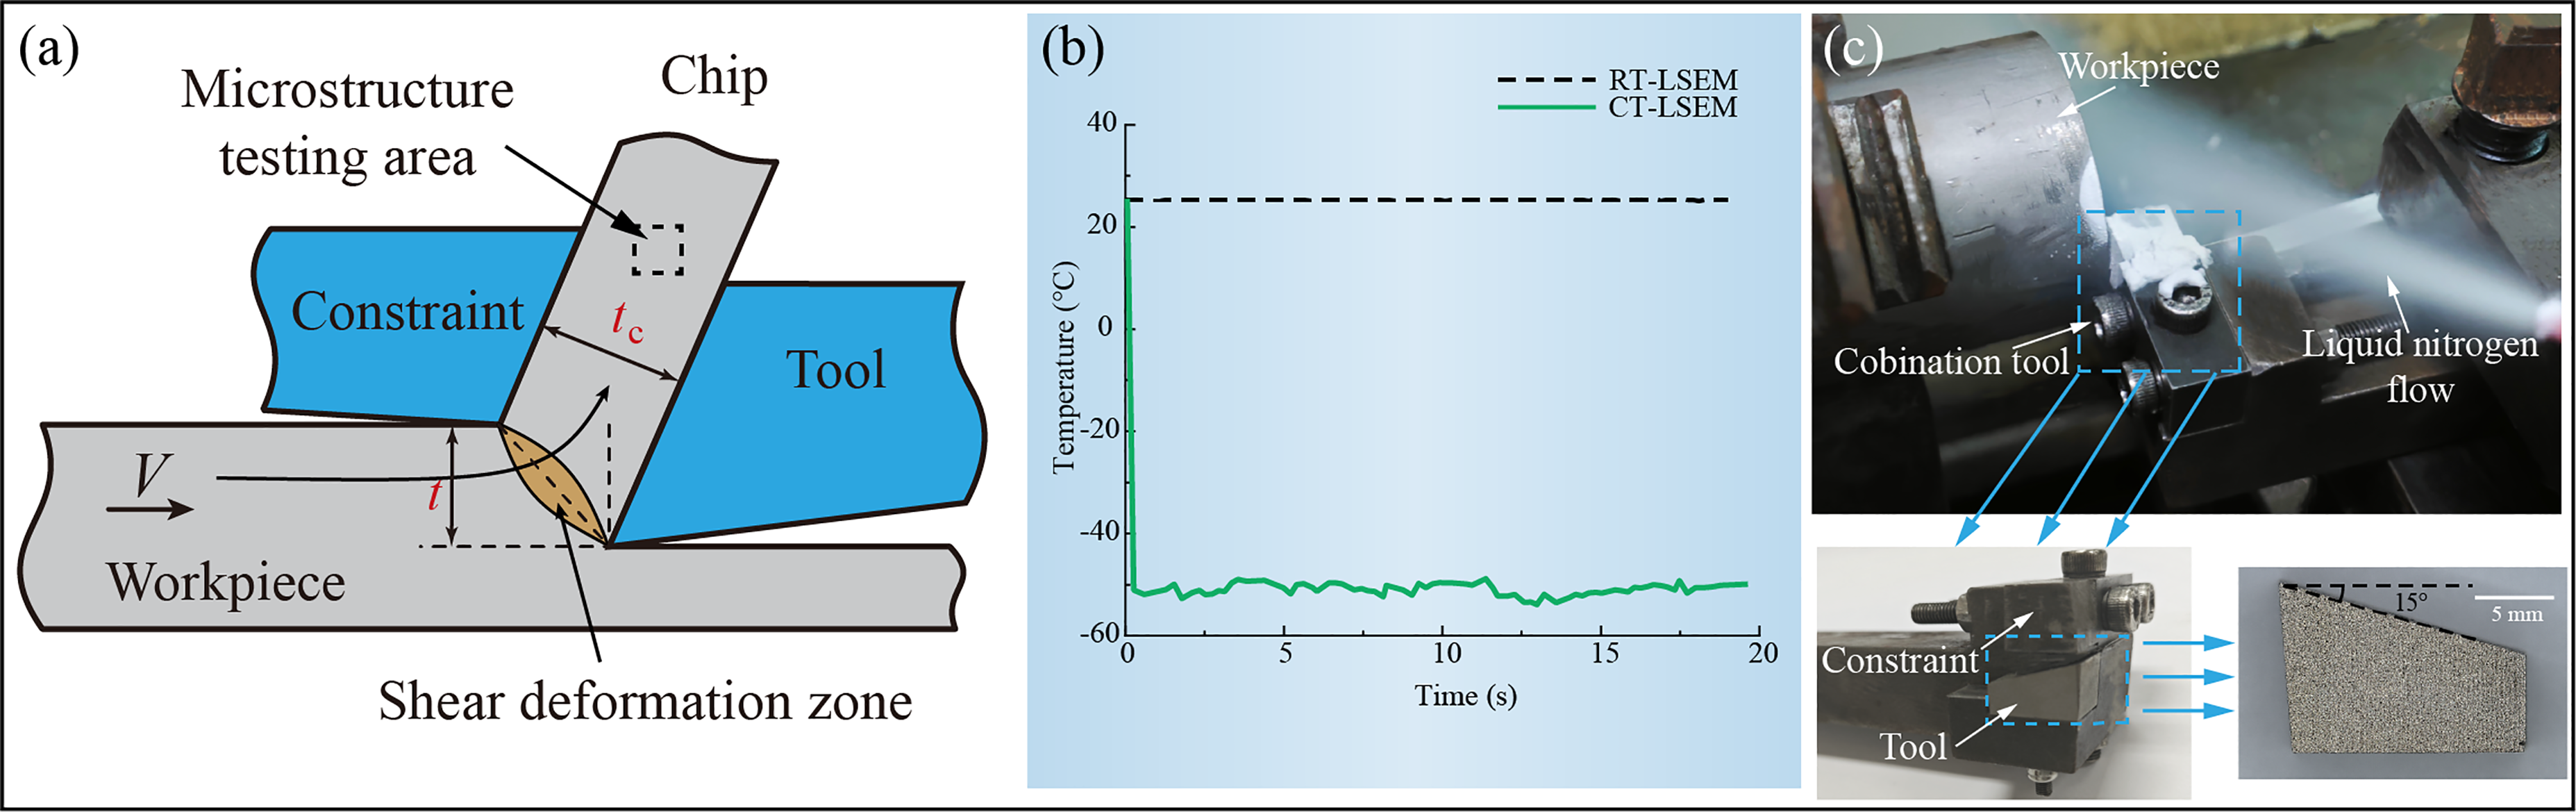
LSEM experiments: (a) schematic of the mechanism, (b) temperature control diagram, (c) actual setup.
In LSEM, the shear deformation (γ) was characterized by significant localization and concentration within a narrow area (the shear deformation zone). he estimation of shear strain was derived from Shaw's
27
theoretical framework, as illustrated in Eq. (1)
28
:
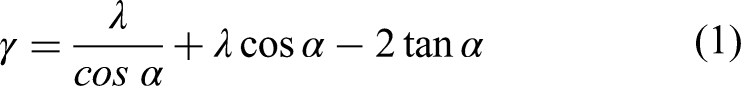
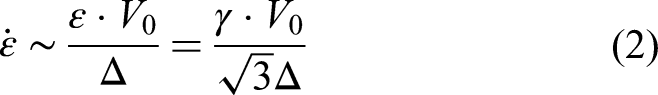
In this study, the cutting tool front angle, designated as α, was set at 15°. Strain rate (
Experimental method
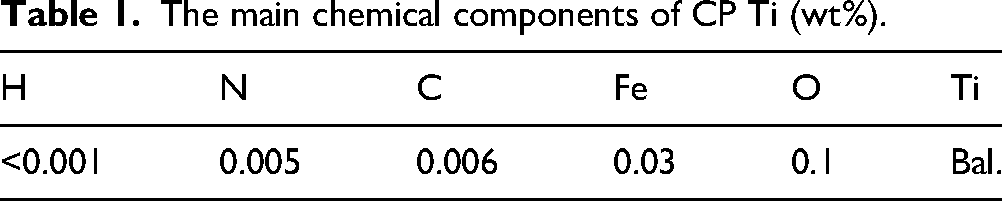
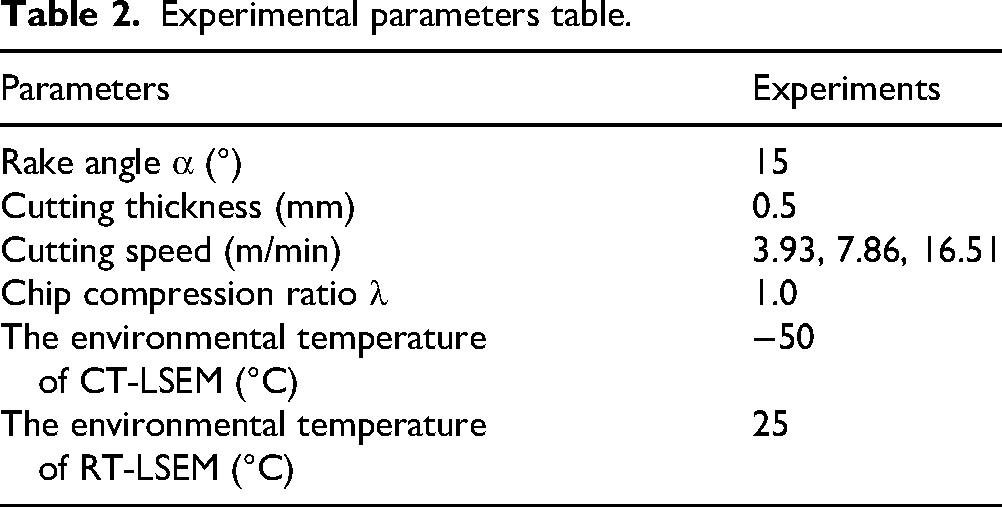
All machining trials were performed using a C6140A precision horizontal lathe featuring variable spindle speed capability. The test specimens consisted of commercially pure titanium cylindrical tubes with dimensions of 50 mm × 5 mm × 200 mm. Table 1 presented the complete chemical composition analysis of the CP Ti material. The cryogenic environment was set by spraying liquid nitrogen, stored in a biological container, into the cutting area by means of a liquid nitrogen extraction unit. Ultra-high-purity liquid nitrogen (99.999%) was employed throughout the experiments. Ambient temperature monitoring was conducted using a calibrated Type K thermocouple thermometer (TCM_UK). The measured temperature data and actual experimental setup were presented in Figure 1(b) and(c). Before the commencement of the experiment, the ambient temperature was stabilized at (−52 ± 2) °C using a liquid nitrogen apparatus. A comparison was made between the experiments conducted at room temperature large strain extrusion machining (RT-LSEM) and CT-LSEM of the chip properties. The LSEM experimental parameters in this study were shown in Table 2.
The main chemical components of CP Ti (wt%).
Experimental parameters table.
The morphology of CP Ti strips prepared by the LSEM process was shown in Figure 2(a). Post-test sample preparation involved: (1) resin encapsulation using SimpliMet-4000 automated mounting, as shown in Figure 2(b), (2) progressive surface refinement through abrasive grinding and mechanical polishing, and (3) microstructural examination via Leica DMI 5000 M microscopy. The hardness of CP Ti samples was measured using a Vickers hardness tester (HVS-1000) with an applied load of 200 g and a dwell time of 15 s. Hardness measurements were taken at 10 distinct locations within the central region of each sample, with the final result being their average value. The tensile specimens were machined from the processed chips using wire electrical discharge machining (wire-EDM). Due to the geometry of the chips produced by LSEM (thin strips), miniature tensile specimens were prepared with the following specifications: (1). Dog-bone specimens were used for tensile testing, with specific dimensions as shown in Figure 2(c). (2). The tensile specimens were machined such that the tensile axis was parallel to the chip flow direction, which corresponds to the shear direction in the LSEM deformation frame. (3). To ensure consistency, all tensile specimens were extracted from the central, steady-state region of the chips, avoiding the initial transient and end effects. A minimum of three specimens were tested for each condition to ensure statistical reliability. (4). Tensile tests were conducted using a universal testing machine (AG-IC 100 kN) at a speed of 2 mm/min.
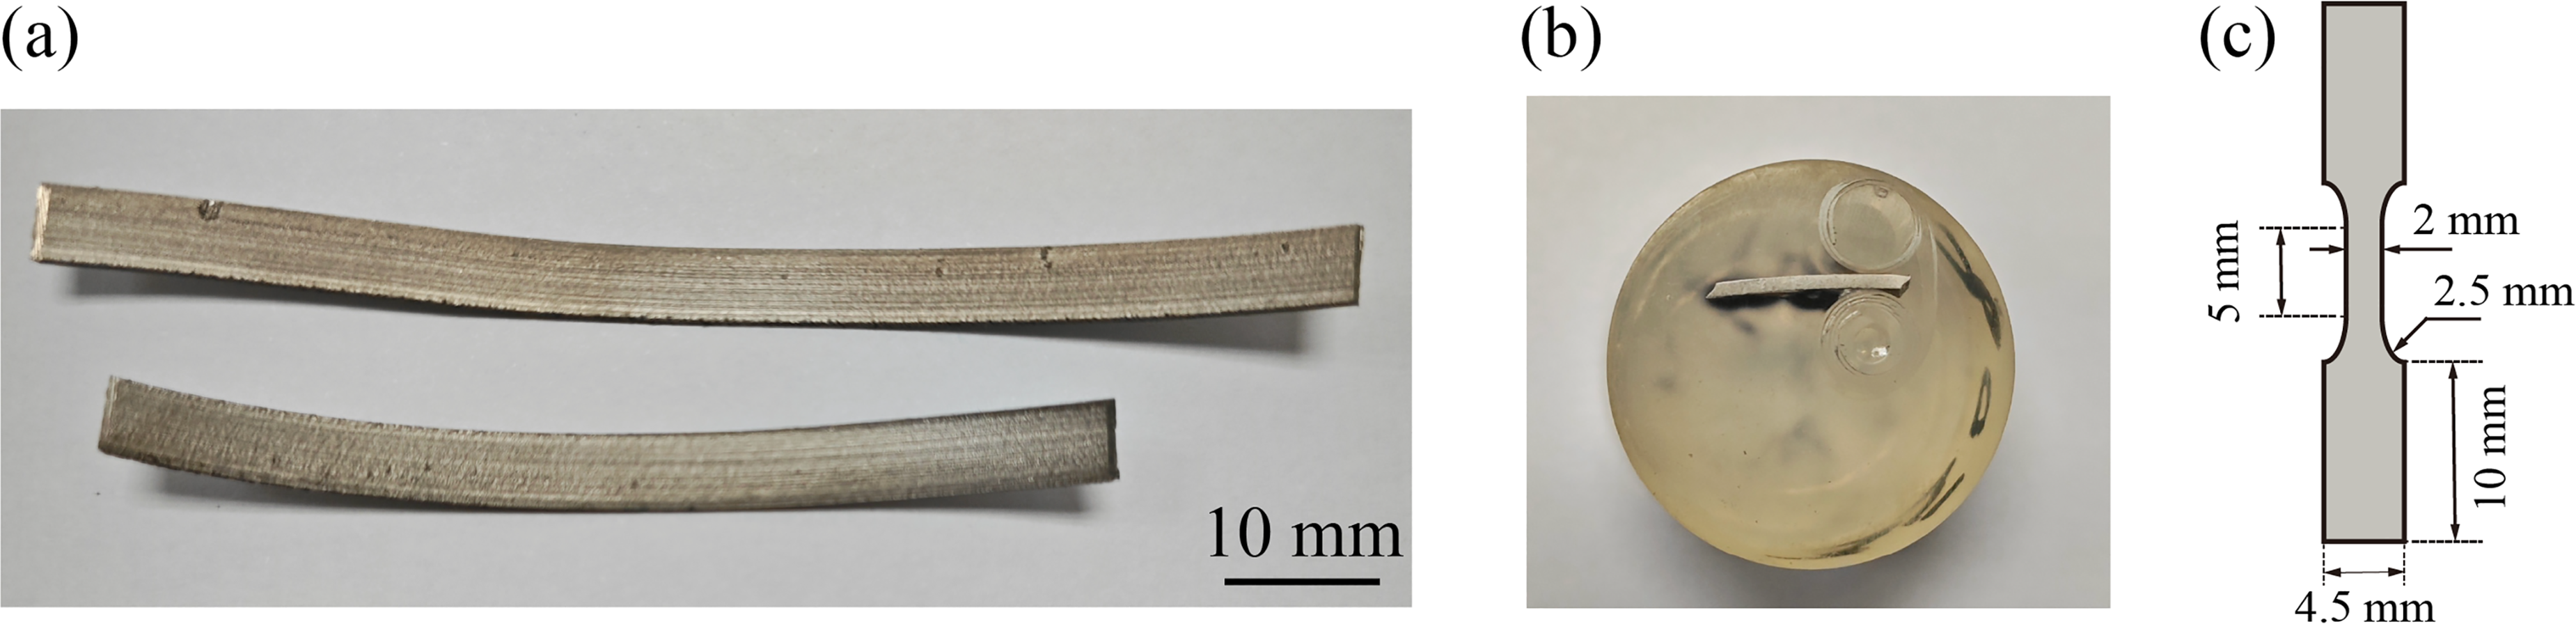
Test preparation for obtained samples: (a) strip morphology, (b) inlay sample, (c) tensile specimen.
The processed strips underwent a slow-speed precision cutting, conductive resin inlaying, wet grinding with SiC sandpaper (grit sizes ranging from 600 to 4000). Grinding continued until scratches from the previous step were completely removed, followed by vibratory polishing to achieve a smooth finish. Finally, they were cleaned using ethanol ultrasonic cleaning and dried with compressed air. These sample preparation procedures were critical for ensuring the accuracy of EBSD measurements. EBSD analysis was conducted using a Bruker eFlash FS detector attached to a NOVA NANOSEM 430 field emission scanning electron microscope. Testing commenced after 1 h of argon ion polishing, with a step size of 0.12 μm set to ensure reliable grain boundary detection. The microscope was operated at an accelerating voltage of 20 kV with a probe current of approximately 10 nA. The raw EBSD data are provided in the
Finite element simulation
Figure 3 presented the DEFORM-2D finite element analysis of the CT-LSEM process. The numerical model incorporated synchronized movement between the constraint and the cutting tool. The workpiece material was selected as TA2 pure titanium from the DEFORM software material library, with the following primary parameters: density 4.51 kg/m3, Poisson's ratio 0.37, Young's modulus 105 GPa, thermal conductivity 15.6 W/(m·K). Additionally, the cutting tools and constraint were made of high-speed steel and were set as rigid bodies in the simulation. The lower and left boundaries of the workpiece were fully fixed (Vx = Vy = 0), and tools moved leftward at a constant velocity V. The contact zone between the tool and workpiece was set as a heat exchange boundary with a heat transfer coefficient of 40 W/(m·K).
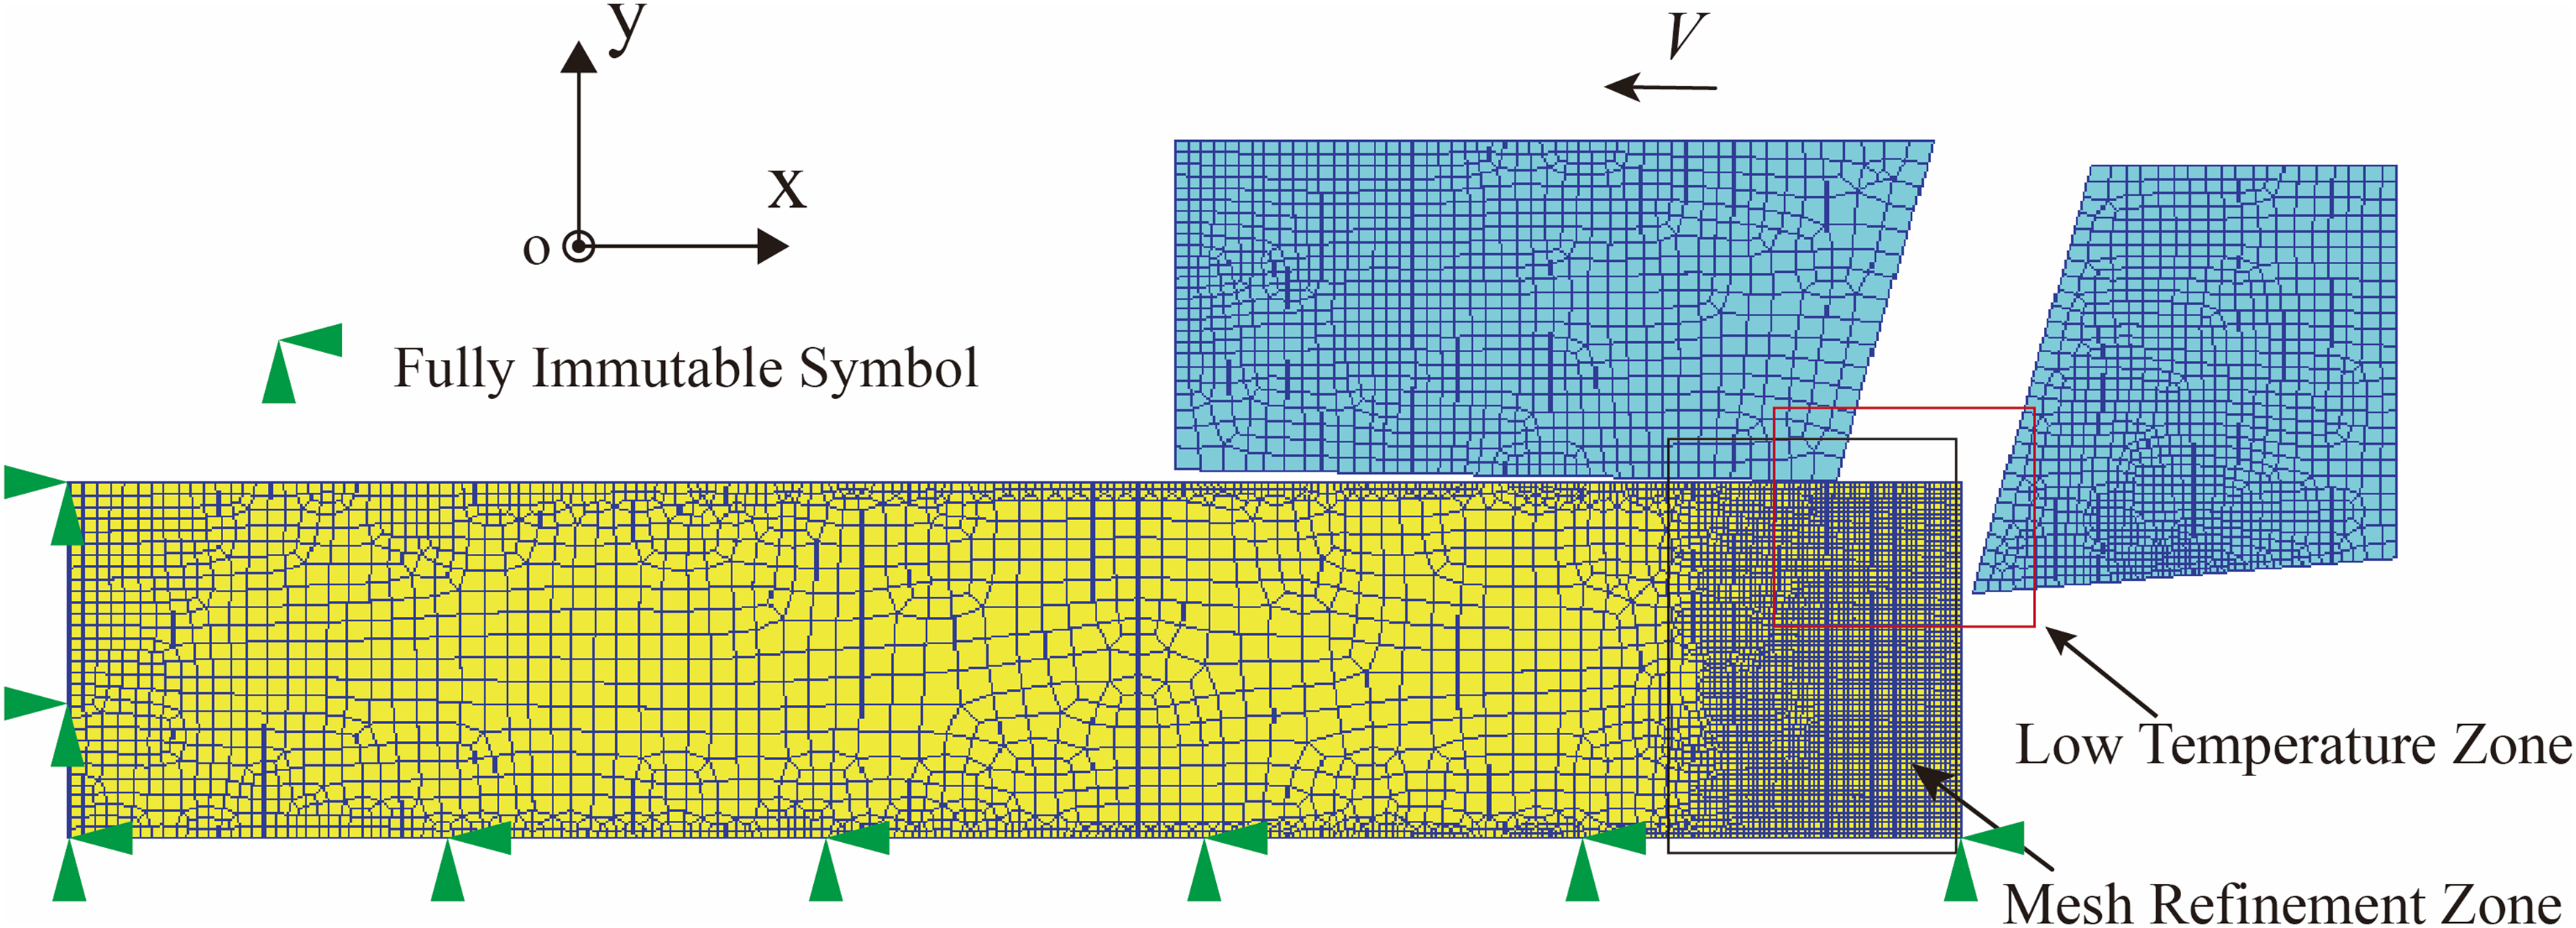
Finite element model of LSEM.
Computational accuracy was enhanced through localized mesh refinement in tool-workpiece contact regions combined with adaptive meshing capability. As highlighted in the figure's annotation box, a graded mesh scheme with a 1:10 inner-to-outer element size ratio was implemented. The Mesh Refinement Zone maintained dynamic alignment with the tool position. Numerical parameters included: (1) cryogenic temperature setting (−50 °C), (2) interfacial heat transfer coefficient [5000 W/(m K)], 29 and (3) Coulomb friction coefficient (μ = 0.6). This value is consistent with well-established studies on the FEM modeling of titanium alloys under dry and cryogenic conditions. For instance, Rotella and Umbrello 30 successfully used a similar friction coefficient (μ = 0.6) for modeling Ti6Al4 V machining, demonstrating good agreement with experimental forces and temperatures. The model incorporated three fundamental assumptions: (1) plane strain conditions appropriate for the given geometry; (2) invariant chip compression ratio (λ); (3) ambient temperature boundaries (25°C) for thermally unaffected zones.
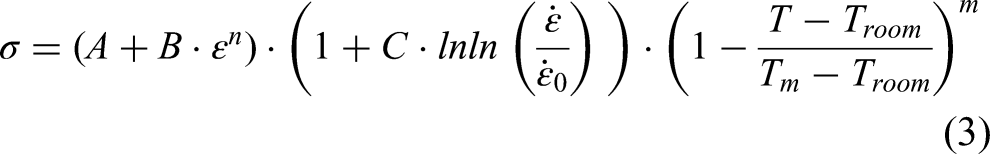
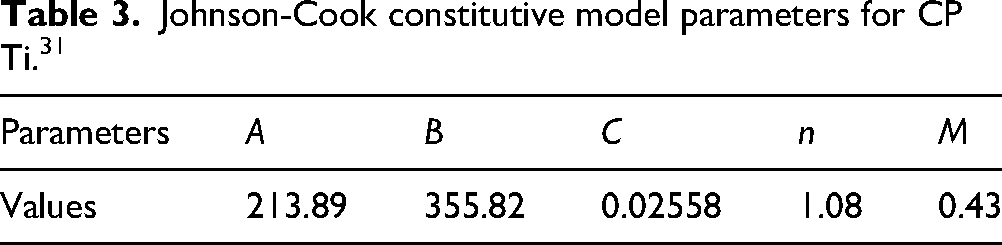
In this simulation, the Johnson-Cook (J-C) model was employed as the constitutive model for CP Ti. This model has been demonstrated to simulate the plastic response of metallic materials under large deformation and high-strain-rate loading with both simplicity and accuracy. Its expression was shown in Eq. (3)
31
:
Johnson-Cook constitutive model parameters for CP Ti. 31
Results and analysis
Finite element model verification
As shown in Figure 4, “EXP” represented the experimental result, and “NUM” represented the simulation result. The simulated cutting force fluctuated around the experimental measurement values. The finite element model showed strong agreement with experimental results, with maximum deviations of 5.9% in average values and 6.2% in thrust force predictions at V = 7.86 m/min, confirming the accuracy of the implemented CT-LSEM process model. Additionally, Figure 4 demonstrated a significant reduction in both cutting force and thrust force with increasing Vc, aligning with the velocity-dependent trends reported by Deng et al.'s research. 32 This was primarily due to an increase in temperature in the shear deformation zone caused by the increase in Vc, which led to thermal softening of the material and a decrease in YS, and consequently, a lower cutting force.
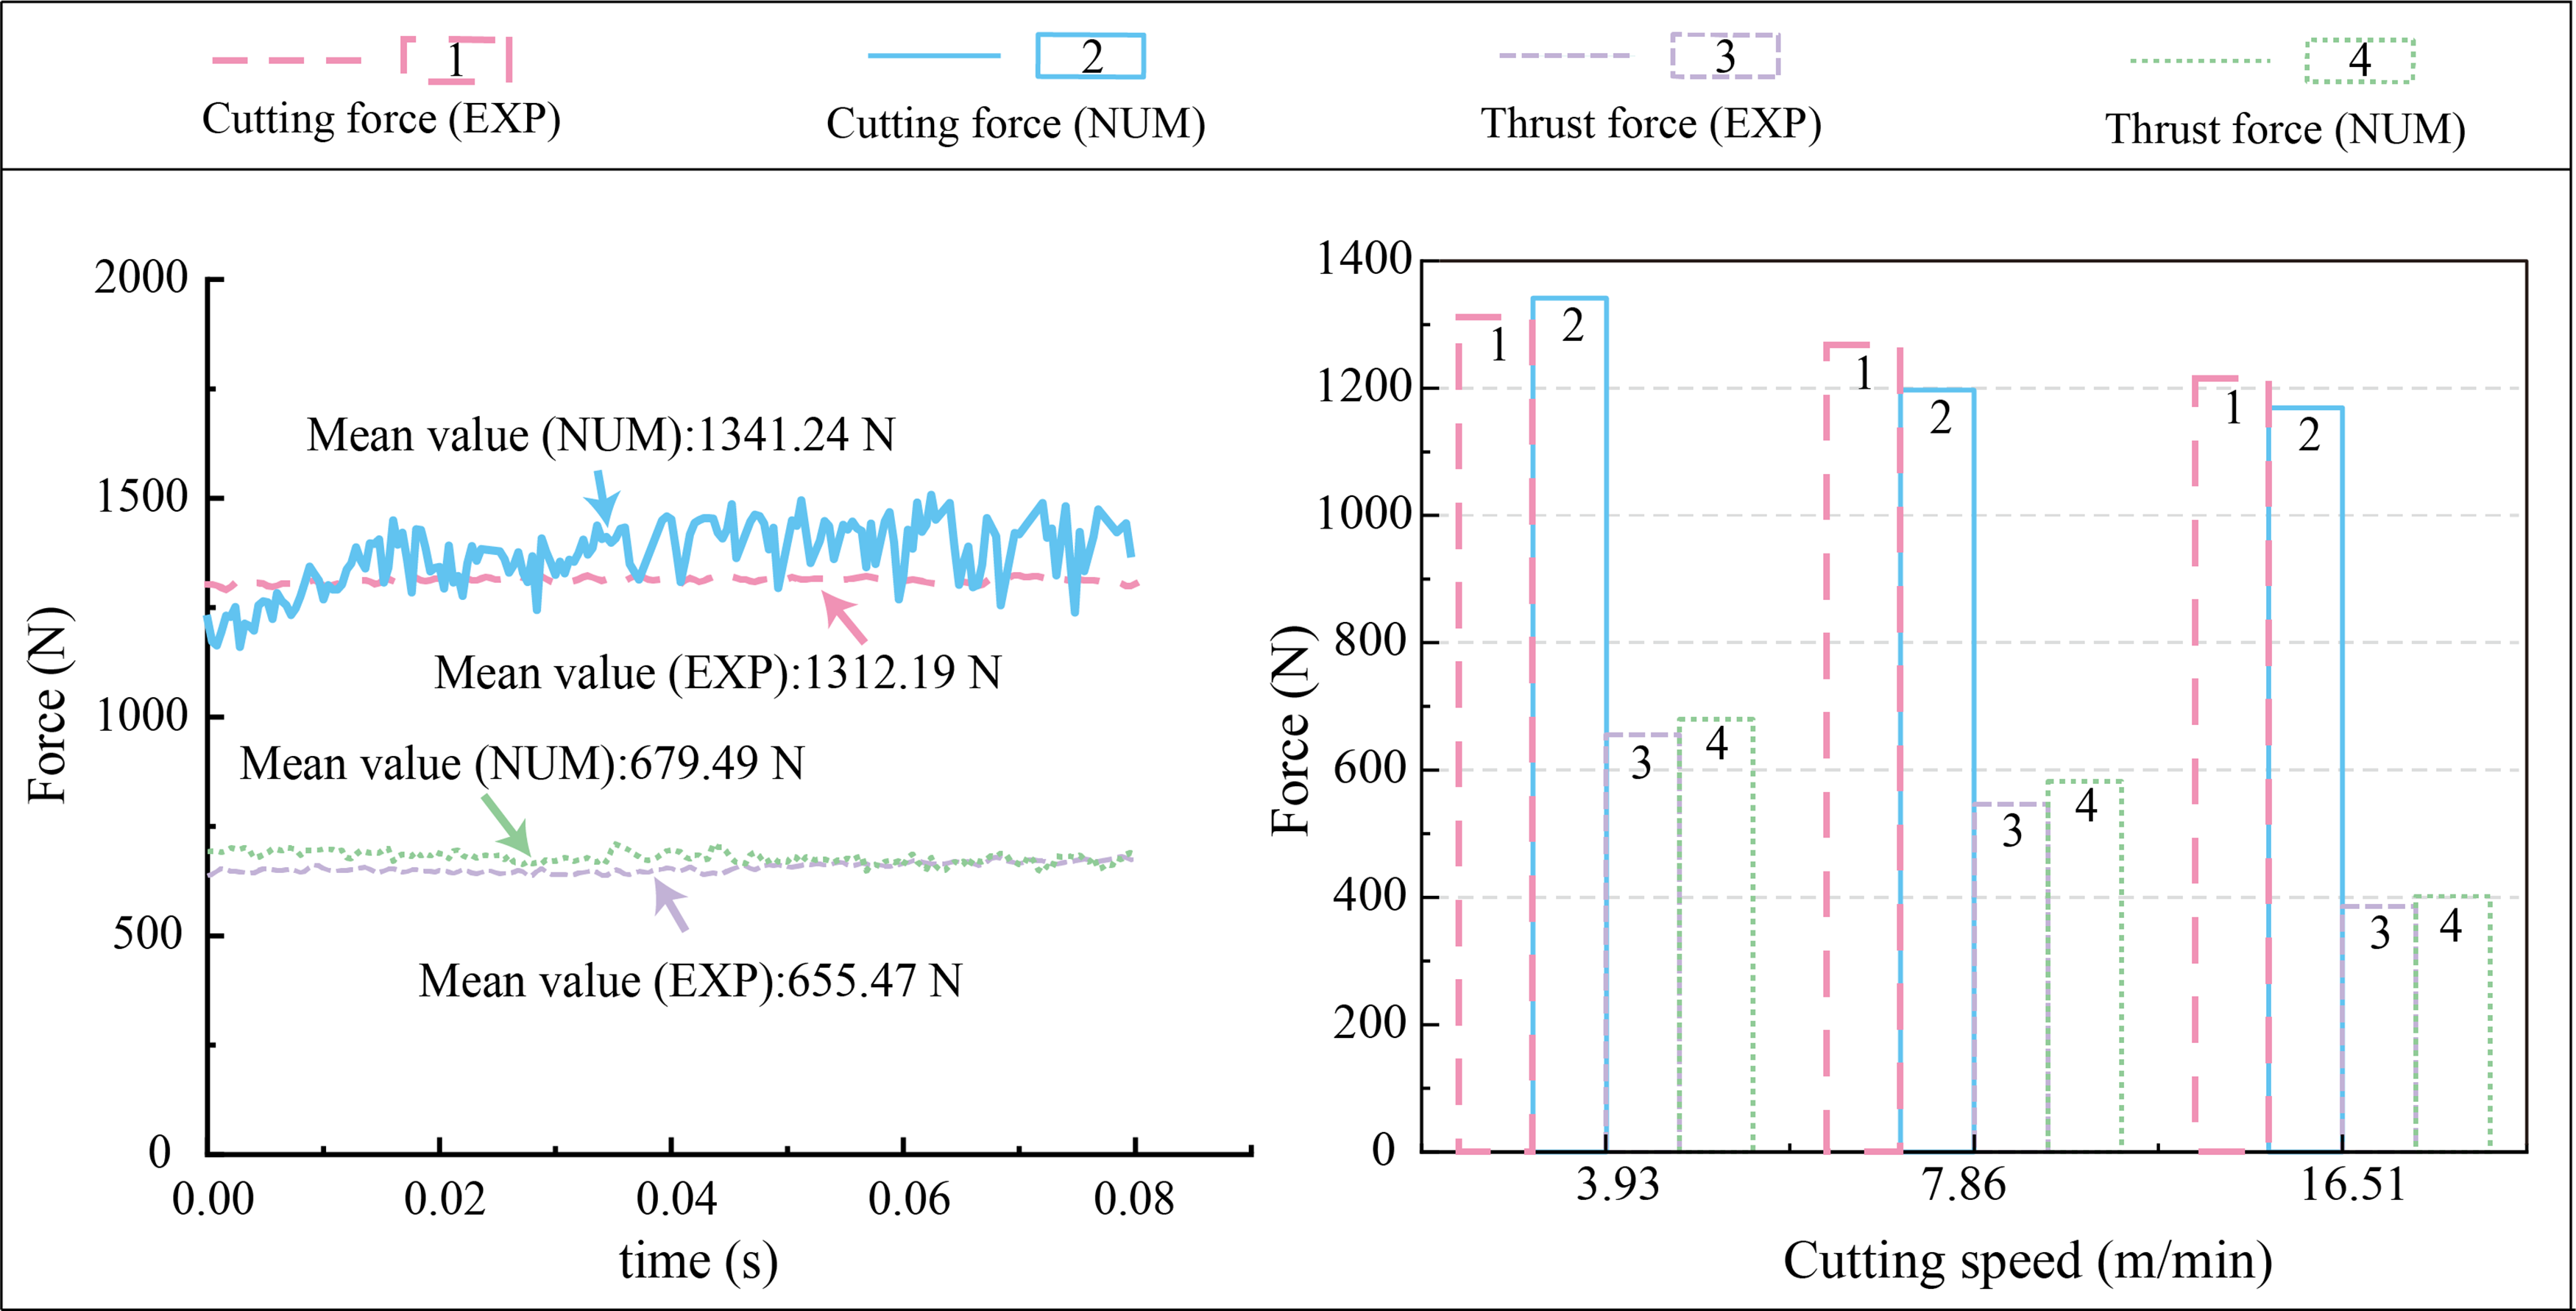
Cutting force and thrust results at different Vc.
Finite element simulation results
As illustrated in Figure 5, the simulation results of effective strain, strain rate, and temperature distribution during CT-LSEM at Vc of 3.93, 7.86, and 16.51 m/min showed that high strain-rate regions were mainly concentrated in the shear deformation zone. With increasing Vc, this region expanded markedly and deformation rates intensified, with maximum values of 320, 656, and 873 s−1, exhibiting near-linear growth, consistent with Kumar et al. 33 Temperature results further revealed that higher Vc accelerated heat accumulation in both the primary and secondary deformation zones, elevating cutting temperature. Such thermal effects might have adversely influenced DRX, promoted grain growth, and degraded mechanical properties.
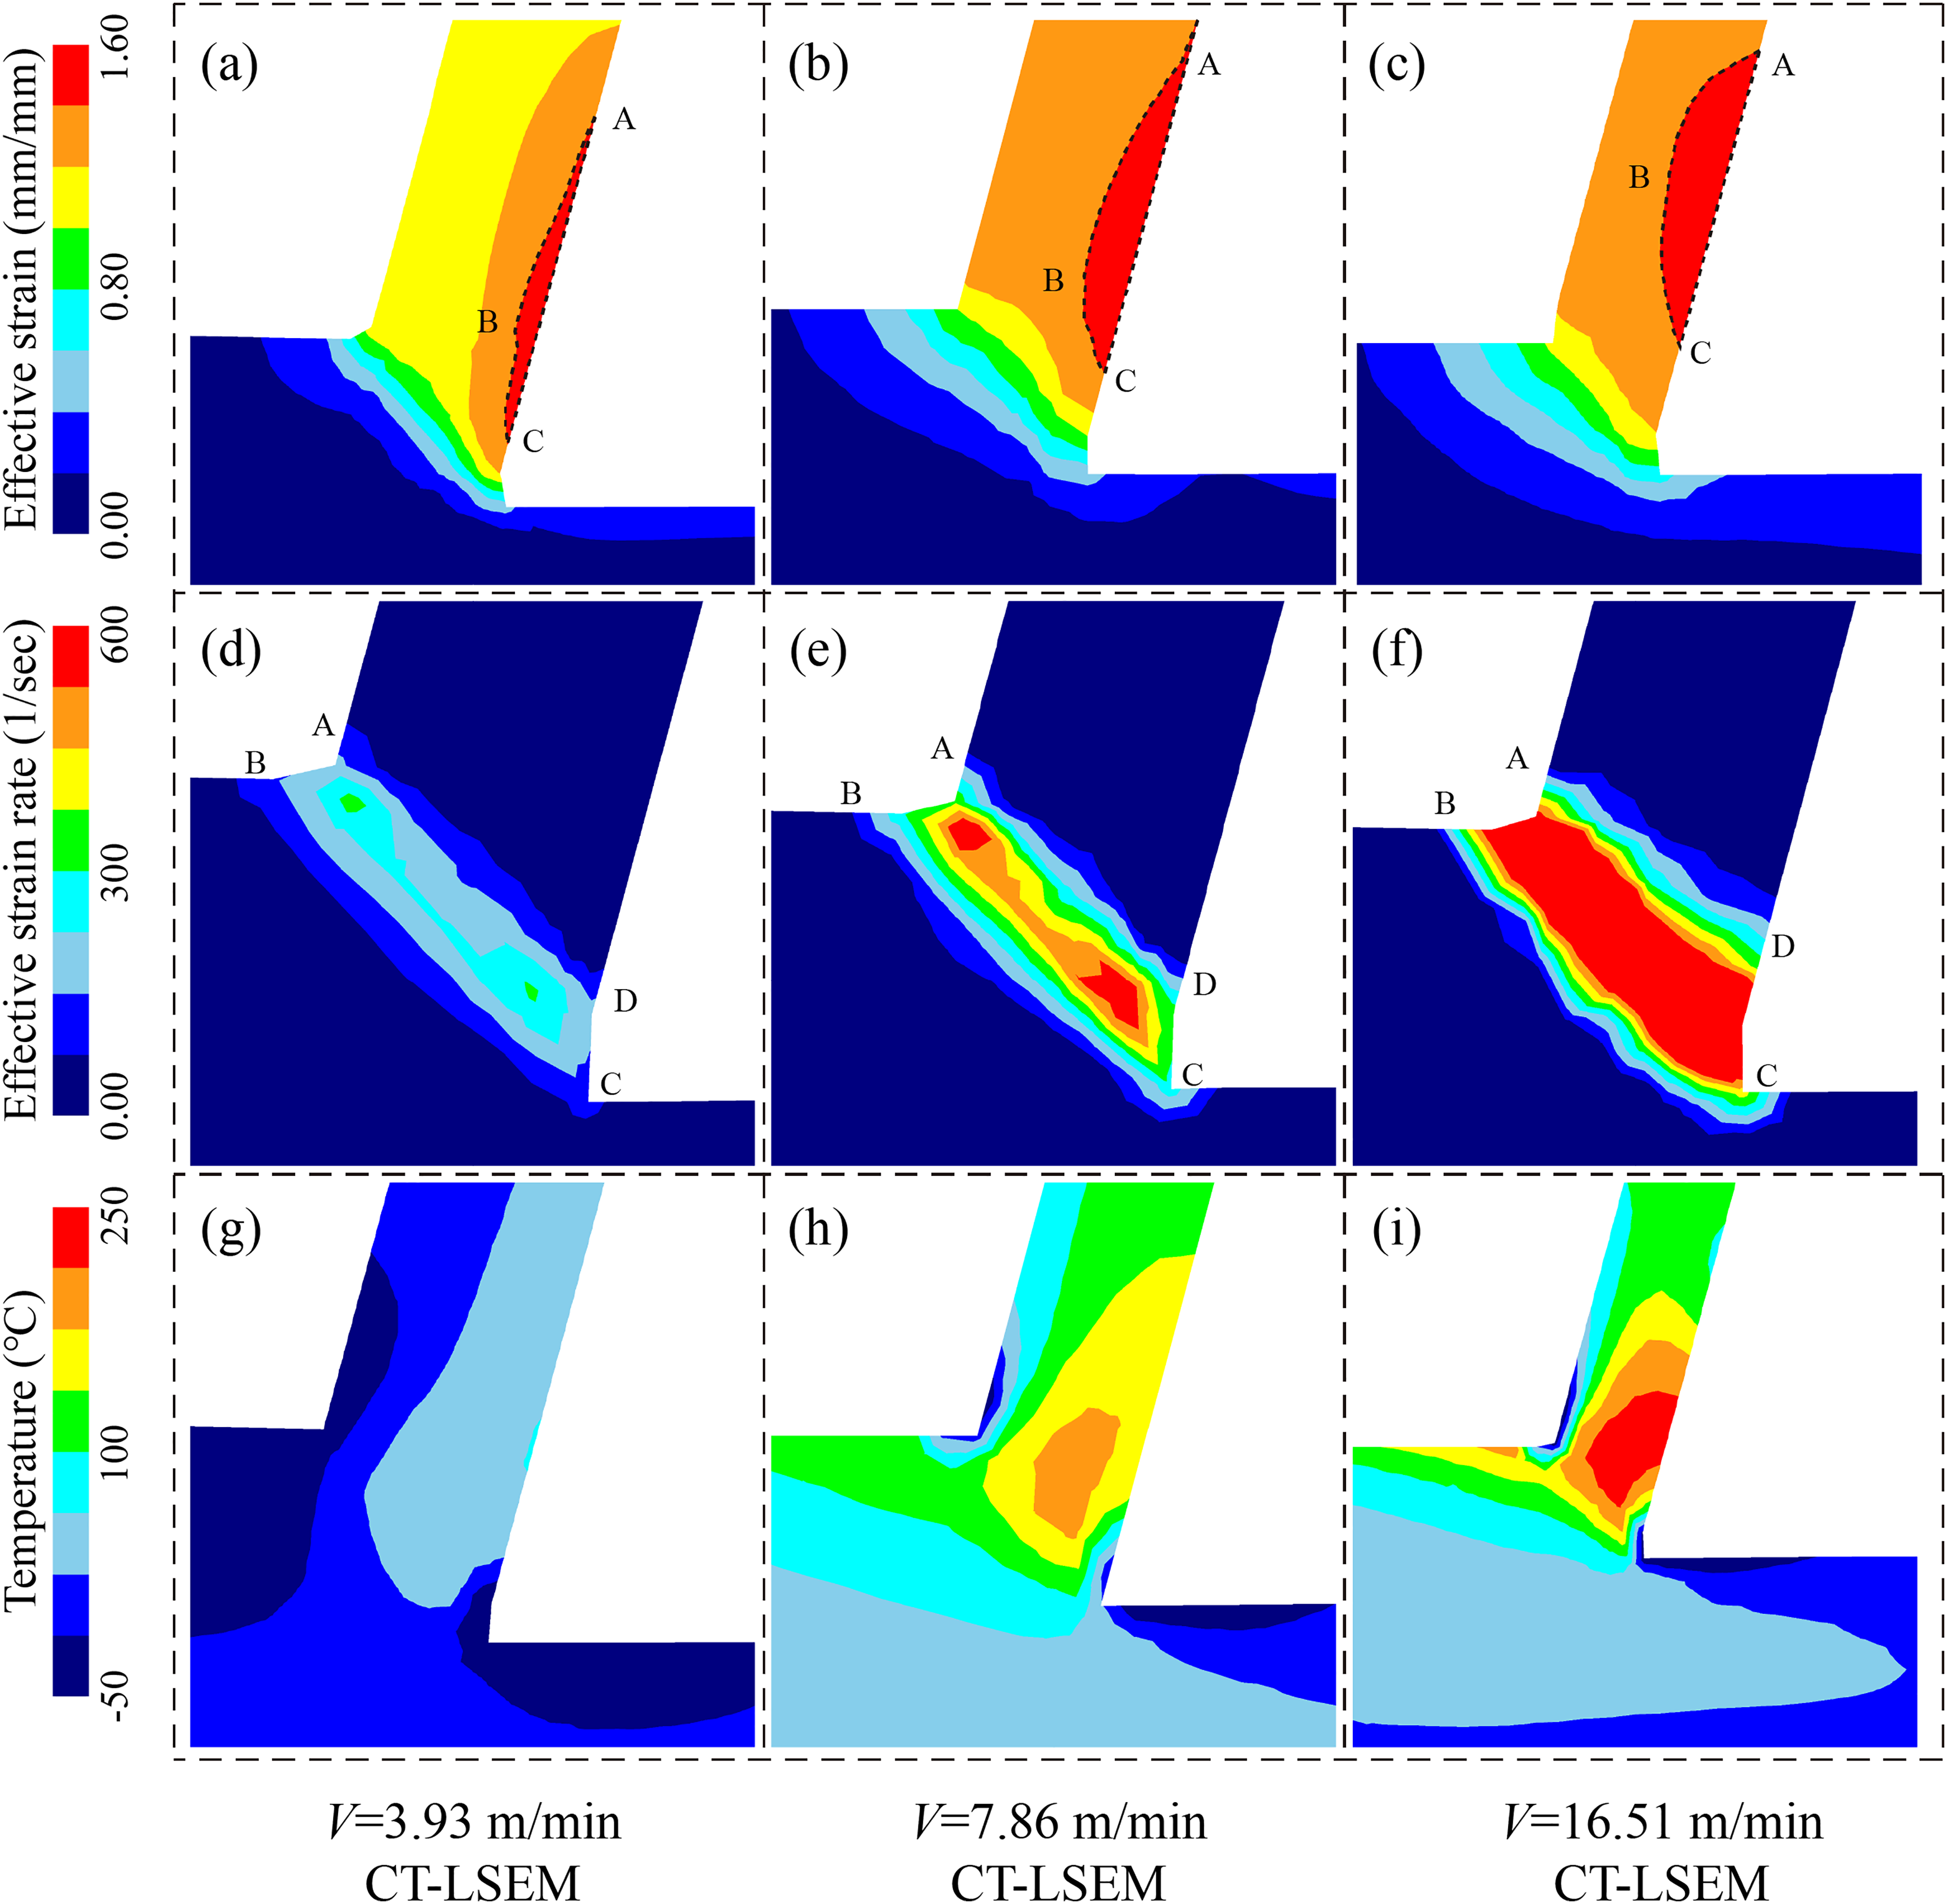
Finite element simulation results of strain, strain rate, and temperature.
To further investigate the effect of environmental temperature on deformation behavior, Figure 6 compared effective strain, strain rate, and temperature distributions under CT-LSEM and RT-LSEM at a Vc of 3.93 m/min. The maximum strain rates were similar (320 s−1 vs. 310 s−1), indicating that low temperature did not hinder plastic deformation. In contrast, temperature differed markedly: RT-LSEM reached 142.79 °C, while CT-LSEM dropped to 19.67 °C, an 86% reduction. This demonstrated that cryogenic conditions effectively suppressed heat accumulation, slowed dynamic recovery and recrystallization, and promoted dislocation retention and grain refinement.
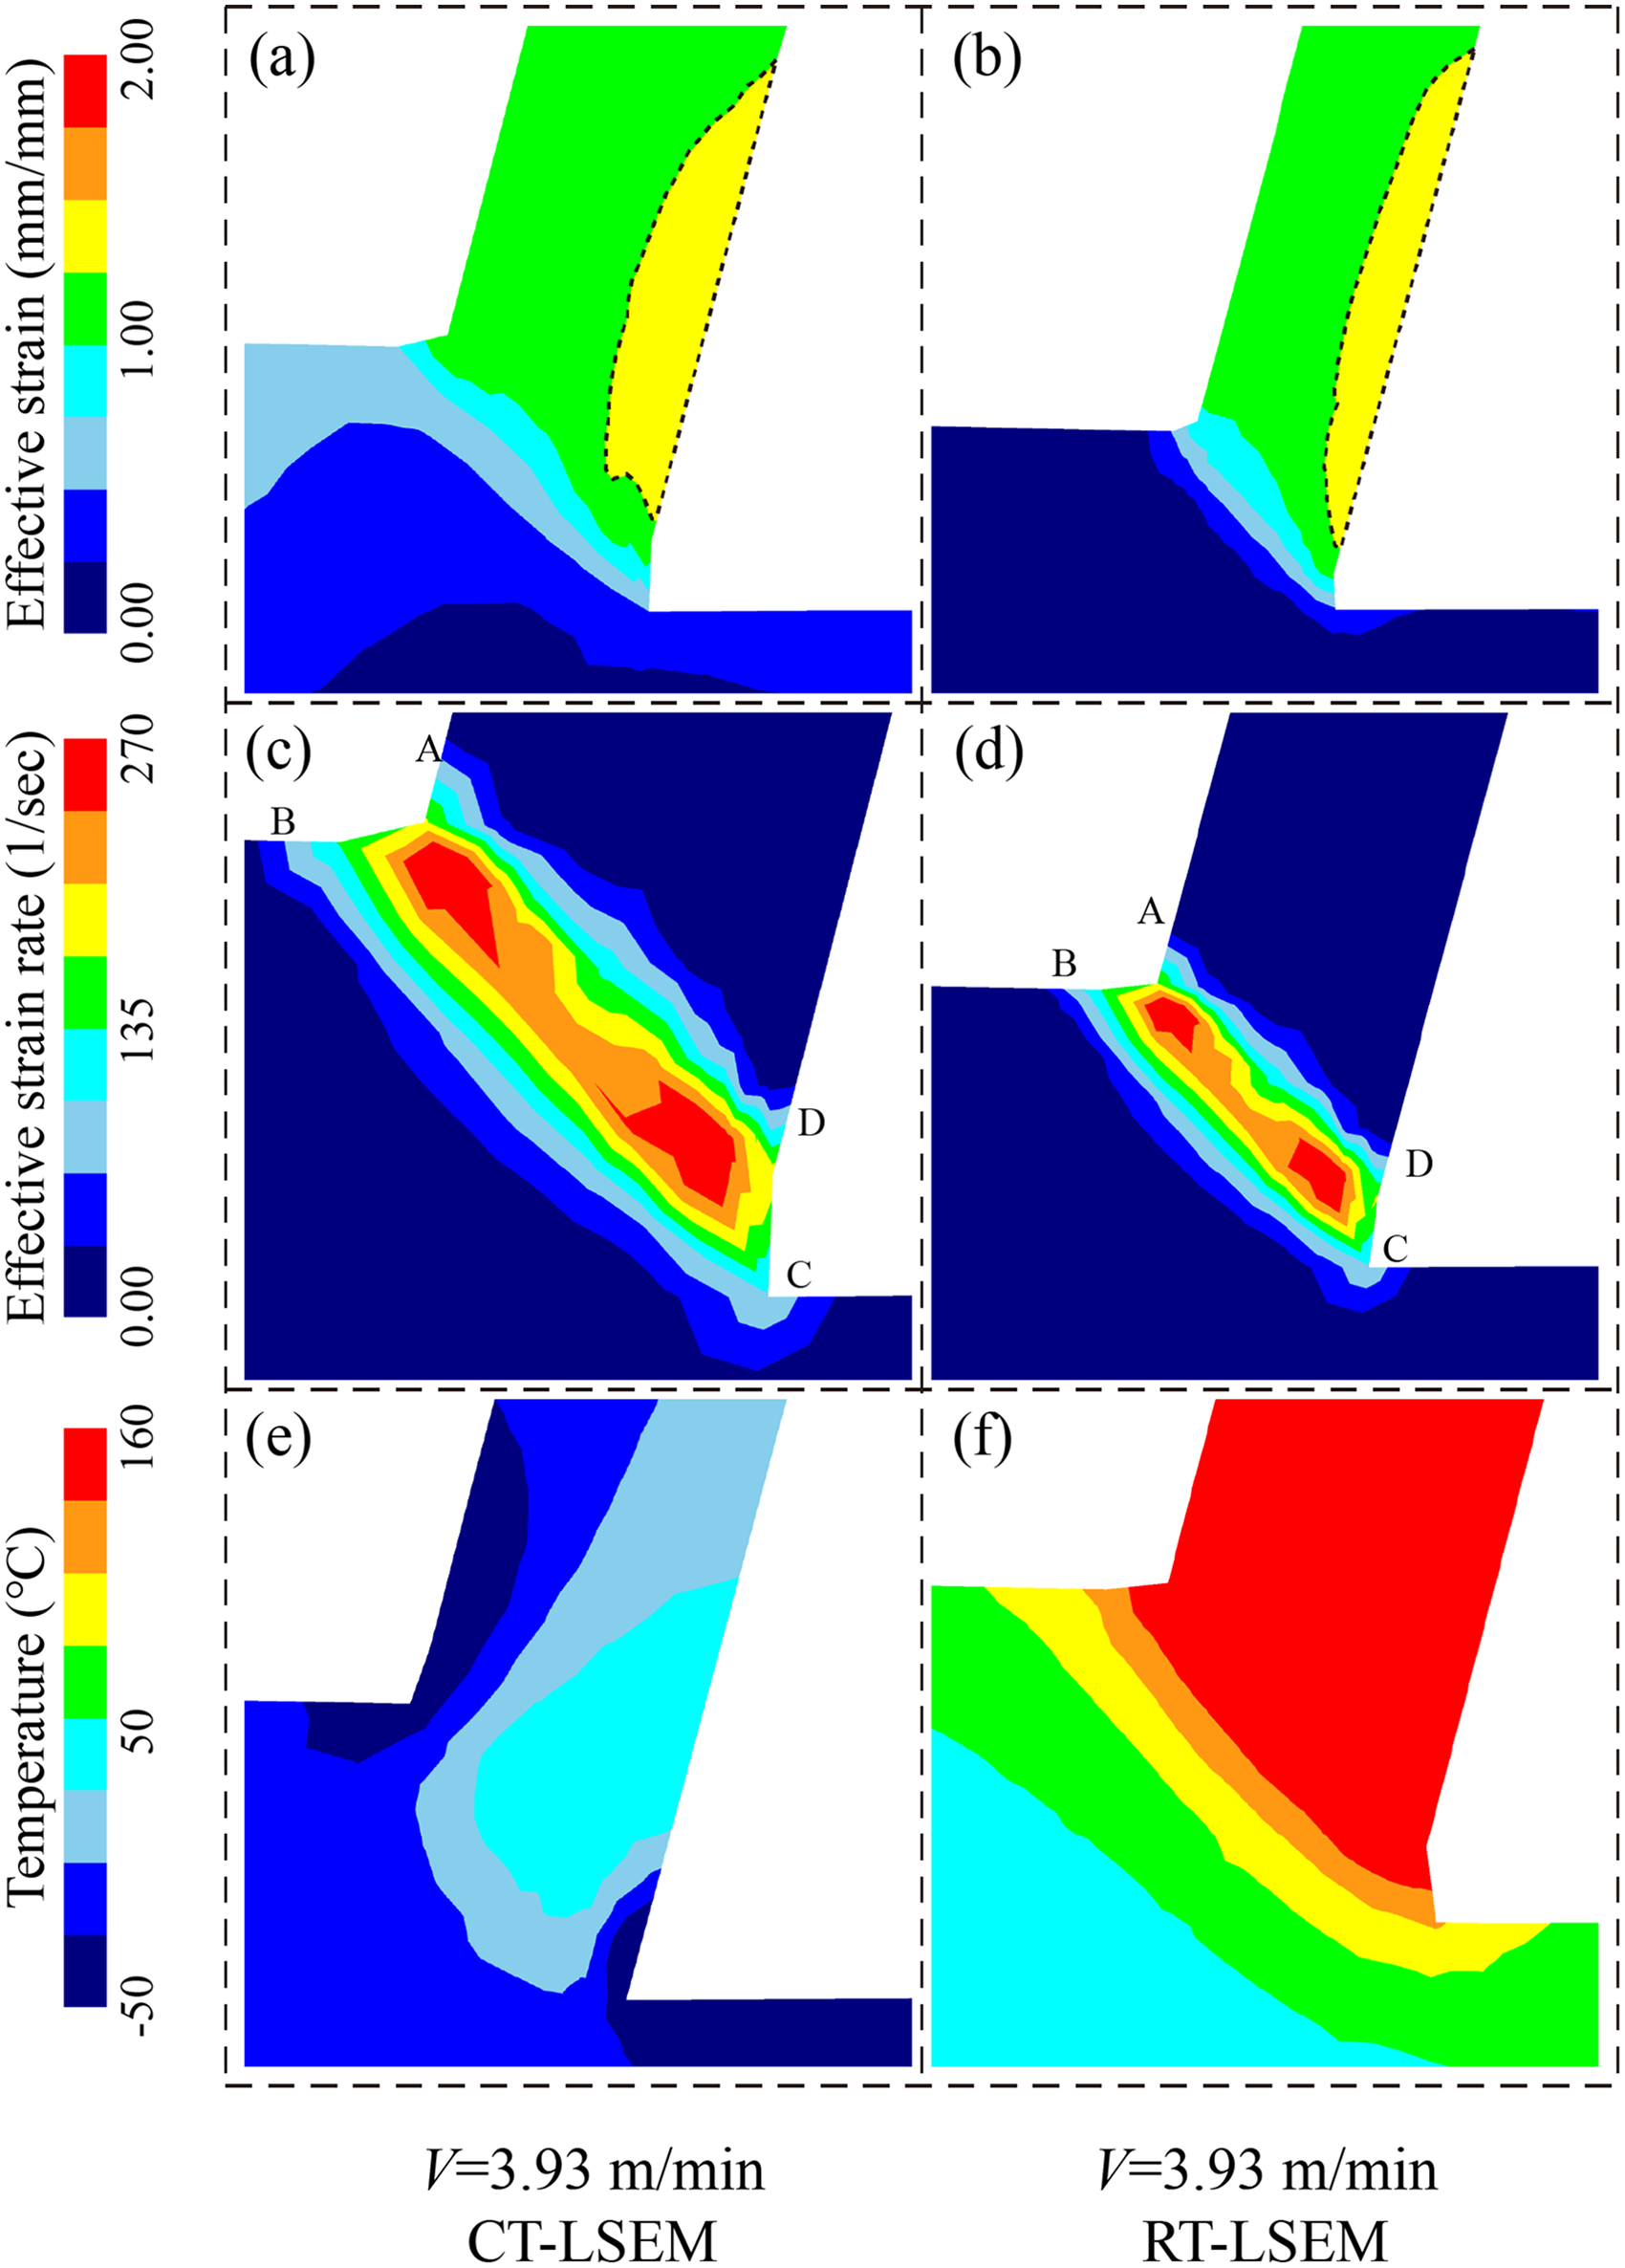
Comparison of strain, strain rate, and temperature distributions between CT-LSEM and RT-LSEM.
As Vc increased, the maximum effective strain rose from 1.49 to 1.56, reflecting intensified deformation at the tool tip. CT-LSEM and RT-LSEM showed similar maximum strain values (1.49 vs. 1.47), but CT-LSEM inhibited recovery mechanisms, favoring the preservation of high dislocation density and deformation twins. In summary, Vc significantly influenced microstructural evolution by regulating deformation rate and thermal input, while the cryogenic environment suppressed temperature rise and DRX.
Microstructure of CP Ti
As illustrated in Figure 7(a), the original CP Ti exhibited a coarse-grained microstructure with well-defined boundaries and an average grain size of 31 μm. During CT-LSEM at a Vc of 3.93 m/min (Figure 7(b)), severe plastic deformation under high strain and strain rate conditions promoted notable grain refinement. The initial coarse grains elongated and fractured under shear, while regions with high strain accumulation fragmented further, producing numerous fine equiaxed grains. Compared to the microstructure of the original sample, the CT-LSEM samples retained some near-original grain boundaries/subgrain boundaries while exhibiting an increased number of equiaxed grains and elongated grains (marked in blue and red). With increasing Vc, grain refinement intensified: elongated grains progressively fragmented and decreased in proportion, whereas equiaxed grains increased. Overall, CT-LSEM significantly accelerated microstructural evolution in CP Ti, producing two dominant features—fine equiaxed grains and elongated grains—whose proportions were strongly governed by Vc and strain conditions.

Images of CP Ti microstructure.
EBSD results
To gain deeper insight into the deformation mechanism, EBSD was performed on specimens subjected to CT-LSEM. The EBSD maps were colored based on the local normal direction relative to the crystal coordinate system. EBSD results confirmed the formation of two typical microstructures after CT-LSEM: elongated grains and equiaxed grains, shown in Figure 8(a) to (c). The grain size distribution was quantitatively characterized using the equivalent circle diameter method, which is more appropriate for the observed bimodal microstructure. Figure 8(d) to (f) showed the grain size distribution at varying Vc, with measured values of 0.94 μm at 16.51 m/min, 1.09 μm at 7.86 m/min, and 1.29 μm at 3.93 m/min. The grain size determination for the final simulation incorporated data from 100 uniformly distributed sampling points extracted along the thickness direction of the stabilized strip, with the mean value representing the characteristic grain dimension. The corresponding average grain sizes from finite element simulations were shown in Figure 8(g) to (i). Numerical simulations yielded grain sizes of 1.12 μm, 0.96 μm, and 0.87 μm under the corresponding conditions. As the Vc increased, the strips in the CT-LSEM process experienced greater strain and higher strain rate, leading to further grain refinement. The simulated results showed a similar trend, with discrepancies from EBSD measurement remaining below 15%, thus effectively validating the accuracy of the finite element grain size prediction. These results provided strong experimental validation for the computational grain size prediction model, confirming its ability to accurately simulate the velocity-dependent grain refinement behavior during CT-LSEM processing.
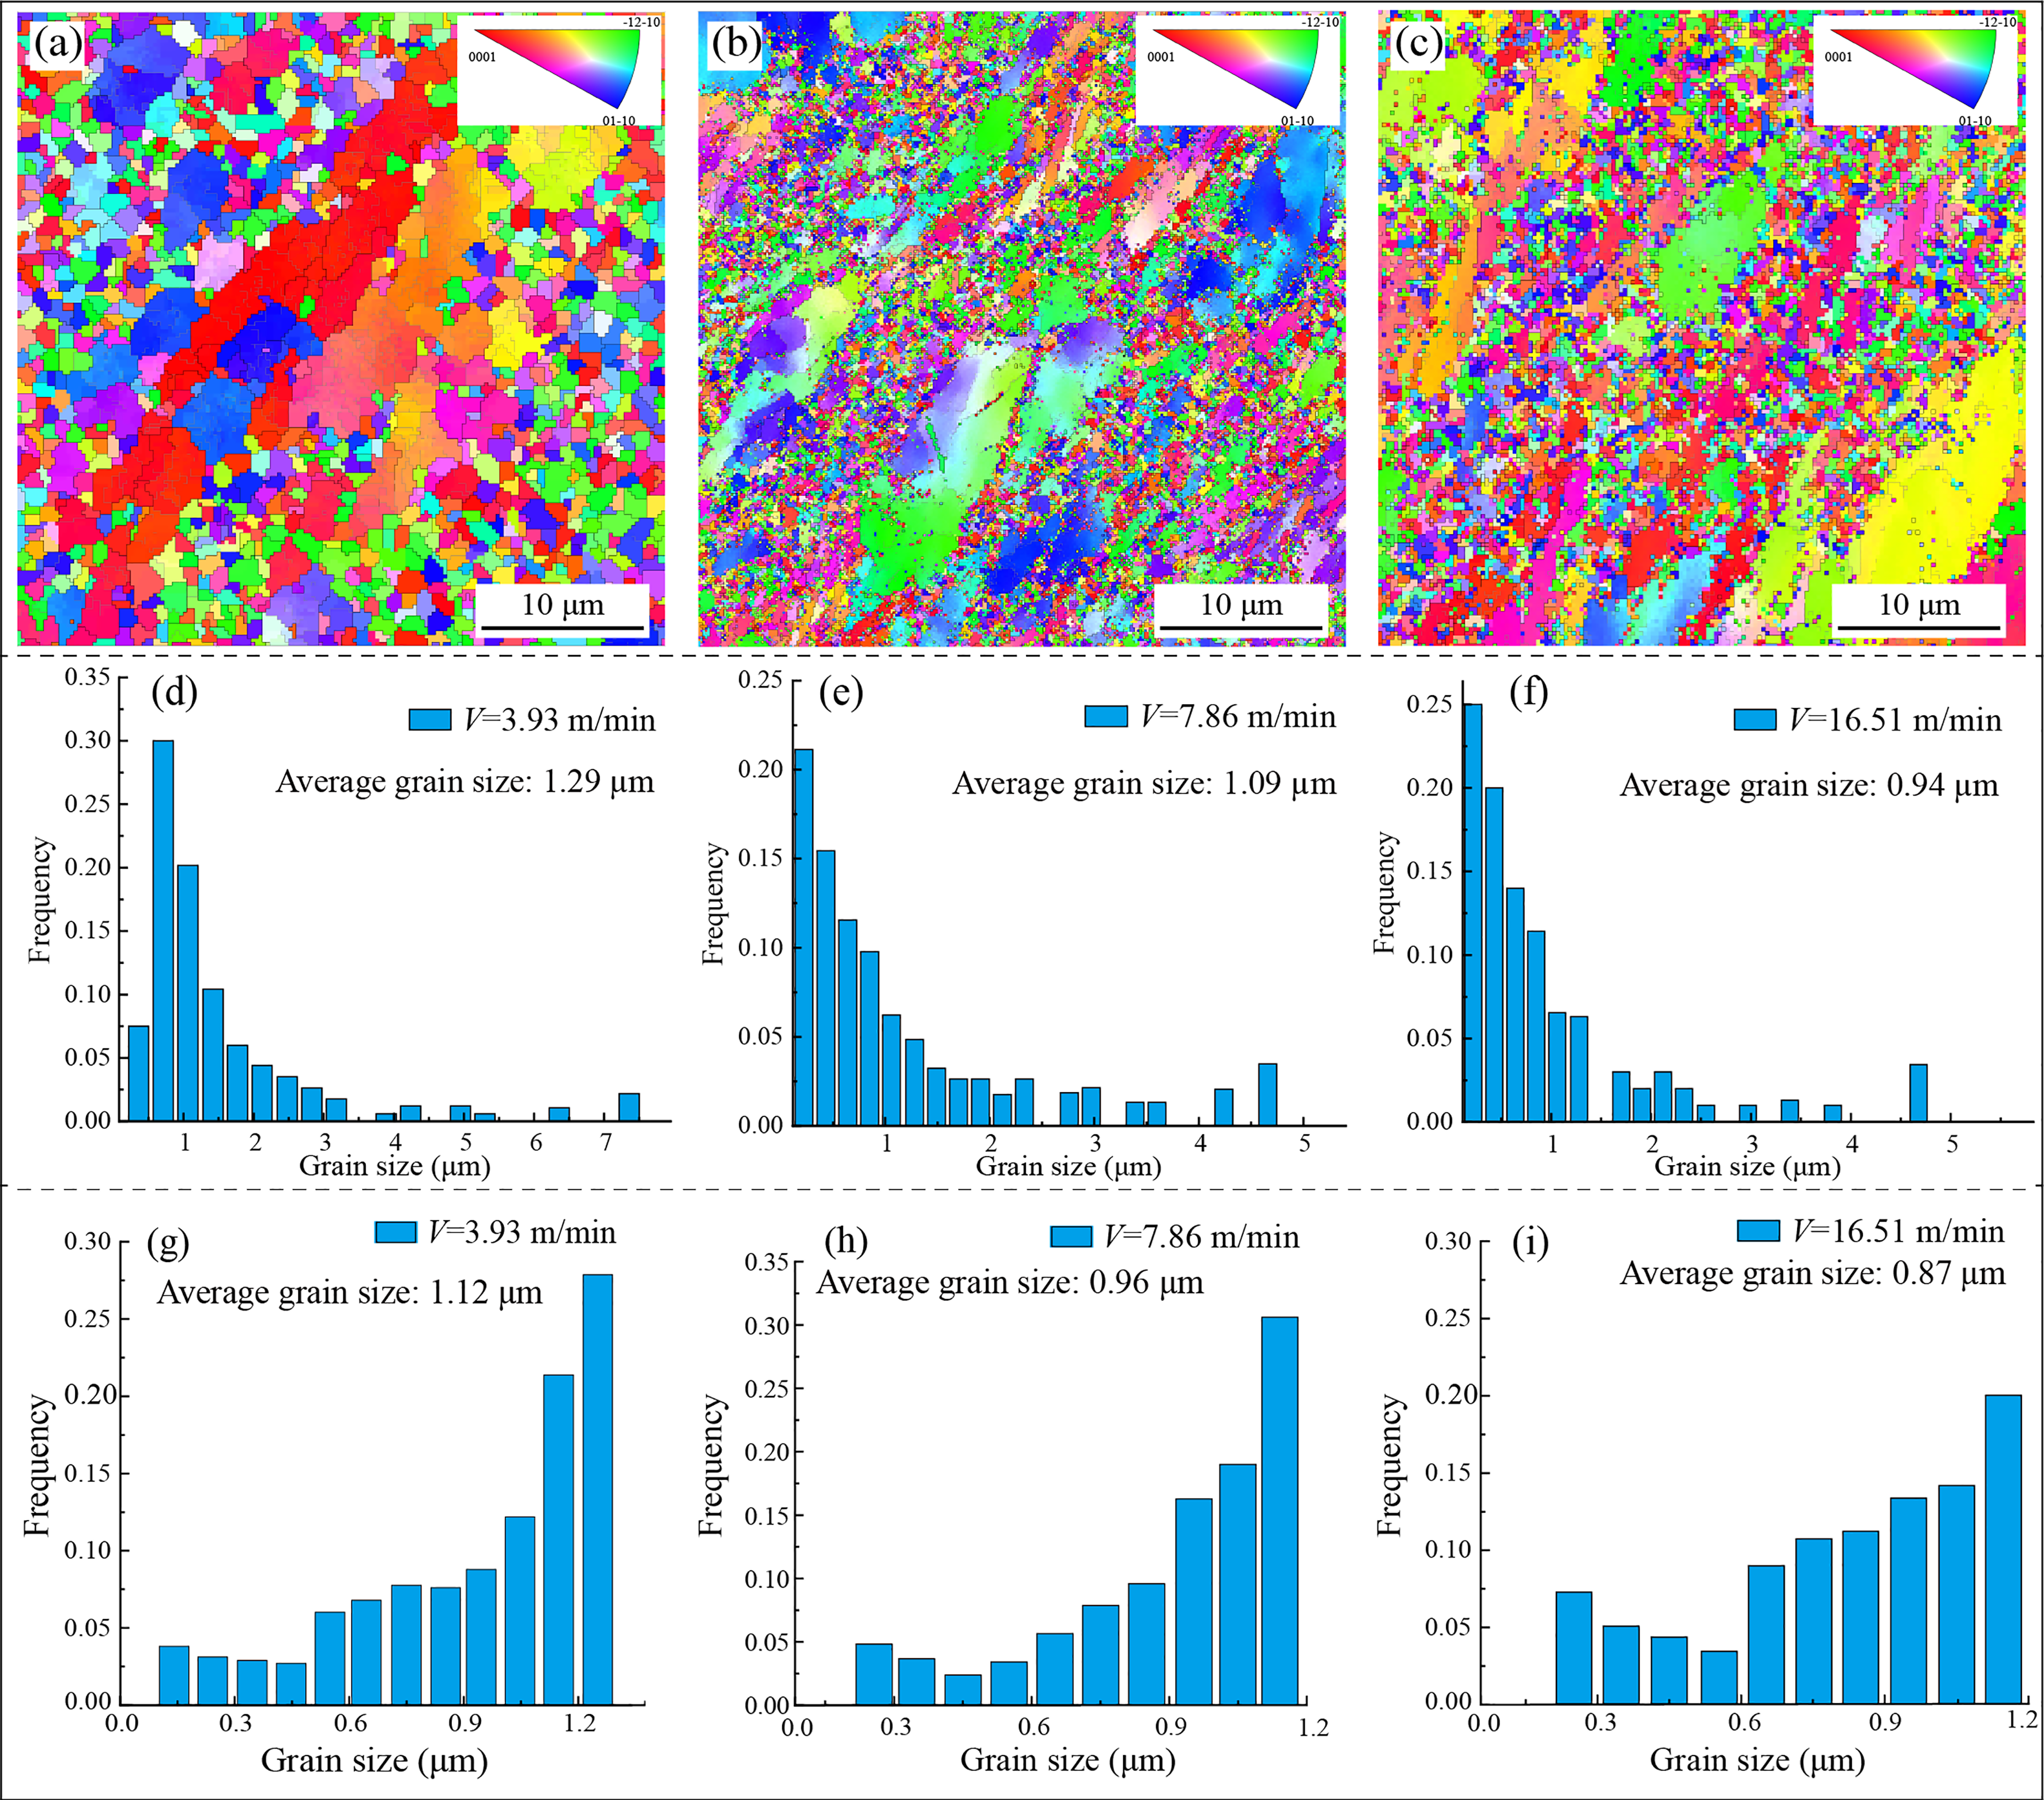
EBSD analysis and finite element simulation of grain size evolution in chips produced by the CT-LSEM process at different Vc. (a–c) EBSD microstructure maps of chips obtained at different Vc. (d–f) Corresponding EBSD-derived grain size maps for the three Vc. (g-i) Finite element simulation results of grain size distribution at the same Vc.
Texture results
Figure 9 presented the crystallographic texture analysis through both pole figures (PF) and inverse pole figures (IPF) derived from EBSD measurements, revealing the orientation distribution characteristics of the processed microstructure. The grain texture of the strip exhibited a distinct evolutionary trend with varying Vc, as shown in Figure 9. To properly interpret the textural data induced by the simple shear deformation mode inherent to the CT-LSEM process, the experimental pole figures were rotated by the calculated shear angle (ϕ = 52.5°) to align their principal directions with the shear direction (SD) and the shear plane normal (SPN). The grain texture of the strips exhibited a distinct evolutionary trend with varying Vc. As shown in Figure 9(a), at a Vc of 3.93 m/min, the {0001} basal poles predominantly tilted towards the SPN, forming a characteristic basal shear texture for HCP metals with a maximum intensity of 2.19 m.r.d. When Vc increased to 7.86 m/min (Figure 9(b)), the orientation of the basal poles further concentrated, shifting to align more closely with the theoretical ideal shear orientations, resulting in an elevated peak intensity of 2.85 m.r.d. At 16.51 m/min (Figure 9(c)), this shear texture was significantly strengthened; the basal poles became heavily concentrated near the SPN, and the maximum intensity increased to 3.32 m.r.d. This texture evolution primarily stemmed from changes in the strain rate field and the simple shear deformation geometry. The increase in Vc directly elevated the strain rate during the CT-LSEM process, which strongly promoted the preferential activation of the {0001} ⟨11−20⟩ basal slip systems along the primary shear plane.
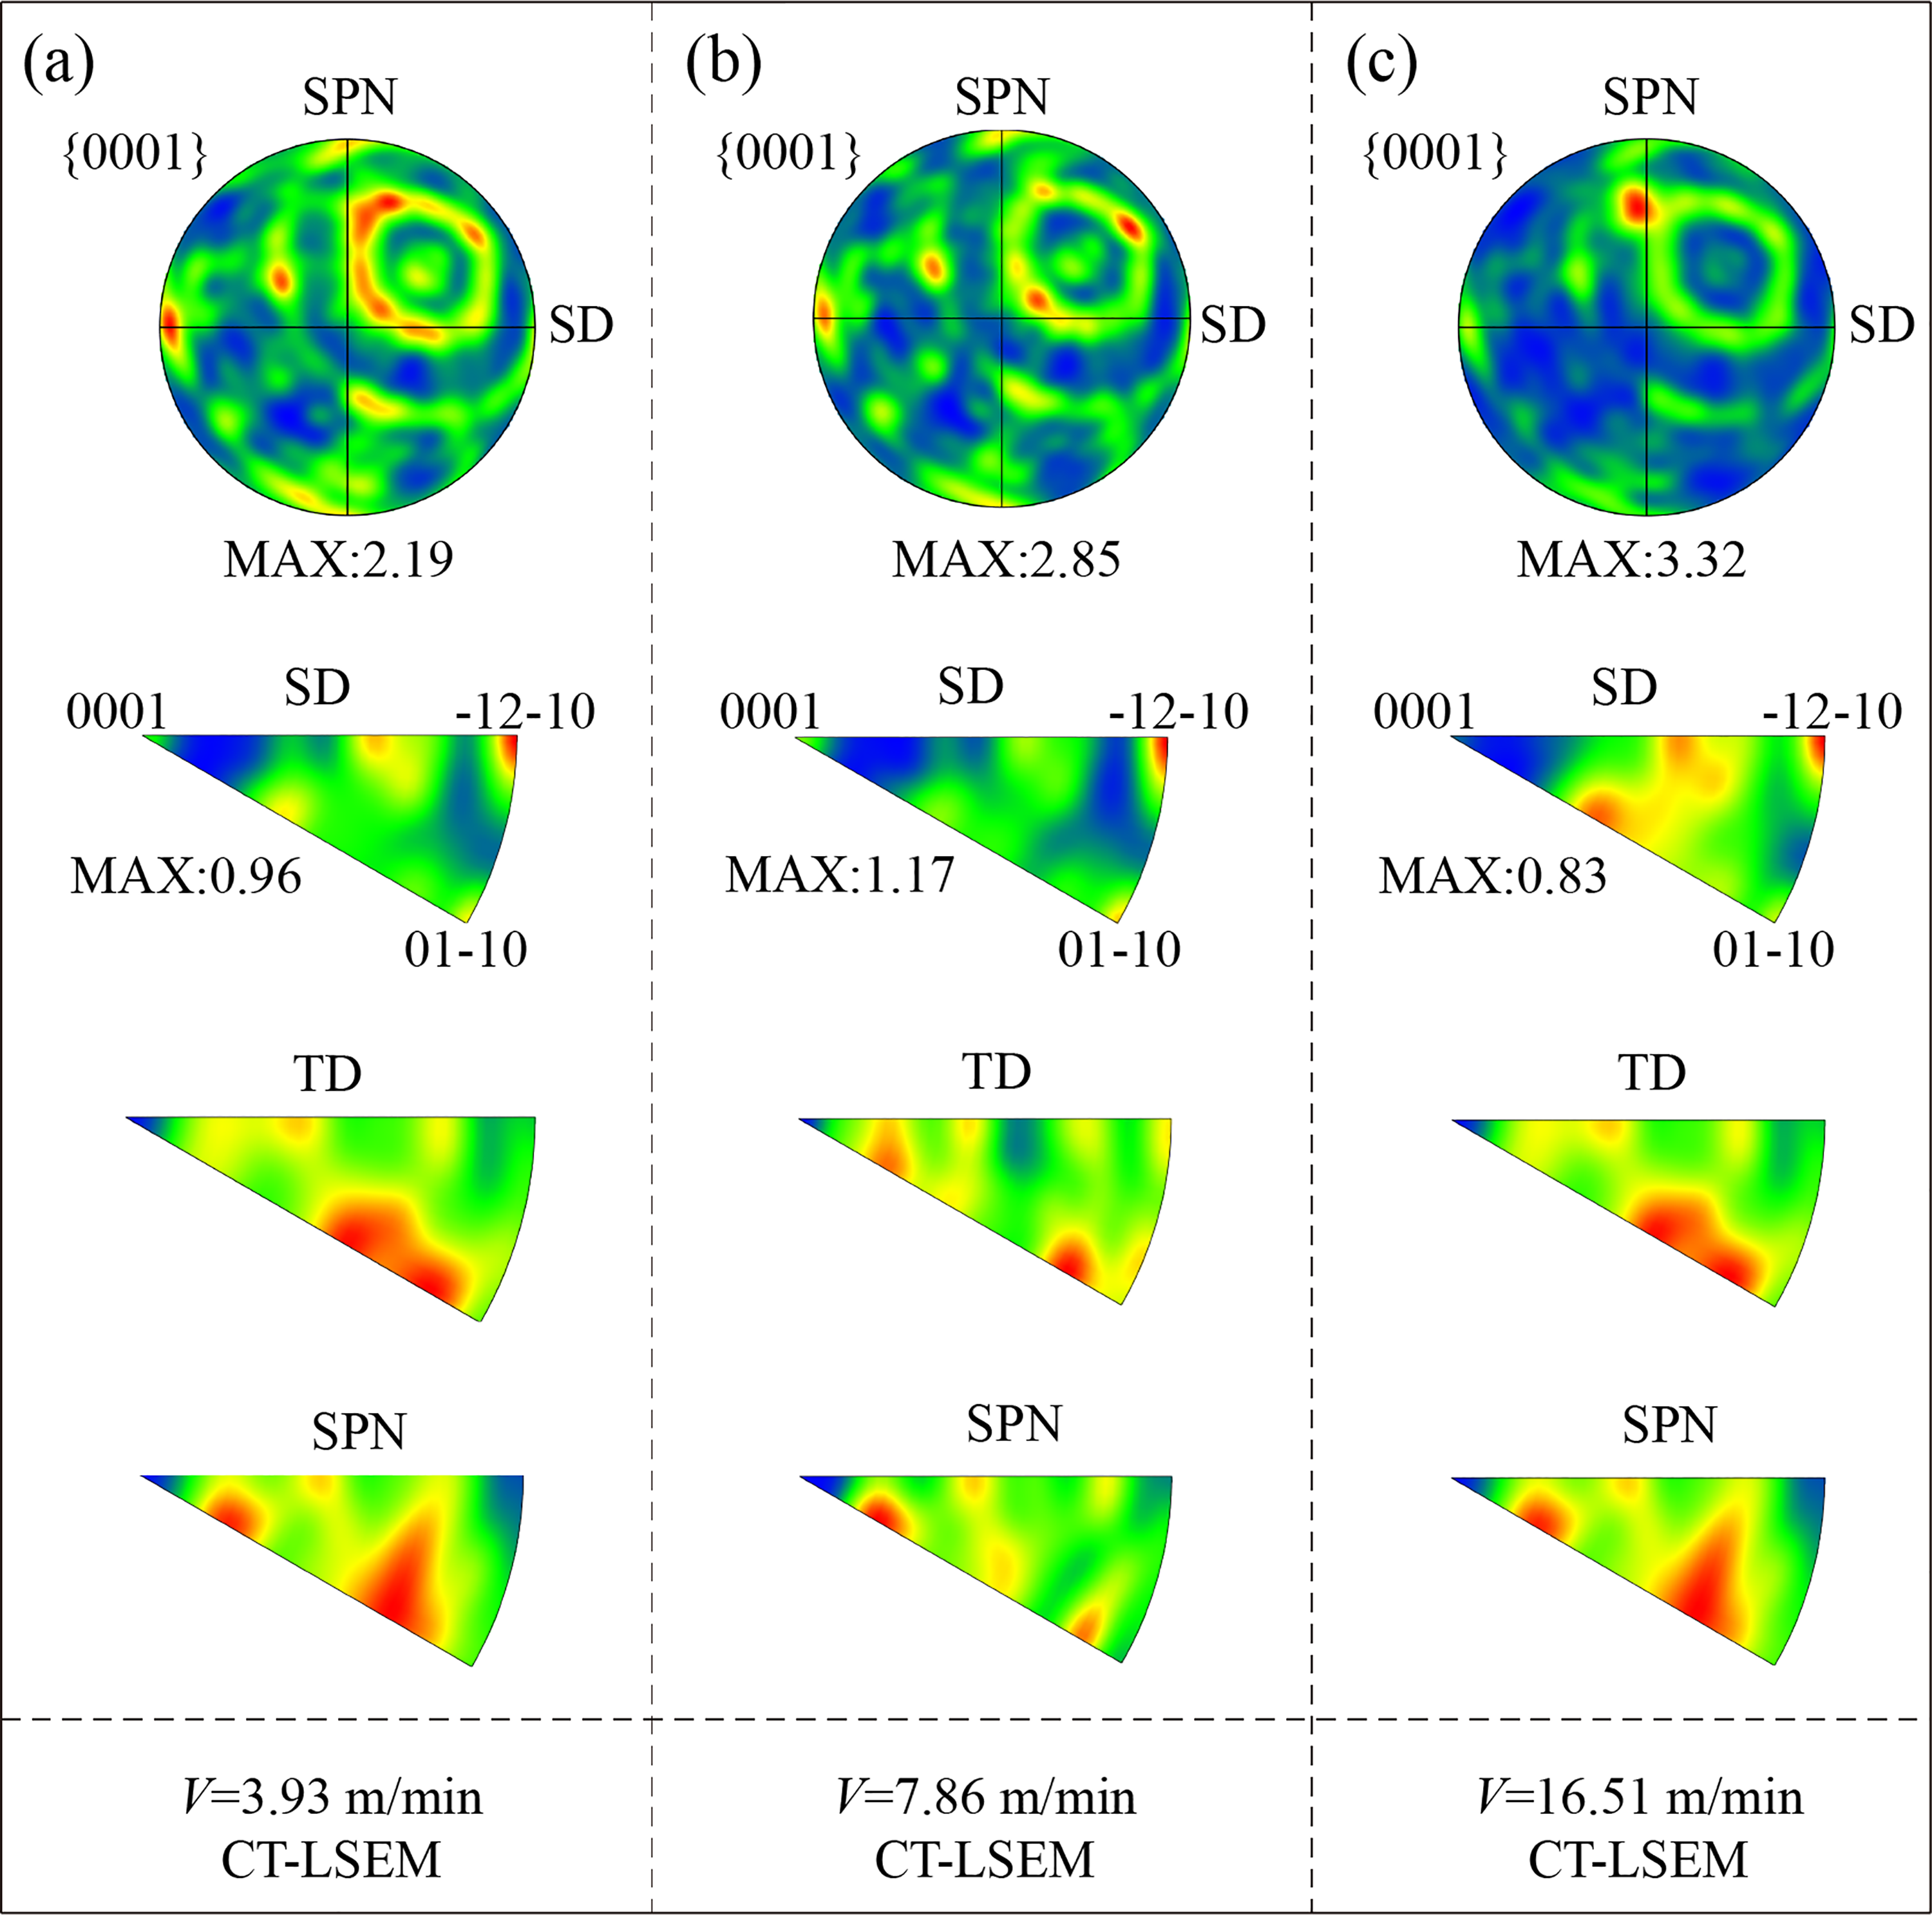
Texture evolution (PFs and IPFs) at different Vc.
Concurrently, high strain rate conditions suppressed DRX behavior, reducing the likelihood of random grain orientation. Even when DRX occurred, newly formed grains tended to activate basal slip planes, resulting in a texture with pronounced orientation. Therefore, higher Vc led to stronger texture orientation. In summary, Vc strongly influenced strip texture by regulating slip mechanisms and recrystallization, providing an effective method to tailor material properties.
Mechanical properties
Figure 10(a) presented the Vickers hardness distribution across CT-LSEM processed chips as a function of Vc, with the central region (A-B) serving as the characterized zone to maintain consistency with experimental measurement protocols. Figure 10(b) indicated a direct correlation between the increased Vc and hardness. At cutting speeds of 3.93, 7.86, and 16.51 m/min, the average hardness of the ultrafine-grained strips was 208.9, 218.3, and 224.9 HV, respectively. These values were significantly higher than the initial material's hardness of 165 HV, representing an increase of up to 36.3%. Comparison with finite element simulation results showed strong agreement, with a maximum error of 1.1%. This result provided robust validation of the finite element model's predictive capability for hardness. Similarly, the experimental results for RT-LSEM showed a consistent trend in hardness variation.
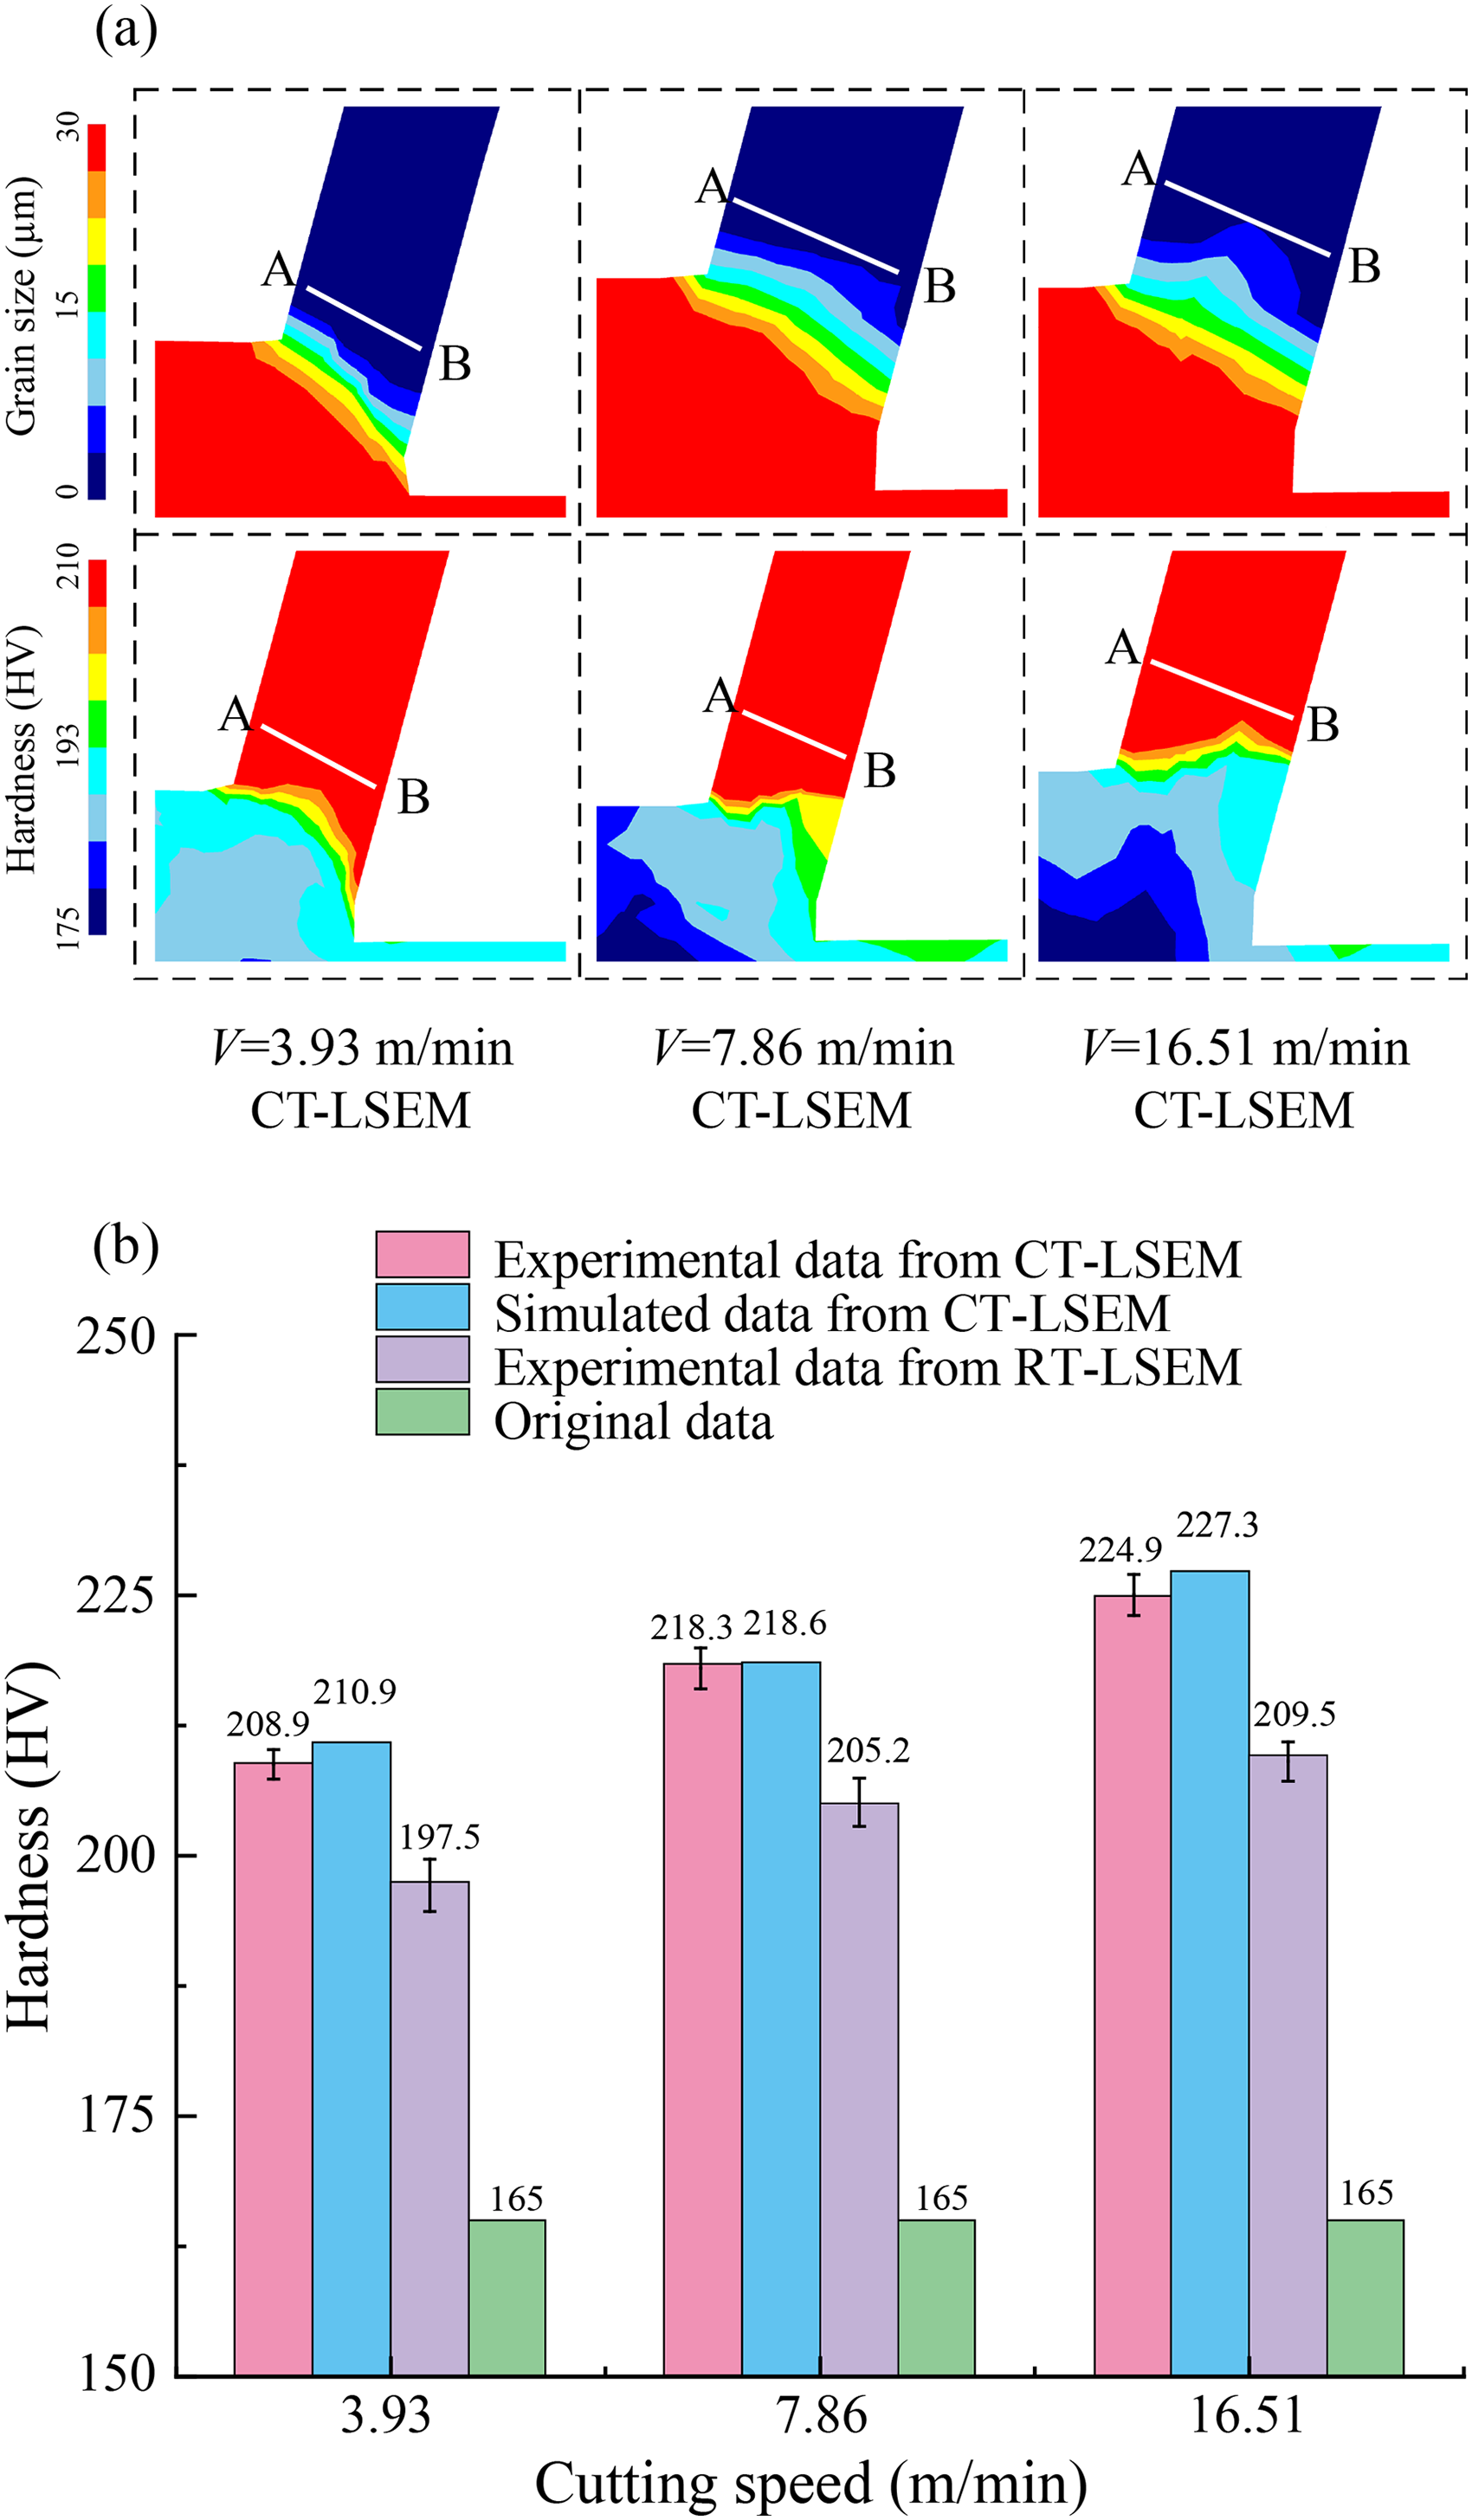
Hardness experiments and simulation comparisons at different Vc.
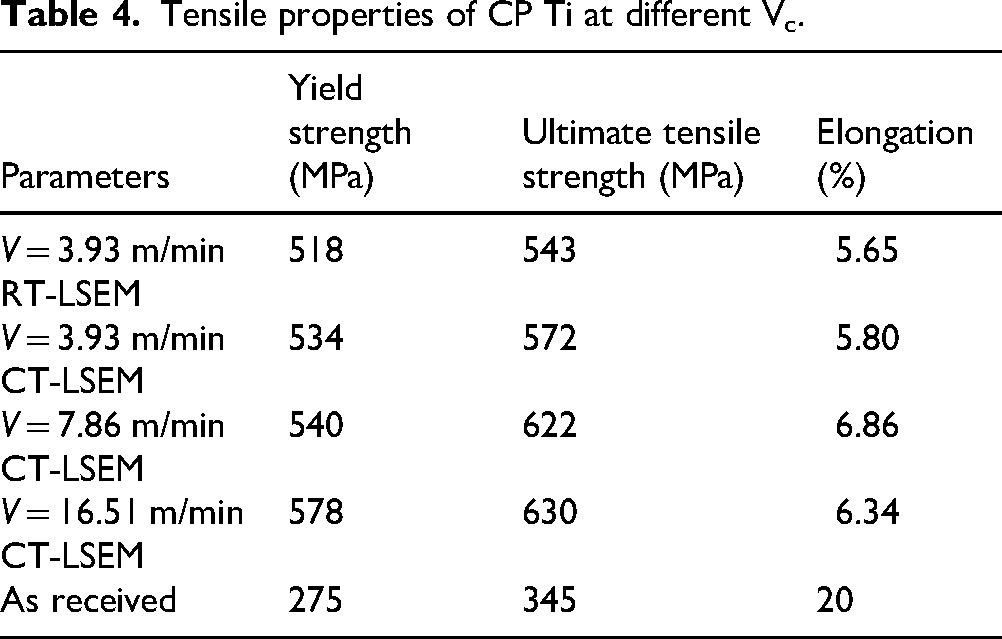
The engineering stress-strain curves of the specimens processed via CT-LSEM and RT-LSEM are presented in Figure 11. To ensure accuracy, the raw strain data, initially derived from crosshead displacement, were corrected by accounting for the testing machine's frame compliance. The corresponding mechanical properties, including 0.2% yield strength (YS), ultimate tensile strength (UTS), and fracture elongation (EL), are quantitatively summarized in Table 4. The YS values reached 534, 540, and 578 MPa at Vc of 3.93, 7.86, and 16.51 m/min, respectively, which were at least 94.2% higher than the as-received material. However, elongation decreased to 5.80%. Both YS and UTS increased with Vc, with maximum gains of 110.2% and 82.6% at 16.51 m/min. The RT-LSEM specimens at 3.93 m/min exhibited YS and UTS of 518 and 543 MPa, representing increases of 88.4% and 57.4% over the initial state, but reductions of 3.0% and 5.1% compared to CT-LSEM. This indicated that low temperature promoted higher strengthening at the same Vc. Lin et al. 34 also observed that fracture elongation(EL) at low temperature was affected by strain rate and thermal activation, as different Vc activated distinct micro-mechanisms such as dislocation climb. Moreover, the enhanced dislocation generation and motion at high strain rates increased dislocation density, thereby strengthening work hardening and YS. Overall, CT-LSEM enabled higher strength, while careful control of Vc enhanced stability and product quality.
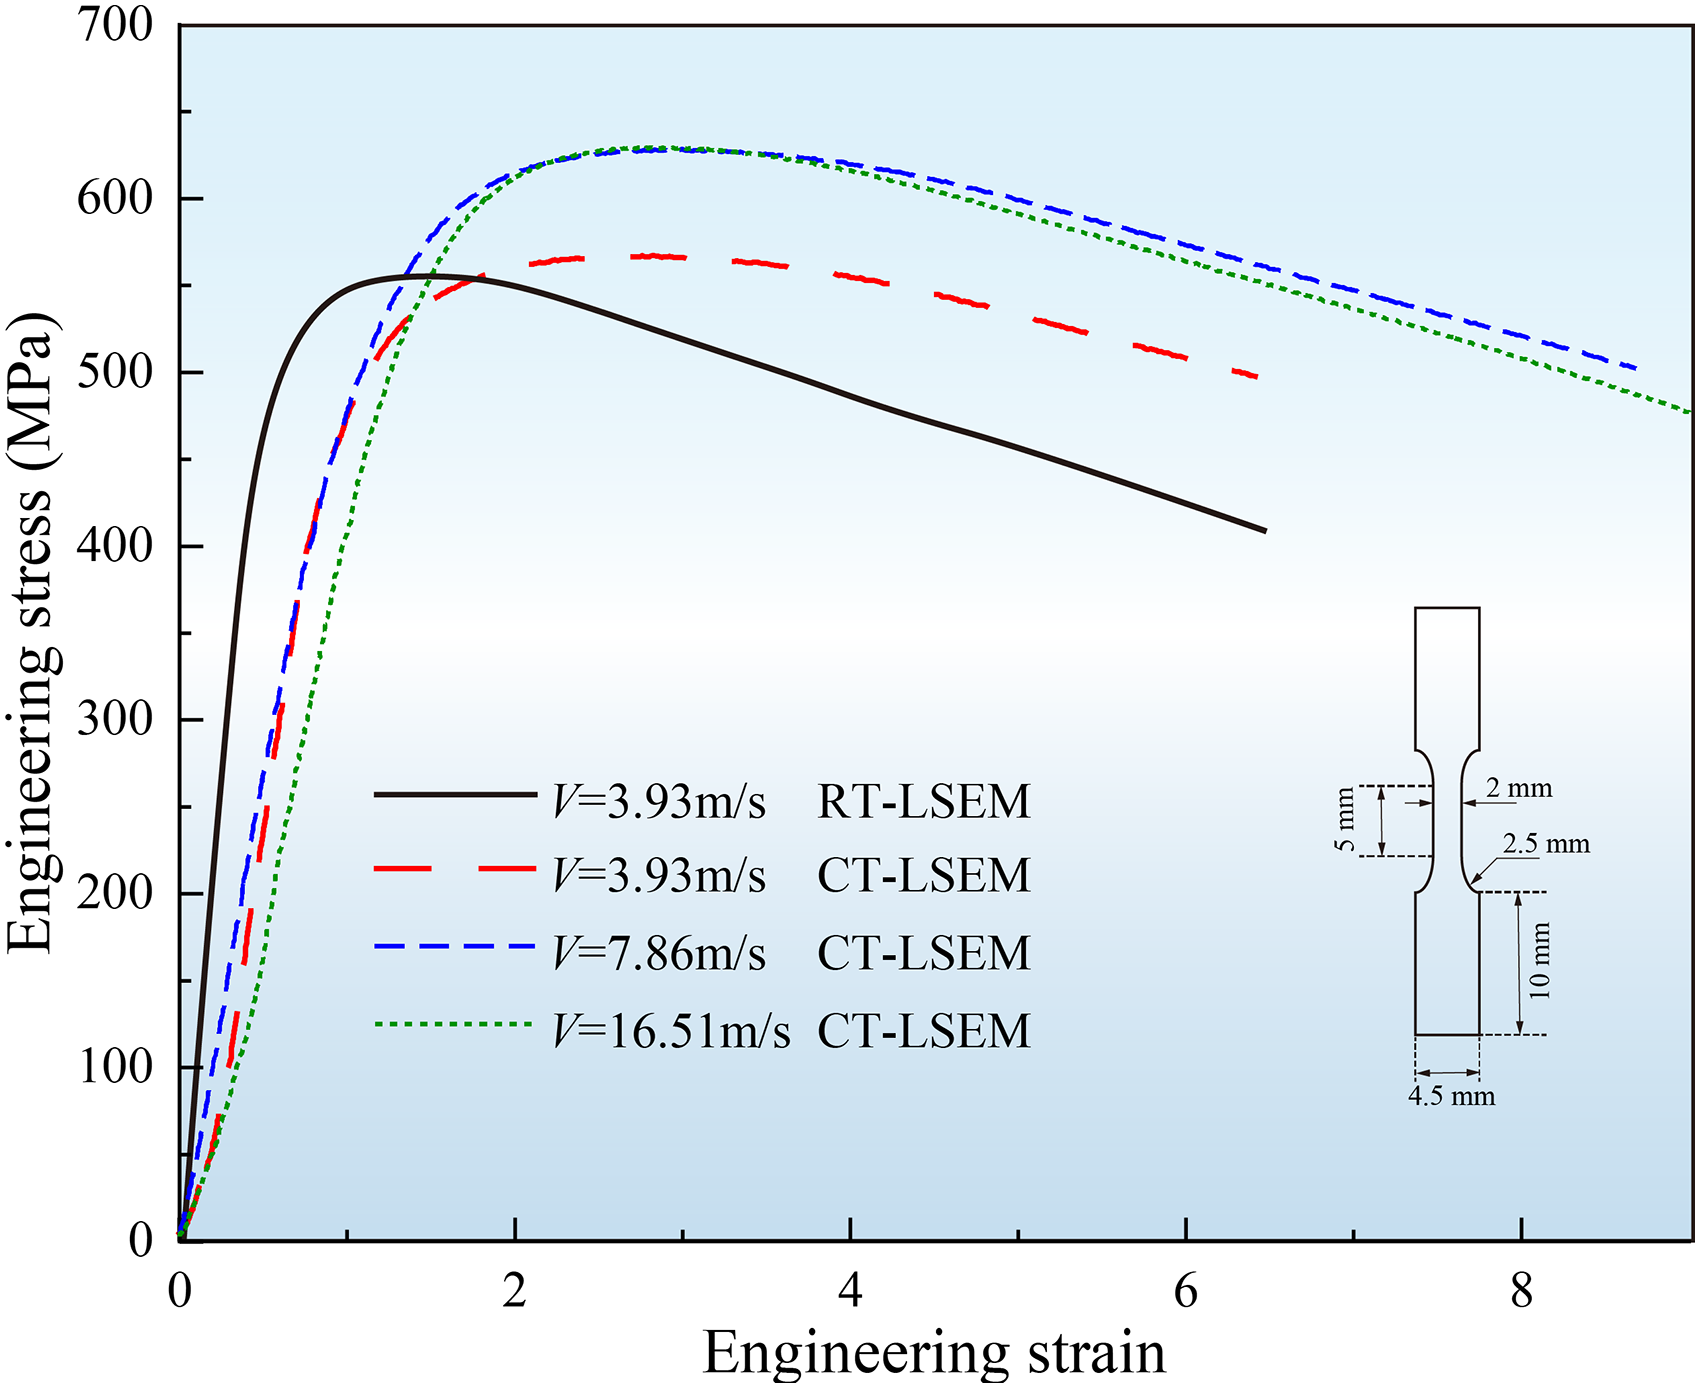
Tensile curve of CP Ti after LSEM processing under different Vc.
Tensile properties of CP Ti at different Vc.
Discussion
Fine-grain strengthening
The evolution of grain boundary characteristics with Vc was presented in Figure 12(a) to (c), where high-angle grain boundaries (HAGBs, θ > 15°) were marked in black and low-angle grain boundaries (LAGBs, 2° < θ < 15°) in green, showing a clear increase in HAGB proportion from 62% to 89% as Vc increased from 3.93 to 16.51 m/min due to enhanced dynamic recrystallization and plastic deformation during CT-LSEM processing. A great many dislocations were introduced into the material during this process, and the high density of dislocation slip and proliferation led to the formation of sub-crystalline structures, which ultimately contributed to the gradual breaking of coarse grains into smaller ones.
Gbs maps and misorientation angle in different Vc.
The formation of dislocation entanglements drove the gradual emergence of LAGBs, accompanied by concurrent structural rearrangement as strain accumulated. As the dislocation density was further increased, subsequent slip and rotation occurred within LAGBs; this process increased the misorientation between grains, thereby promoting the transformation of LAGBs into HAGBs. Through this processing route, we observed both a remarkable enhancement in grain boundary density and an effective barrier to dislocation movement, thereby impeding further plastic deformation, which ultimately led to a substantial increase in the material's overall hardness and YS.
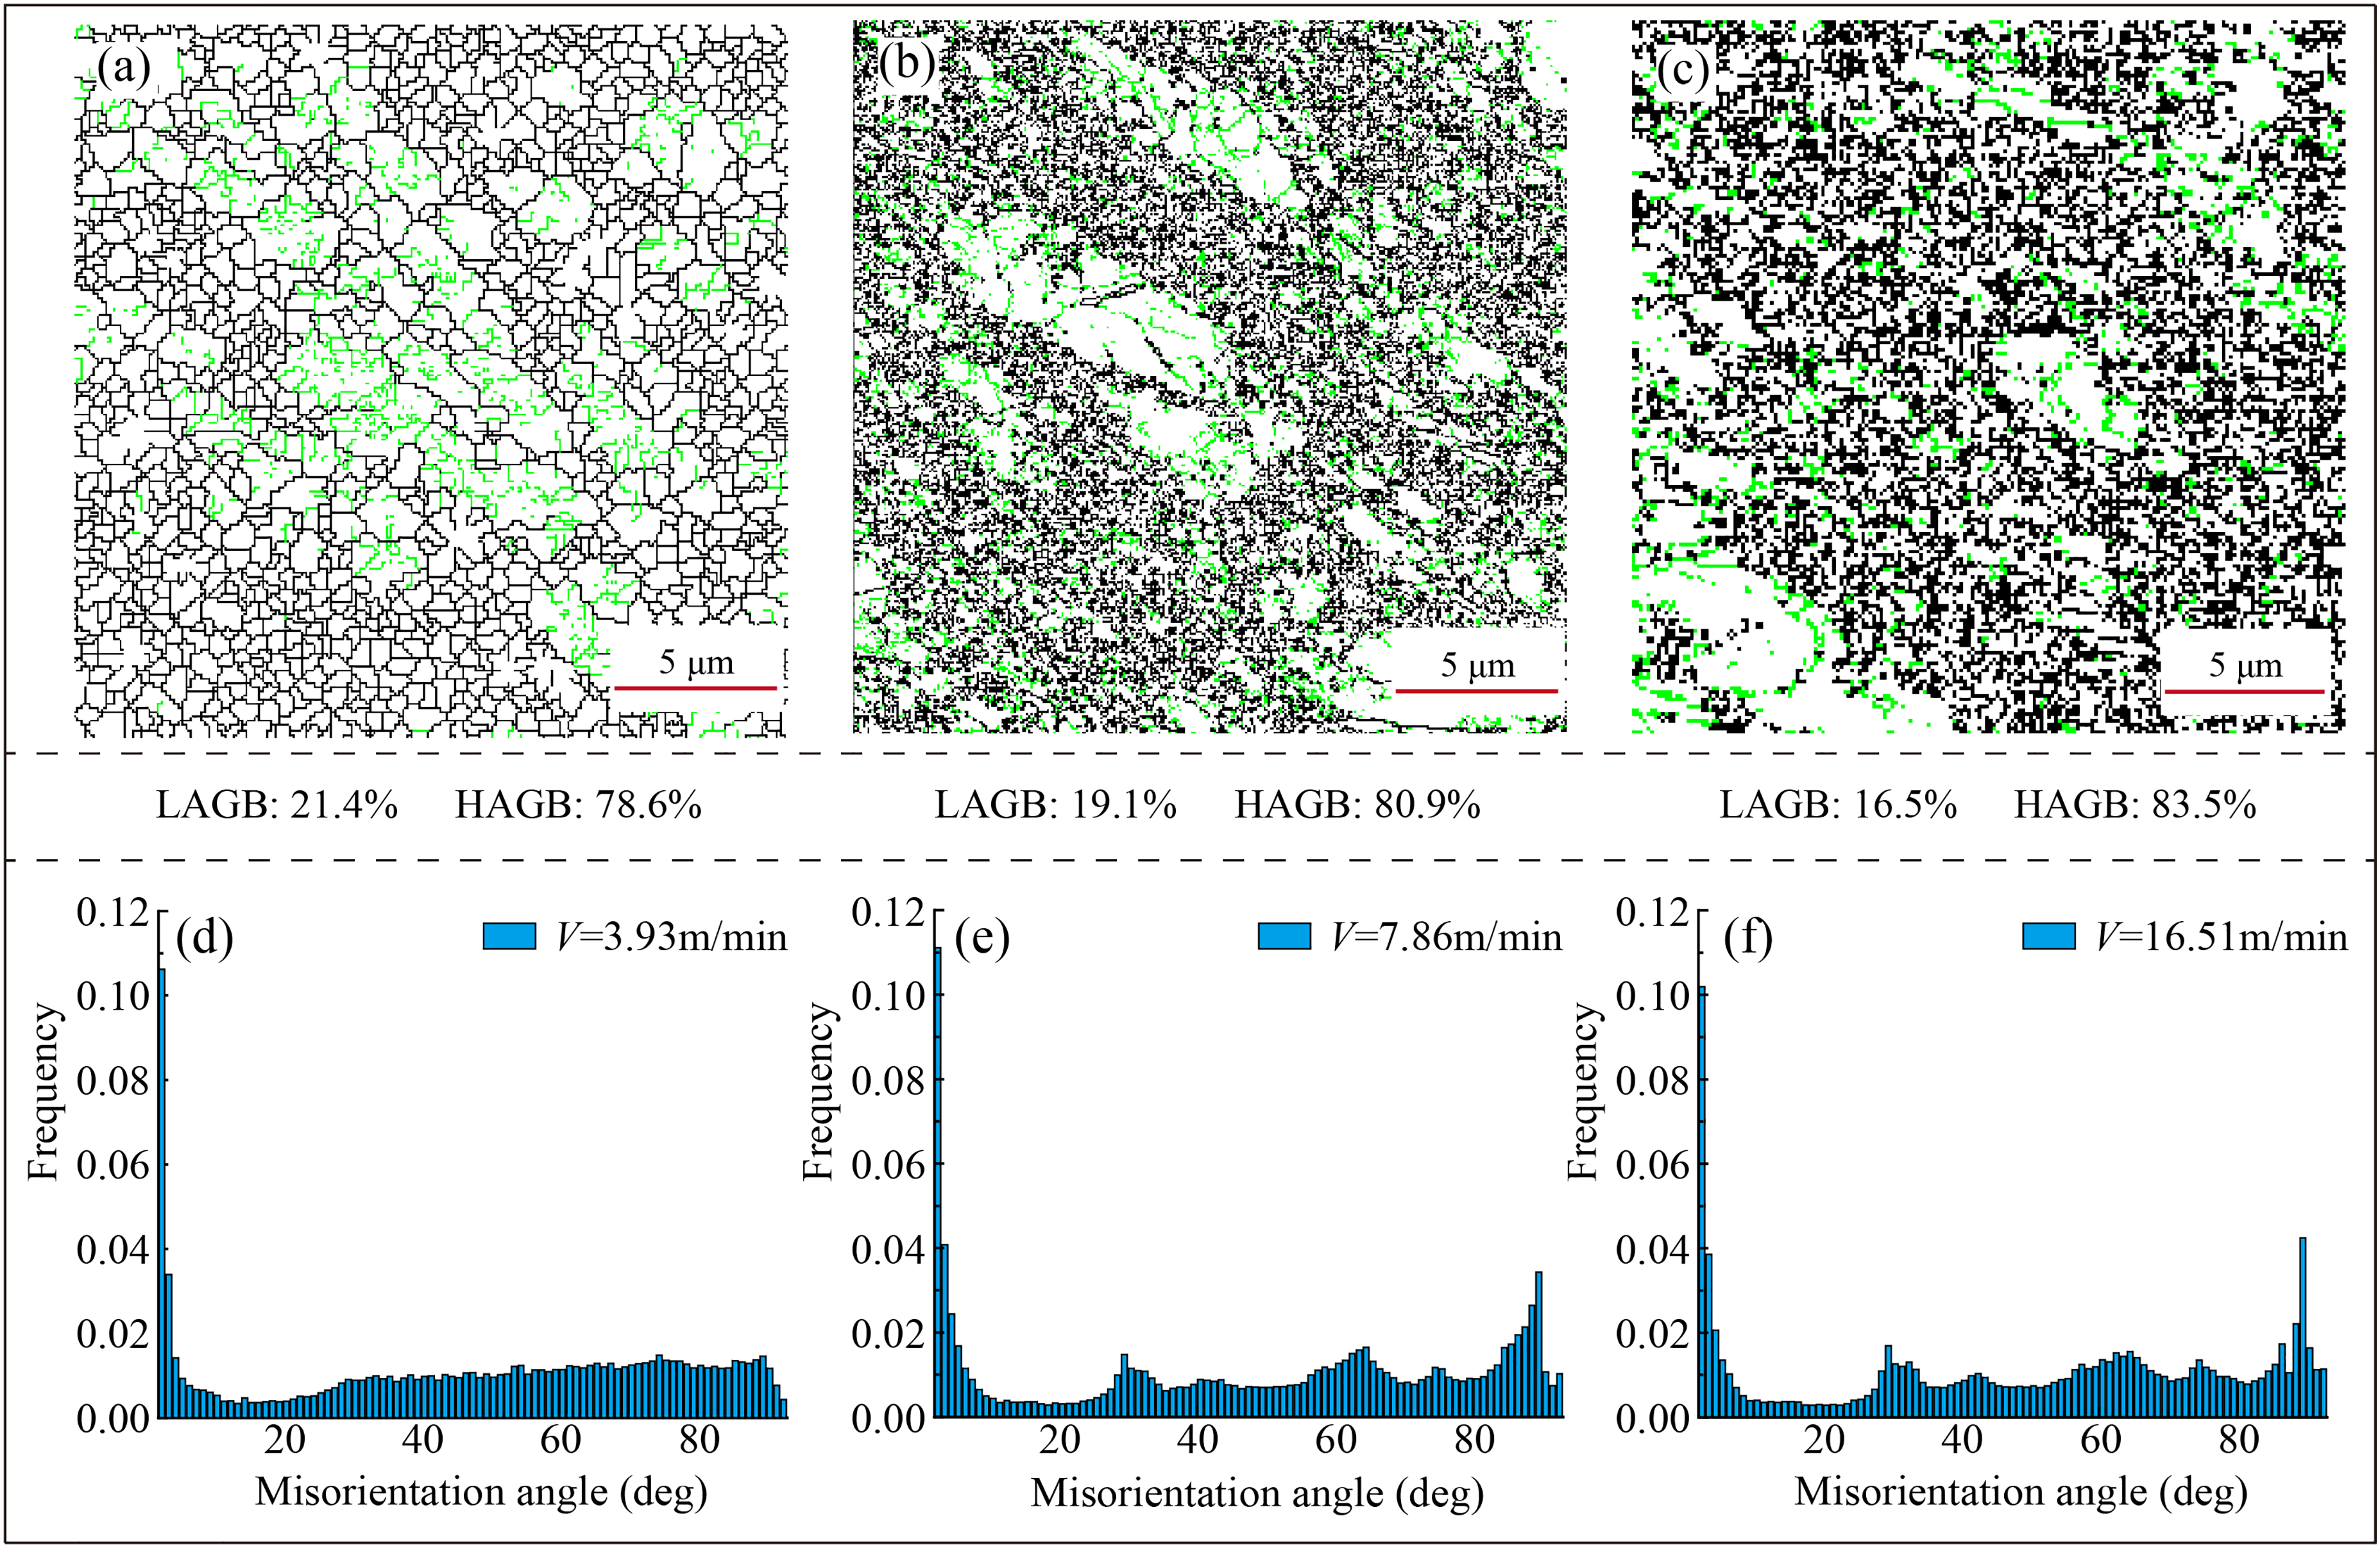
As shown in Figures 12(d) to (f), the volume fractions of HAGBs were 78.6%, 80.9%, and 83.5% at Vc of 3.93 m/min, 7.86 m/min, and 16.51 m/min, respectively, indicating that the HAGBs increased significantly with rising Vc, while the percentage of LAGBs decreased accordingly. This indicated that the grains were effectively refined by the continuous dynamic recrystallization (CDRX) mechanism at high deformation rates.
This conclusion was further supported by the microstructural observations in Figure 7. The spatial distribution of LAGBs and HAGBs revealed that most LAGBs are formed near the original HAGBs. In addition, the formation of newly recrystallized fine grains and necklace-like grain structures along the boundary of the coarse crystals provided strong evidence for the substantial development of DRX.
In general, as the Vc increased, the plastic deformation was intensified, the strain rate increased, the grain refinement effect was significantly enhanced, the HAGBs increased, and the LAGBs decreased. The high-density grain boundaries hindered the dislocation movement and increased the strength and hardness of the material. This strengthening mechanism was a typical fine-grain strengthening process, whose core principle lay in the role of grain boundaries as barriers to dislocation movement, thereby increasing YS and microhardness.
In the fine-grain strengthening model, the presence of grain boundaries inhibited the free motion of dislocations. As grain size decreases, the density of grain boundaries increases, dislocation confinement was enhanced, and the material exhibited greater resistance to deformation. This mechanism was usually described by the Hall-Petch relationship, where the YS of the material increased as the average grain size decreased. This relation could also be extended to hardness
35
:
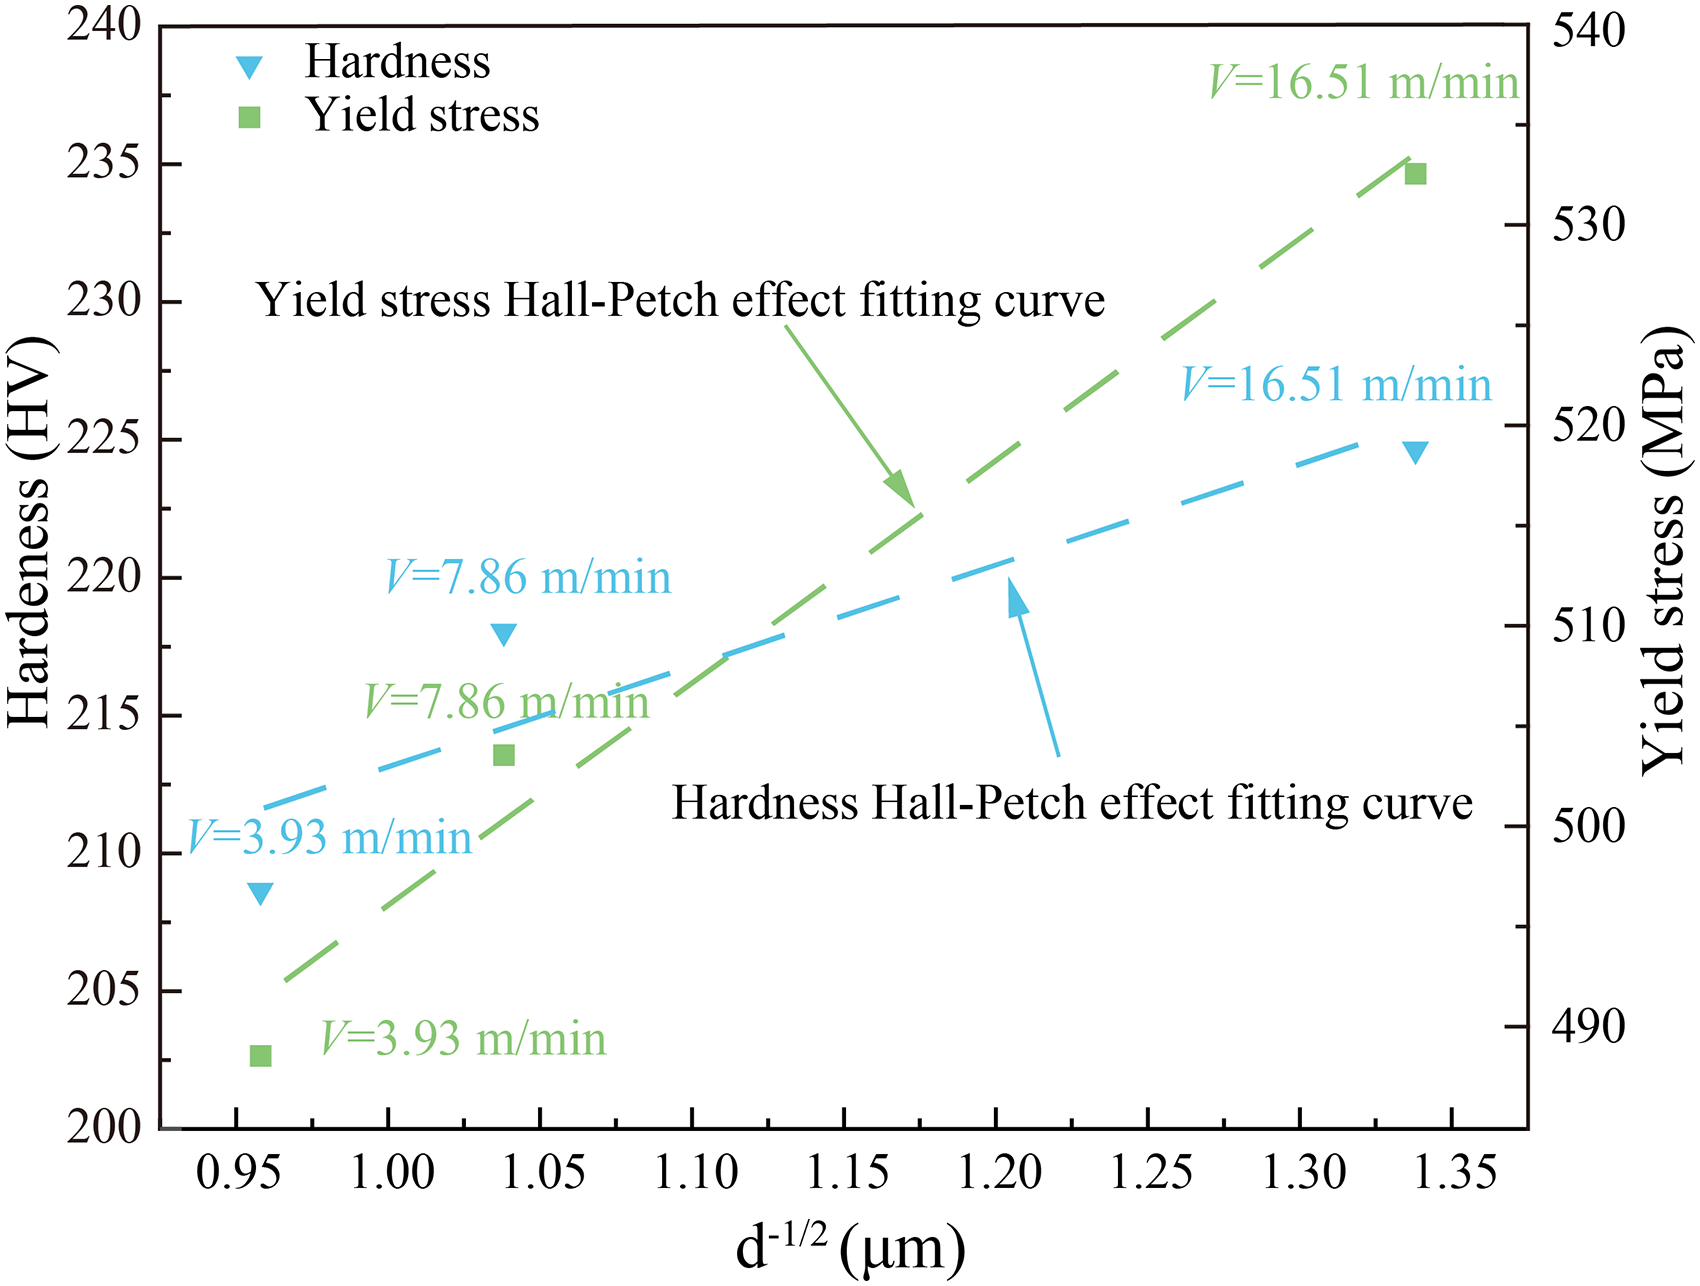
The Hall-Petch effect fitting curve of YS and hardness.
While the classical Hall-Petch relationship typically considered HAGBs as the primary barriers to dislocation motion, it was important to acknowledge the contribution of LAGBs to the overall strengthening, especially in materials processed by severe plastic deformation. LAGBs, which consisted of dislocation arrays, could also impede dislocation slip, although their strengthening effect was generally considered to be weaker than that of HAGBs due to their lower misorientation and thus lower energy barrier for dislocation transmission. Therefore, the Hall-Petch fitting in Figure 13 employed HAGB-defined grain sizes measured by EBSD to simplify calculations, even though LAGBs contributed to overall strength.
Dislocation strengthening
Roters et al. 36 pointed out that the plastic response of a material was highly dependent on the kinematic behavior of the dislocations, and the dislocation density was a key microstructural parameter describing the deformation state of the material. As deformation progresses, dislocation slip and entanglement led to a rapid increase in dislocation density, resulting in the formation of cellular or entangled structures. These complex dislocation networks prevented further dislocation slip and thus inhibited the deformation capacity, which was manifested as work hardening. Theoretically, dislocation strengthening was proportional to dislocation density, which could be described using classical dislocation-based models.
Dislocations could be classified into geometrically necessary dislocations (GNDs) and statistically stored dislocations (SSDs). Among them, GNDs are mainly caused by inhomogeneous plastic deformation between grains, while SSDs originate from localized homogeneous plastic strains. In EFBSD analysis, the kernel average misorientation (KAM) analysis was employed to evaluate lattice distortion and determine GNDs density, as SSDs did not contribute to crystalline curvature. According to the literature, 37 the GNDs density could be approximated by the ratio of the KAM value to the step size R. A higher KAM value indicated more severe lattice distortion, reflecting a denser dislocation structure within the grain, which usually represented a higher degree of deformation or a more pronounced substructural evolution of the material.
Figures 14(a) to (c) showed the dislocation density distribution of the ultrafine-grained CP Ti material at different Vc. At Vc was 3.93 m/min, the calculated dislocation density was 1.006 × 10¹⁵ m−2, and the green region in the KAM plot was sparse, indicating that the deformation inside the material was limited. When Vc was increased to 7.86 m/min (Figure 14(b)), the green area in the KAM plot increased significantly, which usually indicated a deformed grain or sub-grain structure resulting from elevated dislocation density. The calculated dislocation density at this point was 1.075 × 10¹⁵, which represented an increase of approximately 6.86% compared to the lower speed. This was attributed to the intense plastic deformation induced by the higher strain rate, which further refined the grains and induced more dislocation formation.
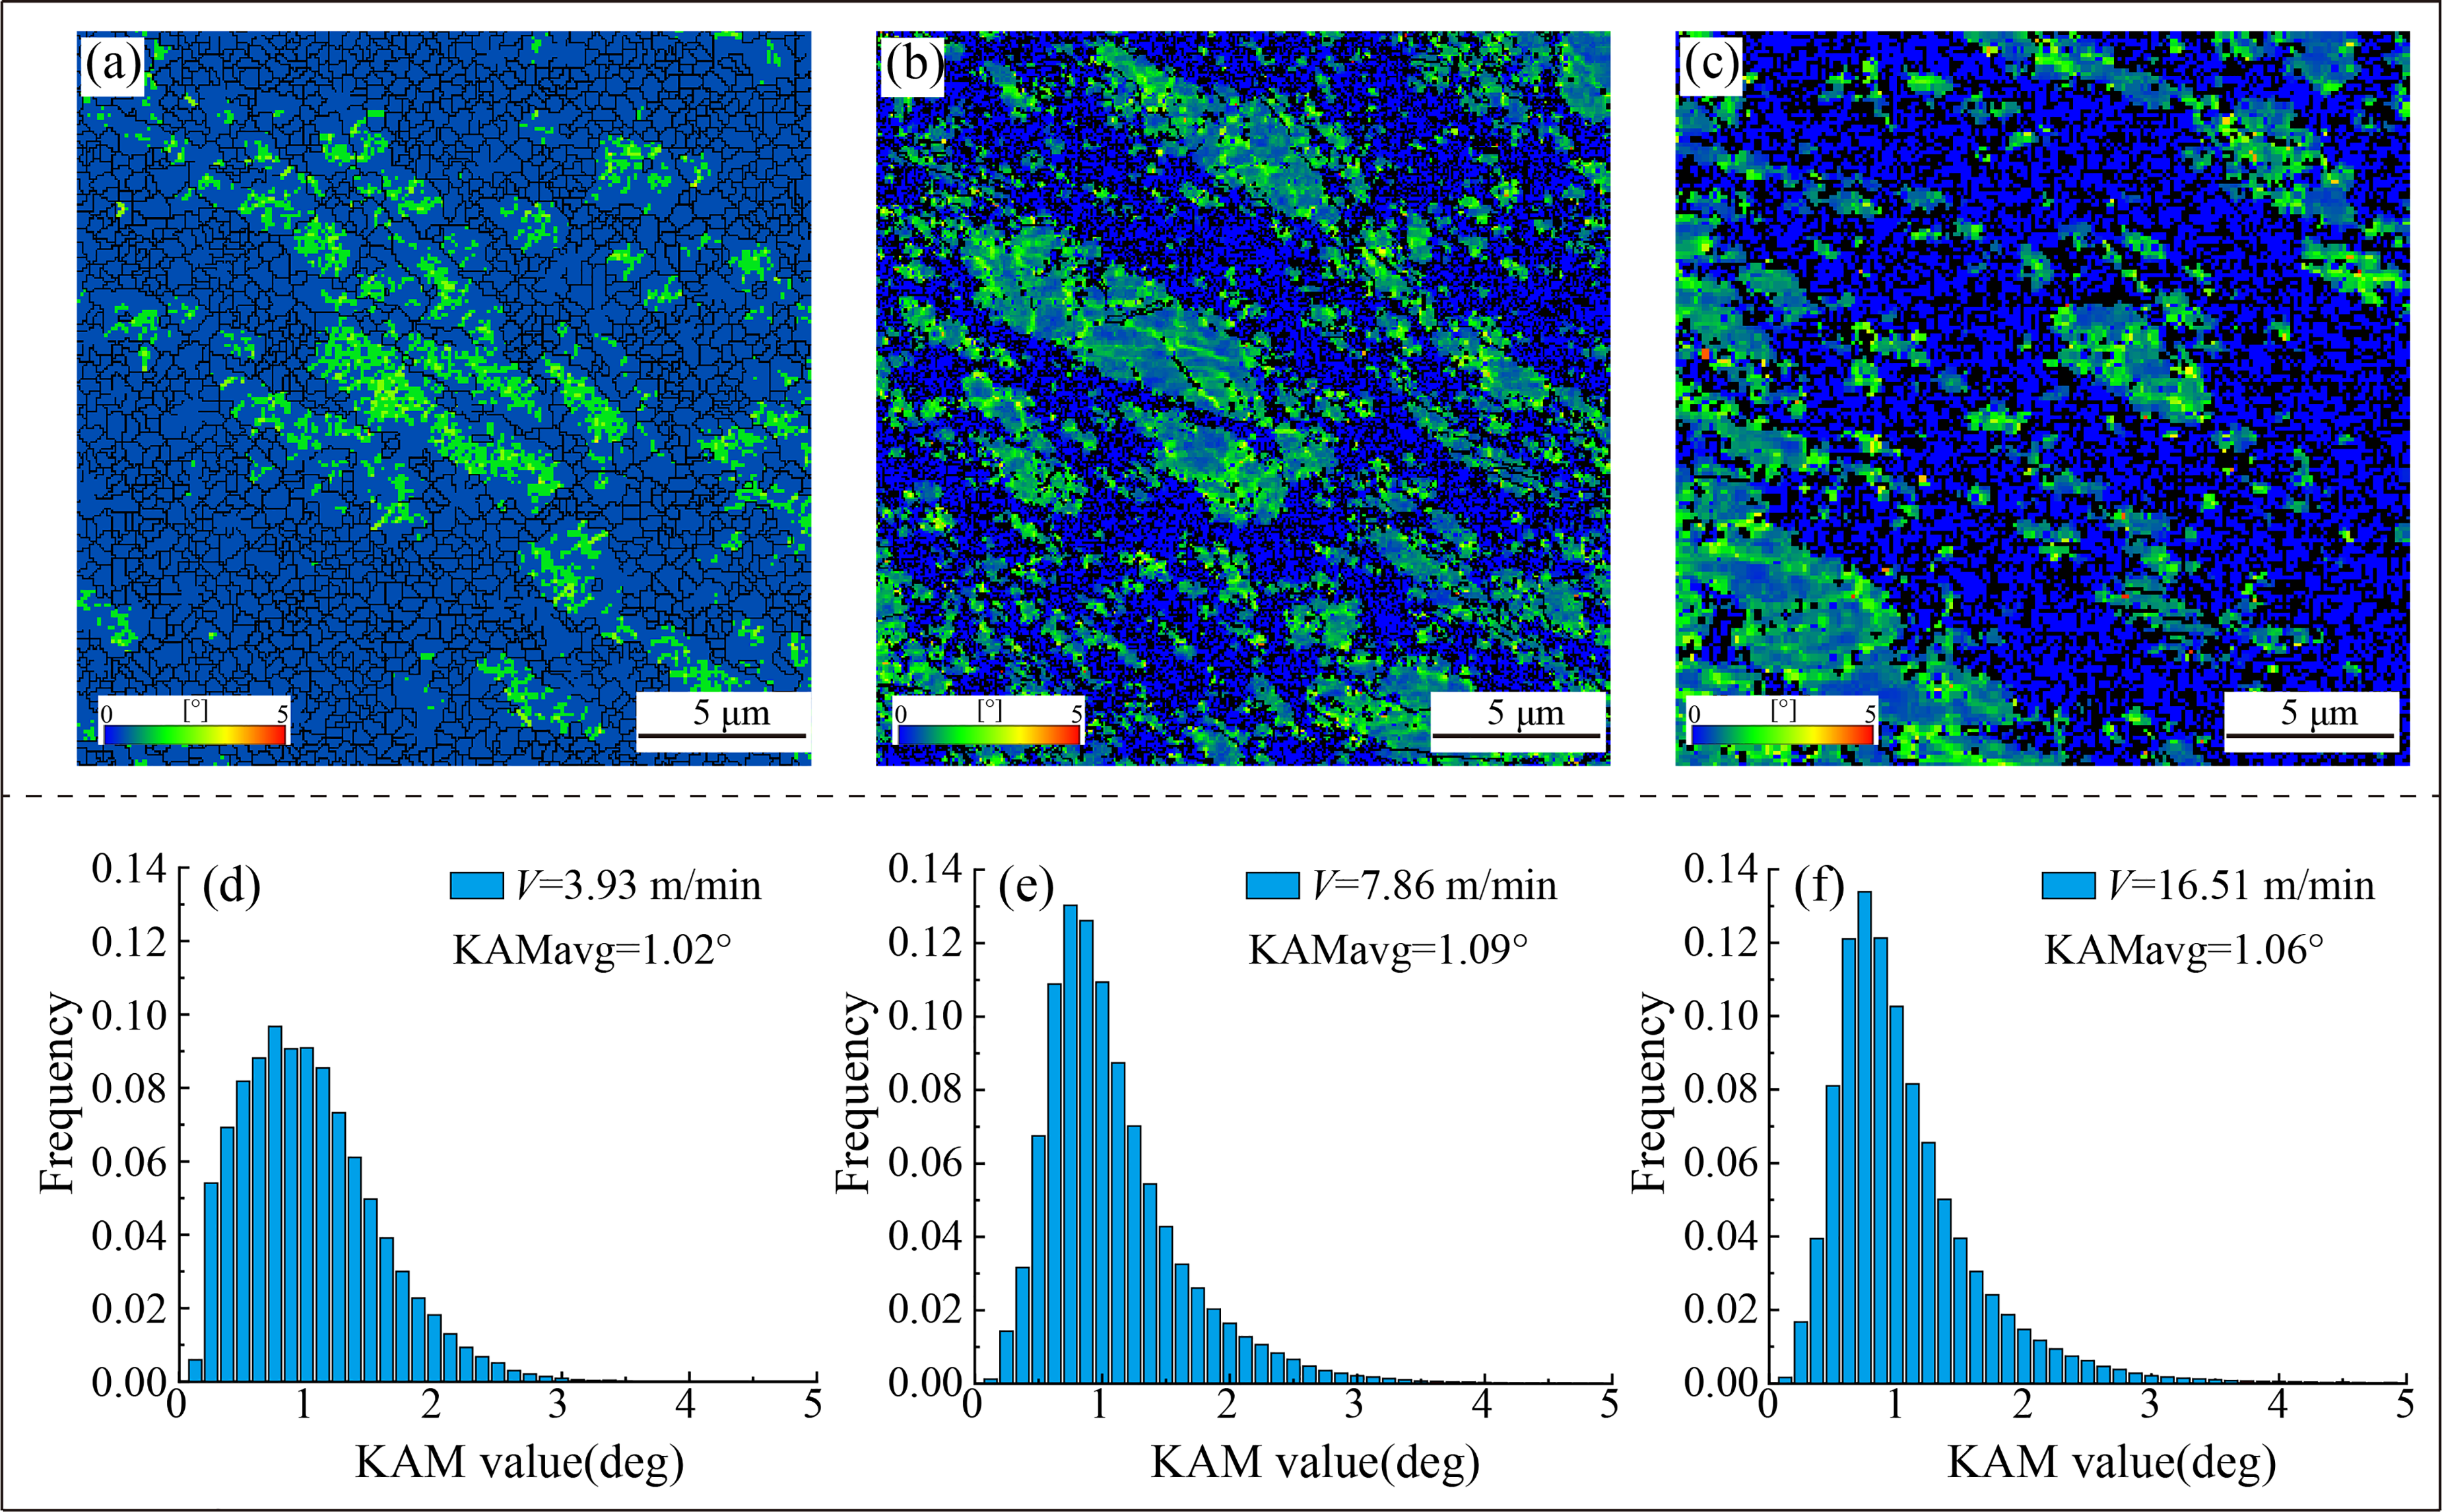
Distribution of KAM in CT-LSEM, (a) V = 3.93 m/min, (b) V = 7.86 m/min, (c) V = 16.51 m/min; Distribution of KAM values in CT-LSEM for (d) V = 3.93 m/min, (e) V = 7.86 m/min, (f) V = 16.51 m/min.
However, when the Vc was further increased to 16.51 m/min (Figure 14(c)), the green area in the KAM plot shrank, and the proportion of the blue region increased. This indicated that although the material remains under a high-strain environment, the local temperature increase led to dislocation reversion and annihilation, resulting in a slight decrease in the dislocation density to 1.045 × 10¹⁵, which is about 2.75% lower than the medium Vc. This trend indicated that the increase in Vc led to an increase in dislocation density during the initial stage, but when the thermal effect accumulated to a certain level, some dislocations in the material began to be thermally activated and annihilated, leading to saturation or even a decrease in the total number of dislocations. A similar phenomenon had also been observed in other severe plastic deformation experiments.38–40
In addition, it was found that the overall variation of dislocation density changes induced by Vc was small compared to the effect of the compression ratio. This was because Vc directly affected the generation of cutting heat, and high temperatures tend to exacerbate dislocation annihilation, which offset the strain-induced dislocation accumulation of dislocations. Under high temperature conditions, some dislocations could be decomposed, annihilated, or canceled each other at grain boundaries, forming the so-called “dislocation forest”, which limited the free slip path of dislocations and resulted in a macroscopic trend toward stabilization or even reduction in dislocation density. 18
Twining strengthening
As illustrated in Figure 15, the distribution of misorientation angles in ultrafine-grained pure titanium strip was analyzed under varying Vc. When Vc = 3.93 m/min, the misorientation angles demonstrated a relatively random distribution, exhibiting no significant preference for any specific orientation. The quantitative analysis revealed a twin volume fraction of 5.64% under this condition. This suggested that at low Vc, pure titanium primarily achieves plastic deformation, which was primarily accommodated by dislocation slip, with a relatively minor contribution from twinning. This behavior could be attributed to the inherent c/a ratio (1.587) of pure titanium's HCP structure, which was considerably lower than the ideal value (1.633), thereby resulting in dislocation slip being the predominant mechanism in twinning.41,42
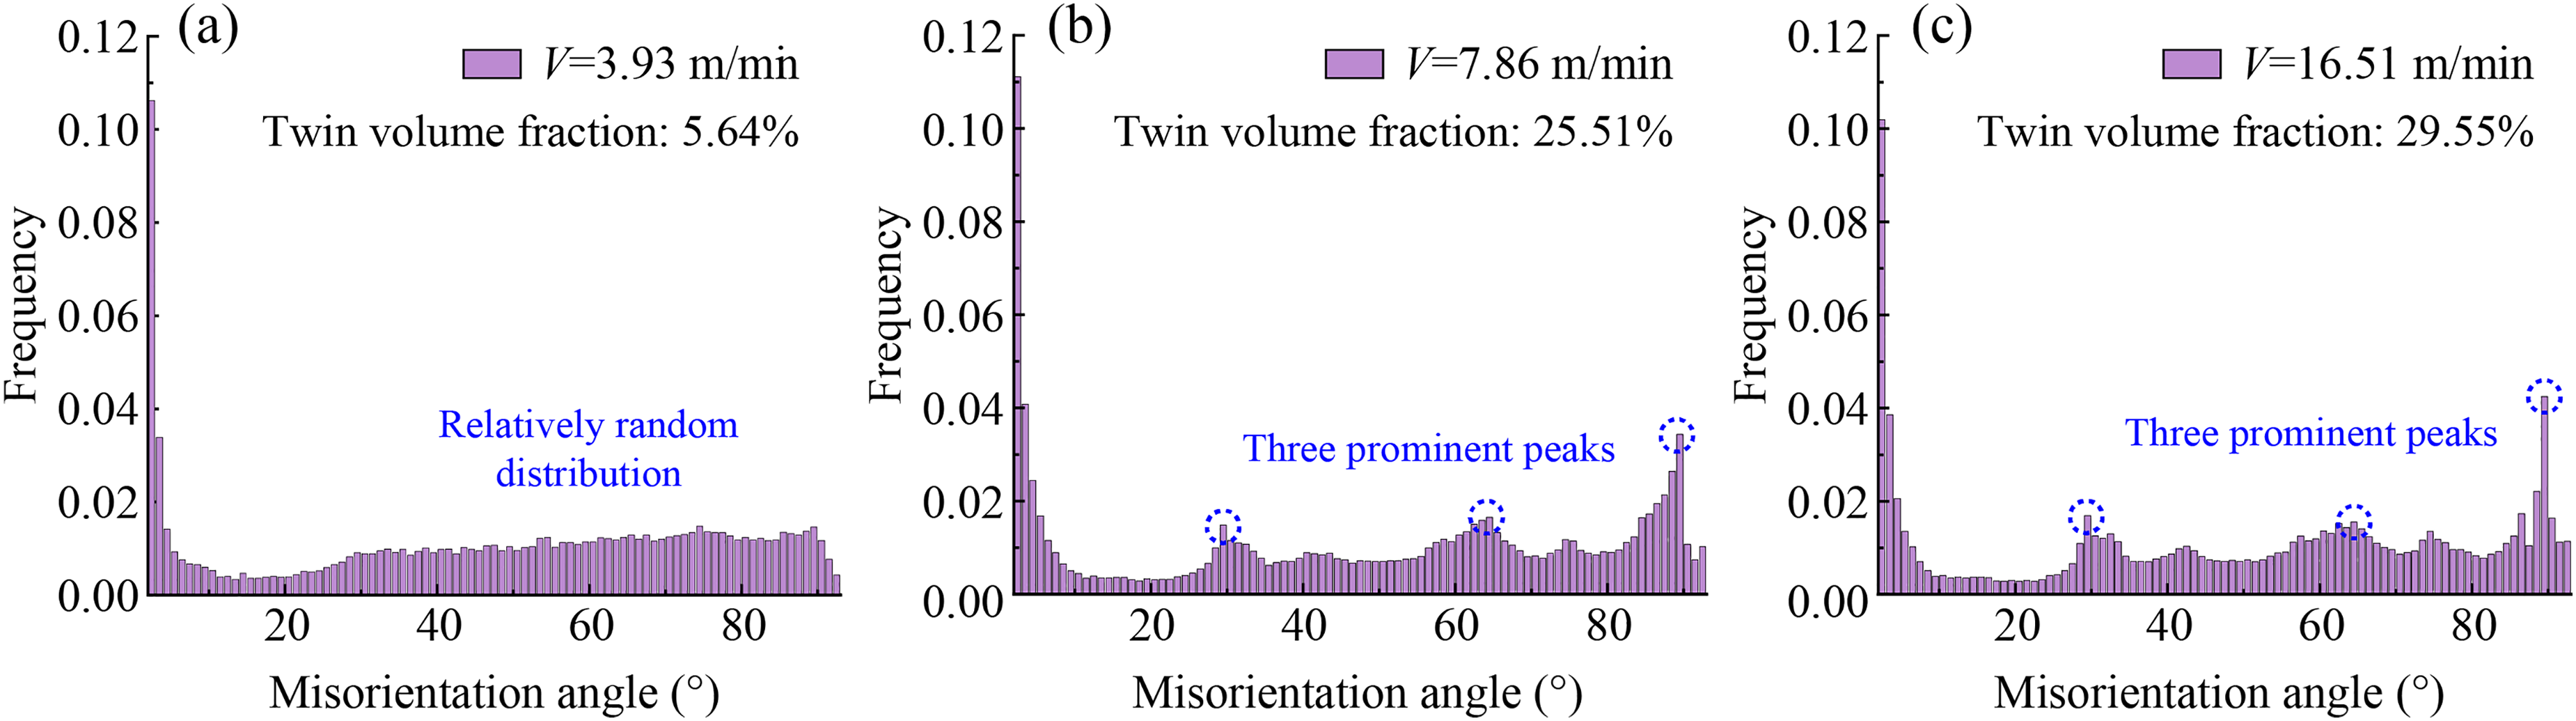
Misorientation angle in CT-LSEM for (a) V = 3.93 m/min, (b) V = 7.86 m/min, (c) V = 16.51 m/min.
As Vc increased to 7.86 m/min, the higher strain rate promoted the activation of additional twinning mechanisms during deformation. As shown in Figure 15(b), the misorientation angle distribution displayed three primary peaks, located at 29.5°, 64.5°, and 89.5°, respectively. Those peaks indicated the successive activation of three distinct twin types. Tensile twins were found to be at 89.5° {10–12}, compressive twins were found to be at 64.5° {11–22}. Additionally, the tensile twins were found to be at 29.5° {11–21}. At this point, the volume fraction of twins increased to approximately 25.51%, indicating that under higher Vc, deformation twinning was significantly enhanced, thereby promoting overall plastic deformation compatibility of the material. This phenomenon aligned with the observations reported by Zhu et al., 43 who noted that high strain rates in HCP metals promote the activation of various types of twin deformation, contributing to delayed fracture and improved ductility.
When Vc increased to 16.51 m/min, the misorientation angle distribution (Figure 15(c)) remained similar to that at 7.86 m/min, with prominent peaks still clearly identified at 29.5°, 64.5°, and 89.5°. Throughout processing, the ultrafine-grained CP Ti preserved three distinct twin variants: (1) 89.5°〈10–12〉 tensile twins, (2) 64.5°〈11–22〉 compressive twins, and (3) 29.5°〈11–21〉 tensile twins, as characterized by their specific misorientation angles and axes. However, the volume fraction of twins further increased, reaching 29.55%. This trend was consistent with the findings of Kishida et al., 44 who also observed a strain-rate-dependent increase in twinning activity in HCP metals. As Kishida et al. pointed out, the HCP structure of pure titanium requires deformation modes that involve a c-axis component to accommodate plastic deformation comprehensively.
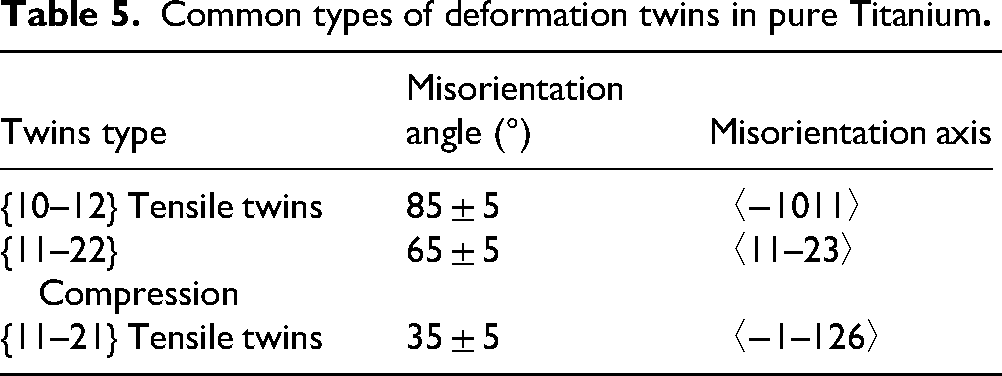
For the identification and quantification of twin boundaries, a specific tolerance angle was applied. Twin boundaries were identified based on their characteristic misorientation angles and axes, as listed in Table 5. A tolerance of ±5° was used for both the misorientation angle and the rotation axis to account for minor lattice distortions and measurement uncertainties. In ultrafine-grained CP Ti, the shear vectors of the three common deformation-twin systems all contained a c-axis component. During the early stages of plastic deformation, dislocation slip was the dominant mechanism; however, as Vc and strain rate increased, the critical resolved shear stress (CRSS) of slip systems rose, and the cooperative contribution of twinning became increasingly significant. 45 Deformation twins played a dual role: they provided an additional deformation pathway and generated a high density of nano-twin boundaries that acted as effective barriers to dislocation motion. These interfaces suppressed dislocation accumulation and slip, thereby enhancing the strain-hardening rate and YS-a phenomenon known as twin-boundary strengthening. 46 Moreover, twins could absorb incomplete dislocations and relieve stress concentrations, endowing the material with excellent deformation compatibility under dynamic loading. 47
Common types of deformation twins in pure Titanium
In summary, the above analysis indicates that, under CT-LSEM processing, the twin volume fraction in ultrafine-grained pure titanium strips increases significantly as Vc increased. This increase promoted further grain refinement through the formation of nano-twin boundaries and shortened the average free path of dislocation motion. The microstructure simultaneously enhanced the material's work-hardening capacity and tensile strength through two key mechanisms: (1) dynamic Hall-Petch strengthening via grain boundary-dislocation interactions, and (2) accumulation of GNDs that effectively obstructed dislocation motion. These findings were consistent with the “dynamic twin-induced hardening mechanism” reported by Wang et al. for ultrafine-grained copper, which highlighted the synergistic contribution of nanotwins to improving both strength and toughness. 48
It is well established that conventional HAGBs act as effective barriers to dislocation motion, which is the fundamental basis for Hall-Petch strengthening. In our study, the high density of twin boundaries—particularly nanoscale twin lamellae—introduces an additional, distinct strengthening mechanism. While HAGBs are already highly effective barriers, nano-twin boundaries offer a complementary strengthening effect with an important distinction: they are coherent interfaces with low excess energy. This coherency allows them to not only block dislocation motion but also to absorb and store dislocations within the twin lamellae, leading to enhanced work hardening and improved ductility. In contrast, conventional HAGBs, being incoherent, may lead to earlier dislocation pile-up and potential crack initiation. Therefore, the advantage of nano-twin boundaries lies not in being “stronger” barriers, but in providing a more effective balance between strength and work hardening capacity. The high density of coherent twin boundaries reduces the mean free path of dislocations (dynamic Hall-Petch effect) while simultaneously providing sites for dislocation accumulation, thereby enhancing both strength and ductility. This behavior was attributed to their significantly lower energy, approximately one order of magnitude lower than typical high-angle boundaries. 49 Such boundaries acted as strong barriers to dislocation motion by reducing the dislocation free path and increasing the energy required to overcome these interfaces. Moreover, nanoscale twins were capable of absorbing partial dislocations, thereby effectively alleviating local stress concentrations generated during plastic deformation. This provided an essential deformation coordination mechanism under high strain rates. Overall, the enhanced mechanical properties of ultrafine-grained CP Ti processed via CT-LSEM can be attributed to the critical role played by coherent twin boundaries. 46
Conclusions
This work examined the influence of Vc on the microstructure and mechanical properties of CP Ti during CT-LSEM. EBSD, micro-/nano-hardness testing, and tensile tests were used to quantify microstructural evolution and strengthening mechanisms. The main conclusions were summarized as follows:
Raising Vc from 3.93 to 16.51 m/min increased the peak effective strain rate from 320 to 873 s−1, producing intense plastic deformation. The initial coarse grains were elongated and fragmented into a bimodal structure consisting of fine equiaxed grains and elongated deformed grains. The mean grain size decreased from 1.29 μm to 0.94 μm with increasing Vc. Higher Vc preferentially activated tensile twins 89.5° {10–12}, compression twins 64.5° {11–22}, and tensile twins 29.5° {11–21}; the twin volume fraction increased with Vc, from 5.64% at 3.93 m/min to 29.55% at 16.51 m/min. The resulting twin-boundary network, together with refined grains, impedes dislocation motion and enhances strength. Compared to conventional room-temperature machining, CT-LSEM significantly enhanced the microhardness and yield strength of CP Ti. Furthermore, increased cutting speeds elevated the hardness of cryogenic-machined samples from 208.9 HV to 224.9 HV, while yield strength rose from 518 MPa to 578 MPa. A Hall-Petch-type correlation, calibrated using combined experimental and simulation data, was established for CT-LSEM processed CP Ti. This correlation deviates slightly from the classical Hall-Petch relationship at the finest grain sizes, suggesting a contribution from LAGB/subgrain strengthening. This calibrated model provides a quantitative tool for the inverse design of CT-LSEM parameters to achieve target mechanical properties in high-performance CP Ti components, moving beyond simple empirical observation to enable predictive process optimization.
Supplemental Material
sj-docx-1-mst-10.1177_02670836261443601 - Supplemental material for Strengthening mechanisms and speed effects governing microstructural evolution in cryogenic machining of ultrafine-grained titanium
Supplemental material, sj-docx-1-mst-10.1177_02670836261443601 for Strengthening mechanisms and speed effects governing microstructural evolution in cryogenic machining of ultrafine-grained titanium by Peixuan Zhong, Ziqiang Tang, Songqing Li, Hao Shu, Zhicong Xiong, Zhen Xue, Junbo Zhao, Yubo Lin and Wenjun Deng in Materials Science and Technology
Supplemental Material
sj-docx-2-mst-10.1177_02670836261443601 - Supplemental material for Strengthening mechanisms and speed effects governing microstructural evolution in cryogenic machining of ultrafine-grained titanium
Supplemental material, sj-docx-2-mst-10.1177_02670836261443601 for Strengthening mechanisms and speed effects governing microstructural evolution in cryogenic machining of ultrafine-grained titanium by Peixuan Zhong, Ziqiang Tang, Songqing Li, Hao Shu, Zhicong Xiong, Zhen Xue, Junbo Zhao, Yubo Lin and Wenjun Deng in Materials Science and Technology
Footnotes
Acknowledgment
This work was supported by the National Natural Science Foundation of China [grant number 52475454]; the Natural Science Foundation of Guangdong Province [grant number 2025A1515012095].
Ethical considerations
This research did not involve any human participants or animals.
Author contribution(s)
Funding
The authors disclosed receipt of the following financial support for the research, authorship, and/or publication of this article: This work was supported by the National Natural Science Foundation of China [grant number 52475454]; the Natural Science Foundation of Guangdong Province [grant number 2025A1515012095].
Declaration of conflicting interests
The authors declared no potential conflicts of interest with respect to the research, authorship, and/or publication of this article.
Data availability statement
Data will be made available on request.
Supplemental material
Supplemental material for this article is available online.
References
Supplementary Material
Please find the following supplemental material available below.
For Open Access articles published under a Creative Commons License, all supplemental material carries the same license as the article it is associated with.
For non-Open Access articles published, all supplemental material carries a non-exclusive license, and permission requests for re-use of supplemental material or any part of supplemental material shall be sent directly to the copyright owner as specified in the copyright notice associated with the article.