
Abstract
The mechanical properties and strengthening mechanisms in laser beam welds of pure titanium were investigated. Although grain coarsening is evidently observed in the heat affected zone (HAZ) and fusion zone (FZ) compared with the base metal (BM), the tensile and hardness tests indicate that the HAZ and FZ are stronger than the BM under the welding conditions employed in the present work. The strengthening mechanism in the HAZ is ascribed to the substructure strengthening and that in the FZ is attributed to the combination of the substructure strengthening and the solute solution strengthening.
Keywords
Introduction
Titanium and its alloys have been widely applied in the aerospace, chemical and medical industries owing to their high specific strength, good corrosion resistance and excellent biocompatibility.1 Therefore, the welding and joining technology is imperative in order to apply them to various products.2 In the past few years, many works have been conducted to investigate the fusion welding techniques of titanium and its alloys, such as gas tungsten arc welding, gas metal arc welding, plasma arc welding, electron beam welding and laser beam welding (LBW).3– 9 Most have concentrated on LBW because of its small welding deformation, narrow softening zone as well as convenient operation compared with electron beam welding, mainly based on the high energy density and the fast welding speed.6,9– 14 The mechanical properties of the fusion welded joint are frequently related to the microstructure in the weld, which are strongly influenced by both the solidification and the solid phase transformation for pure titanium. 5 5,14 In addition, it is commonly accepted that the mechanical properties of pure titanium are also dependent on the microelement contents and the grain orientation due to the hexagonal close packed structure.5,14– 17 As a result, the strengthening mechanisms in the laser beam welds of pure titanium are quite complicated. Unfortunately, the previous studies have been performed with the aim of evaluating the design optimisation of the LBW technique, and little work has been reported on strengthening mechanisms in the laser beam welds of pure titanium. In the present study, the mechanical properties in the laser beam welds of pure titanium were measured, and the strengthening mechanisms of the welds were investigated in detail by focusing on the grain structure and orientation together with the microelement contents.
Experimental
The material used in this study is a grade 2 commercially pure titanium sheet with 4 mm thickness and has a chemical composition of Ti–0·004C–0·0023H–0·078O–0·006N–0·048Fe (wt-%). The samples were bead on plate welded by an IPG YLR-10000 fibre laser welding system with a beam diameter of 0·47 mm. The focus position during LBW was kept on the top surface of the workpiece. During welding, the laser powers ranged from 8 to 10 kW, and welding speeds from 2 to 8 m min−1 were selected in this investigation. Both the top and bottom surfaces of the welds were shielded using ultrahigh purity argon gas (99·999%) with a flowrate of 25 L min−1 in order to minimise the surface oxidation. After welding, the laser beam welds were cross-sectioned perpendicular to the welding direction (WD) for metallographic and mechanical analysis by a wire electrical discharge cutting machine (HSC-300, Brother Ind. Ltd). The cross-sections were mechanically polished using water abrasive papers and then electropolished at room temperature for 30 s under a potential of 25 V in a solution containing perchloric acid, n-butyl alcohol and methanol at a volume ratio of 1∶7∶10. The polished cross-sections were etched in a solution comprising of hydrofluoric acid, nitric acid and distilled water at a volume ratio of 1∶1∶8. The etched cross-sections were examined by a scanning electron microscope (VE-8800, Keyence Corp.). Electron backscattering diffraction was used to analyse the grain structure and orientation using a scanning electron microscope (JSM-6400, JEOL Ltd) incorporated with a TexSEM Laboratories (MSC-2200; TexSEM Laboratories Inc.). Electron backscattering diffraction maps with a step size of 3·0 μm were taken perpendicular to the WD, and the average confidential index from 0·55 to 0·65 was obtained. Small grains comprising fewer pixels were removed using the grain dilation option to ensure reliability, and a 10° criterion was used to define the low angle boundaries (LABs) versus the high angle boundaries (HABs). The hardness distribution at the cross-section was measured by a hardness testing machine (AAV-500, Akashi) under a load of 0·98 N for a dwell time of 15 s with an interval of 0·1 mm. The tensile test was evaluated by means of a tensile test machine (Instron-5500R, Instron Corp.) at room temperature with a crosshead speed of 2 mm min−1, and three specimens with a flat surface were made for each welding condition.
Results and discussion
Mechanical properties of laser beam welds
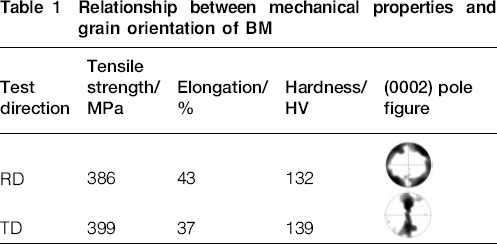
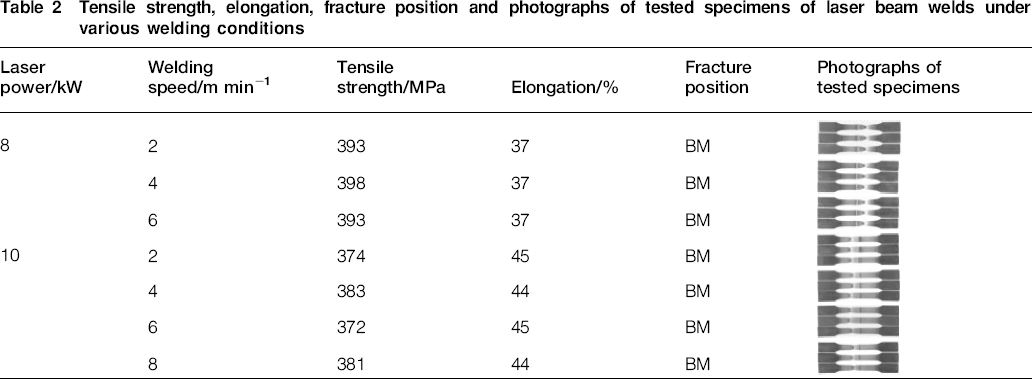
The relationship between the mechanical properties and the grain orientation of the base metal (BM) is given in Table 1. The RD, TD and ND are the rolling, transverse and normal directions respectively. The tensile strength and hardness of BM obviously depend on the test direction, which is associated with the grain orientation or texture distribution. The tensile strength, elongation, fracture position and photographs of the tested specimens of the laser beam welds under various welding conditions are present in Table 2. The WD was parallel to the RD when a laser power of 8 kW is adopted, while the WD was perpendicular to the RD under the condition of 10 kW laser power for the tensile test. The tensile strength and elongation of the laser beam welds are approximately identical with those of BM irrespective of the welding conditions in the present work. Moreover, as seen from Table 2, all the fractures of the welds occur at the BM, far from the heat affected zone (HAZ) and fusion zone (FZ), implying that HAZ and FZ are stronger than BM.
Relationship between mechanical properties and grain orientation of BM
Tensile strength, elongation, fracture position and photographs of tested specimens of laser beam welds under various welding conditions
The hardness distributions in the laser beam welds at the laser power of 10 kW under various welding speeds are shown in Fig. 1. The fusion lines cannot be accurately identified due to the similar microstructure formed in HAZ and FZ, and thus, they were approximately distinguished according to the location of the weld root and weld toe.5 From Fig. 1a–d, the location of the hardness analysis is shown in the top right corner, and the average hardness of the different zones is given in the top left corner. It should be pointed out that the WD was parallel to the RD in the samples for the hardness test and microstructural observation in this work. This is to say that both the indentation direction and the observation direction are parallel to the RD. The average hardness value of the BM is ∼132 HV, quite consistent with the result shown in Table 1. Additionally, the weld width gradually becomes narrower with the increase in welding speed due to the decrease in welding heat input. The average hardness in the HAZ is almost the same under various welding speeds, but the average hardness in the FZ seems to be low at slow welding speed (compared with the fast welding speeds) because of the coarse microstructures formed at the comparatively slower cooling rate. Although an obvious scatter is detected in the HAZ and FZ as well as the BM, the average hardness in the HAZ and FZ is clearly higher than that in the BM. It can also be seen from Fig. 1 that the scatter extent of hardness in HAZ and FZ is larger than that in the BM. This phenomenon may be explained according to the textures in these regions and will be discussed in the following section.
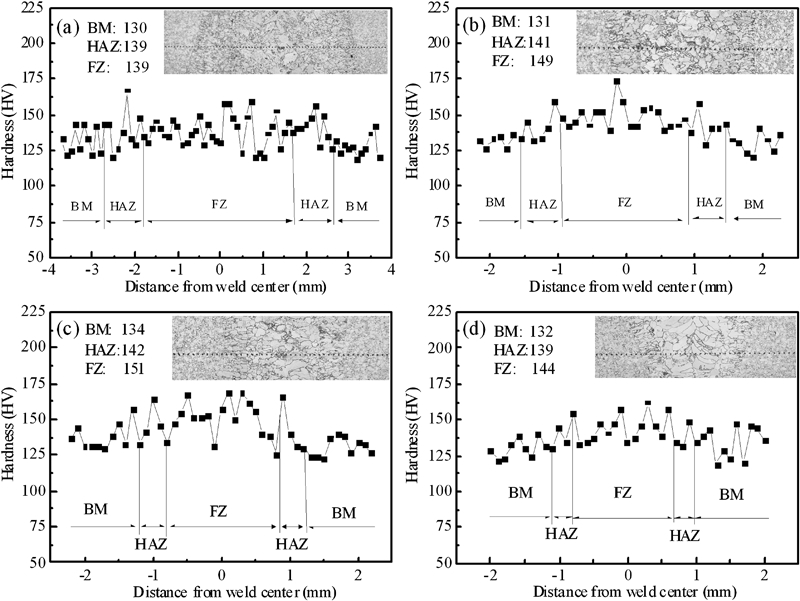
Hardness distributions in laser beam welds at laser power of 10 kW under various welding speeds
Grain structure and orientation in laser beam welds
In order to investigate the relationship between the hardness and the grain orientation, several coarse grains with different orientations were chosen from the grain boundary map in the FZ at 10 kW laser power and 2 m min−1 welding speed (as shown in Fig. 2, where the indentation marks within the grain C are displayed in the top left corner). The HABs (solid black line) are the α grain boundaries, while the LABs (solid grey line) depict the substructures within the α grains. It was found that the selected grains show similar grain size and have no distinct substructures. The relationships between the hardness and the grain orientation of the analysed grains are detailed in Table 3. The relatively high hardness was detected when indenting into the basal plane, whereas the low hardness was found when indenting into the prismatic plane. Thus, the significant scatter in the hardness distribution can be ascribed to the crystallographic anisotropy, which is nearly related to the hexagonal close packed structure of pure titanium. 5 16 5,16,17
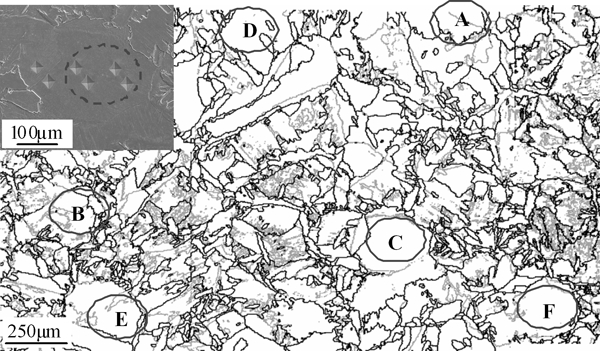
Grain boundary map and analysed grains of hardness test with different orientations in FZ at 10 kW laser power and 2 m min−1 welding speed
Relationships between hardness and grain orientation of analysed grains shown in Fig. 2

The grain boundary maps of the various regions in the weld at 10 kW laser power and 4 m min−1 welding speed are shown in Fig. 3 as well as a low magnification overview. Similarly, the LABs and HABs are indicated by solid grey and solid black lines respectively. As seen from the grain boundary maps in Fig. 3, the plentiful HABs and the sporadic LABs are present in the BM because of the recrystallised structure of the BM. The microstructure of the BM is a mix structure with fine and coarse grains, and the coarse grains indicate the occurrence of grain growth during the manufacturing process of pure titanium sheet. In contrast, the LABs in the HAZ and FZ are remarkably abundant, although the grain sizes in these regions are larger than that in the BM. The LABs, i.e. the substructure boundaries, are important to the strength of the welds, as discussed later.
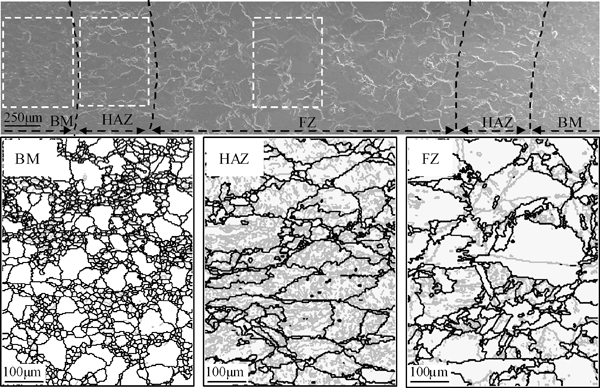
Low magnification overview and grain boundary maps of various regions in weld at 10 kW laser power and 4 m min−1 welding speed
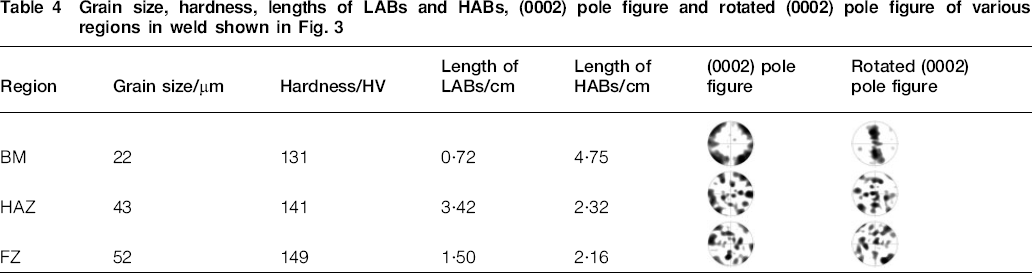
The lengths of LABs and HABs are given in Table 4, together with the grain size, hardness, (0002) pole figure and rotated (0002) pole figure of various regions in the weld. The rotated pole figures were acquired by rotating the real pole figures 90° around the ND in order to understand the textures in these regions more clearly. An evident concentration of grain orientation with the basal plane is close to the centre part of the rotated pole figure in the BM. However, the grain orientation with the basal plane is not found to concentrate near the centre part of both the real pole figures and the rotated pole figures in the HAZ and FZ. This is different from the result observed in the friction stir weld of pure titanium. 18 18,19 The texture in the BM may explain why the scatter extent of hardness in the BM is smaller than that in the HAZ and FZ. It can also be seen from Table 4 that the length of the LABs markedly increases in the HAZ and FZ, and the increased length of the LABs indicated that a large number of substructures are formed in the HAZ and FZ. The formation of substructure is mainly attributed to two aspects: the adjacent α variants inherited from one β grain may represent the close orientation due to the non-equilibrium transformation caused by fast cooling rate,20 and the neighbouring α variants transformed from different β grains possibly show the same orientation because of the close orientation between the two β grains.21
Grain size, hardness, lengths of LABs and HABs, (0002) pole figure and rotated (0002) pole figure of various regions in weld shown in Fig. 3
Strengthening mechanisms in laser beam welds
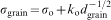
As shown in Table 4, the mean grain size in the BM is ∼22 μm, while the grain sizes in the HAZ and FZ are ∼43 and 52 μm respectively (i.e. grain coarsening has occurred in the weld). The coarse grains usually result in a decrease in hardness and/or strength according to the Hall–Petch relation described by the following equation
However, the results of the hardness test shown in Table 4 cannot be explained according to the grain size, suggesting that other factors cause the strengthening of the HAZ and FZ. In fact, the increment of yield stress resulting from substructure strengthening Δσsubstructure should be taken into account considering the existence of abundant substructures in the HAZ and FZ dissimilar with the BM. The substructure strengthening is associated with the fact that the substructure boundaries (LABs) act as a barrier to dislocation motion.22–
24 Thus, the total yield stress in the HAZ σHAZ can be described as follows

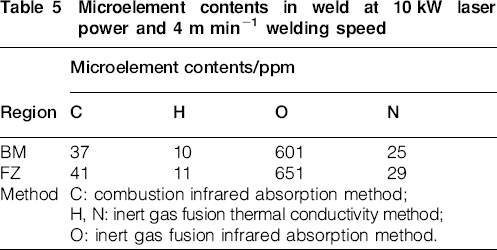
However, the active titanium element will inevitably absorb a small quantity of other elements from the surrounding environment during welding, although welds with silvery white surfaces were obtained after welding. It is well known that the strength of pure titanium depends on the microelement contents, especially on the N and O elements. The microelement contents in the weld under the condition of 10 kW laser power and 4 m min−1 welding speed are shown in Table 5. The microelement contents in the FZ are actually higher than those in the BM, and the increment of yield stress generated by solute solution strengthening Δσsolute should also be taken into account in the FZ. The solute solution strengthening is mainly due to the fact that the solute atoms can impede dislocation motion by the interacting between the solute atoms and the dislocations.
24
24,25 Therefore, the total yield stress in the FZ σFZ can be put in the form as follows

Microelement contents in weld at 10 kW laser power and 4 m min−1 welding speed
Conclusions
The LBW of pure titanium was carried out, and the mechanical properties and strengthening mechanisms in the welds were investigated. The tensile strengths and elongations of the laser beam welds show the same values as those of BM under the welding conditions employed in the present work, and all the fracture of the tensile specimens occurred at the BM, implying that the HAZ and FZ are stronger than the BM. Although a significant scatter is found in the hardness distribution, the average hardness in the HAZ and FZ is higher than that in the BM, which is accordant with the result of the tensile test. The welding heat input evidently leads to grain coarsening in the HAZ and FZ, and the coarse grains usually result in the decrease in hardness. However, the opposite results are found in the HAZ and FZ. The strengthening mechanism in the HAZ is due to substructure strengthening while that in the FZ is attributed to the combination of substructure strengthening and solute solution strengthening.