
Abstract
This study investigates the effects of shot peening (SP) on the wear behavior of laser powder bed fusion (L-PBF) manufactured Co-Cr-Mo alloys in as-built and heat-treated (HT) conditions. SP significantly increased surface hardness, reaching 685 HV via sub-structural refinement and strain-induced gamma-to-epsilon martensitic transformation (63.04% ɛ-HCP in HT + SP), confirmed by XRD analysis. The results show that the transformation-induced plasticity (TRIP) effect and dynamic work-hardening provide superior wear resistance (4.95 × 10⁻⁵ mm3 /Nm) in the HT + SP condition. Furthermore, SP-induced surface reactivity facilitates the formation of protective tribo-oxide films, thereby transitioning the mechanism into a self-lubricating regime. Wear test findings demonstrate that SP enhances surface integrity and may eliminate the need for post-process heat treatment in industrial and biomedical applications.
Introduction
“Additive Manufacturing” or more often, “3D printing” technology enables the fabrication of components with complex geometries that are not possible to make using conventional manufacturing techniques. Using computer-aided software, the design file for the components to be manufactured is divided into the required layer thicknesses, and the g-code is generated. Transferring the g-code generated by the slicing program to the additive manufacturing device where production will be performed enables production to begin. Due to the nature of additive manufacturing, various post-processing steps are carried out after production, such as heat treatment, cleaning, recycling, shot peening, and machining or electropolishing. 1 Following these processes, the material properties are inspected to analyze phase composition or residual stresses by using X-ray diffraction (XRD).
The cold working technique known as shot peening (SP), initially used in 1940, bombards the target material's surface with pulses of tiny balls under controlled circumstances. 2 The surface is plastically deformed, hardened, and given a new shape when shots are impinged upon the surface with impacts comparable to light hammer strikes. Coverage is defined as the ratio of the plastically deformed area caused by the impact to the total exposed surface area. The intensity is characterized by the peening duration and Almen measurements. 3 SP refines grains and raises the hardness of the treated material's surface layer while causing compressive residual stresses on the surface. 4 The regulation of impacting shot velocity, and consequently, the kinetic energy of the shot flow, enables control over the peening density during the SP process. This parameter is closely linked to another pivotal control factor known as the Almen intensity. 5 This type of surface impact treatments, including the related Laser Shock Peening (LSP) process, has been proven to effectively improve the components made by other AM methods, such as Wire Arc Additive Manufacturing (WAAM). For instance, LSP has been shown to improve the tensile behavior of WAAM-fabricated NiTi 6 and enhance the compression and corrosion performance of WAAM SS308L. 7 While these studies validate the potential of peening techniques for various AM materials and processes, the literature on the specific alloy of interest in this study, Co-Cr, also reports extensive investigation into other post-processing steps.
Numerous studies on the wear behavior of additively manufactured Co-Cr alloy components have been reported in the literature. For instance, Amanov 8 produced a femoral head for MOM (metal-on-metal) bearings, additively manufactured Co-Cr-Mo alloy was treated using ultrasonic nanocrystal surface modification (UNSM) at both ambient temperature (AT) and high temperature (HT). Amanov's outcomes indicated that applying UNSM at high temperatures (HT) can reduce the surface roughness (Rₐ) of as-printed samples from 8.484 μm to as low as 1.044 μm, while simultaneously increasing surface hardness by up to 44.3%. Furthermore, this surface modification has been reported to improve both yield strength (YS) and ultimate tensile strength (UTS), while drastically reducing the specific wear rate (SWR) by approximately 77.3%. The UNSM at HT sample outperformed the UNSM at AT and as-printed Co-Cr-Mo alloy samples in terms of tribological and tribocorrosion parameters. In another study, 9 the influence of microstructural components on mechanical anisotropy was evaluated to analyze the tribocorrosion and biological response regarding the building orientation for additively manufactured Co-Cr-Mo alloy components. Although the alloy showed a weak crystallographic texture, it exhibited significant anisotropy in its tensile properties due to grain size and morphology. For example, the yield strength was approximately 42% higher on the plane perpendicular to the building direction (1095 ± 17 MPa) compared to the parallel plane (768 ± 19 MPa). Conversely, the elongation at break was 47.4% higher along the building direction (28.3 ± 3.3%) than perpendicular to it (18.7 ± 1.4%). While electrochemical behavior was independent of orientation, bio-tribocorrosion studies revealed an anisotropic wear rate, with total volume loss lower on the perpendicular plane than on the parallel plane. Furthermore, osteoblast attachment and proliferation were superior on the perpendicular plane, which exhibited a lower static water contact angle of 68° ± 3.4° compared to 81° ± 3.6° on the parallel plane, indicating higher surface energy and better cytocompatibility. According to Toh et al., 10 Ti-6Al-4V (Ti64) and Co-Cr-Mo (Co-Cr) samples with two different thicknesses were additively manufactured using the powder bed electron beam melting technique, and their tribological behavior was examined using a ball-on-disc microtribometer. The results showed for the both materials that the thinner 1 mm samples exhibited higher Vickers micro-hardness values (360.1 HV for Ti64 and 525.7 HV for CoCr) than the thicker 20 mm samples (331.6 HV for Ti64 and 496.8 HV for CoCr), due to a finer microstructure resulting from faster cooling rates. In terms of friction, the Ti64 1 mm sample had a higher mean coefficient of friction (COF) of 0.68 compared to 0.63 for the 20 mm sample, whereas the CoCr samples maintained a consistent, higher COF of approximately 0.81 regardless of thickness. Despite the higher friction, CoCr demonstrated significantly superior wear resistance with a specific wear rate of 1.8 × 10⁻⁵ mm3/Nm, which was independent of thickness and vastly lower than the wear rates of Ti64 (122.4–137.8 × 10⁻⁵ mm3/Nm). This excellent wear performance in CoCr is attributed to carbide precipitates that isolate the metallic matrix from the counter-ball's asperities. According to a study by Mantrala et al., 11 heat treatment was applied to Co-Cr-Mo alloy samples manufactured by Laser Engineered Net Shaping, a laser-based additive manufacturing (AM) method, to examine their effect on microstructure, wear, and corrosion characteristics. Tribological tests showed that the lowest wear rate of 0.90 ± 0.14 × 10⁻⁴ mm3/N m was achieved with a heat treatment cycle of solutionizing at 1200°C for 60 min followed by aging at 830°C for 4 h. Analysis of variance (ANOVA) and gray relational analysis further revealed that solutionizing time was the most influential factor for wear resistance, contributing 71% to the results. Although the highest hardness of 512 ± 58 HV was recorded for samples solutionized for 45 min and aged at 830°C for 2 h, the study concluded that a solution treatment at 1200°C for 60 min without aging provides the best overall combination of hardness, wear, and corrosion resistance. A recent study was investigated whether laser powder bed fusion (L-PBF) 12 is a more appropriate process than traditional casting for fabricating dental Co-Cr alloys. For this investigation, they conducted the metallurgical examination, Vickers hardness, nanoindentation, friction and wear tests. It was observed that the SLM alloys exhibited a homogeneous, scale-like structure and significantly superior mechanical properties compared to the dendritic microstructure of the CAST group. The SLM alloys achieved a Vickers hardness of 565.33 HV0.2 and a nanohardness of 9.06 ± 0.49 GPa, both of which were significantly higher than those of the CAST group. These enhanced mechanical properties, including a higher hardness-to-elastic modulus (H/E) ratio, enhanced wear resistance. As a result, the material exhibited a stable friction coefficient of approximately 0.46, shallower wear scars, and less wear debris than in CAST alloys. In a study where laser shock peening (LSP) was applied to laser additive manufactured (LAM) CrMnFeCoNi high-entropy alloy, 13 demonstrated that the treatment effectively converted detrimental tensile residual stresses (204 MPa) into beneficial compressive residual stresses (up to −131 MPa). This modification resulted in a significant grain refinement (from 98 micrometers to 350 nm) and a 34% increase in microhardness, leading to a superior wear resistance with the wear rate decreasing by up to 62.8%. Furthermore, LSP improved corrosion resistance by promoting the formation of stable, compact passive films that effectively resisted chloride ion aggression. Cornacchia et al. 14 investigated the microstructure, hardness, tensile behavior, and wear resistance of Co-Cr-Mo alloy samples produced by L-PBF under a various treatment conditions, including as-built (AB), four separate vacuum heat treatments, and hot isostatic pressing (HIP). The HIP treatment provided the best wear resistance, with adhesive wear being the most common wear mechanism. The friction coefficient and wear rate of the heat treatments at 800°C and 1150°C for 2 h were comparable, while the HT at 800°C appeared to be more suitable for surviving wear due to predominantly adhesive wear. In a study conducted by Zhang et al., 15 laser polishing (LP) was employed as an innovative post-processing technique to enhance the surface quality and tribological performance of CoCrFeNi high-entropy alloys (HEAs) fabricated via laser directed energy deposition (LDED). The authors demonstrated that the LP process effectively eliminates surface defects, such as powder adhesion and melt ripples, resulting in a significant reduction in surface roughness of over 96%. Beyond morphological improvements, the study revealed that laser polishing significantly refines the grain structure within the surface layer and promotes a more uniform distribution of elements. These microstructural modifications, characterized by a transformation from a coarse cellular structure to fine columnar grains with a high density of low-angle grain boundaries, resulted in a 33% reduction in the wear rate, decreasing from 0.51 mm3/(m·N) to 0.33 mm3/(m·N). Furthermore, the investigation highlighted a shift in the wear mechanism from predominant adhesive and abrasive wear in the as-fabricated state to a more stable abrasive-dominated mechanism post-polishing, further supported by the formation of protective Cr2O3 and Fe3O4 oxide layers.
Despite the extensive body of literature investigating the influence of post-processes and process parameters on wear behavior in samples produced through diverse AM methods, a discernible research gap persists concerning the impact of shot peening on the wear characteristics of additively manufactured Co-Cr-Mo alloy. This alloy is widely used in medical applications, making the lack of dedicated research on the effects of SP particularly noteworthy. The present study addresses this notable gap in the literature to provide novel insights into wear behavior in the context of Co-Cr-Mo alloy, specifically post-additive manufacturing. The scarcity of existing investigations in this area highlights the originality and novelty of the current research, which embarks on an unexplored trajectory to unravel the potential of SP to enhance the wear performance of a material integral to critical biomedical applications. Through meticulous experimentation and analysis, this study aims to provide a foundational understanding and pave the way for advancements in optimizing the wear properties of Co-Cr-Mo alloy components manufactured via additive processes.
Materials and methods
Material
In this study, CoCr28Mo6 alloy samples were produced by SLM Solutions in Lübeck, Germany, and provided for our research. The chemical composition is listed in Table 1.
Chemical composition of the metal powder used.

Sample preparation for tests
In this study, an SLM 280 Twin L-PBF system (SLM Solutions, Lübeck, Germany) was utilized for sample fabrication. The system is equipped with two 400 W laser systems and has a working volume of 280 × 280 × 365 mm. Samples were manufactured in an argon atmosphere. To ensure a high relative density and minimize defects, the processing parameters were optimized as follows: a scanning speed of 900 mm/s, a stripe-scanning strategy, and a hatch distance of 120 μm. The layer thickness was maintained at 30 μm throughout the build process. As illustrated in Figure 1, the cylindrical samples (Ø30 mm x 20 mm) were built perpendicular to the build plate.
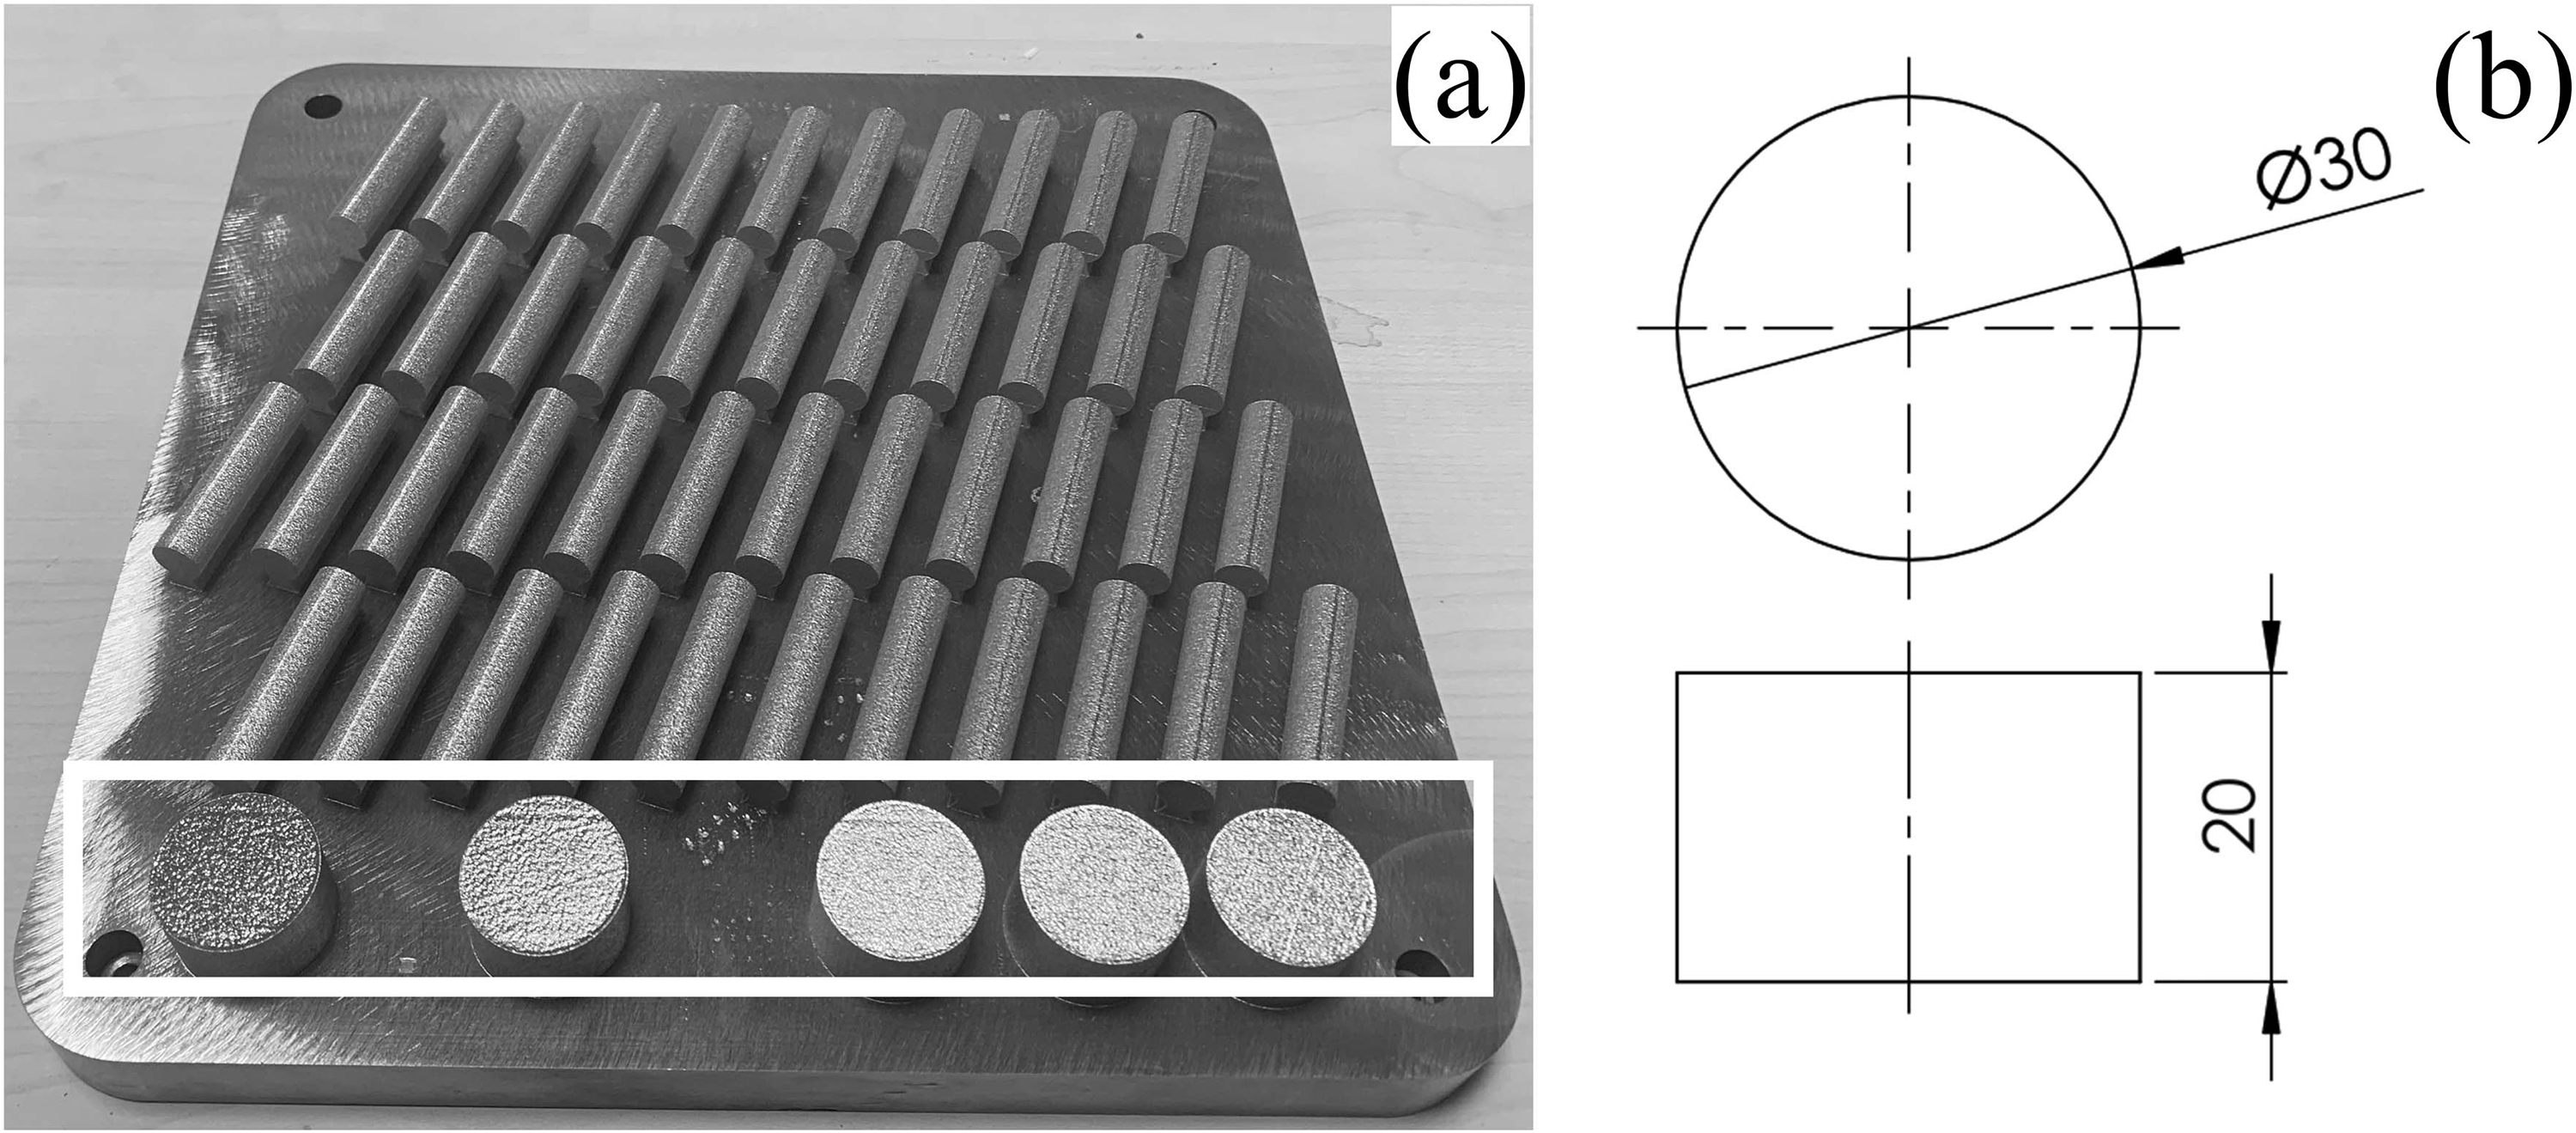
Raw body samples for wear testing located at the front of the manufactured plate (white rectangle) (a) and the designed body geometry (b).
The wire electrical discharge machining (Wire-EDM) technique was employed to precisely section samples from the substrate table. As shown in Figure 2, the as-built samples were sectioned into 4 mm discs using a wire EDM machine, in accordance with the ASTM G99-17 standard dimensions. Subsequently, the sample surfaces were ground using SiC abrasive papers of 120, 400, 800, 1200, and 2500 grit. Final surface preparation was completed by polishing with 3 μm and 1 μm diamond solutions and polishing cloths to achieve a mirror-like finish.
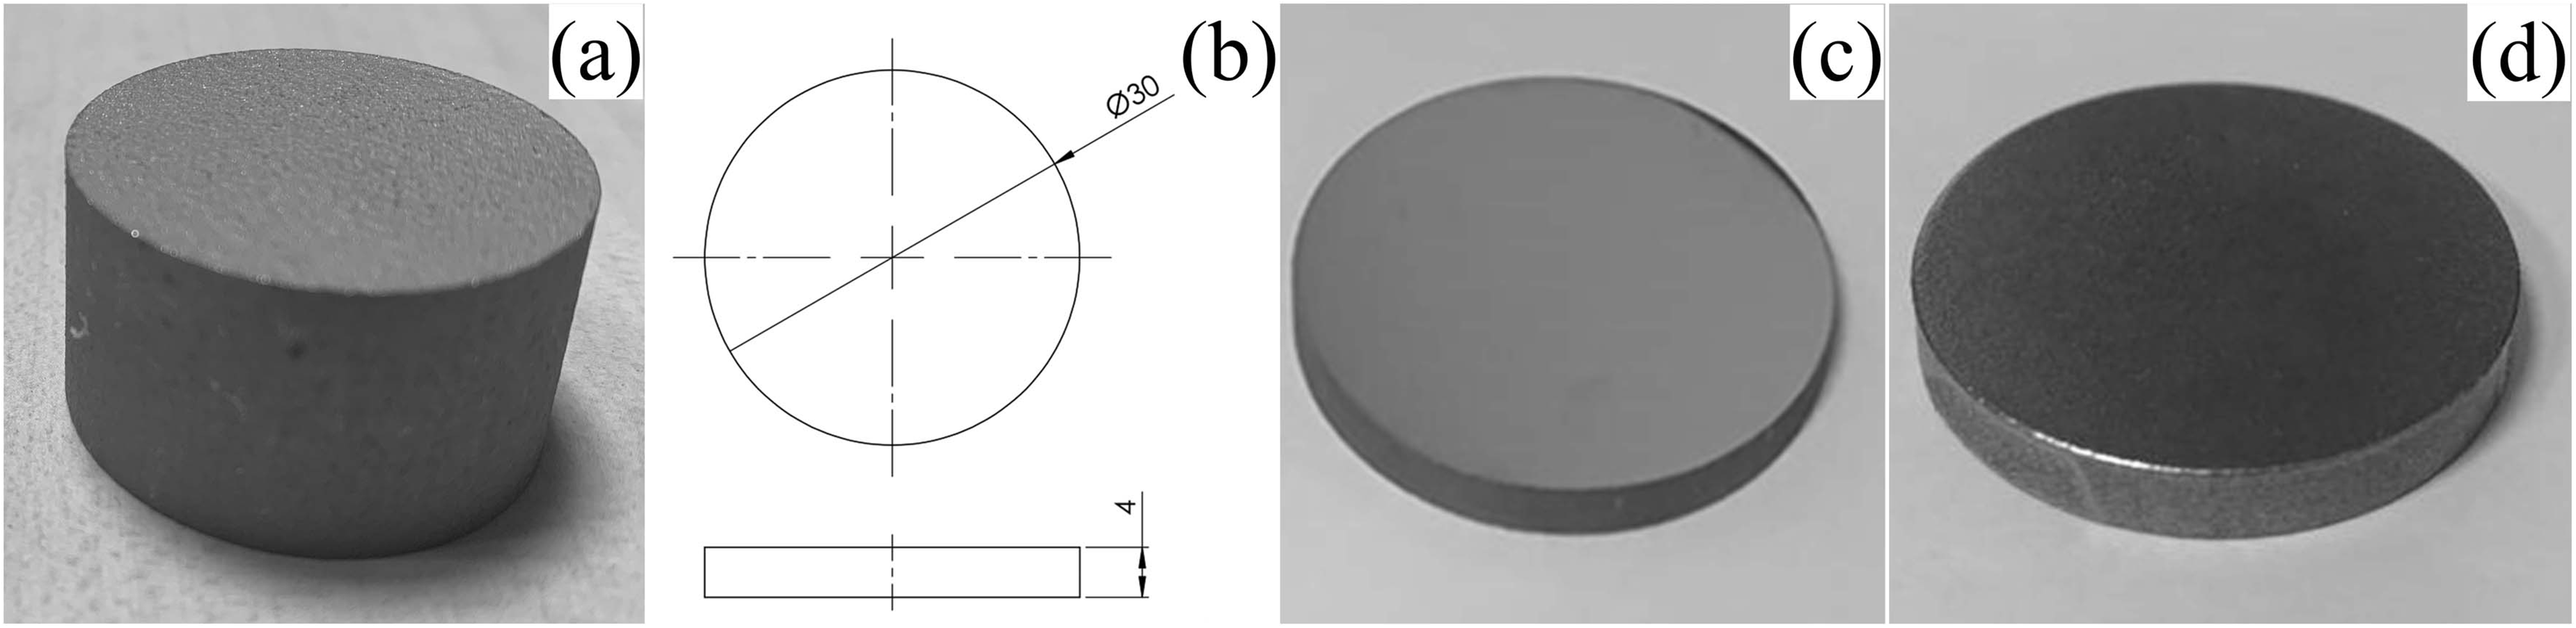
The raw body of the wear sample, cut using a wire electrical discharge machining (Wire-EDM) machine (a), the wear sample geometry conforming to the G99-17 standard (b), the final polished sample (c), and peened with 100% coverage samples (d).
Manufactured samples were divided into two main groups, and the second group underwent a stress-relief heat treatment. The as-built group was labeled as “AB”, and the heat-treated group was labeled “HT”. Furthermore, within each group, the second half was subjected to shot peening, denoted as “AB + SP” (as-built and shot peened) and “HT + SP” (heat-treated and shot peened), respectively.
Heat treatment
The samples manufactured on one of the plates underwent heat treatment for stress relief using the parameters employed by SLM Solutions Lübeck in Germany prior to their cutting with a wire erosion machine. The heat treatment procedure consisted of the following phases 16 : The samples were initially heated to 800°C in a furnace. Once the temperature stabilized at 800°C, the plate was held at this temperature for 45 min. Finally, the plate was removed from the furnace and allowed to cool to room temperature in still air.
Shot peening
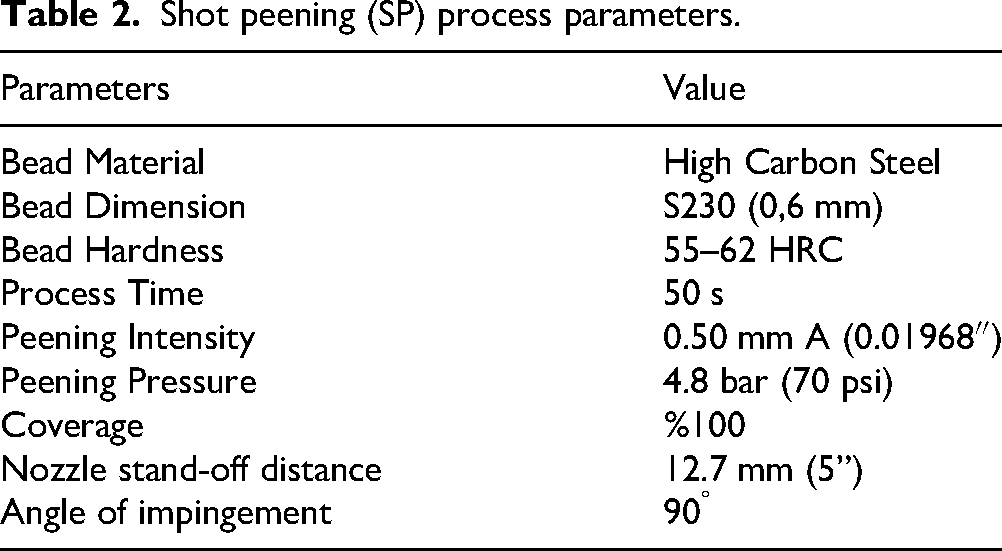
The shot peening process was carried out using the Micropeen-Peenmatic 2000S model shot peening machine manufactured by IEPCO. The SP process was applied to the samples with full coverage, as shown in Figure 2(d). The parameters for the process are presented in Table 2. Saturation time was determined, and the process duration was set to 50 s. An A-type Almen strip, compliant with the SAE J443 standard, 17 was used to measure the Almen intensity.
Shot peening (SP) process parameters.
Surface characterization
The samples were imaged using a Nikon SMZ 745 T model stereo microscope and a Thermo Fisher Scientific Apreo S model scanning electron microscope (SEM).
A Mitutoyo SJ 301 model surface roughness measuring instrument was used for surface roughness testing. Surface roughness measurements were taken five times on random sections of the samples in accordance with ISO 468:1982.
To determine the microhardness profiles, the sample cross-sections were prepared as shown schematically in Figure 3. The specimens were mounted in Bakelite, ground using progressively finer SiC abrasive papers (120, 400, 800, 1200, and 2500 grit), and polished with 3 µm and 1 µm diamond solutions. Vickers microhardness measurements were conducted using a Shimadzu HMV-2 tester in accordance with ASTM E384-17. Hardness-depth profiles were established by taking 10 measurements at each depth across three repetitions to ensure statistical reliability.
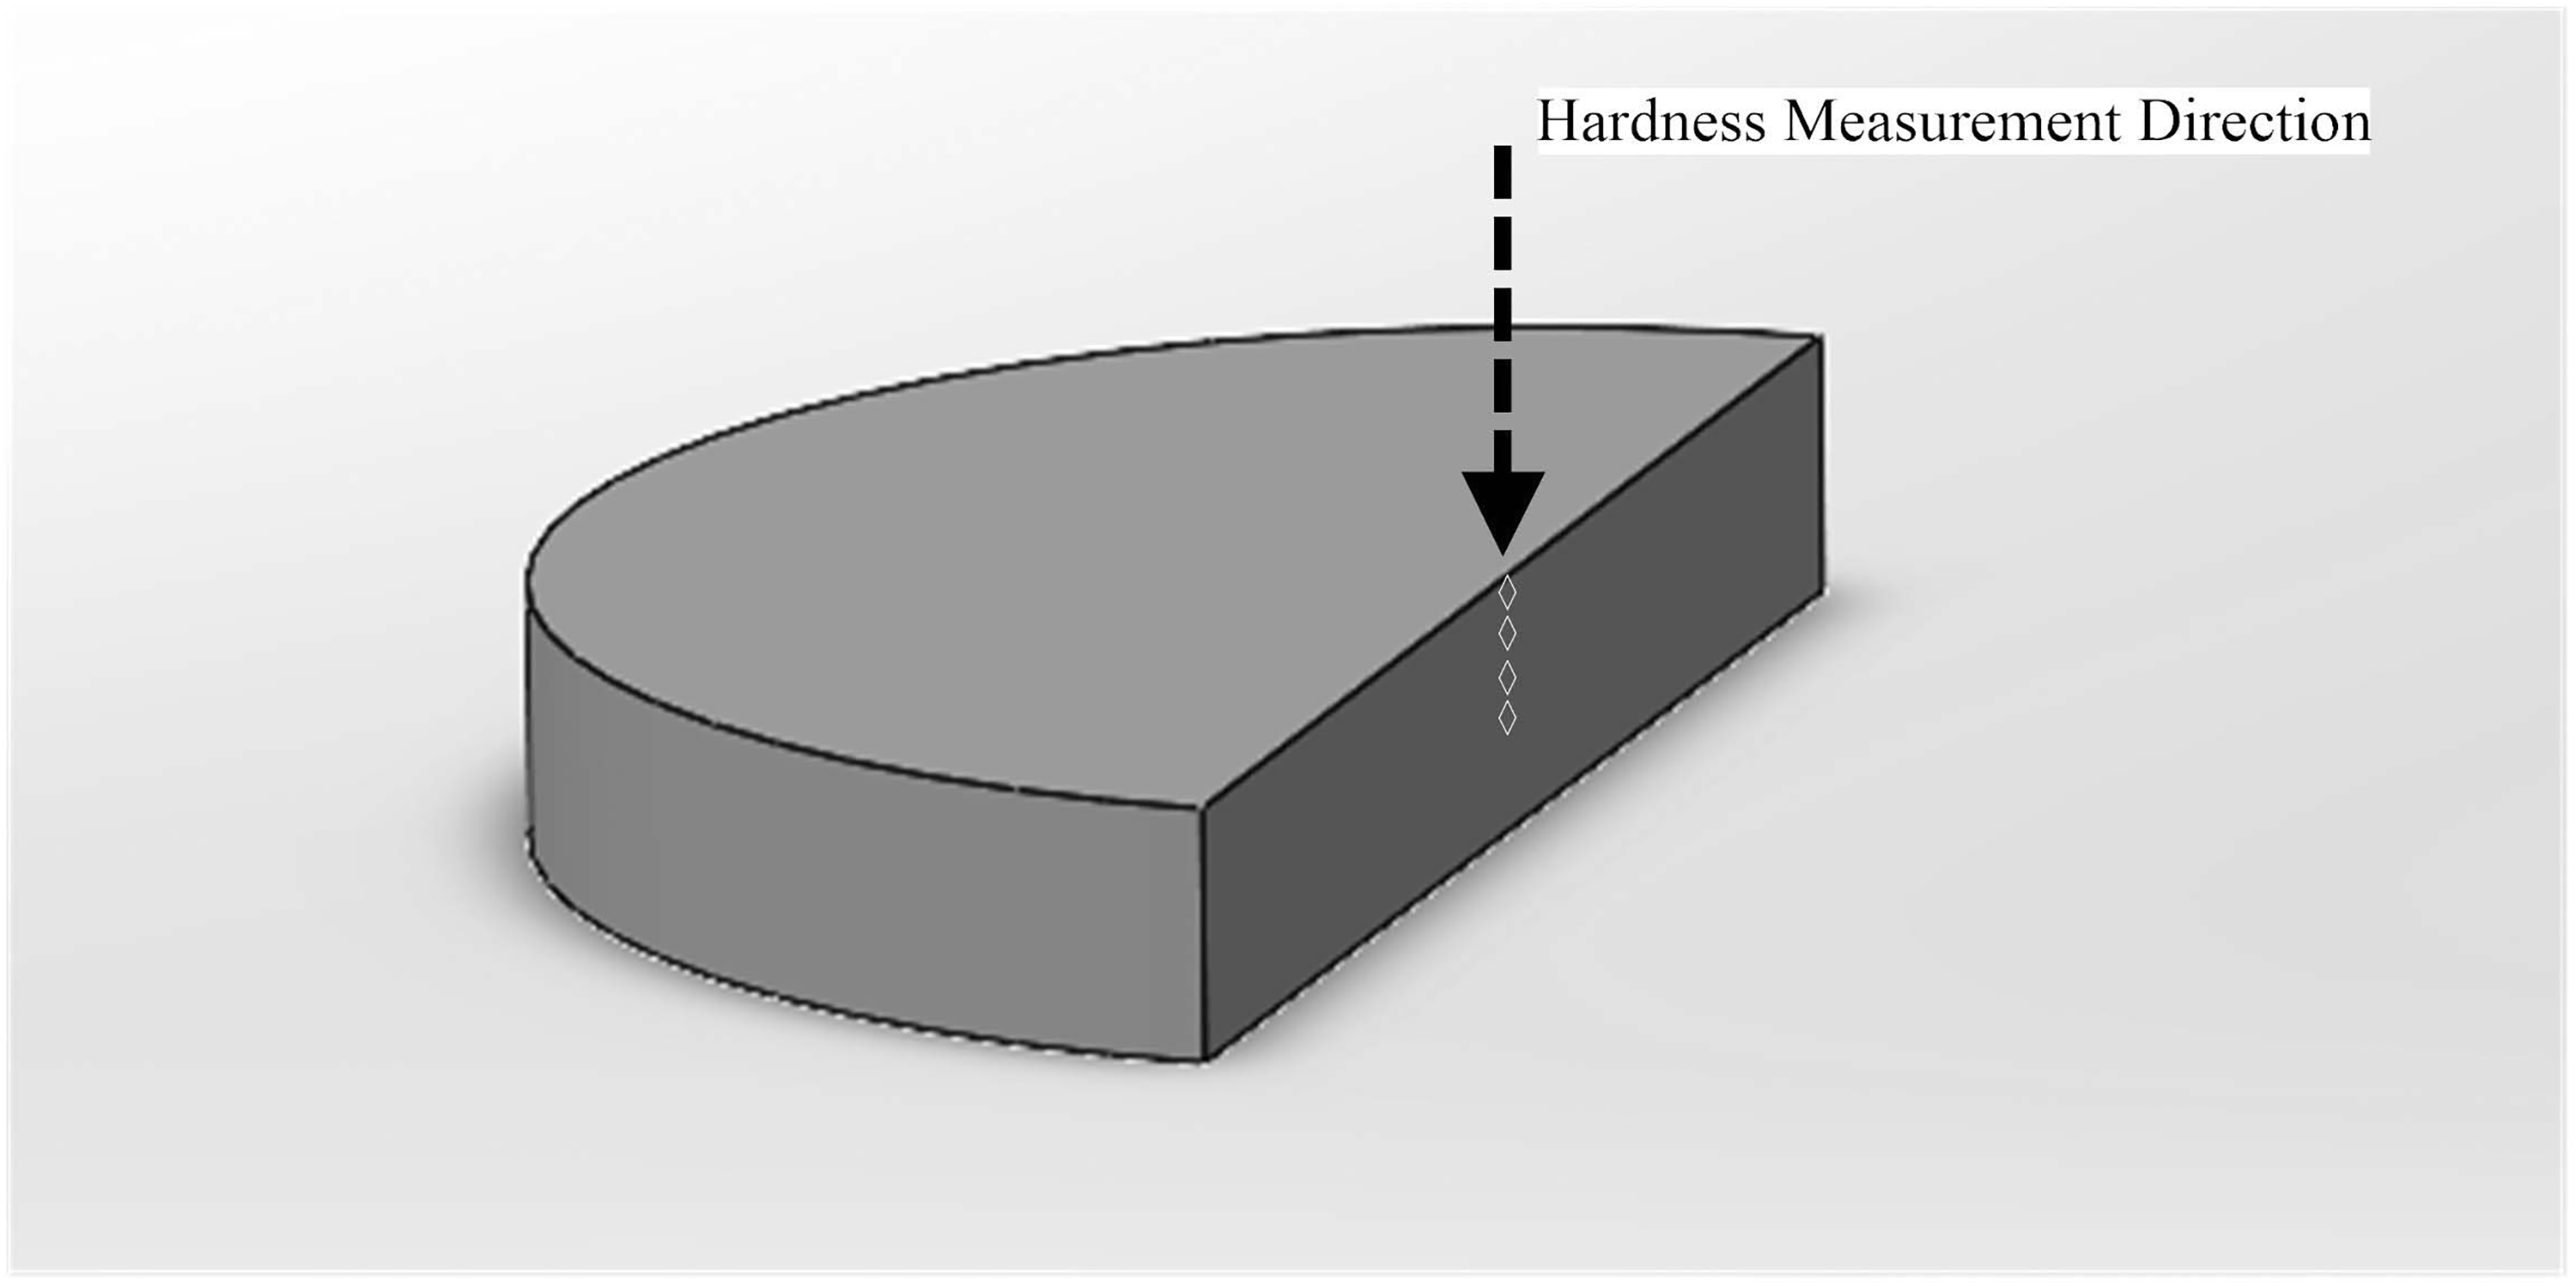
Sample schematic image for the hardness measurements.
A Thermo Scientific ARL X'TRA model XRD apparatus was used to determine the crystallographic orientations and phase analyses of the samples. The scans were carried out with a step size of 0.02° (2θ) and a scan step time of 1.0 s over a range of 30° to 90°. For scanning, one sample was chosen from each of the AB, HT, AB + SP, and HT + SP groups. Volume fractions of the ɛ-HCP phase were calculated and compared using Sage and Guillaud's method
18
using Equation (1). The crystallite sizes were determined using the Scherrer equation in Equation (2), as shown below.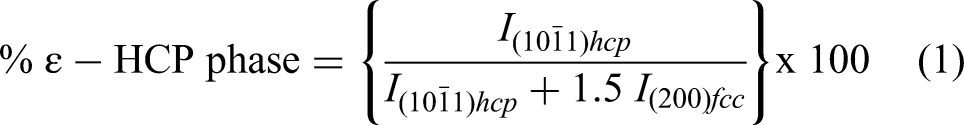
Here, I represents obtained phase intensity values.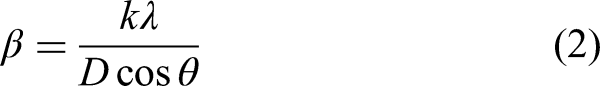
Where β is the broadening of diffraction reflection peaks, k is the shape factor, λ is the X-ray wavelength of the XRD device, D indicates the crystal size and θ is the Bragg reflection angle.
Wear test procedures
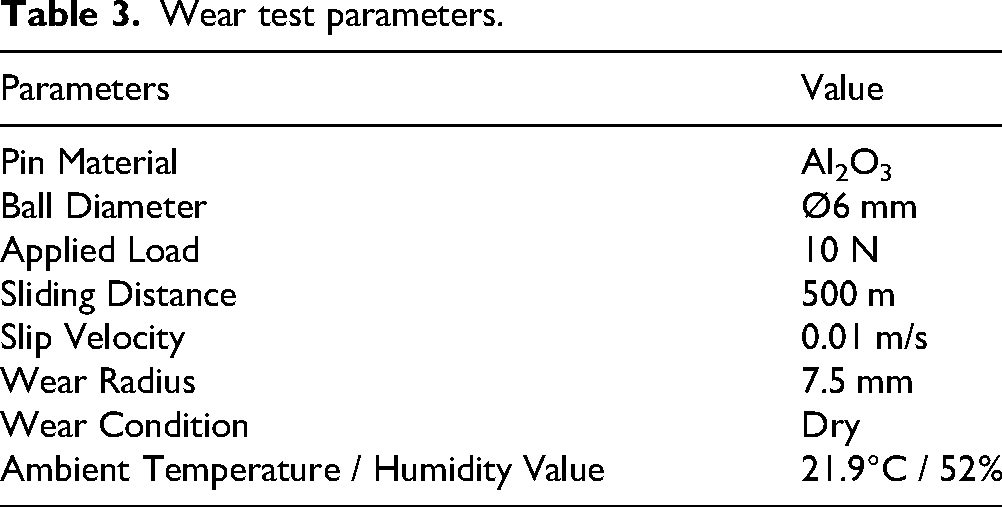
Wear tests were performed on the sample surfaces, and all samples were ground with SiC sandpapers of 120, 400, 800, 1200, and 2500 grit sizes to establish reference surfaces prior to wear testing. The polishing procedure was then completed using 3 µm alumina and 3 µm diamond polishing solutions. All specimens were sequentially ultrasonically cleaned in acetone and distilled water before and after the wear tests to remove any residual media. Roughness testing revealed that the surface roughness of all samples was Ra = 0.02 µm prior to wear. Following the cleaning procedure, the wear tests were conducted on five samples from each group using a CSM Instruments pin-on-disk tribometer with the parameters specified in Table 3, in accordance with ASTM G99-05 (G02 Committee).
Wear test parameters.
A profilometer (Mitutoyo SJ 301) was used to capture profile images (surface roughness graphs) of the wear track in the wear region to calculate the wear loss. The wear loss for all samples was calculated from profile images by using MATLAB version R2023a. First, a code was developed to calculate the number of pixels corresponding to the length between two points selected by the user using the cursor. This value was used to calculate the relationship between pixels and unit length. The pixel value per unit area was calculated by repeating this process for both axes and multiplying the two pixel-unit lengths obtained. Once the pixel area value per unit area was determined, the MATLAB-generated image processing code was used to select two peak points on the surface roughness graphs of the samples to determine the worn area. Subsequently, a line (in black) passing through the two points selected by the cursor was created. The region of interest (ROI), the area to be processed, was delimited by a rectangle defined by a third point selected by the user, located just below the worn area. The obtained images were processed using the Otsu's thresholding method, 19 which is based on histogram analysis to automatically determine an optimal threshold for creating a binary image. The binarized images were inverted, and the worn area was filled with white pixels. Finally, the total wear volume was calculated by multiplying the acquired worn area by the perimeter of the wear track.
Equation (3) was used to calculate the specific wear rate.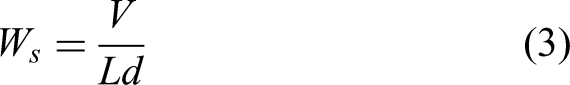
The term “Ws” represents the specific wear rate (mm3 /Nm), where “V” denotes the wear volume (mm3), “L” refers to the applied load (N), and “d” represents the sliding distance (m). The hardness and surface roughness results were statistically analyzed using an independent samples t-test (α = 0.05). The data from the surface roughness evaluations were statistically analyzed using Tukey's multiple-comparison test. A p-value < 0.05 was considered significant.
Results
XRD
The XRD patterns for all samples are provided in Figure 4. Upon examining the XRD patterns, the presence of γ-FCC and ɛ-HCP phases were detected in all samples. According to calculations performed following the formulation developed by Sage and Guillaud, 18 the ɛ-HCP ratio was determined to be 42.75% in the AB samples and 27.00% in the HT samples, as shown in Figure 5. It was observed that the ɛ-HCP ratio increased in the AB + SP samples, reaching 51.08%. In the HT + SP samples, the ɛ-HCP ratio was 63.04%.
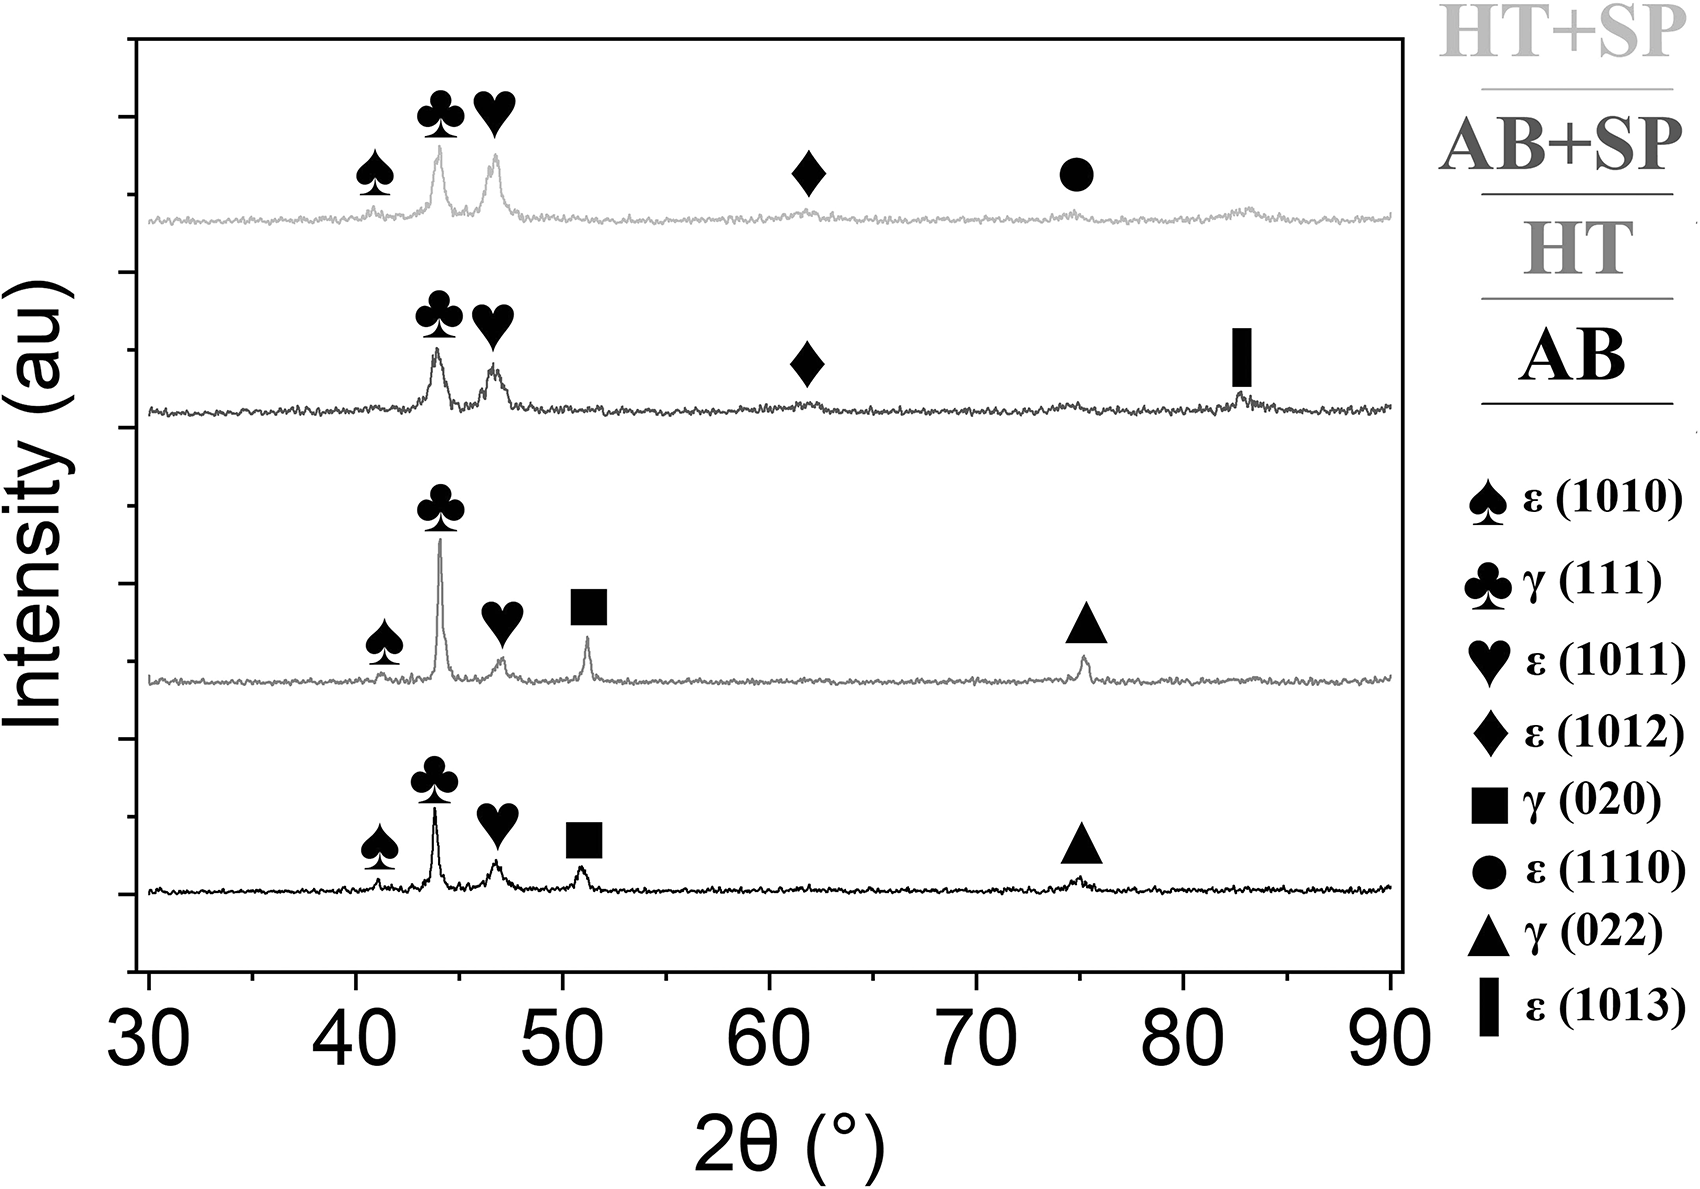
XRD analysis results for all sample groups.
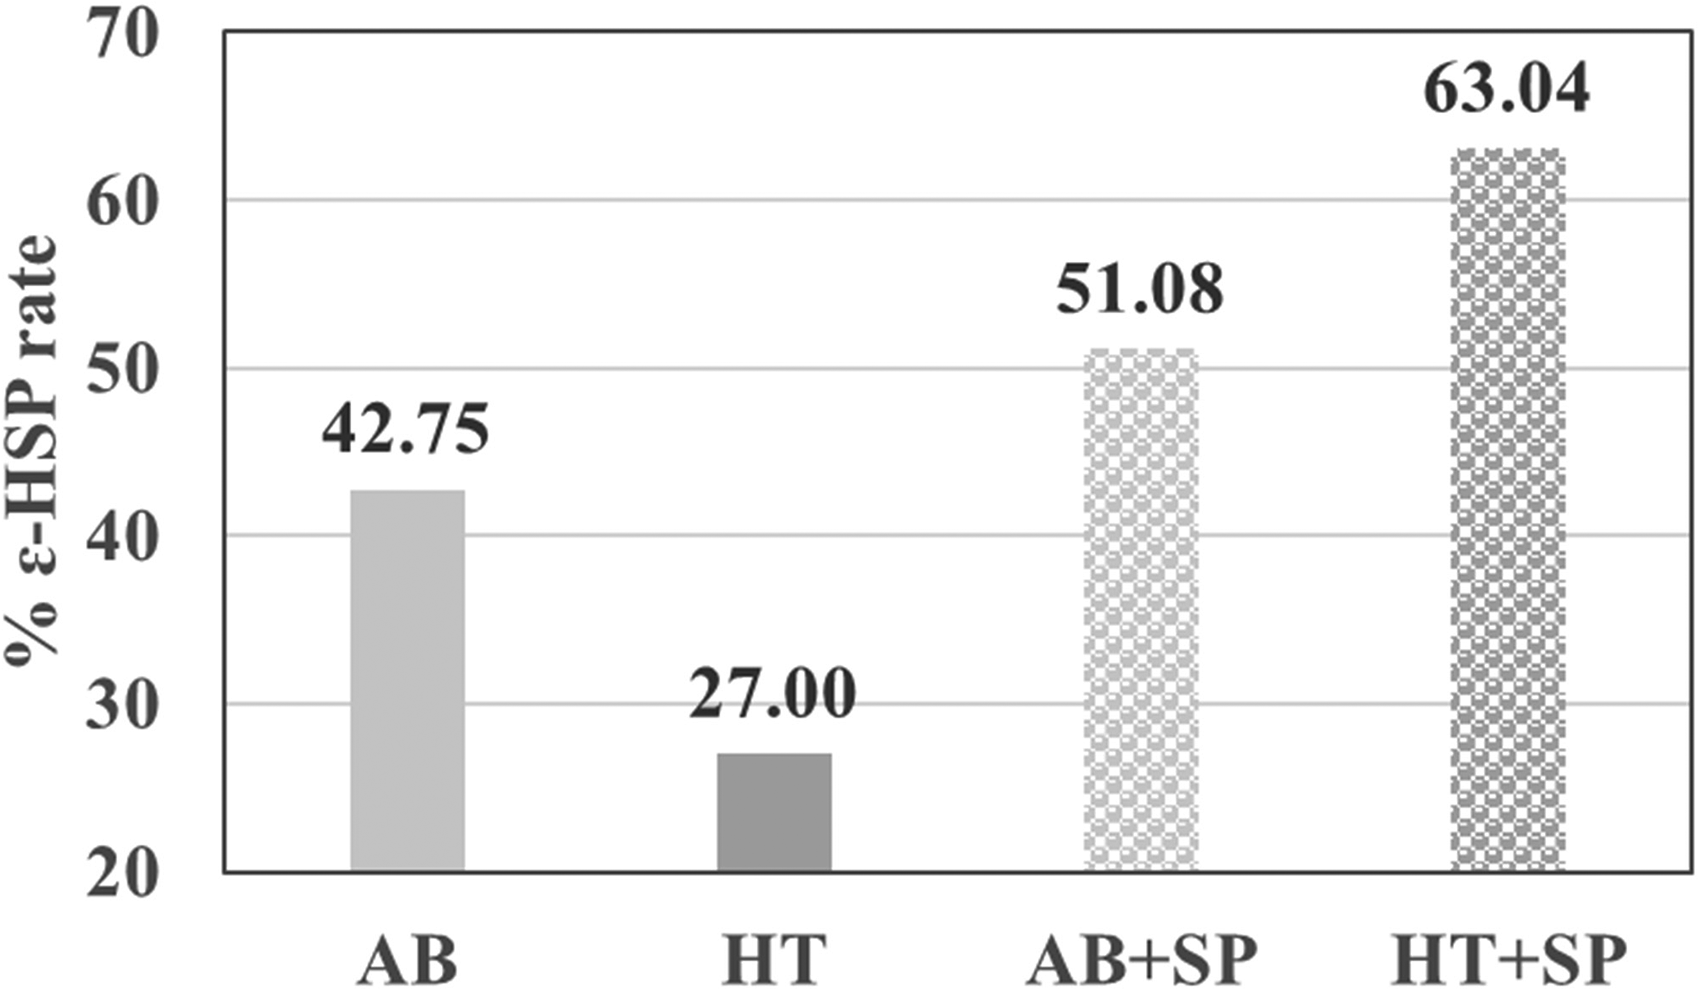
ɛ-HCP ratios for all sample groups.
When examining the ɛ(1011) peak present in all samples, it was observed that the diffraction angle (2θ) for the AB samples was 46.66°, and for the AB + SP samples, it was 46.65°, indicating no significant change. However, the HT samples showed a diffraction angle of 47.03°, indicating a slight reduction in strain compared to the AB samples. In the HT + SP samples, the diffraction angle was 46.76°, suggesting a slight increase in strain (approximately 0.6%) compared to the HT samples. As illustrated in Figure 6, it was observed that the HT samples had larger crystallite sizes in comparison to the AB samples. Conversely, the shot-peened samples exhibited smaller crystallite sizes. Overall, the results indicate that the diffraction angles and crystallite sizes vary between the different sample types, suggesting variations in strain and crystallite structure. The changes in crystallite size obtained from XRD tests are shown in Figure 6. It was determined that the average crystallite size of the AB samples decreased from 434.99 nm to 155.38 nm (a 65% reduction) after the SP process. Similarly, in the HT samples, the average crystallite size decreased from 438.42 nm to 181.4 nm after the SP process. This significant decrease corresponds to a reduction of about 58%.When the lattice strains of all sample groups, as shown in Figure 6, were examined, it was found that the lattice strain for AB samples rose from 0.214% to 0.598% (increased by a factor of 2.79) following the SP process. Similarly, after the SP process for HT samples, the lattice strain increased from 0.212% to 0.510% (a factor of 2.4).
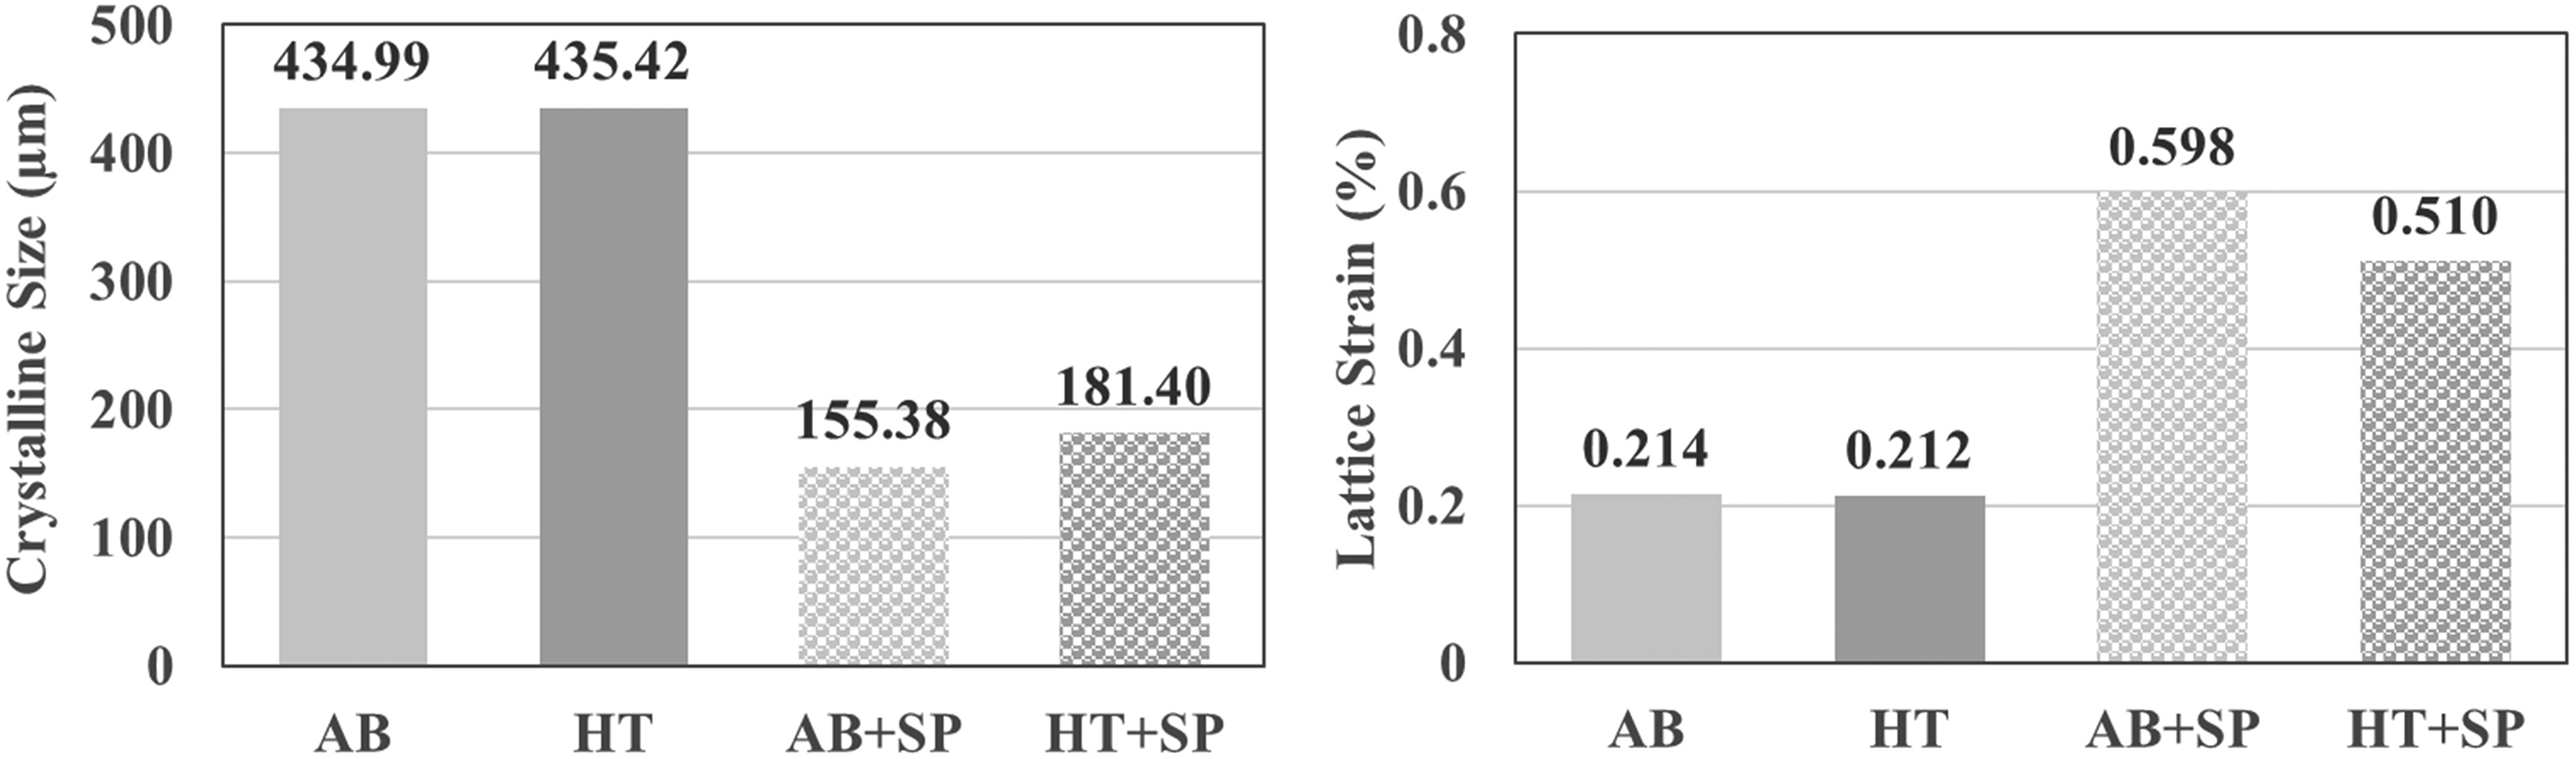
Crystallite size (left) and Lattice strain (right) graph of the γ-FCC (111) phase for all sample groups.
Surface roughness
The rougness measurements were performend to determine the surface properties of the sample used in this research. After the manufacturing, the AB and HT samples were polished, and the SP process was applied. Figure 7 shows the surface roughness measurements before and after the SP procedure, along with the corresponding surface profiles.
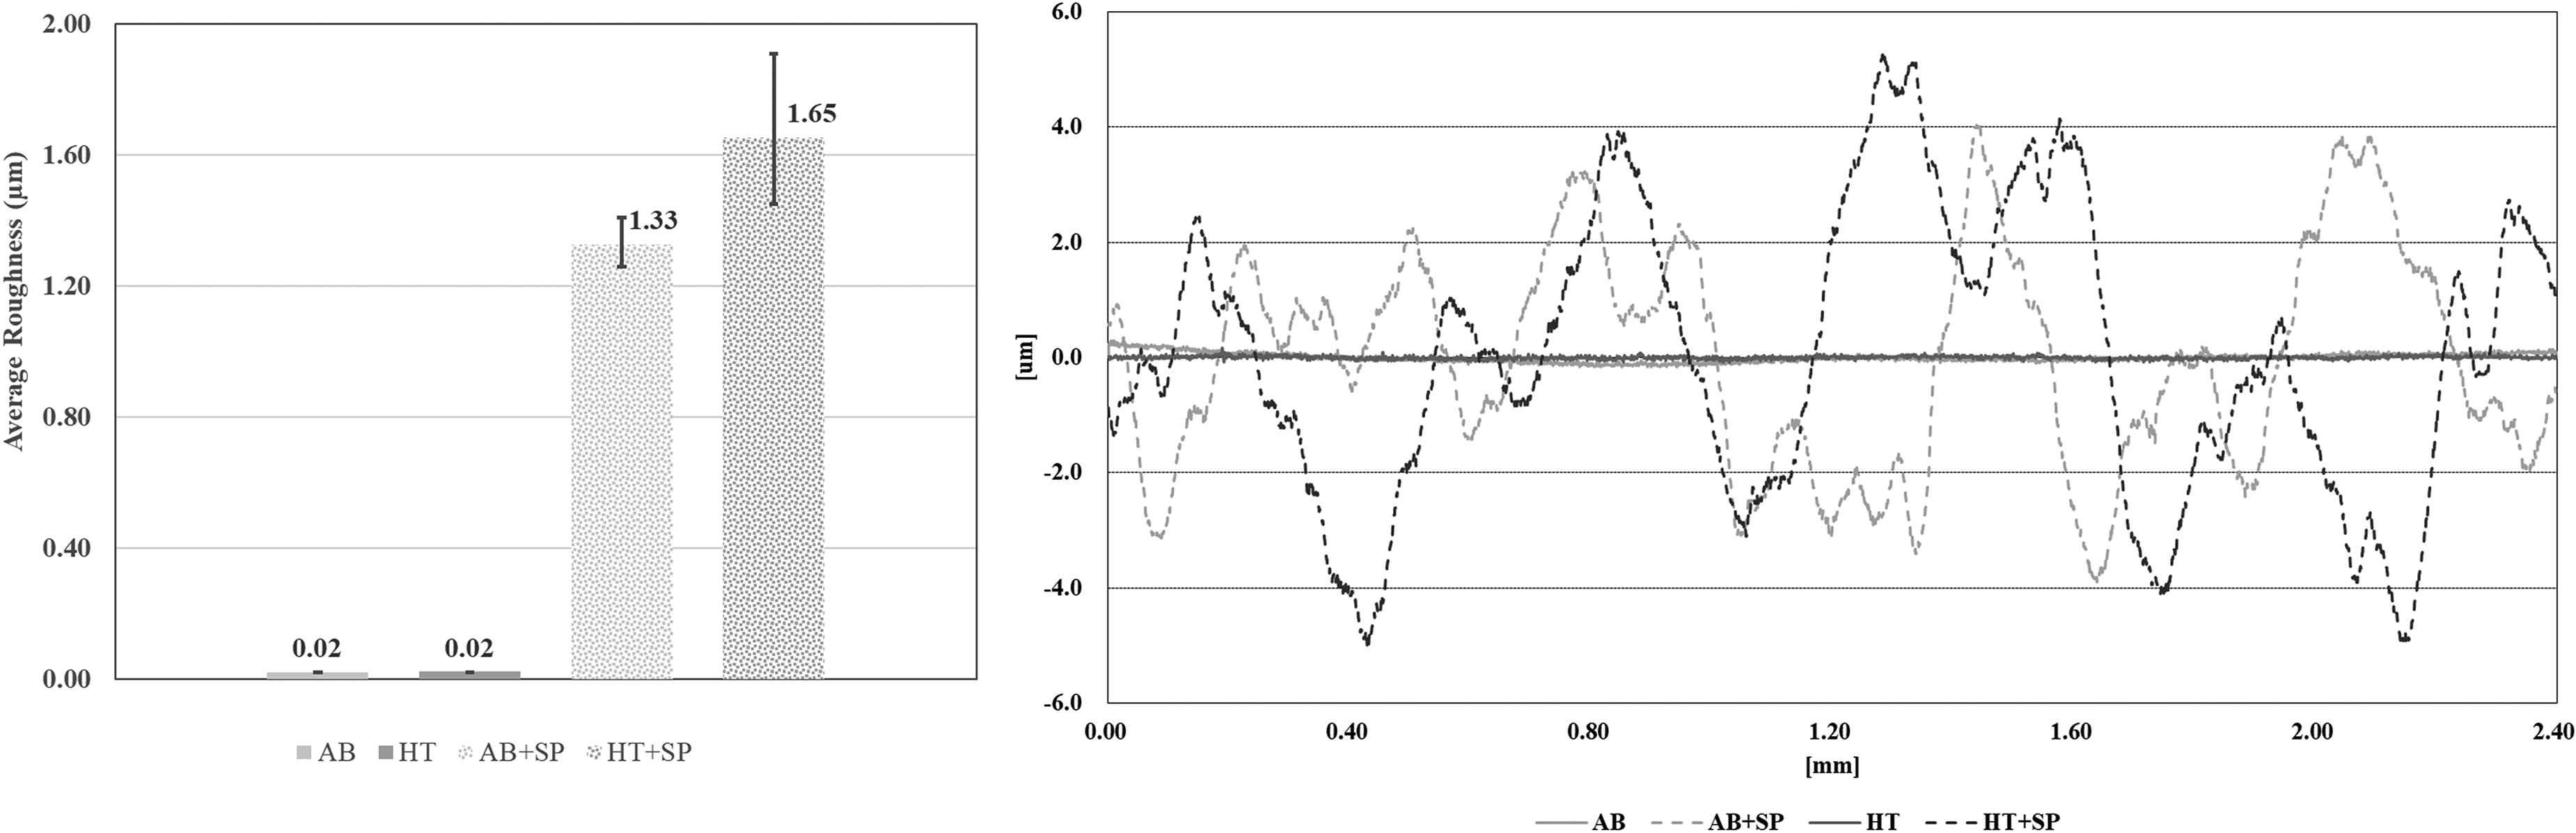
Surface roughness measurement results (left) and surface profiles of the samples before and after the shot peening process.
Hardness
The results of hardness measurements on AB and HT samples are shown in Figure 8. The heat treatment reduced the hardness from 518 ± 4 HV to 372 ± 5 HV.
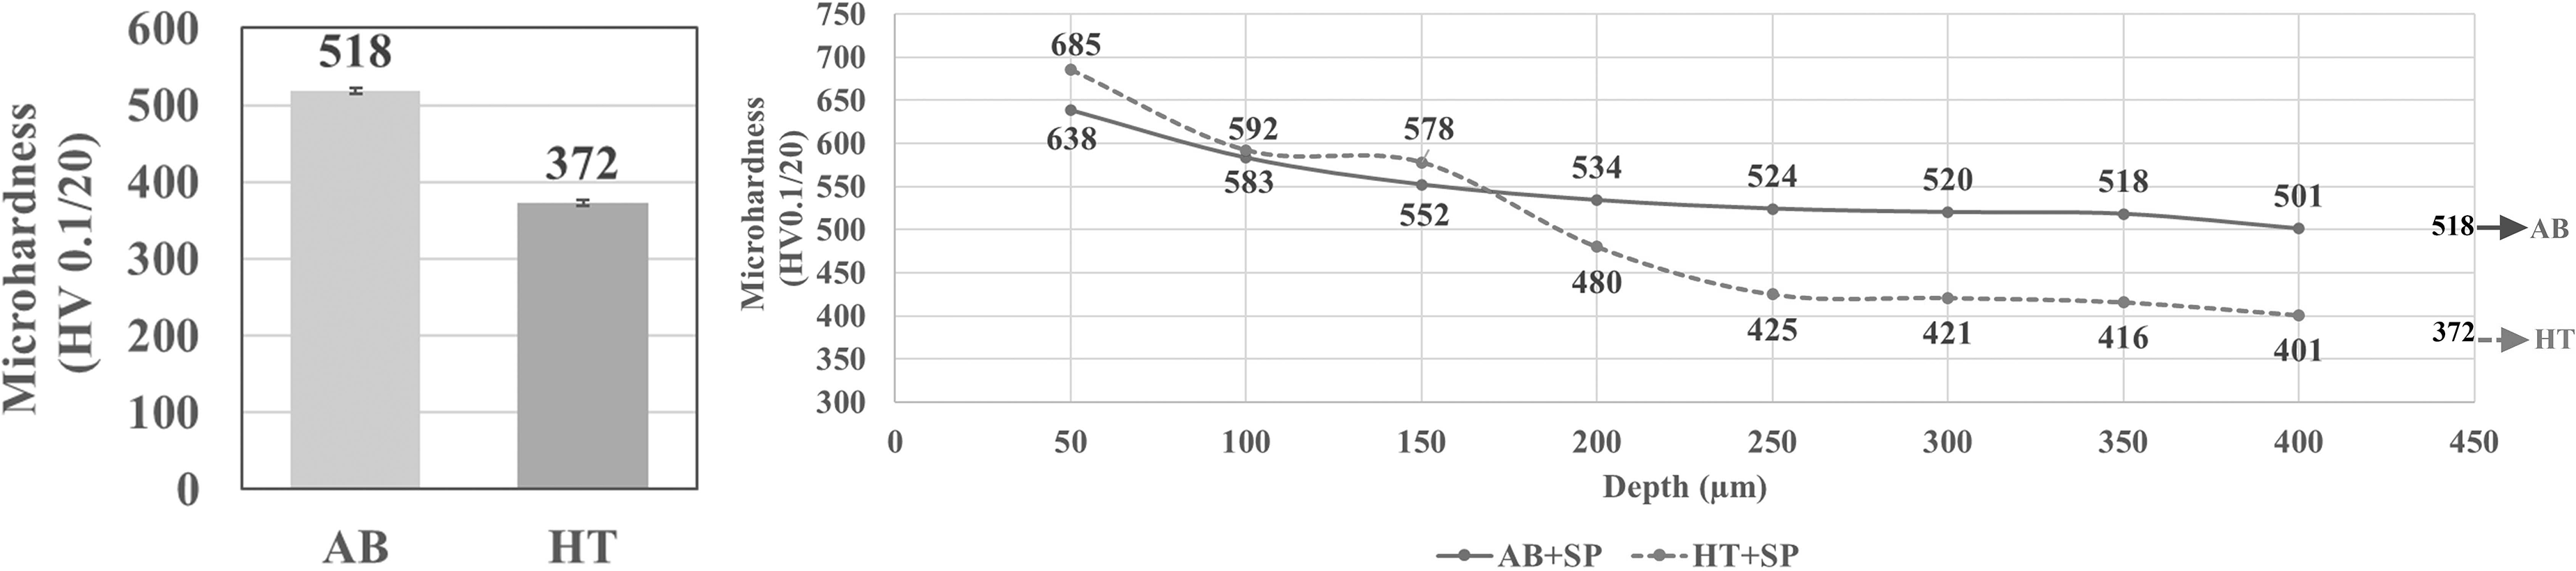
HV0.1/20 average hardness measurement results for AB and HT samples (left) and the average (HV0.1/20) hardness measurement results of AB + SP and HT + SP wear samples at different depths (right).
Figure 8 depicts the HV0.1/20 hardness values for AB + SP and HT + SP samples as a function of depth. When the hardness values measured in the near-surface region (∼50 µm) are examined, the highest values were observed in the HT + SP samples. Due to the work-hardening effect induced by SP, the hardness values of both AB and HT samples increased following the SP process. It was found that the shot peened samples hardened to a depth of 350 µm for the AB samples and 400 µm for the HT samples.
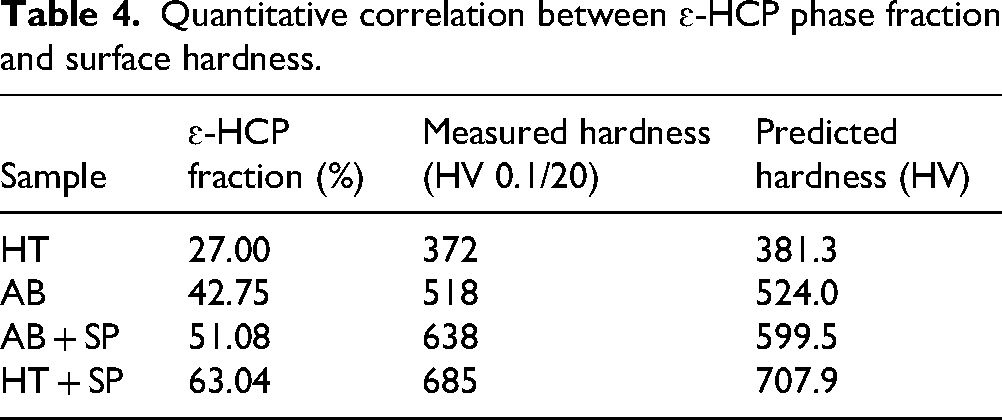
The significant increase in hardness, particularly following the Surface Peening (SP) treatment, can be attributed to the strain-induced transformation (SIT) from the γ-FCC phase to the ɛ-HCP phase. To quantitatively evaluate this relationship, a Linear Rule of Mixtures (Phase Rule) model was employed. The total hardness Htotal was expressed as a function of the volume fractions of the constituent phases according to Equation (4):
Quantitative correlation between ɛ-HCP phase fraction and surface hardness.
Wear
The wear profiles obtained from the wear tests of all sample groups are presented comparatively in Figure 9.
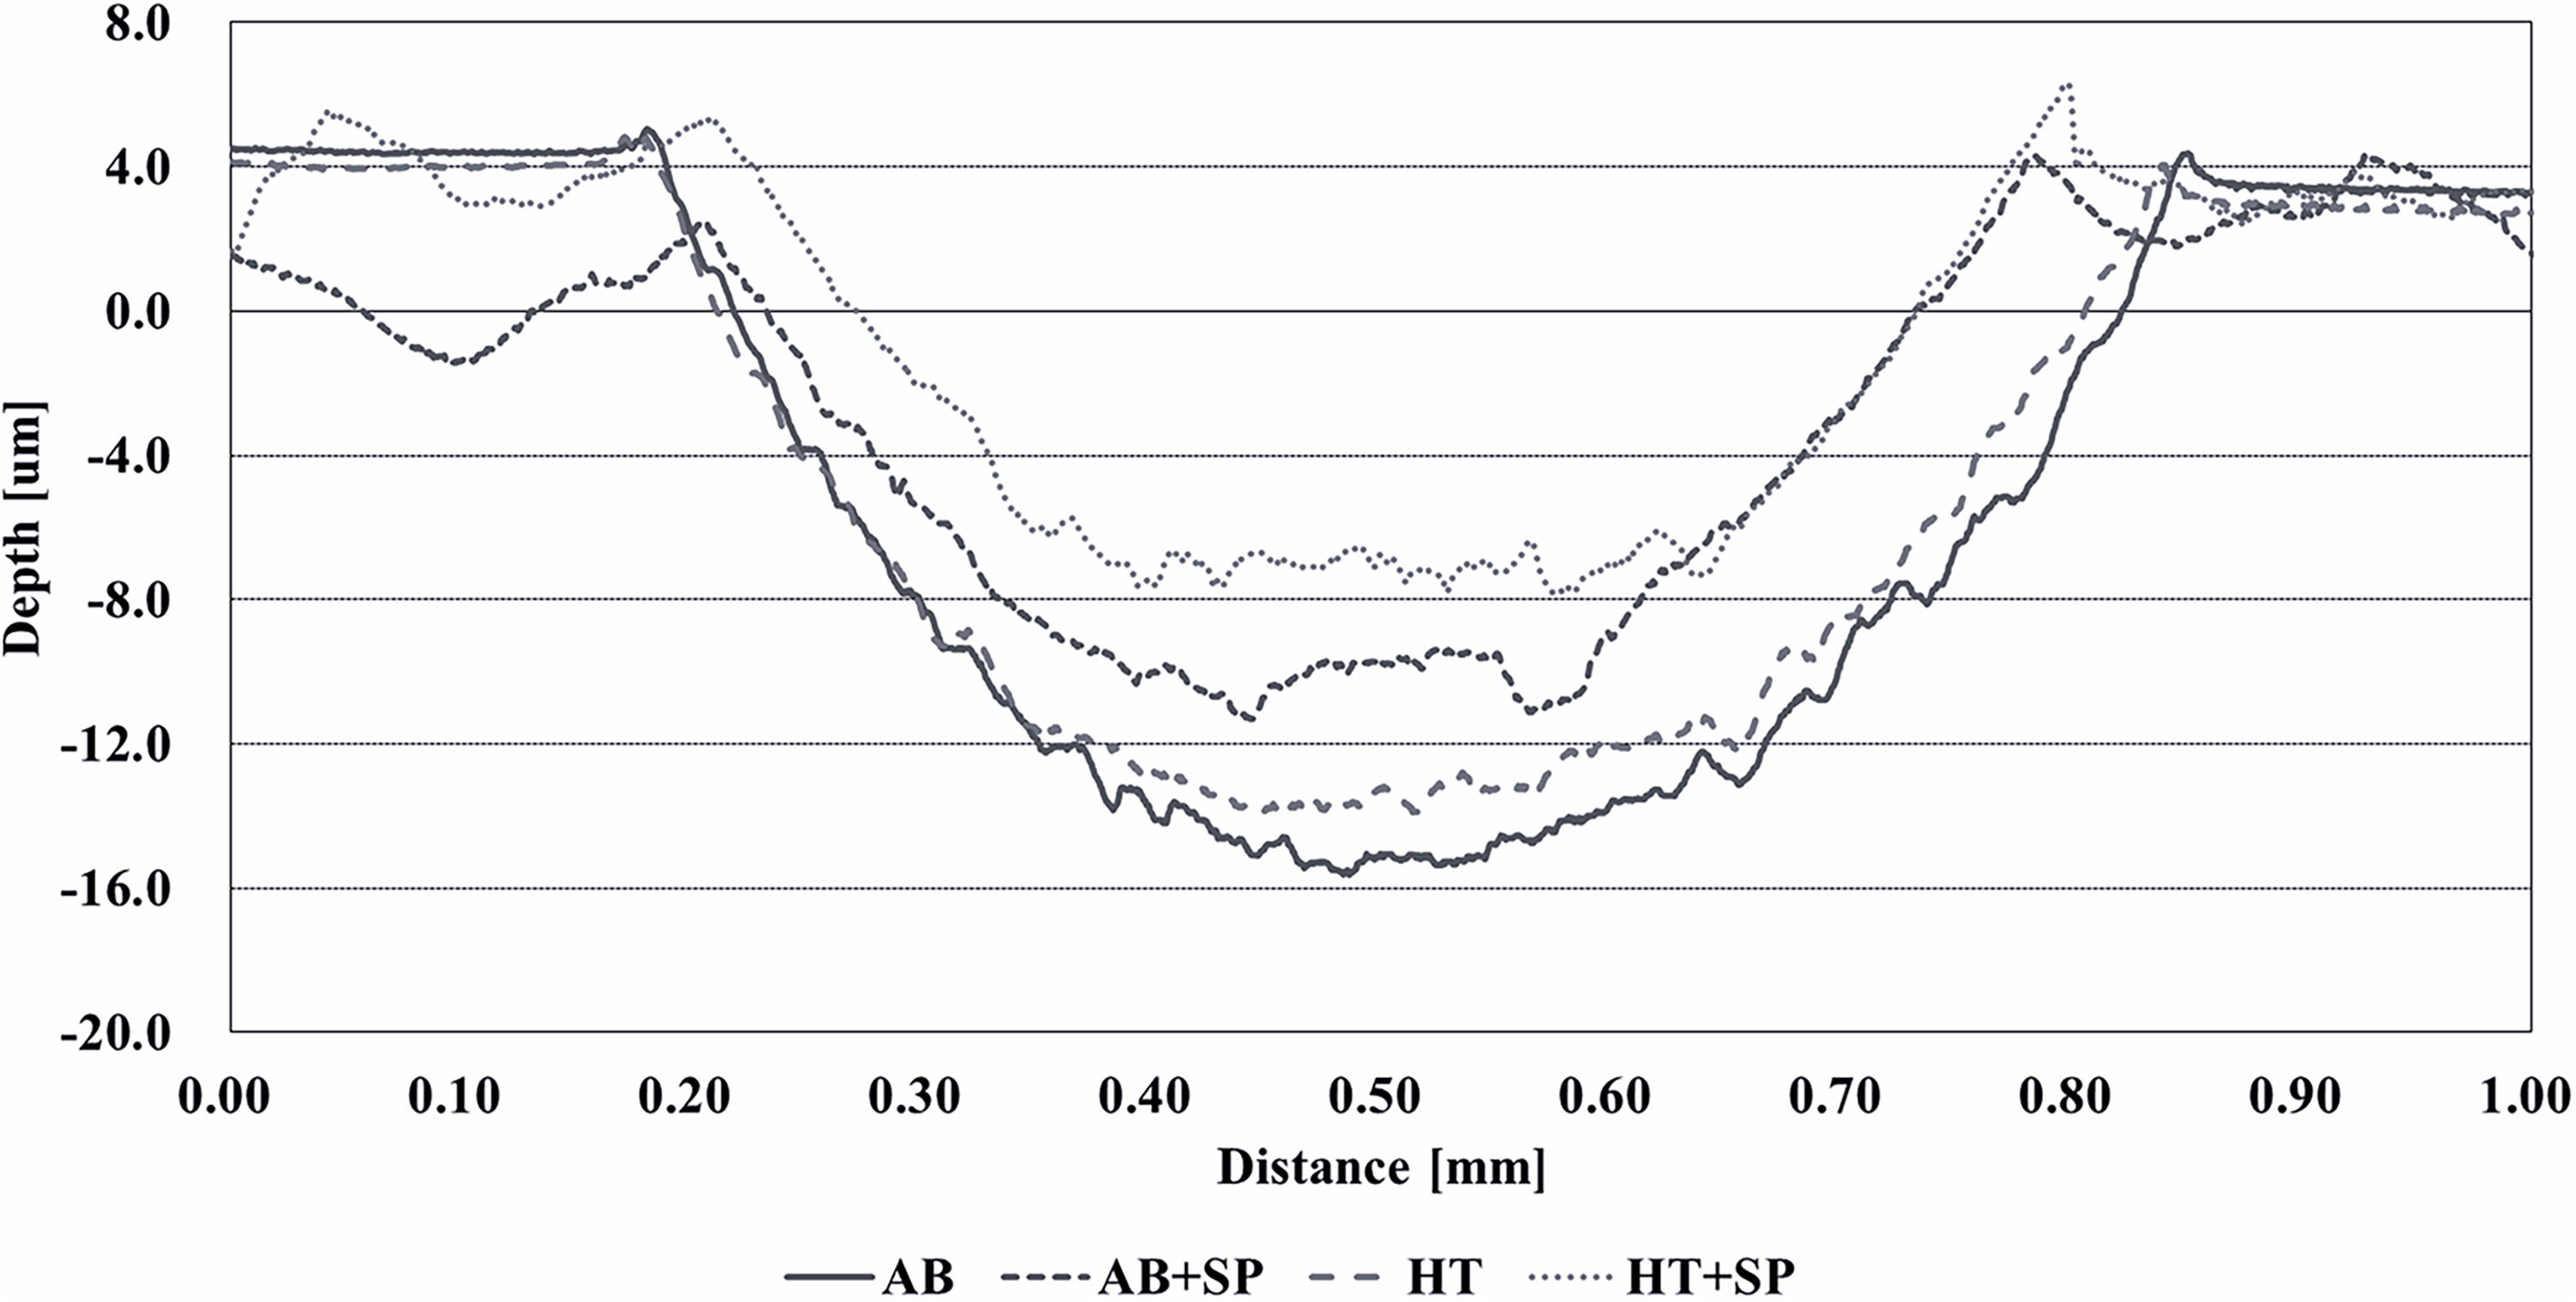
Wear profiles of the AB, AB + SP, HT, and HT + SP samples.
The specific wear rates were evaluated to determine the effect of secondary processes on wear behavior; these results are presented in Figure 10.
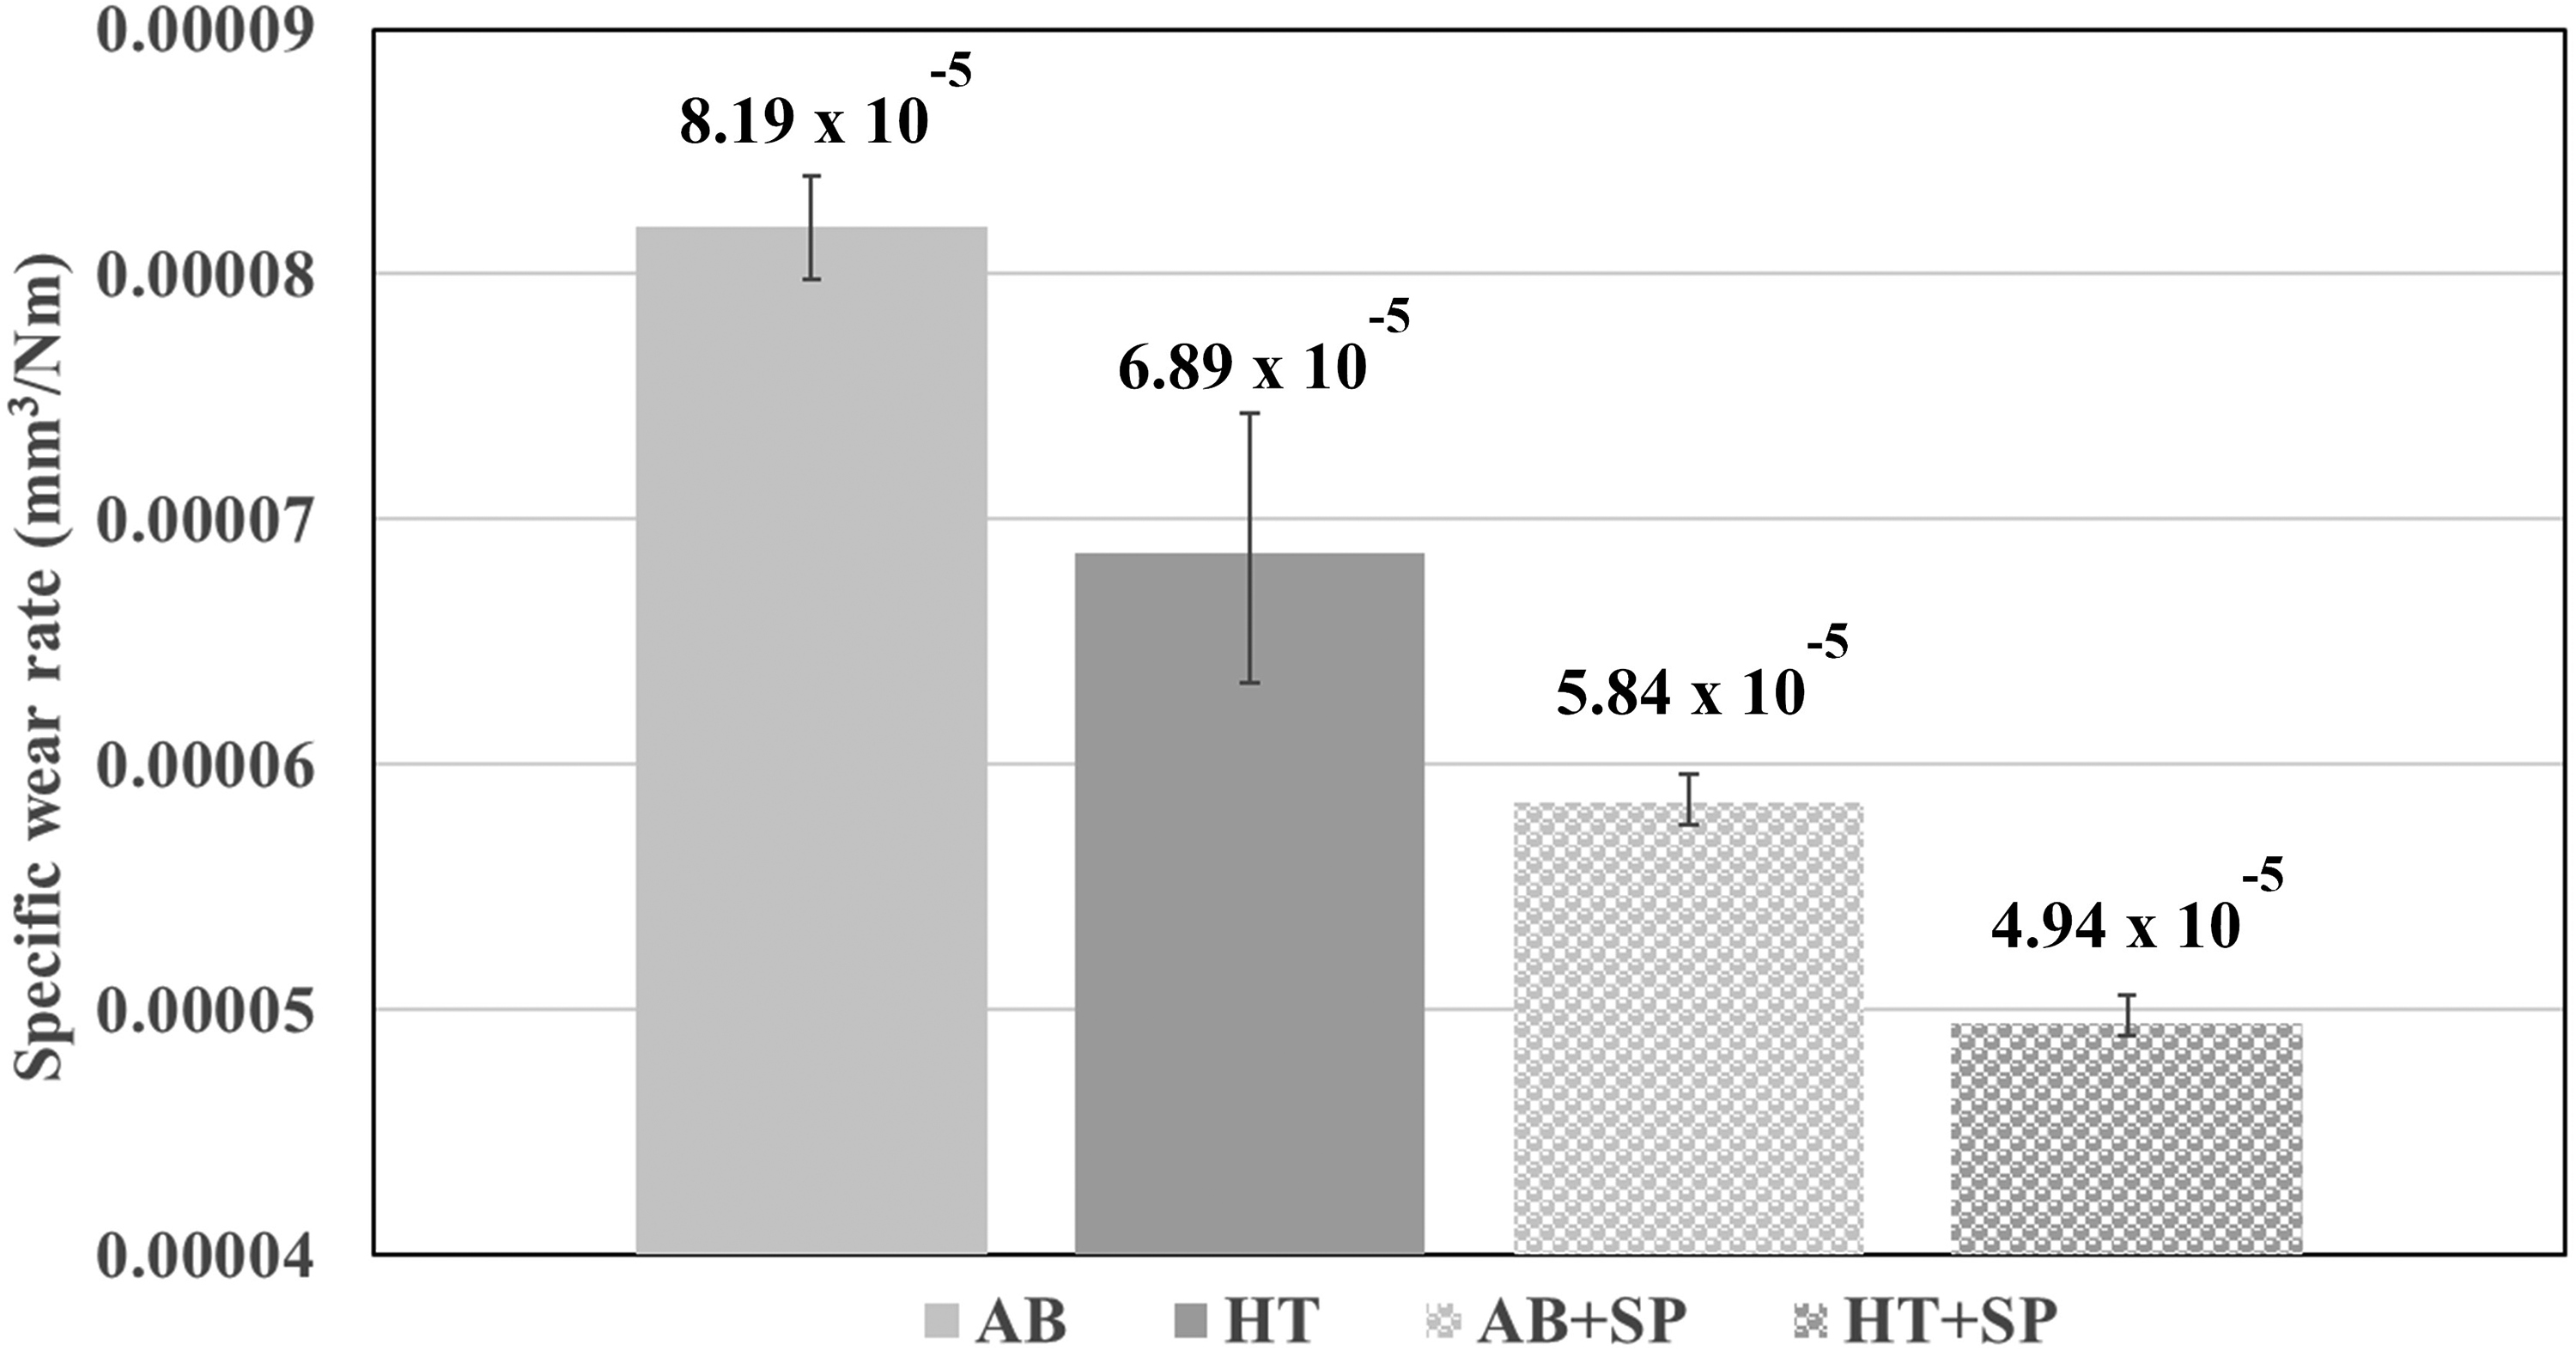
Specific wear rates for all sample groups.
The friction coefficient graphs for the AB/AB + SP and HT/HT + SP samples are presented in Figure 11, while the combined data for all samples is shown in Figure 12. The graph of the first ten meters of the running-in period for the wear test of all samples is shown in Figure 13.
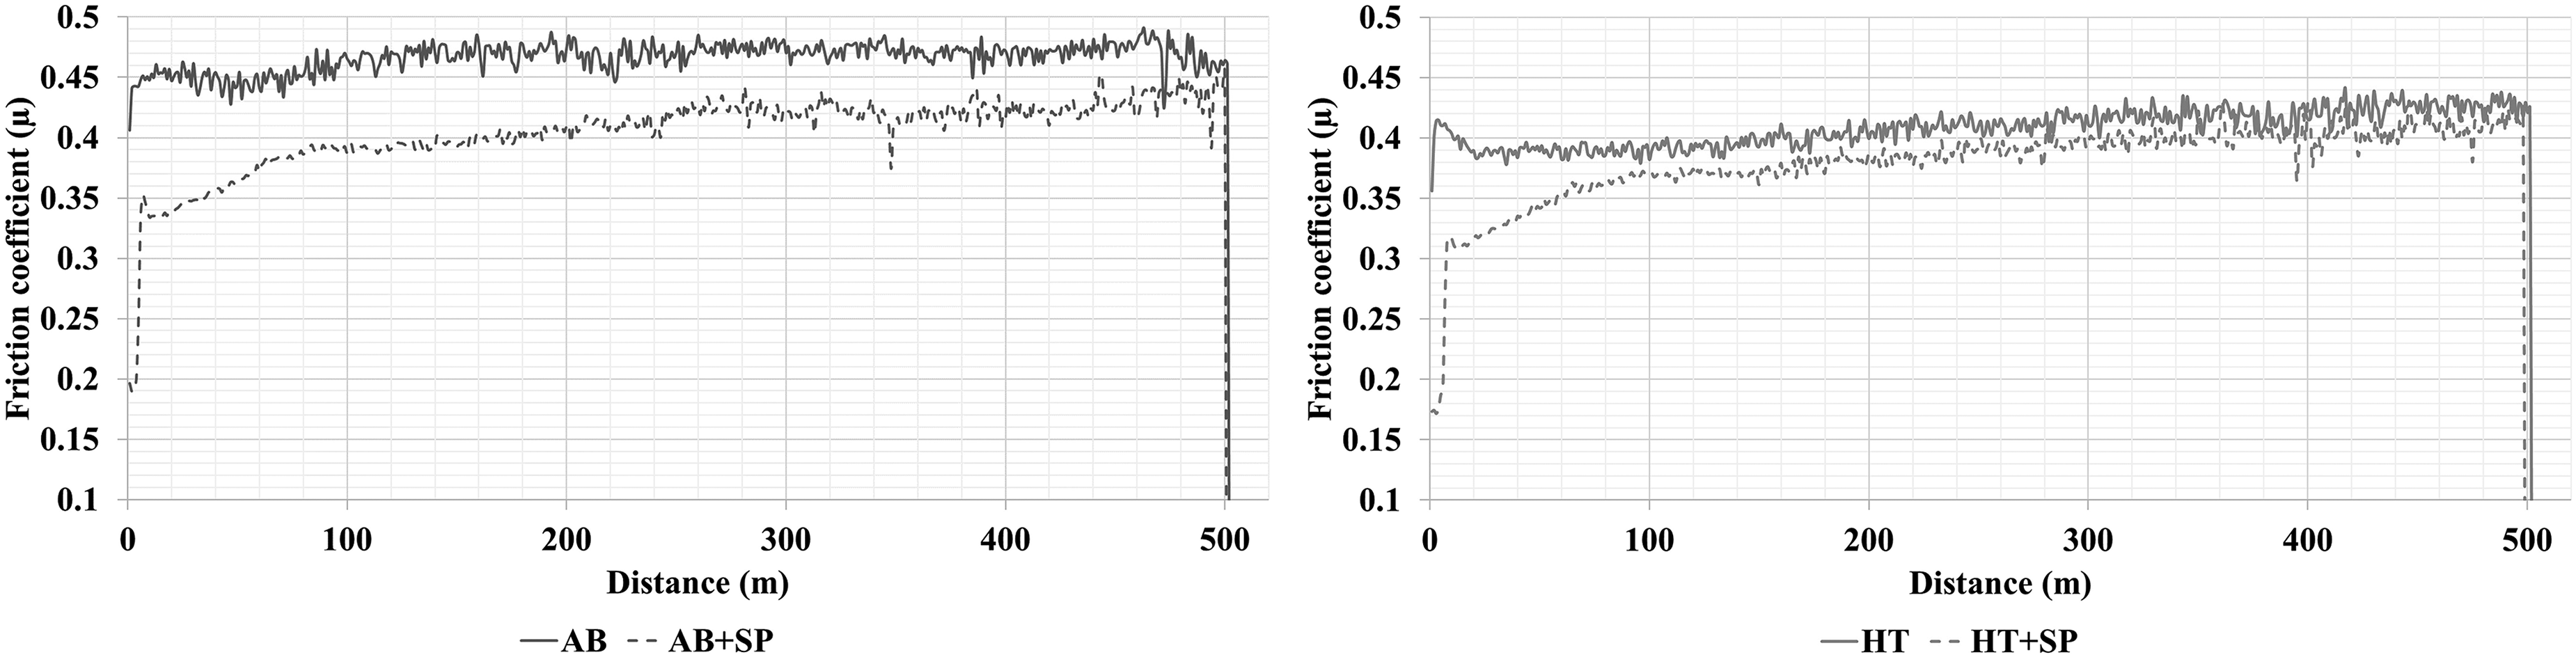
The friction coefficient graph for AB and AB + SP samples (left) and HT and HT + SP samples (right).
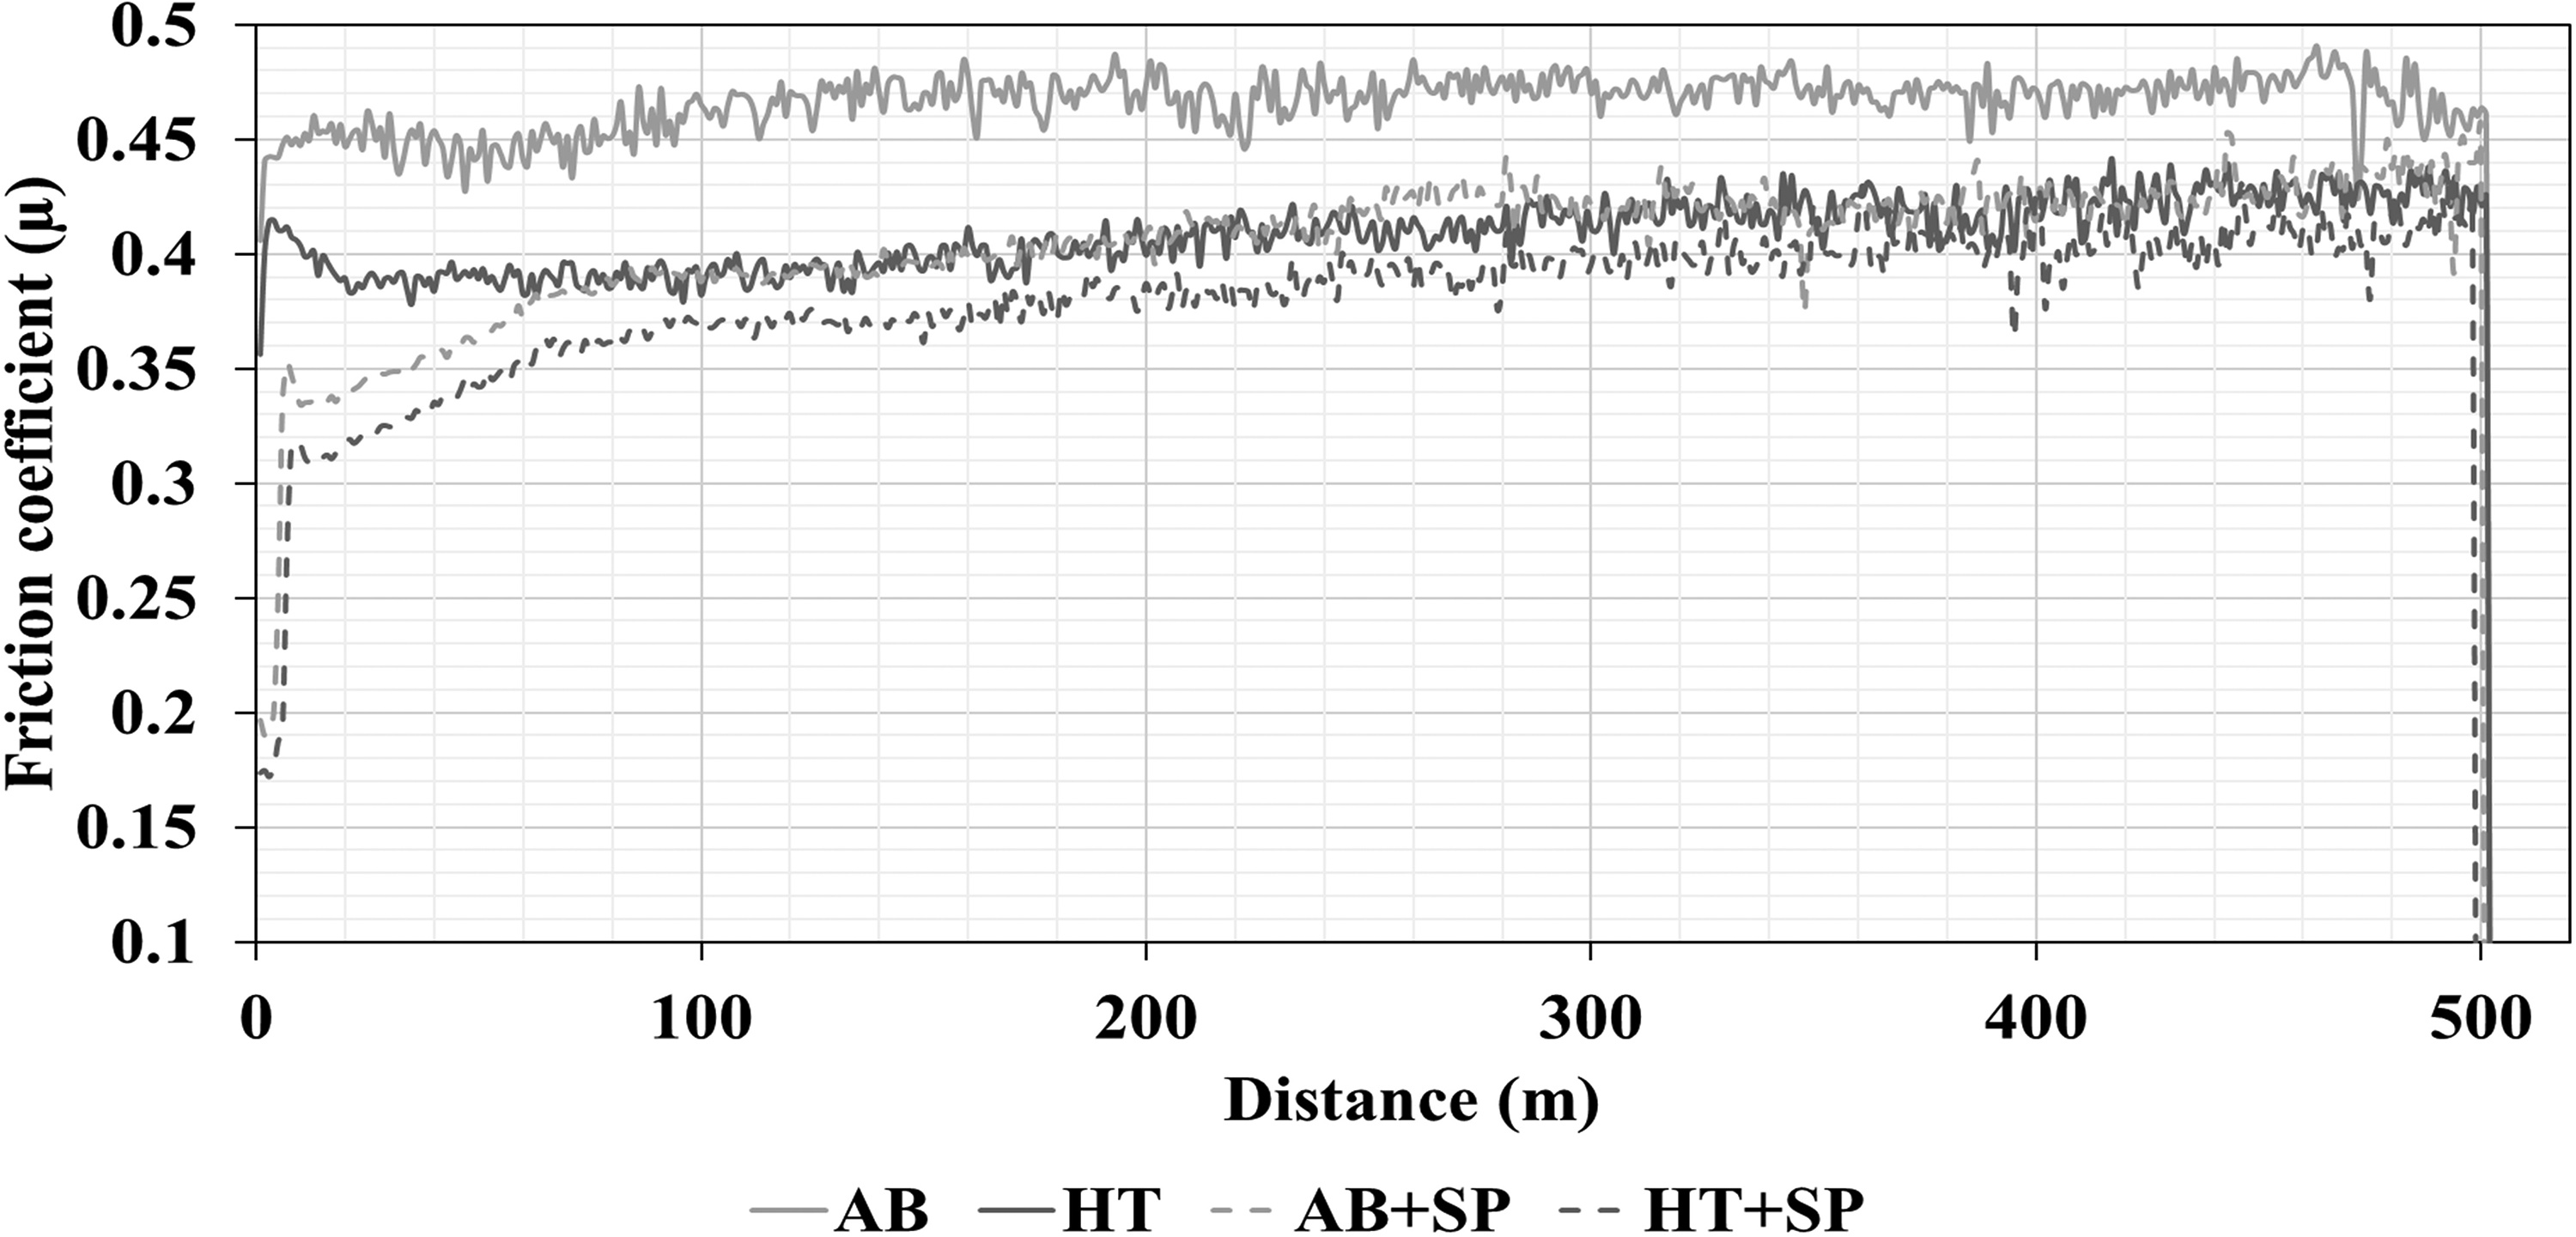
The friction coefficient graph for all sample groups.
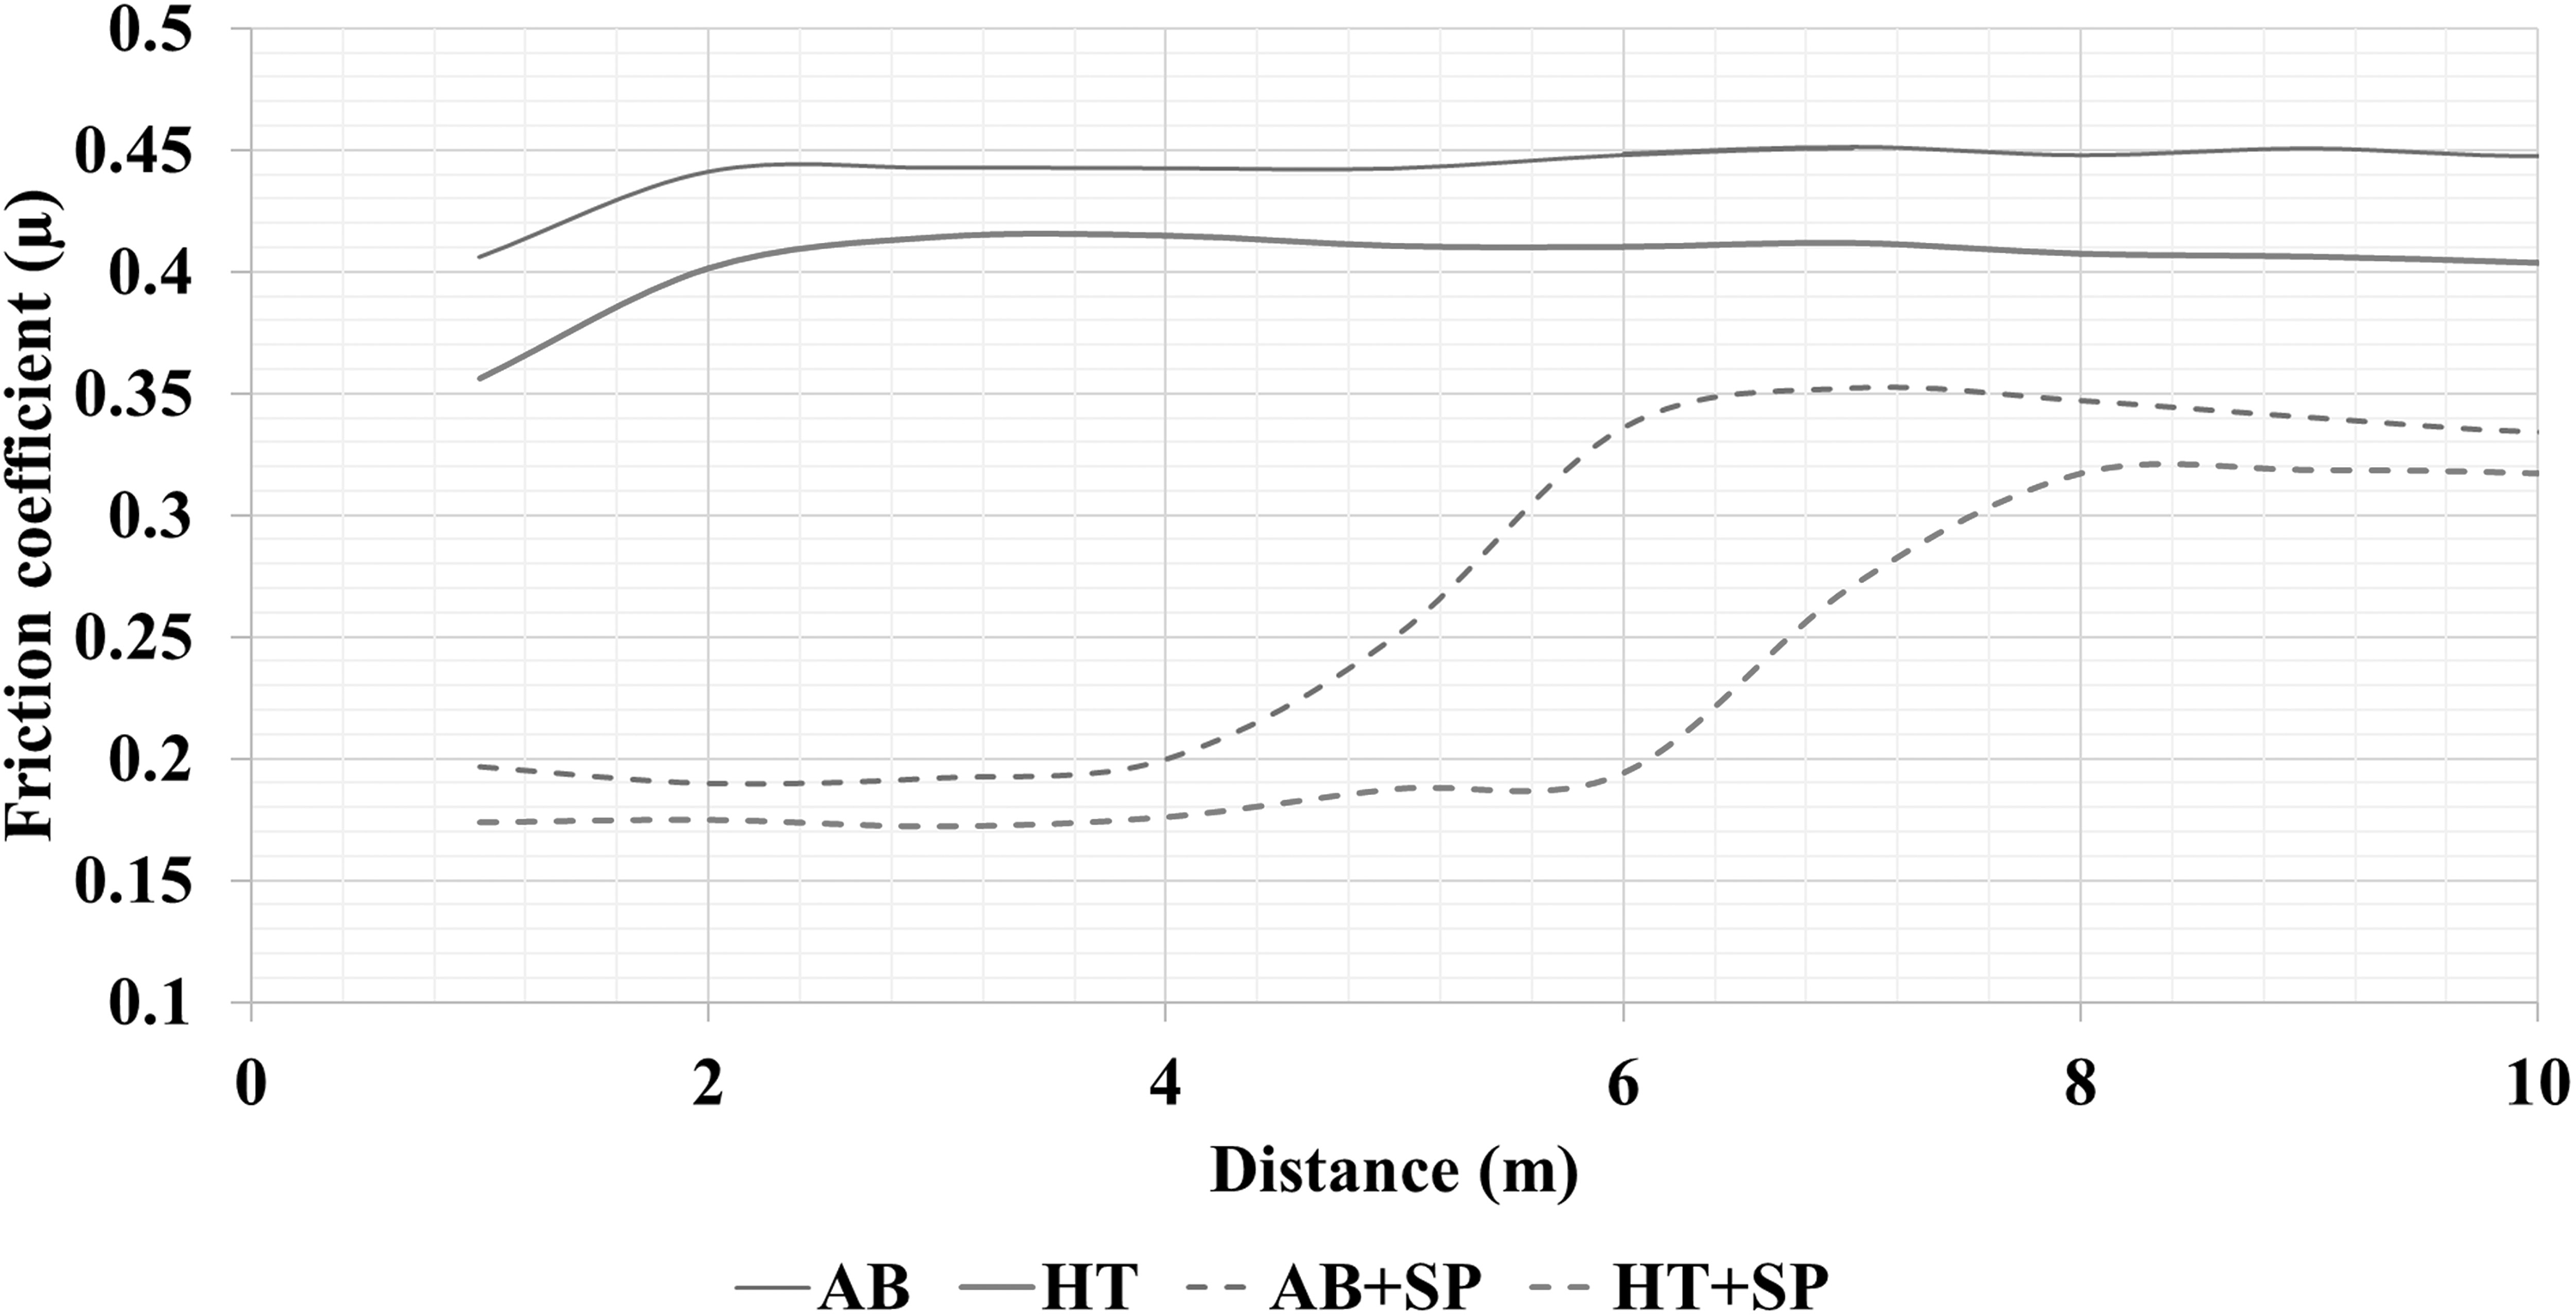
The variation of the friction coefficient during the first 10 meters of the running-in period of the wear tests.
Considering all of the wear test results, it is clear that the SP procedure improves the wear resistance of the material. The specific wear rate for AB samples was determined to be 8.19 × 10⁻⁵ mm3/Nm, whereas it decreased to 5.85 × 10⁻⁵ mm3/Nm for AB + SP samples, indicating a 29% decrease in wear rate (p < 0.05). Analyzing the friction coefficient values measured during the wear tests, as shown in Figure 11, the average friction coefficient for AB samples was 0.46, whereas it decreased to 0.43 for AB + SP samples. The specific wear rate was determined as 6.86 × 10⁻⁵ mm3/Nm for HT samples and 4.95 × 10⁻⁵ mm3/Nm for HT + SP samples, demonstrating a 28% reduction in wear rate (p < 0.05).
Analyzing the friction coefficient values recorded during the wear tests (Figure 11), the average friction coefficient for the HT samples was 0.44, whereas it decreased to 0.41 for the HT + SP samples. The specific wear rates for the AB samples was 8.19 × 10⁻⁵ mm3/Nm and 6.86 × 10⁻⁵ mm3/Nm for the HT samples, indicating a 16% decrease in wear rate (p < 0.05).
Furthermore, as illustrated in Figure 12, the average friction coefficient for the AB samples was 0.46, while it dropped to 0.44 for the HT group. The results reveal that shot peening consistently reduced the friction coefficient values across all sample groups.
As shown in Figure 13, the initial 10 meters of the running-in period was investigated. During this period, the AB samples exhibited the highest fricition coefficient, whereas the HT + SP samples showed the lowest. All samples transitioned to a steady-state regime after approximately the first 8 meters of sliding distance.
As illustrated in Figure 14, multiple fine grooves have formed parallel to the sliding direction of the alumina ball. Figure 15 presents SEM images of the wear zone of the AB and HT samples, while Figure 16 displays the corresponding images for the AB + SP and HT + SP samples.
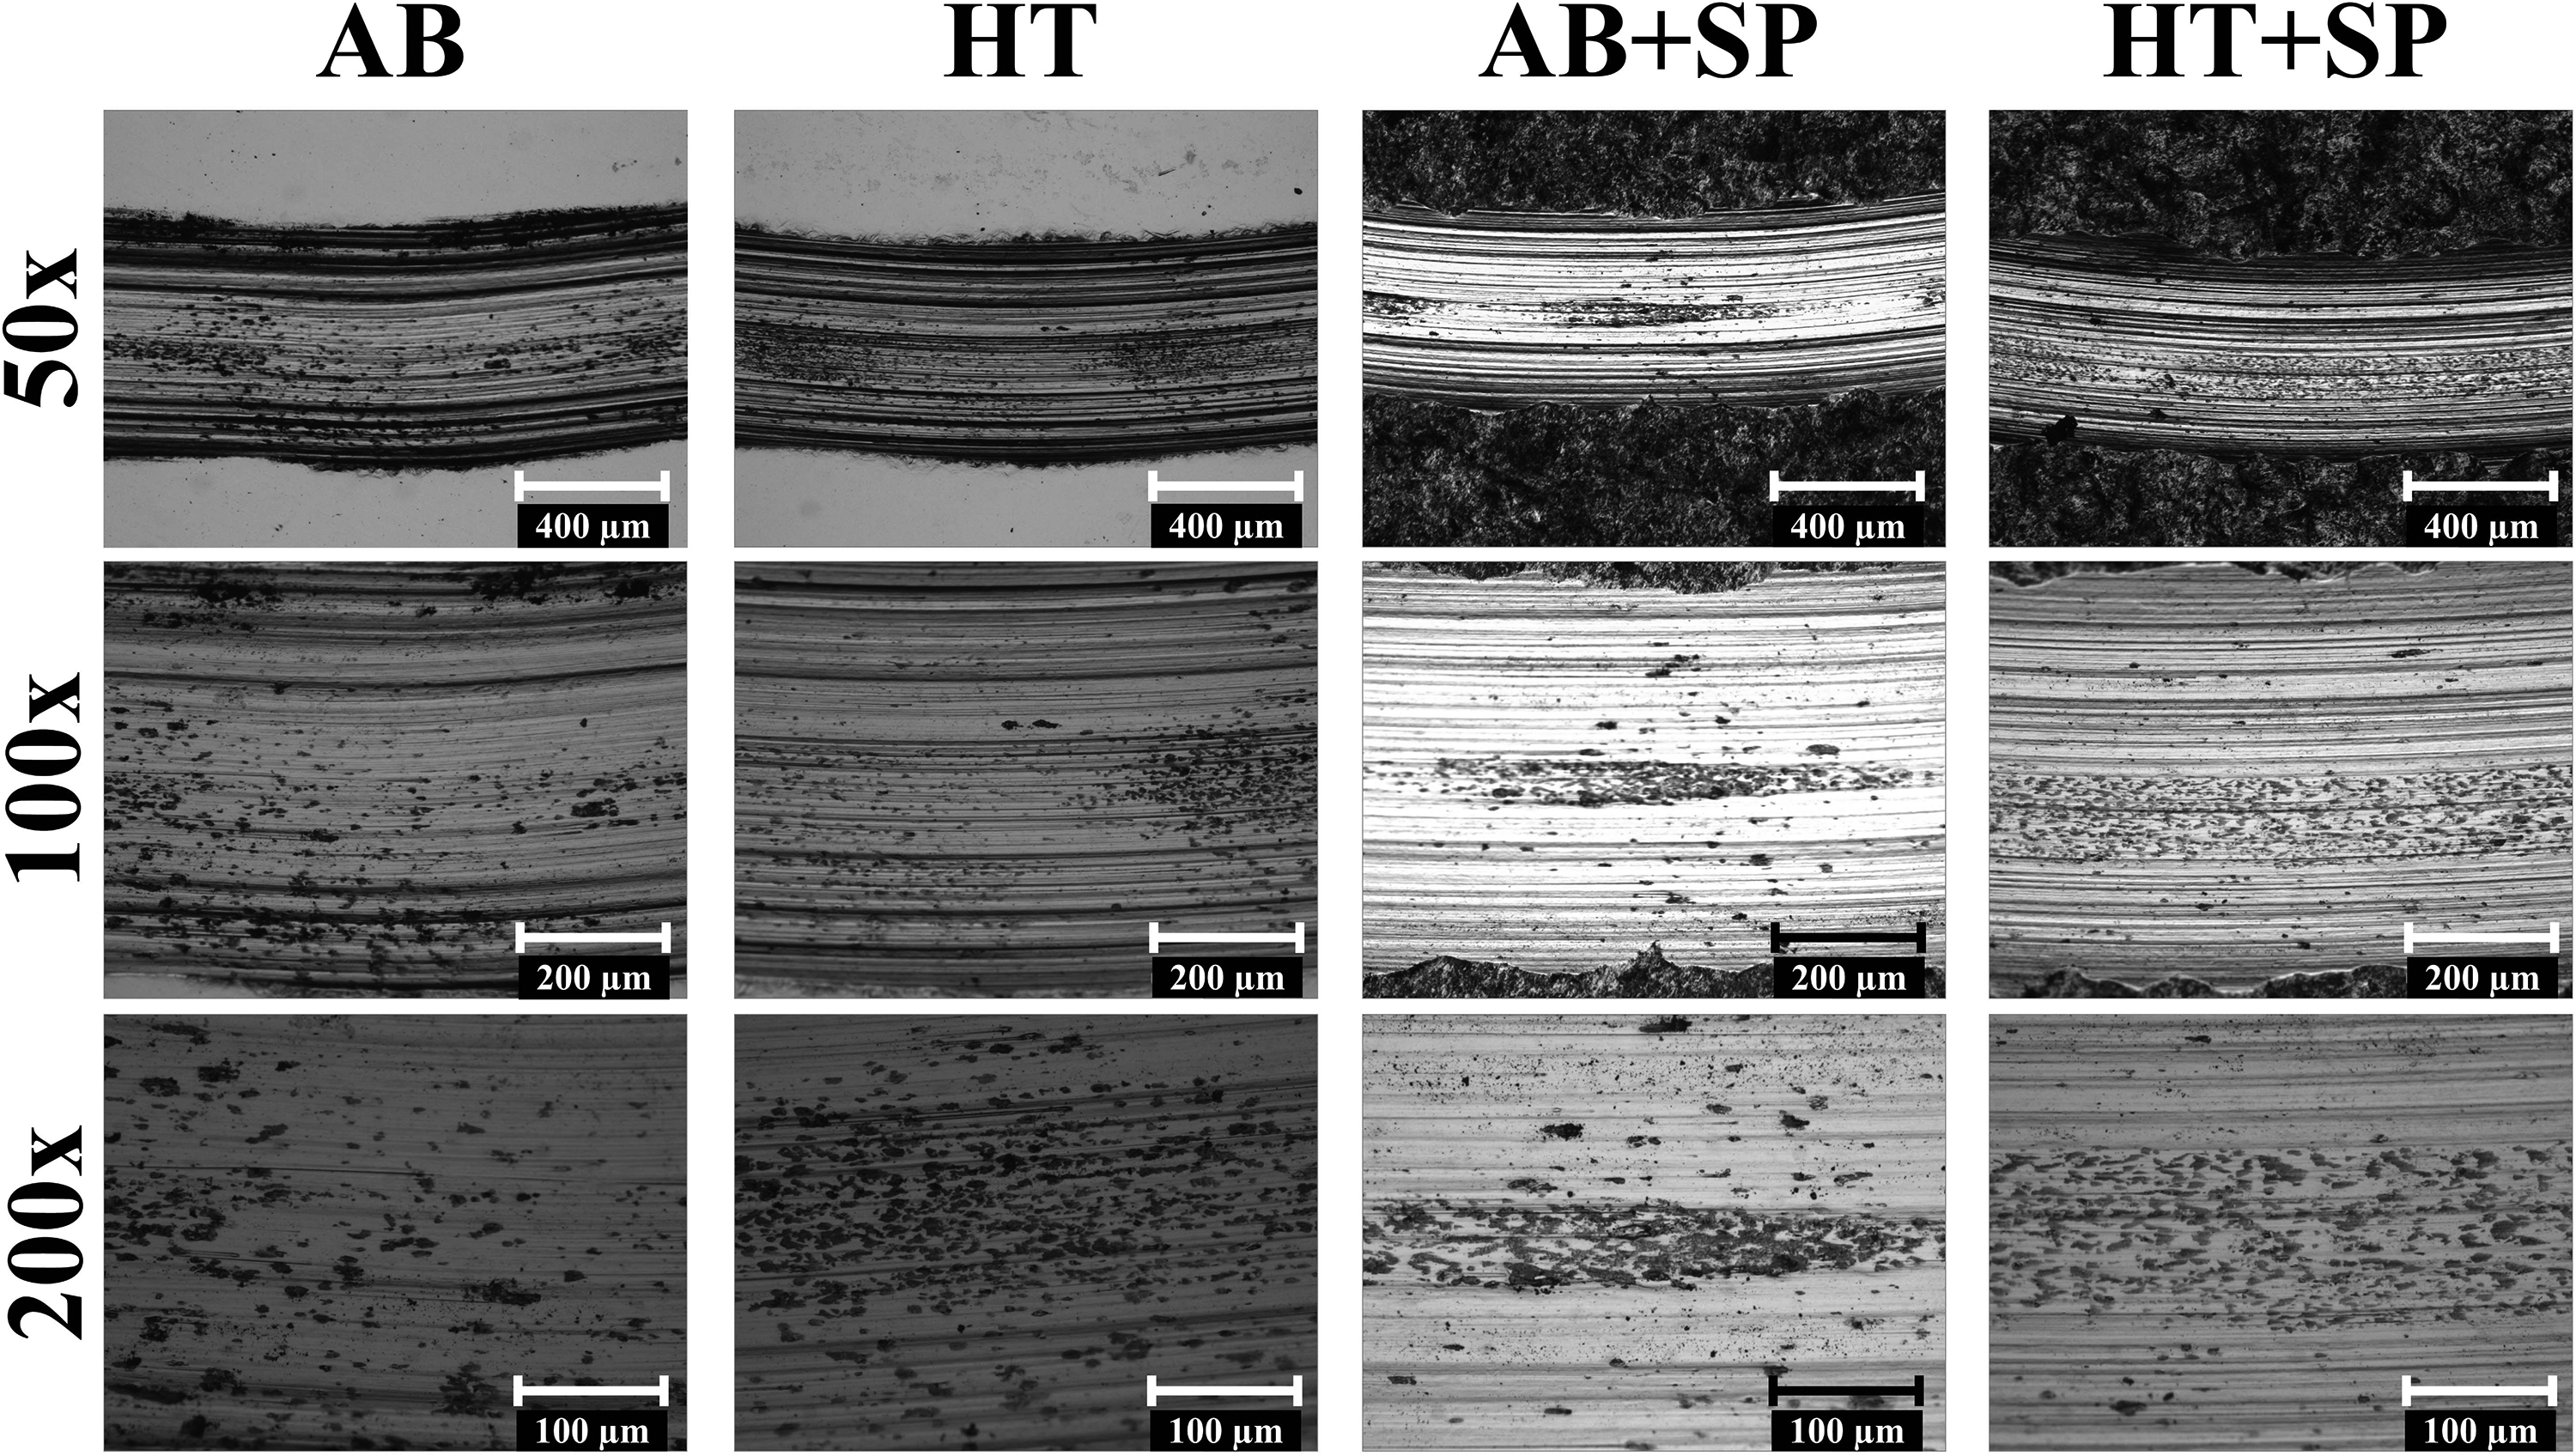
Wear zone images of all sample groups.
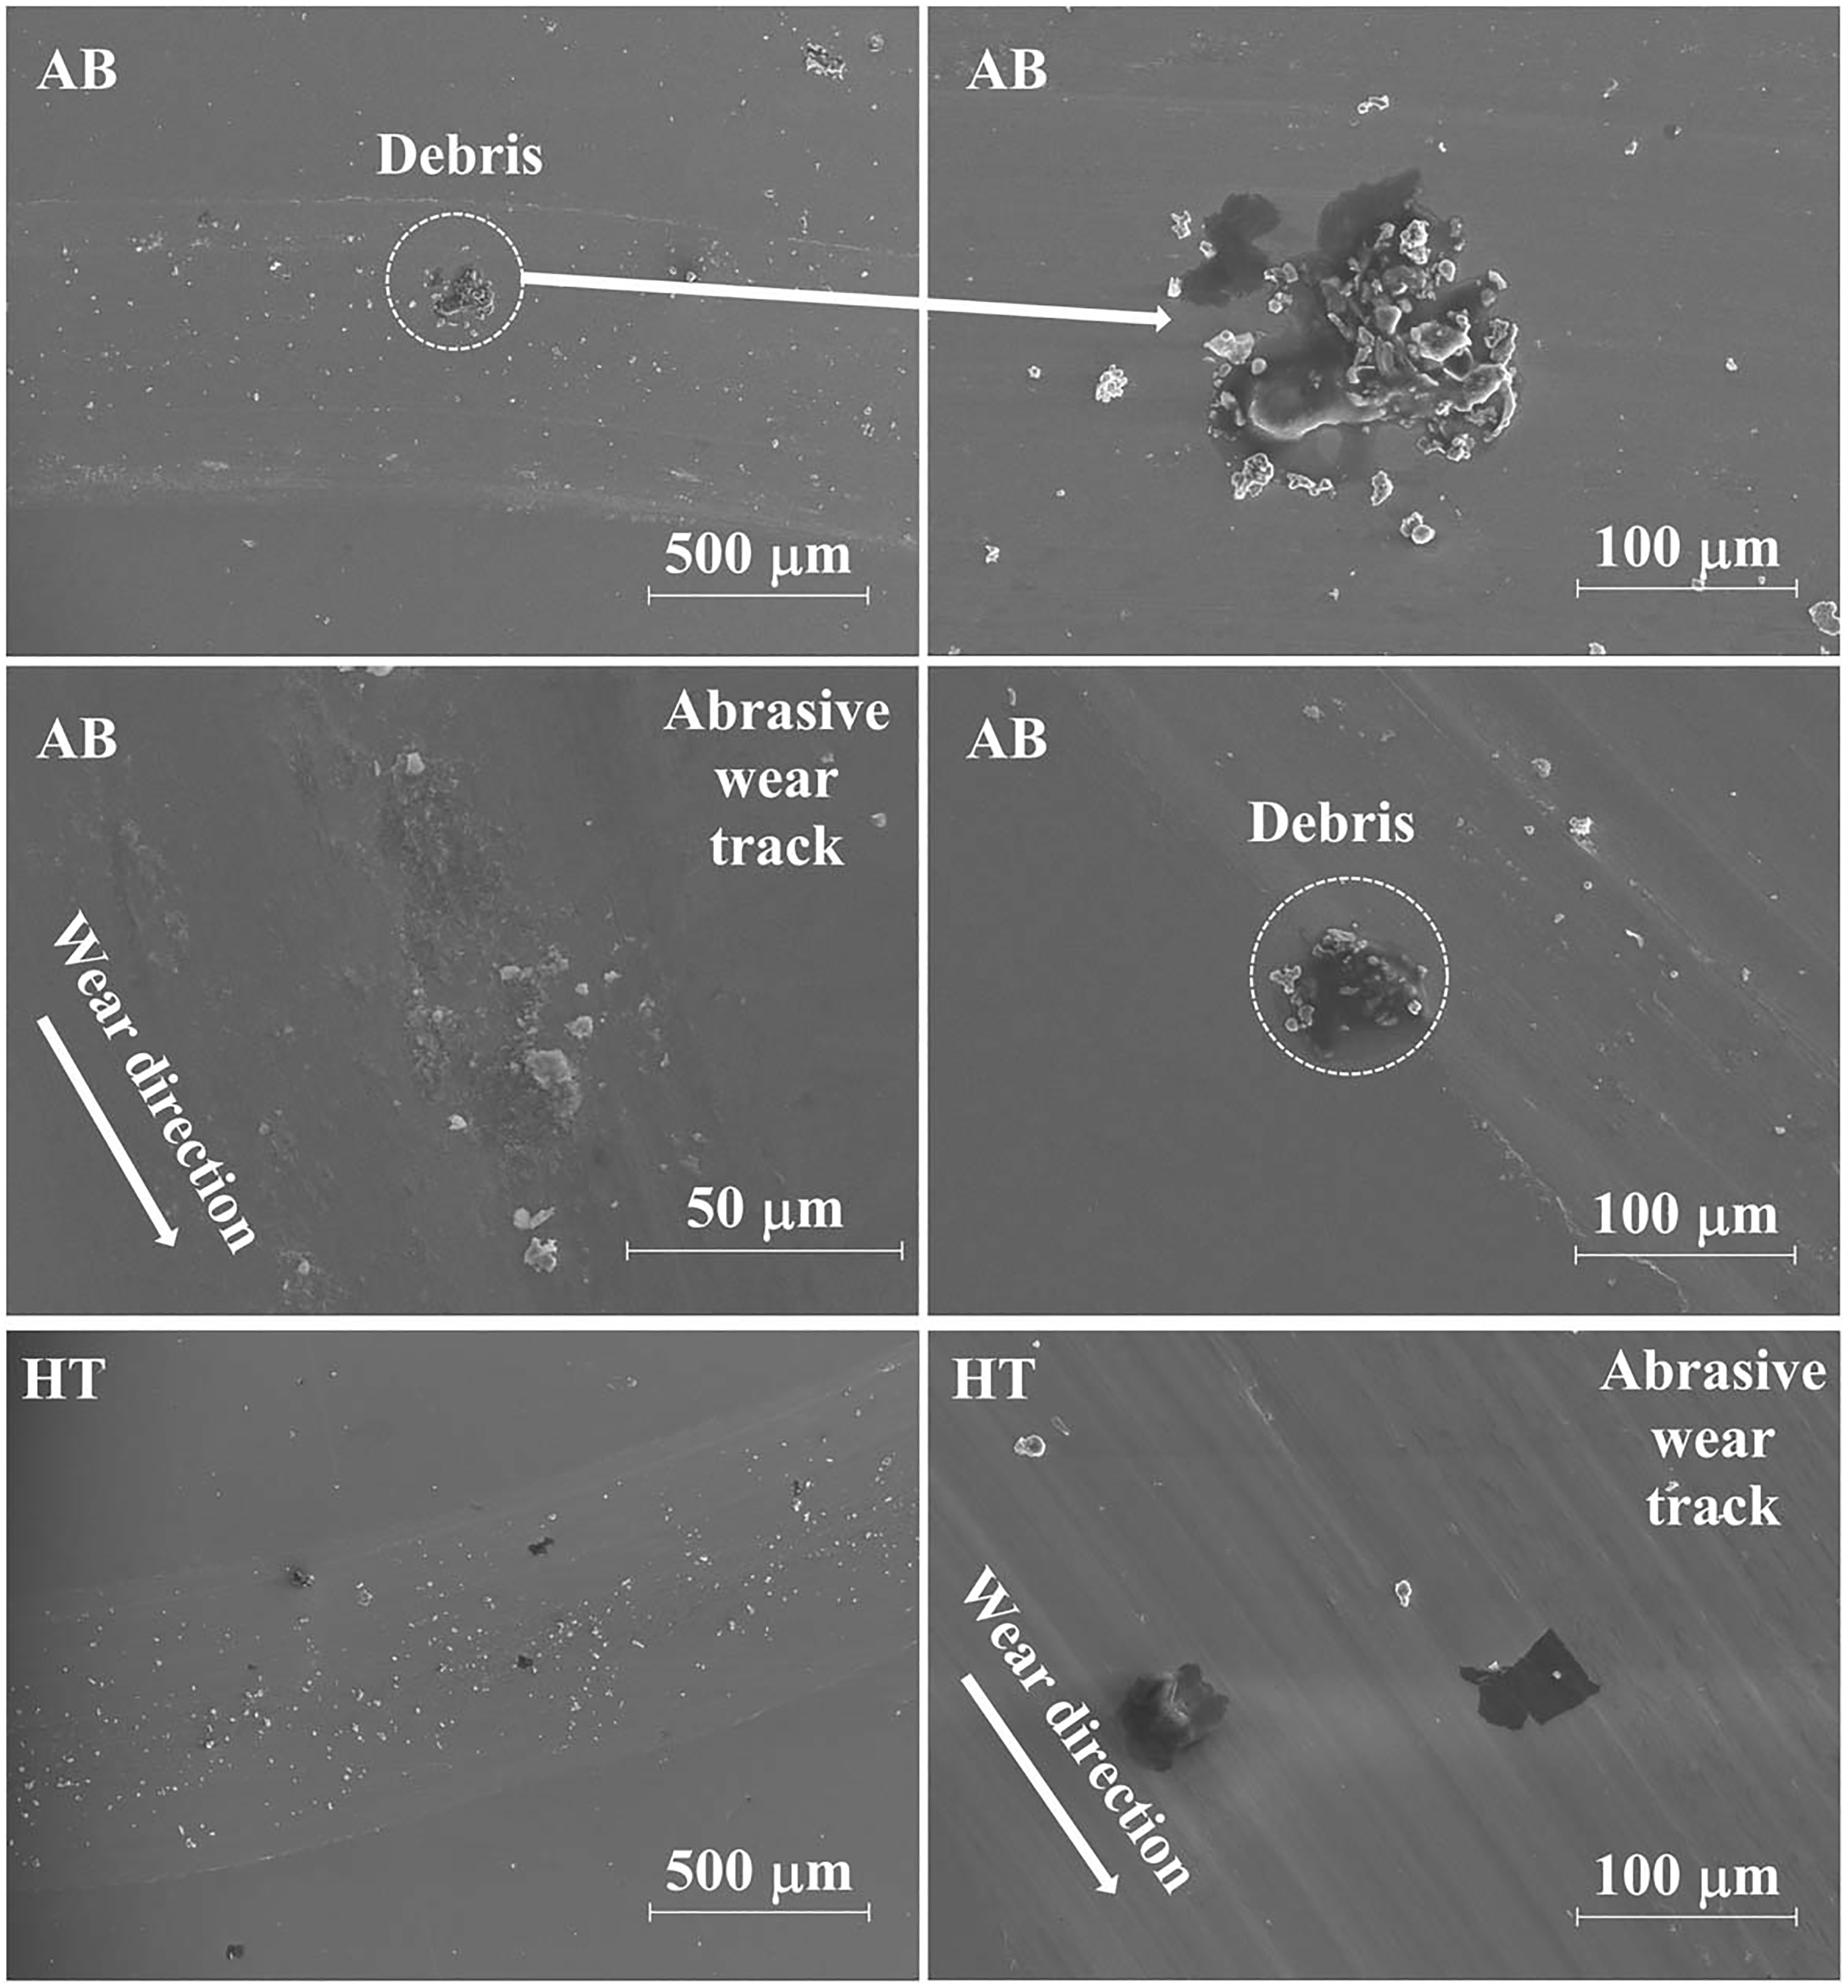
SEM images of the AB and HT samples’ wear zone.
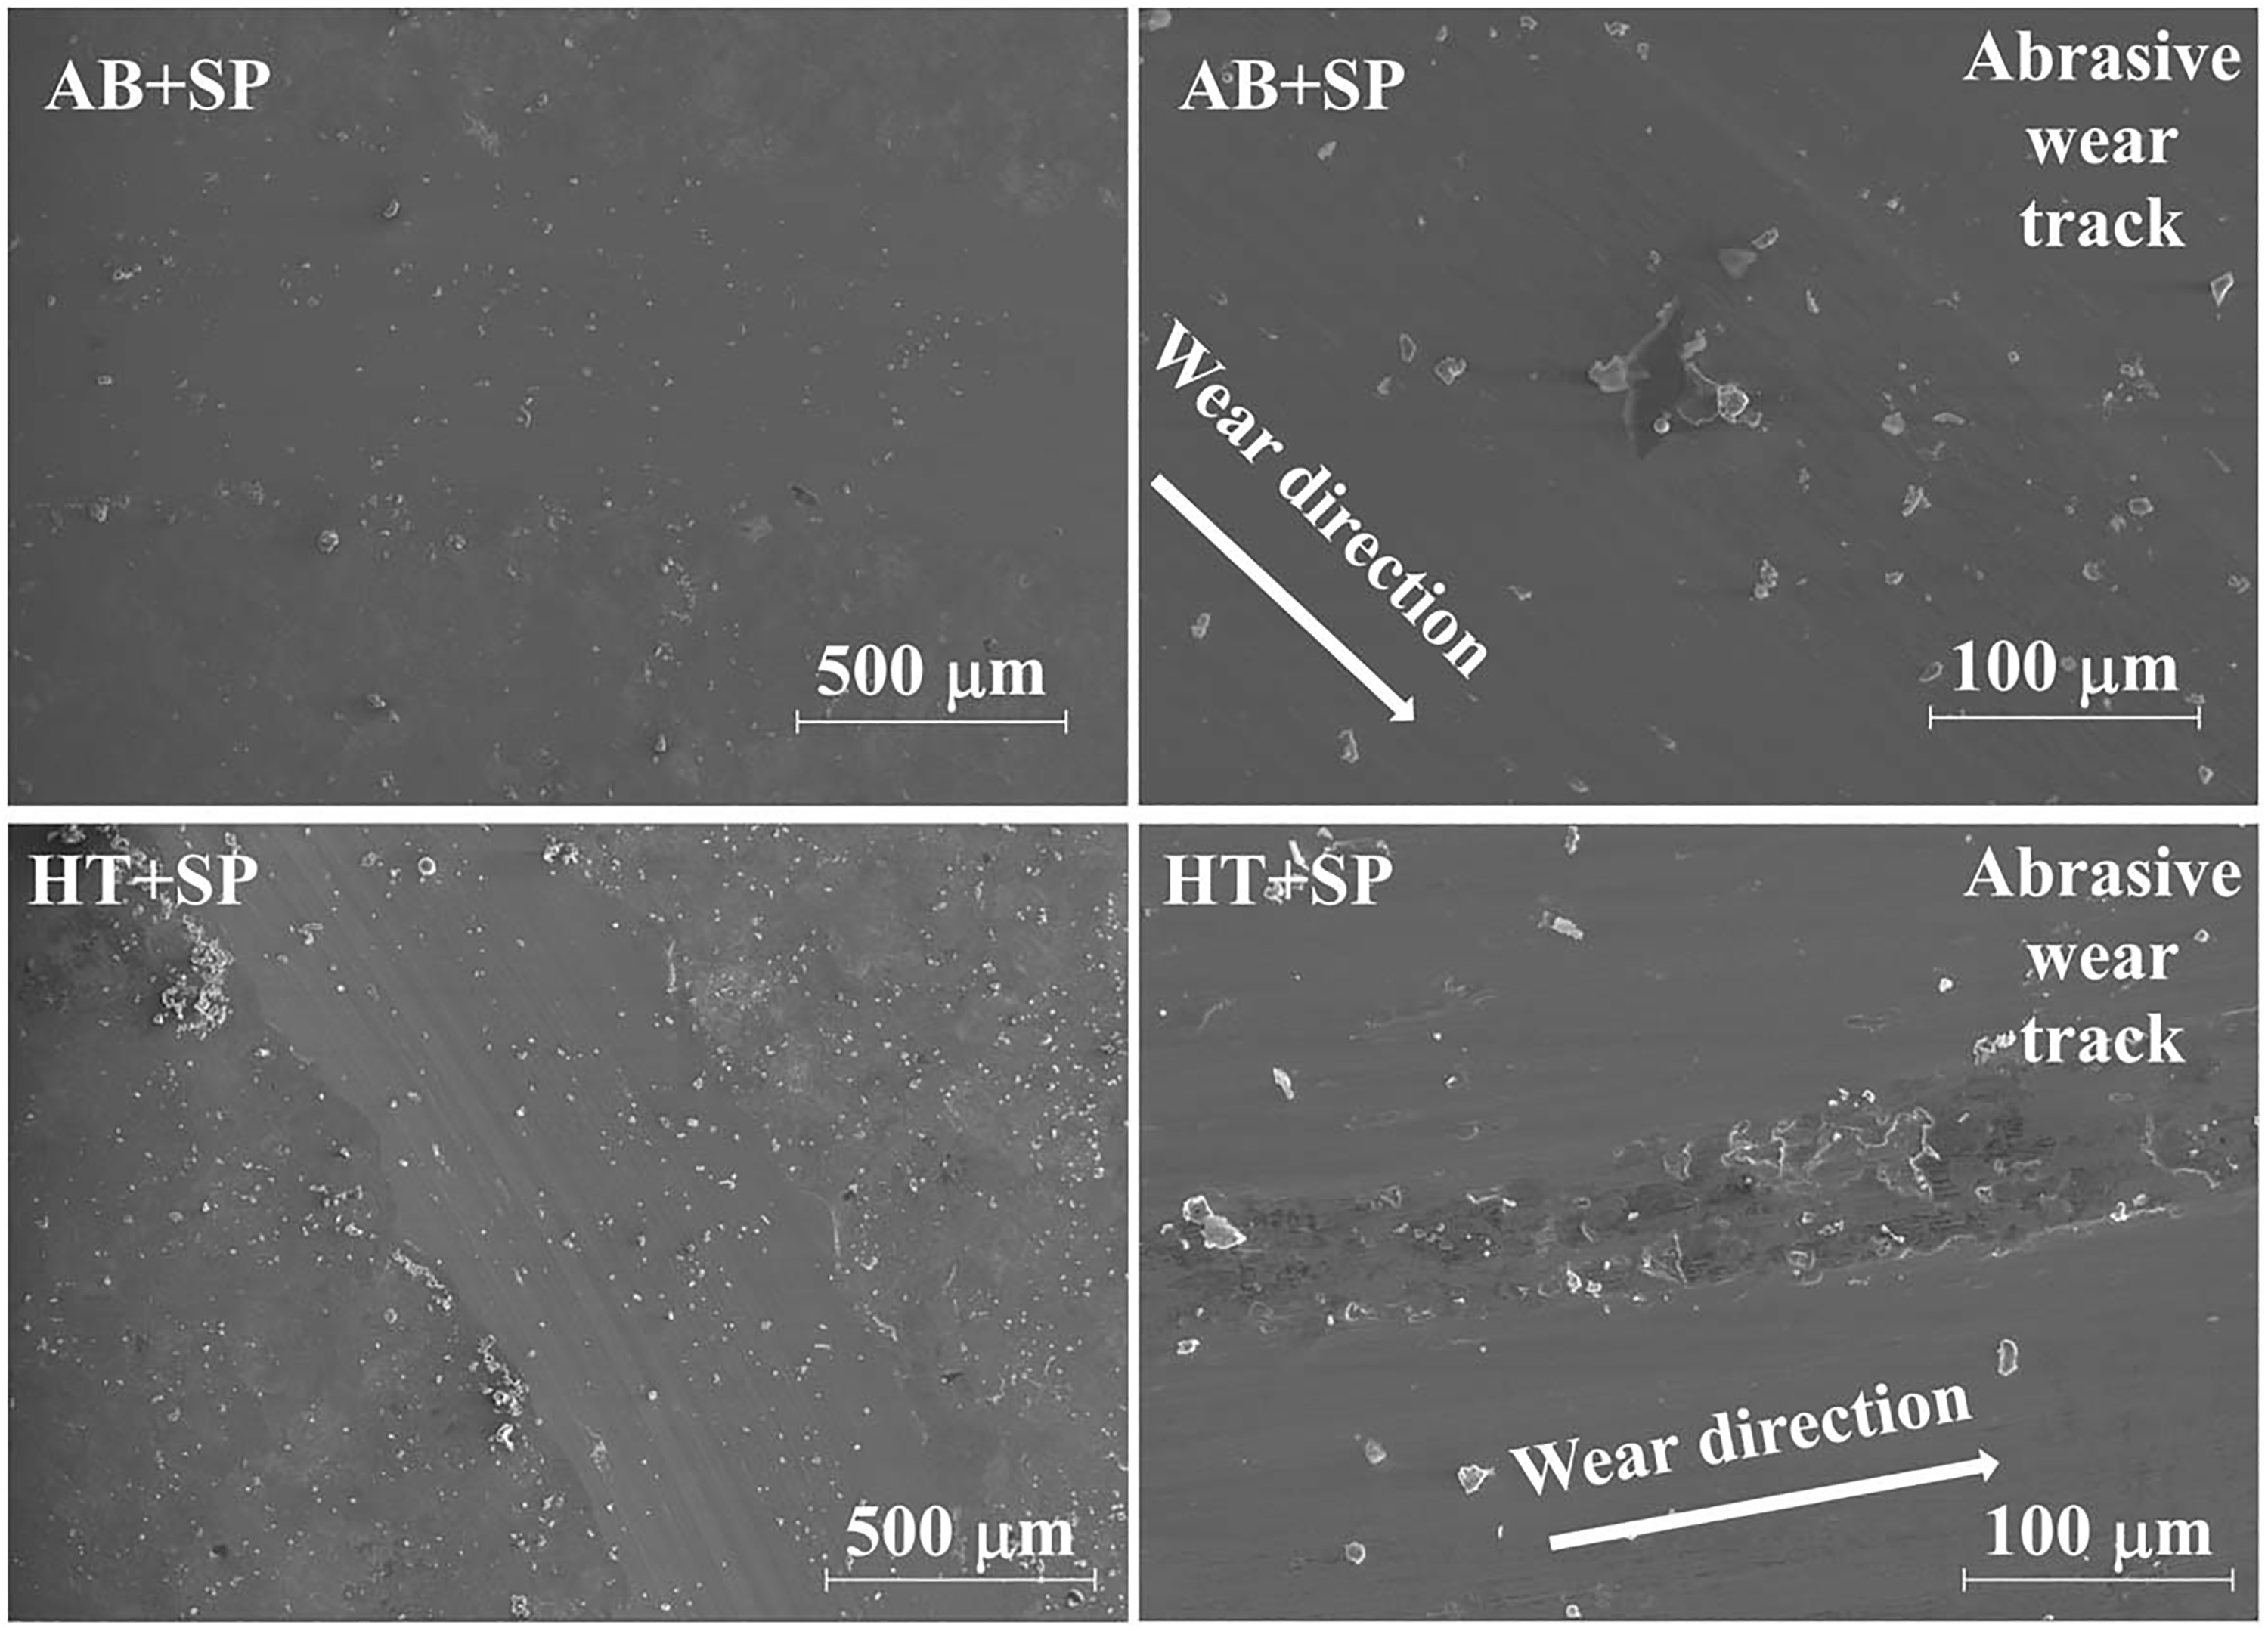
SEM images of the AB + SP sample and the HT + SP samples’ wear zone.
The width of the wear tracks was examined to further elucidate the wear mechanisms. As shown in Figure 14, distinct differences in wear track size and morphology were observed among the sample groups. For the AB and HT samples (Figure 17), the wear track widths were similar at 642 µm and 659 µm, respectively. In contrast, the AB + SP and HT + SP samples exhibited significantly narrower wear tracks (595 µm and 569 µm, respectively) compared to their non-shot-peened counterparts. This reduction in track width correlates with the increased surface hardness and enhanced wear resistance provided by the shot peening process.
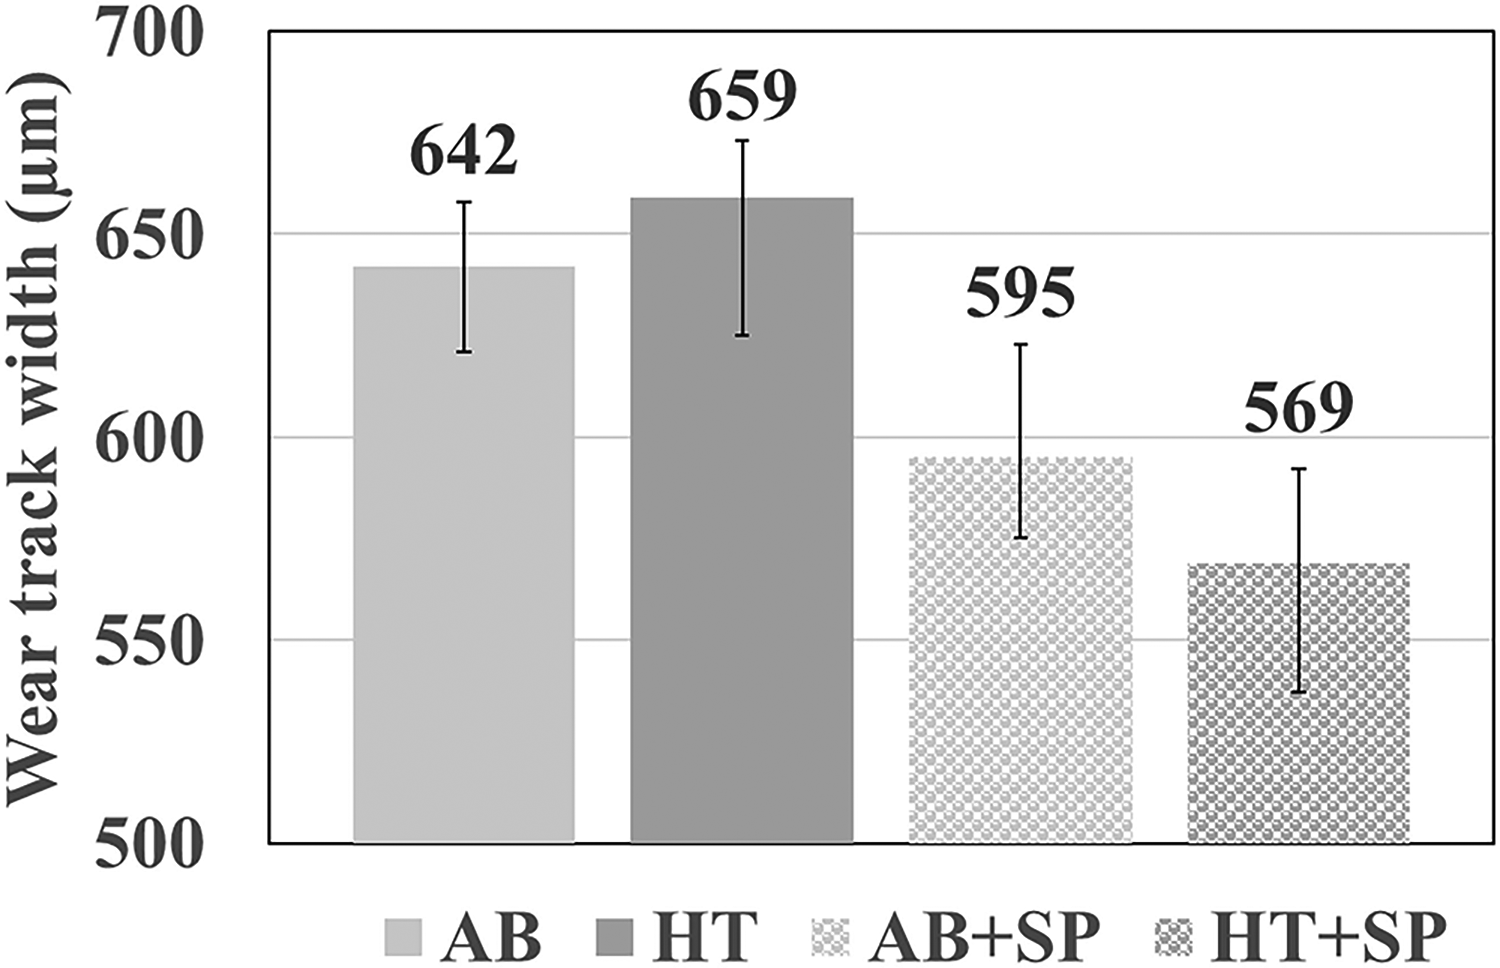
Graph of wear track widths for all sample groups.
The EDS analyses of both the wear tracks and the unworn regions are presented in Figures 18 to 21 for the AB, HT, AB + SP, and HT + SP samples, respectively. All EDS analyses performed on the samples revealed the presence of oxygen.
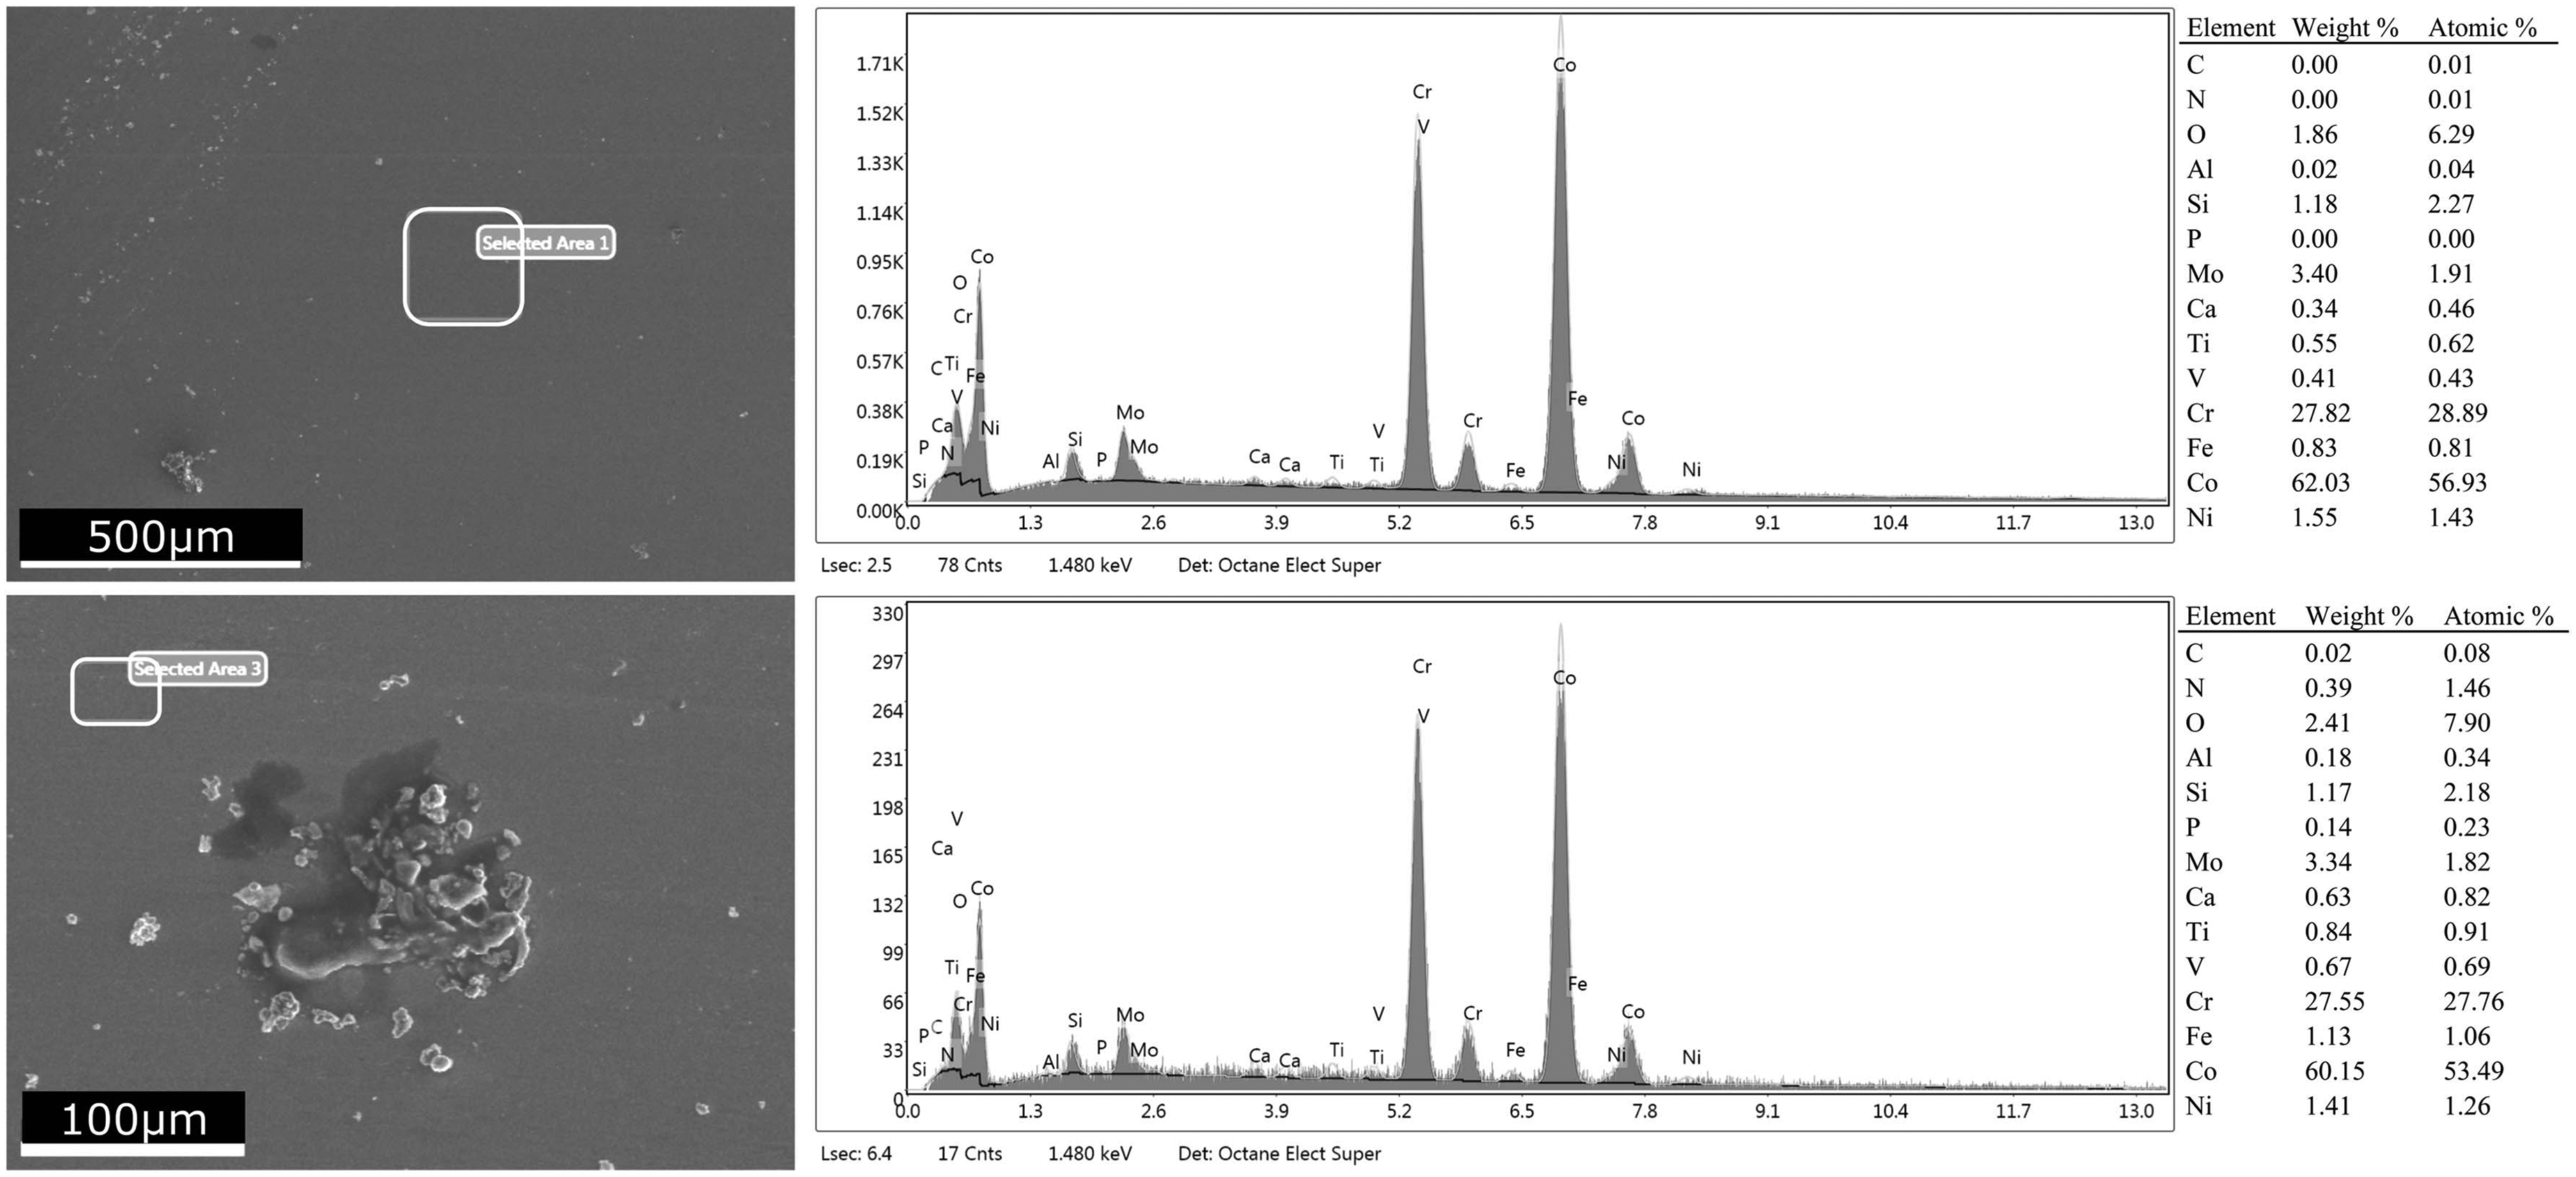
EDS analysis of the AB sample: non-worn area (top) and wear zone (bottom).
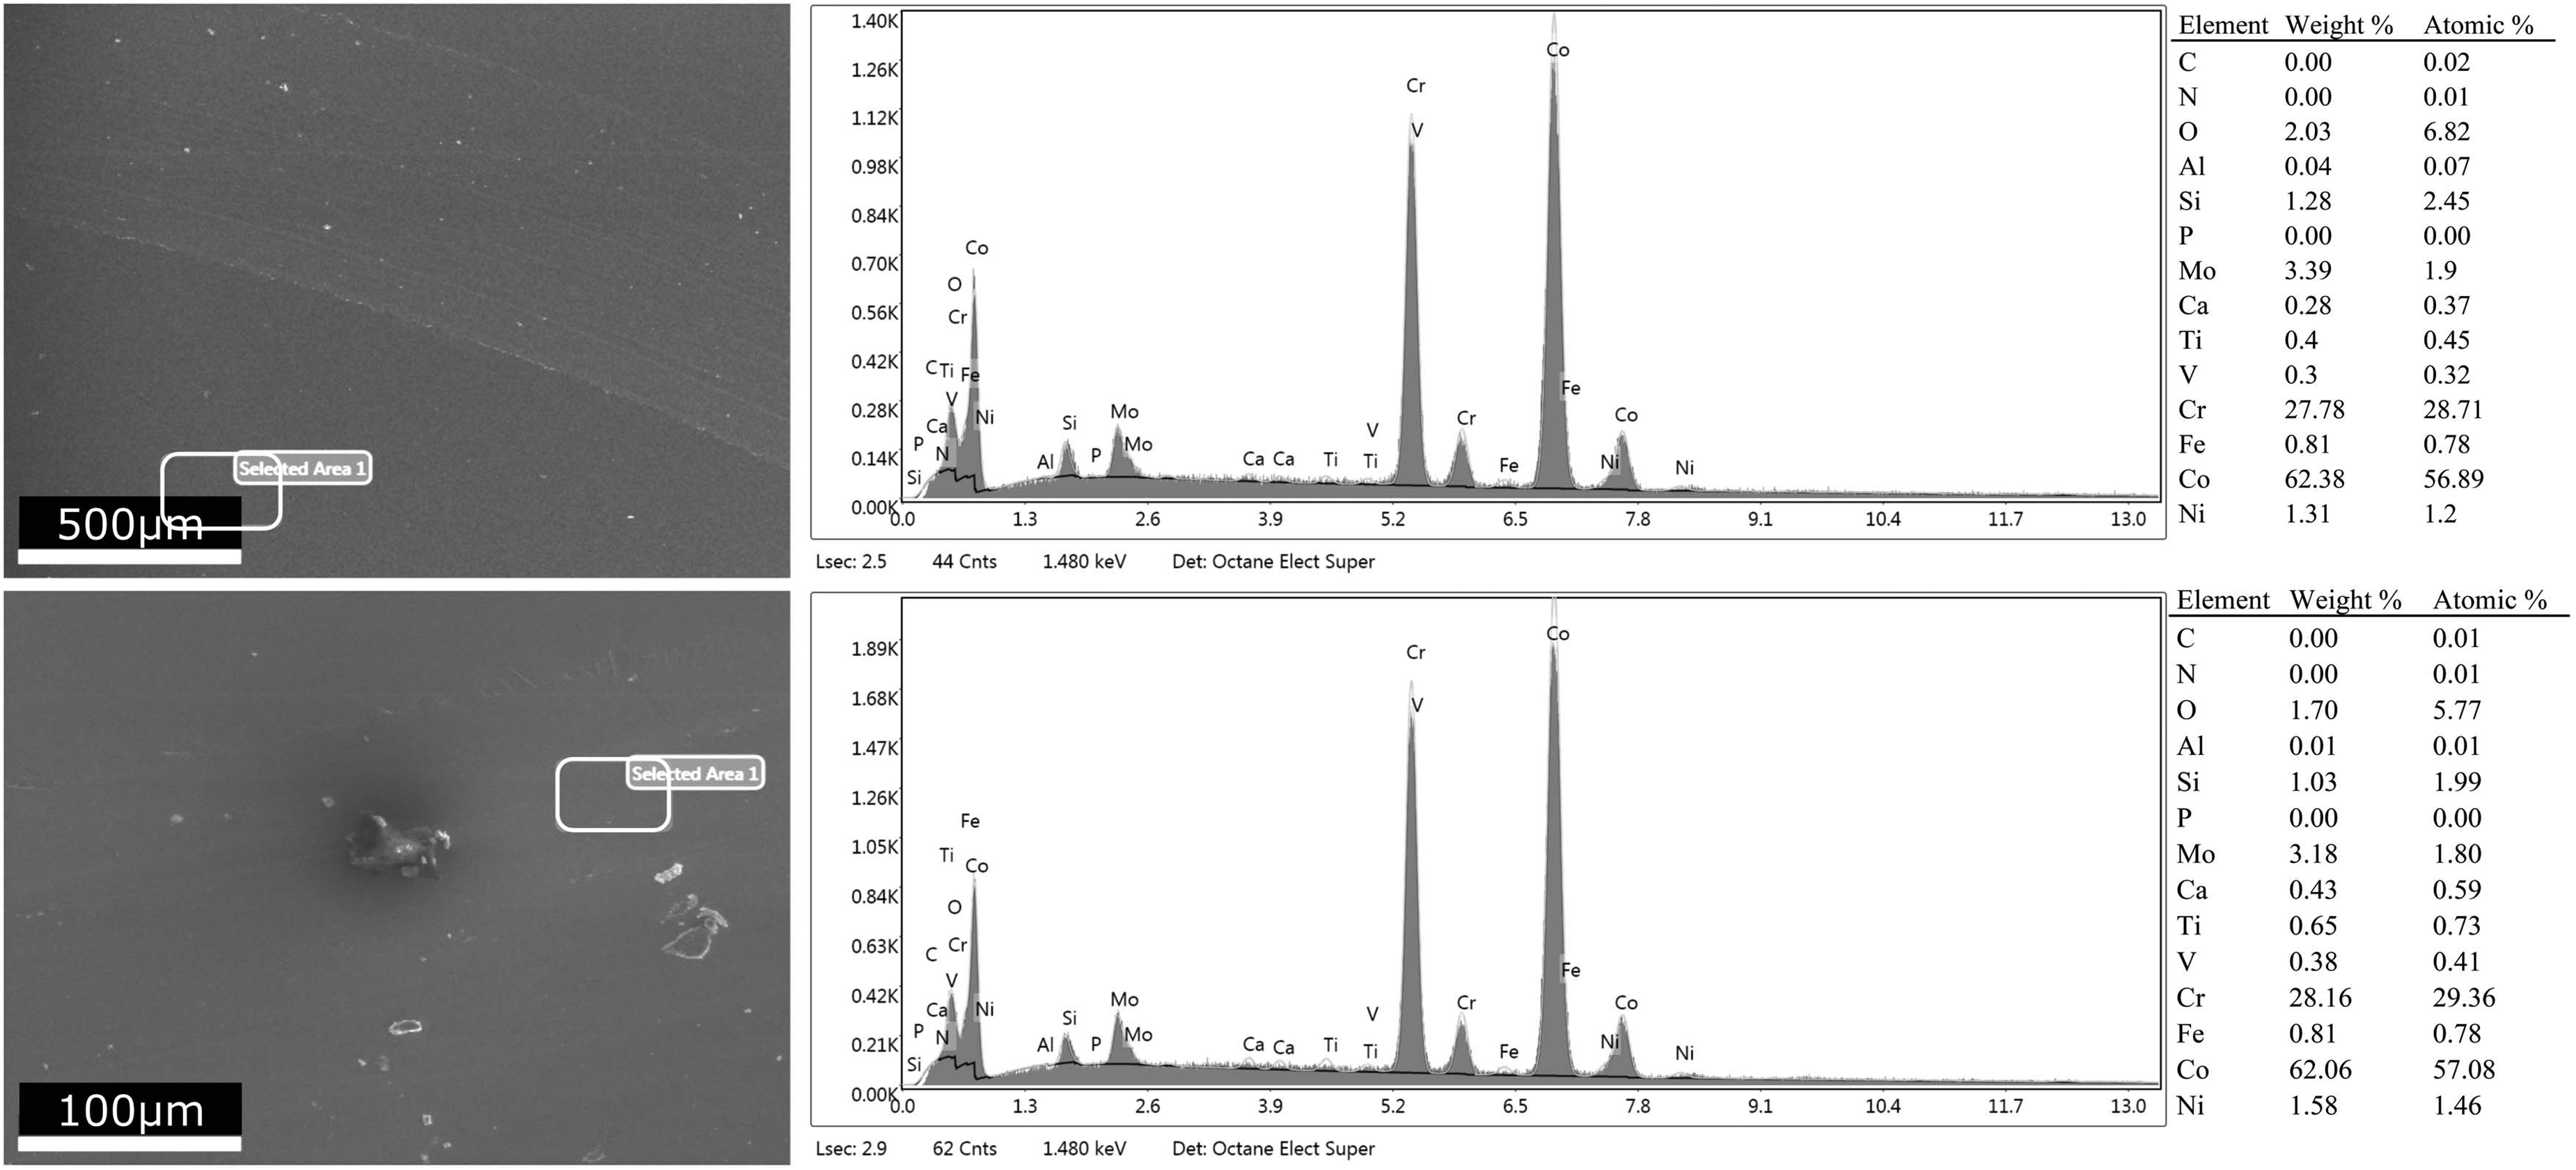
EDS analysis of the HT sample: non-worn area (top) and wear zone (bottom).
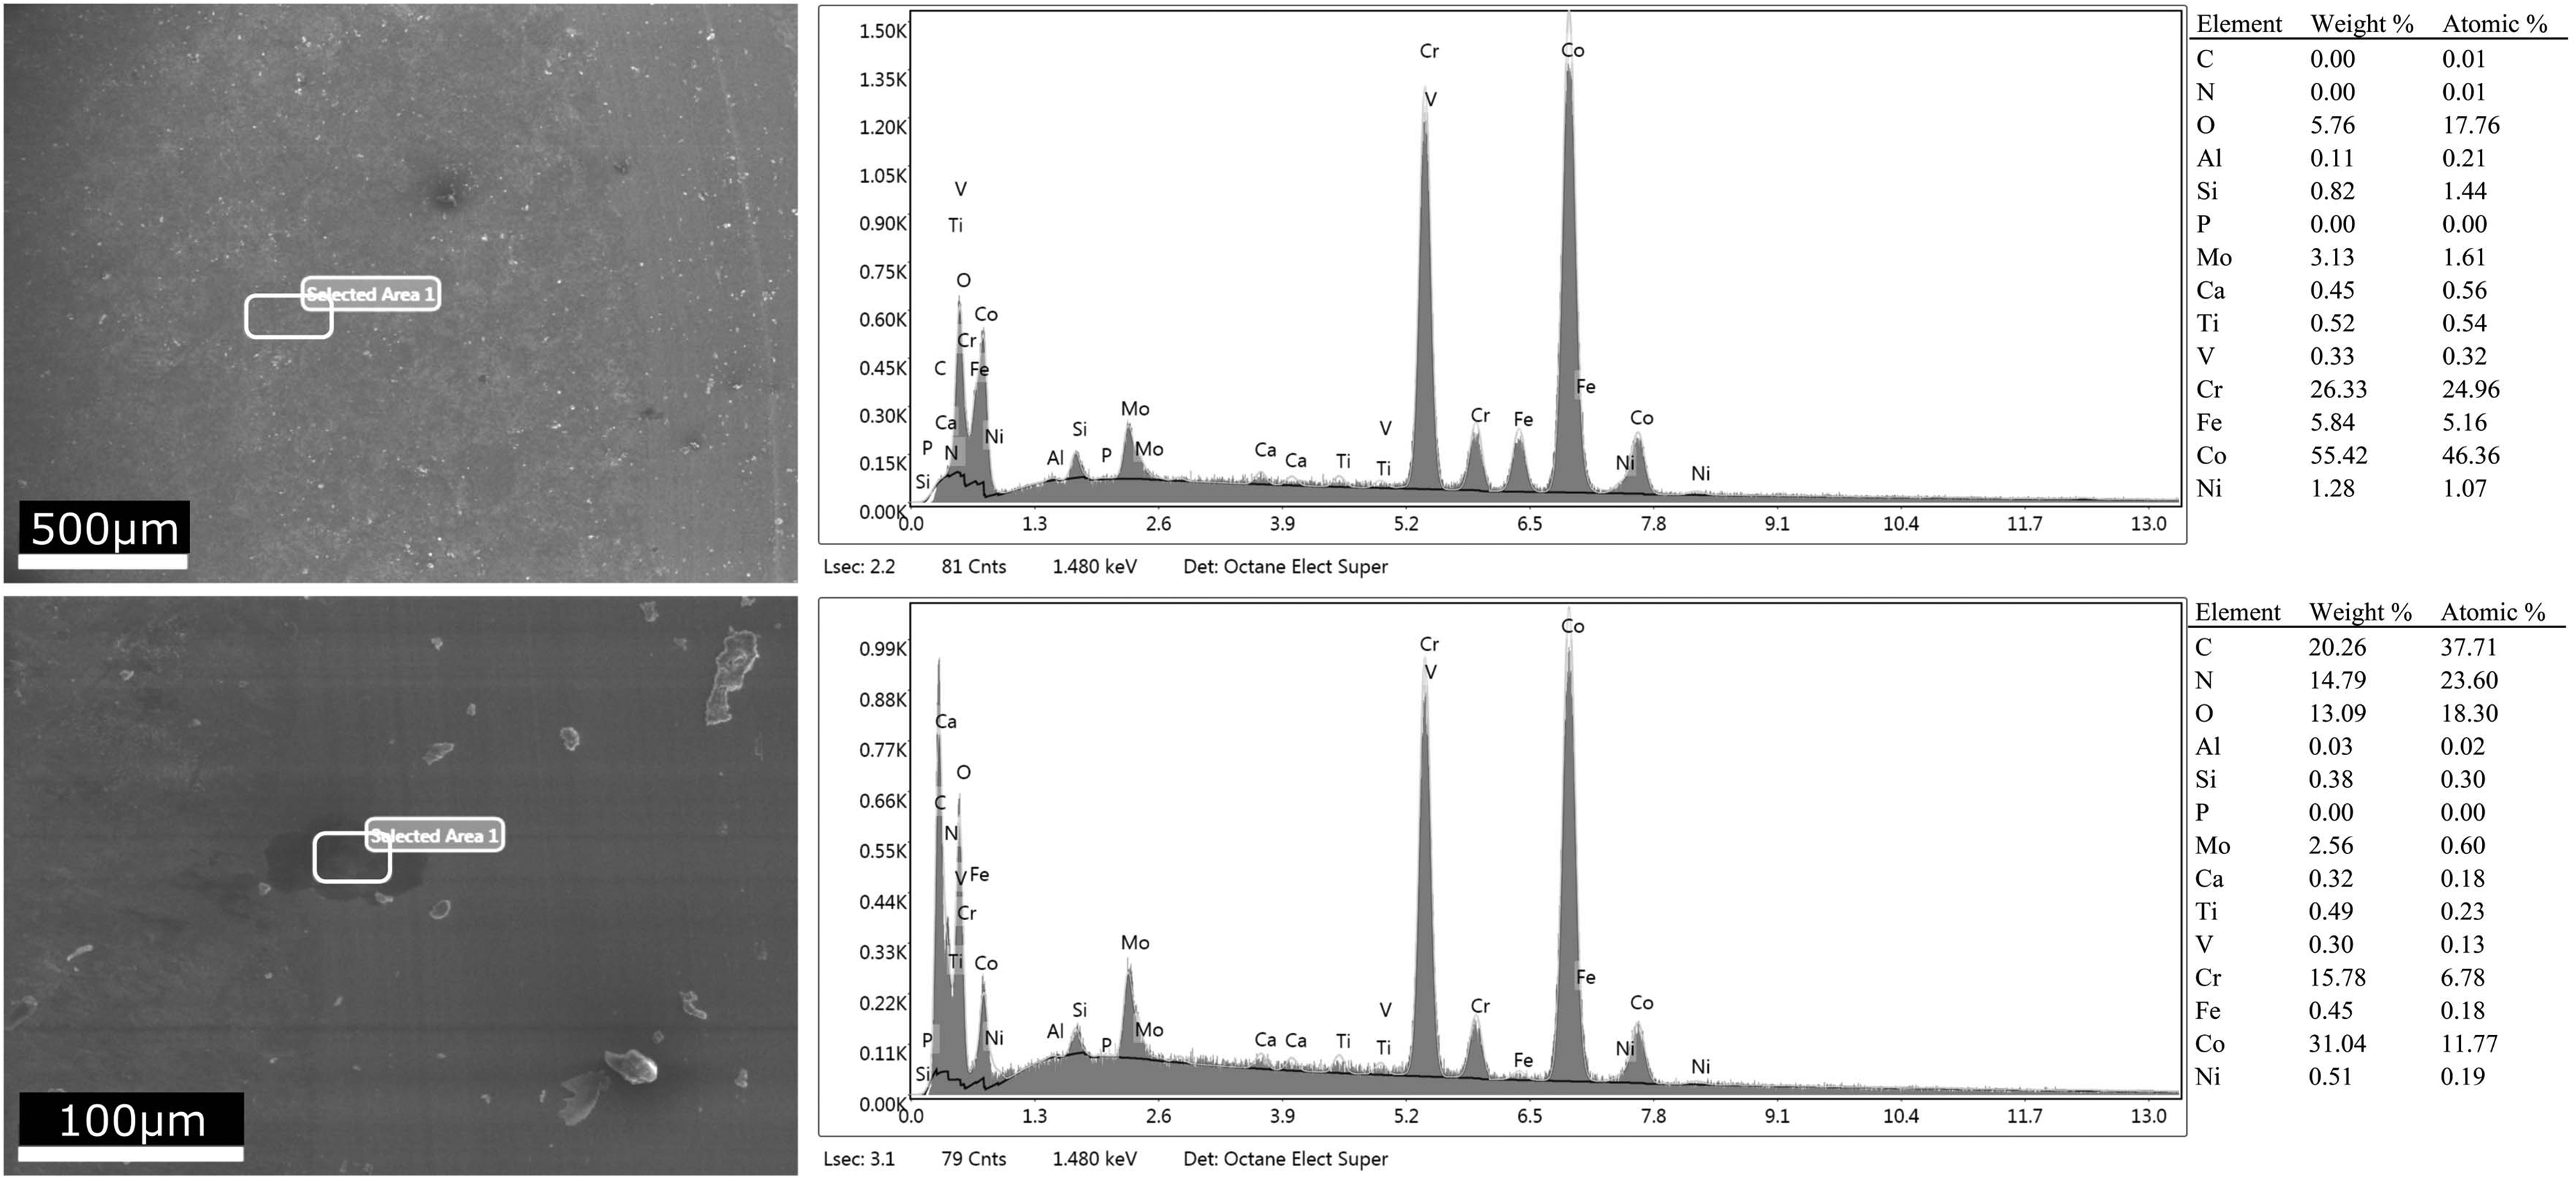
EDS analysis of the AB + SP sample: non-worn area (top) and wear zone (bottom).
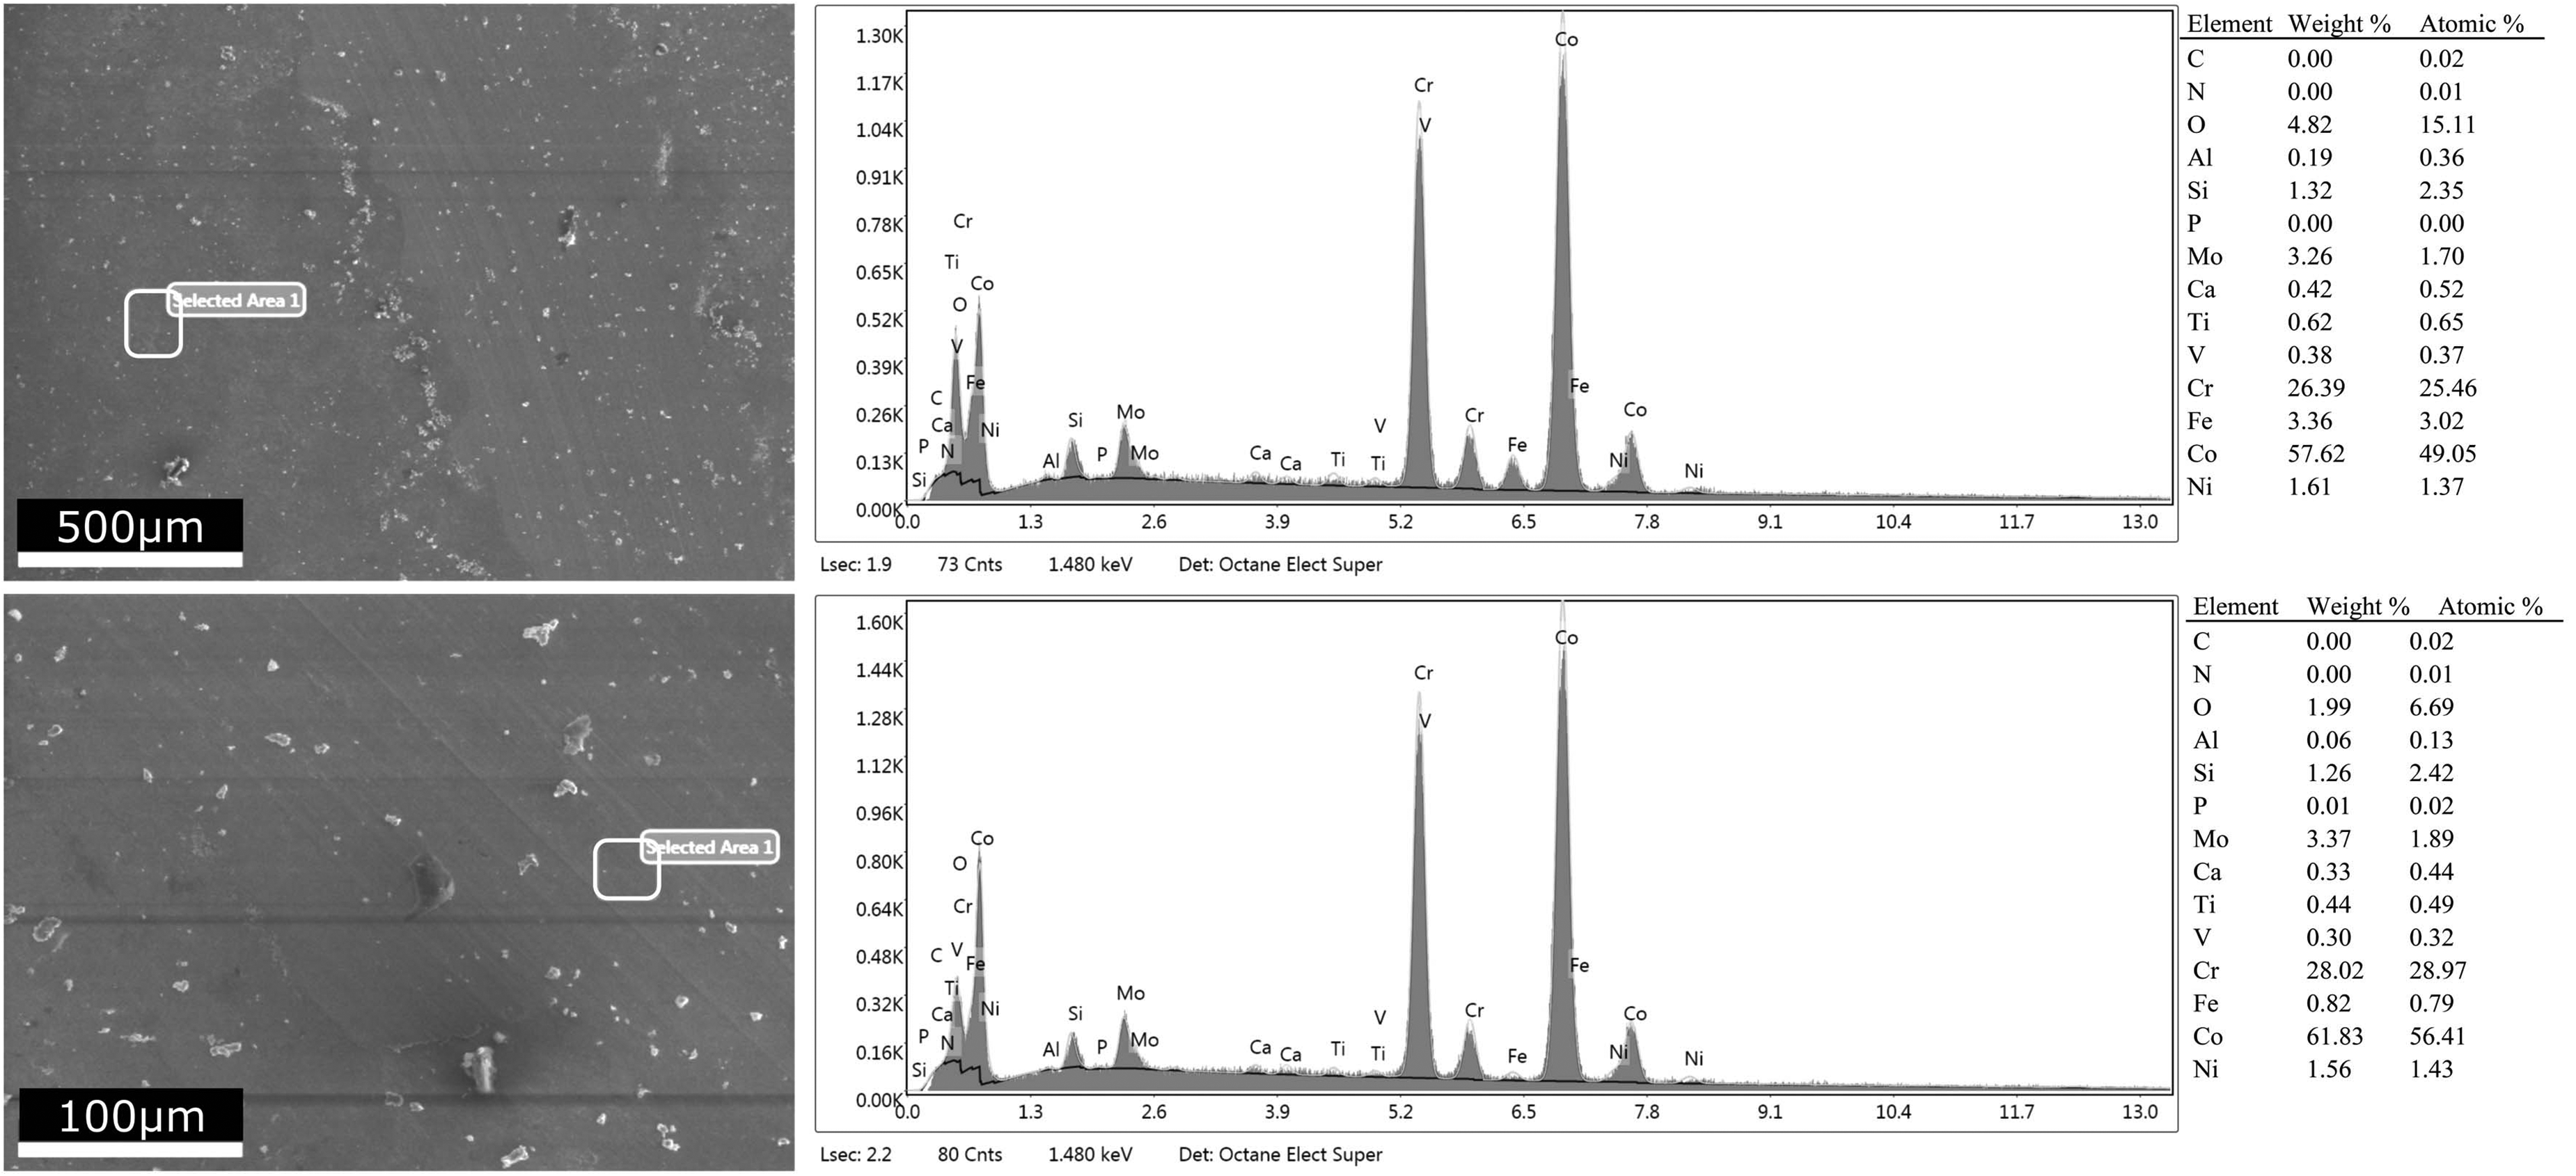
EDS analysis of the HT + SP sample: non-worn area (top) and wear zone (bottom).
Discussion
The XRD data for all samples are presented in Figure 4. Upon examination of the XRD data, both γ-FCC and ɛ-HCP phases were detected in all samples. According to calculations based on the Sage and Guillaud method, 18 the ɛ-HCP phase ratio was determined to be 42.75% for the AB samples and 27.00% for the HT samples. Therefore, it was observed that the heat treatment reduced the percentage of the ɛ-HCP phase. As reported in the study by Kajima et al., 20 increasing the heat-treatment temperature (especially to high levels such as 1150°C) significantly reduces the ε-HCP phase ratio and promotes transformation to a largely γ-FCC phase. In this study, the applied heat treatment caused a similar effect. The high HCP ratio in the as-built samples decreased from 42.75% to 27.00%. This significant decrease is likely due to its transformation into the high-temperature stable FCC phase, which was retained during cooling. In the AB + SP samples, an increase in the ɛ-HCP phase ratio to 51.08% was observed. It was observed that shot peening of the samples resulted in a transformation from the γ-FCC phase to the ɛ-HCP phase. This phenomenon was attributed to strain-induced martensitic transformation. It has been reported in the literature that Co-Cr alloy materials manufactured by L-PBF undergo strain-induced martensitic transformation through plastic deformation. 21 Other studies have also found that the Co-Cr alloy undergoes a strain-induced martensitic transformation when subjected to compressive stress, 22 tensile stress, 23 hot rolling, 24 cold rolling 25 and ion-implantation. 26 The diffraction peak positions in the shot-peened samples indicate the formation of strain-induced martensitic transformation and the presence of ɛ-HCP phases. This suggests that the HT + SP samples have a higher proportion of the ɛ-HCP phase compared to the AB + SP samples. The ɛ-HCP phase ratio reached its maximum value of 63.04% in the HT + SP samples. It is evident that the applying shot peening to the heat-treated material significantly promoted strain-induced martensitic transformation. In both the AB + SP and HT + SP conditions, the local nucleation of the strain-induced ɛ-HCP phase is also highly dependent on the crystal orientation of individual grains relative to the impact direction, as favorably oriented grains accommodate shear stresses more readily, as stated in the literature. 27
When surface roughness was evaluated, an increase in roughness was observed following shot peening. This is due to the nature of the shot peening process, which modifies surface topography and increases surface roughness by deforming the surface with the peening media. When HT samples were compared with AB samples, the increase in surface roughness was more pronounced. This can be explained by the HT samples’ comparatively softer surface, which experiences greater plastic deformation during the SP process.
The primary factors contributing to the increase in hardness following shot peening (SP) are the reduction in crystallite size and the increase in lattice strain. Furthermore, the SP process triggers a strain-induced martensitic transformation. In the AB samples, the ɛ-HCP phase ratio was determined to be 42.75%, while in the AB + SP samples, an increase in the ɛ-HCP phase ratio was observed, reaching 51.08% (an increase of 21%). In the HT samples, the ɛ-HCP phase ratio was 27.00%, whereas in the HT + SP samples, the ɛ-HCP phase ratio was determined to be 63.04% (an increase of 233%). Thus, the SP process leads to a transformation from the γ-FCC phase to the ɛ-HCP phase. The total number of slip systems in the γ-FCC structure is 12, while it is 3 in the ɛ-HCP structure. Additionally, the yield strength of the ε-HCP phase in Co-Cr-Mo alloys is higher than that of the γ-FCC phase with the same grain size.28,29 Therefore, it can be said that plastic deformation is more challenging for the ε-HCP phase by its nature, and the increase in the amount of ε-HCP phase is one of the reasons for the hardness induced by the SP process. Shot peening is a method that increases surface hardness through plastic deformation. The primary mechanism behind the observed hardness increase is plastic deformation, which increases dislocation density. Moreover, it can result in a reduction in grain and subgrain (crystallite) sizes near the surface. Crystallite refinement and the γ-FCC to ε-HCP phase transformation were identified as the distinct microstructural origins responsible for SP-induced surface hardening. The resulting mechanical improvements can be correlated with the observed tribological behavior. This enhanced surface integrity is, in fact, the principal mechanism governing the material's response to sliding wear. The subsequent analysis will therefore demonstrate how this significant increase in hardness is the critical intermediary linking the microstructural changes to the significant improvement in wear resistance.
It has been observed that shot peening enhances wear resistance in all specimens. This improvement is attributed to the combined effects of plastic deformation induced on the surface by the shot peening process, along with an increase in the ε-HCP phase due to strain-induced martensitic transformation. These changes reduced the crystal size and increased lattice strain, thus improving the surface integrity. The Co-Cr alloy containing the ε-HCP phase exhibits greater stability, hardness, and strength, resulting in a lower wear rate than the alloy with the γ-FCC phase. 30 Additionally, it should be noted that the surface roughness increases after shot peening. This might initially suggest an increase in wear rate. However, the obtained results demonstrate that the strength and surface characteristics achieved through shot peening outweigh the negative impact of surface roughness.
The literature also reported that an average friction coefficient of 0.36 for the samples produced by sintering mechanically alloyed Co–28Cr–6Mo metal powder. These samples were abraded against Al2O3 discs in a pin-on-disc configuration. 30 In another study, 12 the average COF was determined to be 0.46 during wear testing of L-PBF fabricated Co-Cr alloy samples against a Si3N4 ceramic ball. The wear tests performed within the scope of the study showed that the friction coefficient results obtained were consistent with the literature.
A quantitative comparison with other surface modification techniques is essential to contextualize the effectiveness of the shot peening (SP) process. Our study achieved the lowest specific wear rate (SWR) of 4.95 × 10⁻5 mm3/Nm in the HT + SP group, a significant reduction from the 8.19 × 10⁻5 mm3/Nm observed in the as-built (AB) samples. This result is highly competitive with other established post-processing methods mentioned in our introduction. For instance, HIP, noted by Cornacchia et al. 14 to provide excellent wear resistance, has been reported in the literature to yield SWR values in a similar range (e.g., approximately 1.0 to 5.0 × 10⁻5 mm3/Nm) by reducing porosity. We found that the HT + SP treatment enabled shot peening to achieve wear performance compared to that of this widely accepted industrial process. In contrast, more advanced severe plastic deformation (SPD) techniques, such as the Ultrasonic Nanocrystal Surface Modification (UNSM) investigated by Amanov, 8 have demonstrated the potential for even greater improvements. Quantitative data from studies on UNSM show SWR values can be reduced to the 10⁻12 mm3/Nm range, an order of magnitude lower than our findings, due to the intense grain refinement and high compressive stresses generated. Therefore, while advanced methods such as UNSM may offer superior wear resistance, our findings demonstrate that conventional shot peening is highly effective and practical. It provides a significant enhancement in wear resistance, quantitatively comparable to HIP, and, as our results show, successfully improves surface properties to the point of eliminating the need for a separate post-L-PBF heat treatment.
Despite a reduction in hardness after heat treatment, the HT samples exhibited greater wear resistance than the AB samples. In the literature, it is reported that strain-induced martensitic transformation during wear is more effective in relatively softer materials with lower hardness. The superior wear resistance of the HT sample, despite its lower macroscopic hardness compared to the AB sample, is indeed governed by the transformation-induced plasticity (TRIP) effect, specifically the strain-induced martensitic transformation (SIMT). In the HT condition, the dissolution of blocky carbides reduces the initial bulk hardness, while leaving the metastable γ-FCC matrix highly ductile. During severe tribological loading, this ductile matrix is highly prone to massive SIMT (γ→ɛ), which absorbs strain energy and induces profound localized dynamic work-hardening exactly at the asperities. Conversely, the higher initial hardness of the AB state is due to the presence of massive undissolved carbides. During wear, these carbides easily detach and act as third-body abrasives, accelerating wear rates.31–33 Therefore, the TRIP effect is the fundamental mechanism allowing the softer HT matrix to continuously self-harden and resist wear far better than the harder, but more brittle and abrasive-prone, AB matrix. Also, the significant improvement in wear resistance following the shot peening treatment, despite the associated increase in surface roughness, can be fundamentally explained by the work- hardening mechanism and Archard's Law. According to this model,
34
the total wear volume V is directly proportional to the applied load L and the sliding distance s, and inversely proportional to the material hardness H, as shown in Equation (5):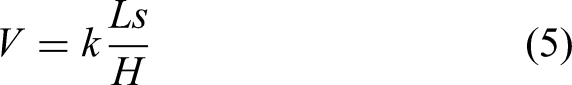
This relationship dictates that the wear volume is inversely proportional to the material's surface hardness. In this study, the microhardness of the HT + SP samples reached a peak of 685 HV, an 84% increase over the HT (372 HV) state. This dramatic rise in hardness is attributed to the intense plastic deformation induced by the shot peening process at maximum intensity. The high-energy impact of the shots increases dislocation density and promotes grain refinement in the near-surface layer, resulting in substantial work hardening. As predicted by Archard's Law, this enhanced hardness effectively resists the abrasive and adhesive actions of the counter-body, thereby outweighing the detrimental effects of the increased surface roughness and resulting in superior wear performance for the HT + SP and SP conditions.
The tribological interaction of materials can transition from two-body contact to three-body contact. 35 The worn surfaces of all samples were examined using an optical microscope, and the presence of scratches and grooves, as shown in Figure 14, indicates the occurrence of abrasive wear. Additionally, in sample AB, the presence of detached particles (debris) at the sliding interface acts as a third body, intensifying abrasive wear. It has been reported that 36 these hard detached particles can penetrate into the softer matrix, causing scuffing and groove formation on the wear surface. The reduction in wear track widths after shot peening validates the process's effectiveness in increasing the material's wear resistance.
In the literature, 37 it is stated that plastic deformation occurring during wear testing leads to strain-induced martensitic transformation. The XRD data revealed an increase in the ε-HCP phase formed by the strain-induced martensitic transformation due to shot peening. Furthermore, a reduction in crystallite size and an increase in lattice strain have been identified. This increase in lattice strain, reflected by the shift in diffraction peaks, is intrinsically linked to the macroscopic residual compressive stresses induced by the high-velocity impact of the S230 shots. During wear tests, a similar mechanism is effective, and therefore, the increase in ε-HCP with fewer slip systems is more effective at mitigating wear in heat-treated (soft) samples, resulting in increased strength and contributing to enhanced wear resistance in HT samples.
The EDS analyses for the AB, HT, AB + SP, and HT + SP samples are presented in Figures 18 to 21, respectively. The EDS analysis of the wear tracks revealed the presence of oxygen in all samples. The detection of oxygen confirms the formation of oxidized wear products due to frictional heating during sliding. This observation indicates the potential presence of an oxidative wear mechanism, as reported in the literature. 14 The EDS analyses of the wear tracks (Figures 18 to 21 revealed significant differences in oxidation behavior, correlating strongly with the observed microstructure and wear resistance of the four sample groups. The non-peened samples (AB and HT) showed minimal oxygen in their wear tracks (2.41% and 1.70% atomic, respectively), which is consistent with the predominantly abrasive wear mechanism observed (Figures 14 to 16). In contrast, the shot-peened samples demonstrated a complex tribochemical interaction. The AB + SP sample, despite its increased hardness, showed a substantial increase in oxygen in its wear track (13.09% atomic). This suggests that the high internal strain in this group led to the creation of fine, highly reactive debris, accelerating a tribo-chemical or oxidative wear component. Most importantly, the HT + SP sample—which exhibited the highest wear resistance (lowest SWR, Figure 10) and the most significant ε-HCP phase transformation (63.04%, Figure 5)—showed low oxygen content (1.99% atomic) in its wear track. This low oxygen level strongly suggests that the stable, highly transformed surface of the HT + SP sample was more effective at resisting the combined mechanical and chemical wear mechanisms, thereby minimizing the generation of oxidized debris.
Conclusion
A comprehensive assessment was undertaken to elucidate the impact of shot peening on the wear characteristics of L-PBF Co-Cr-Mo samples. The primary findings are summarized as follows:
The investigation demonstrated a notable improvement in the wear resistance of the samples after shot peening, with the HT + SP samples exhibiting the highest wear resistance. This improved wear resistance was directly correlated with a significant increase in surface hardness, which was attributed to microstructural changes, primarily grain refinement and the strain-induced γ-FCC to ε-HCP phase transformation. A strong quantitative correlation (R2 = 0.9637) was observed between the ε-HCP volume fraction and surface hardness, confirming that the gamma-to-epsilon transformation is the primary strengthening mechanism. Quantitatively, the specific wear rate of the HT + SP group (4.95 × 10⁻5 mm3/Nm) was highly competitive and on par with results reported in the literature for other post-processing methods, such as hot isostatic pressing (HIP). The superior performance of the HT group compared to the AB group—despite its lower initial bulk hardness—is attributed to the transformation-induced plasticity (TRIP) effect, in which the metastable gamma-matrix provides dynamic work-hardening during the wear. The study revealed a discernible increase in hardness for both AB and HT samples upon shot peening. However, post-heat treatment subsequent to L-PBF resulted in a reduction in hardness. Through shot peening, a significant reduction in the samples’ coefficient of friction was observed. Notably, AB samples had the highest coefficient of friction, while the HT + SP samples had the lowest. The EDS analysis of the wear tracks suggested a complex tribo-chemical wear mechanism. The superior-performing HT + SP sample exhibited the lowest oxygen content, indicating that its stable, ε-HCP-rich surface was most effective at resisting both mechanical and oxidative wear. Shot peening induced an elevation in surface roughness on the sample surfaces, reaching its pinnacle in the HT + SP sample. The principal inquiry of this study pertained to the capacity of shot peening to enhance the surface properties of Co-Cr-Mo alloy parts manufactured through L-PBF. The findings affirm that shot peening is indeed effective in improving the surface properties of Co-Cr-Mo alloy parts. The secondary research question sought to ascertain whether shot peening could serve as a substitute for post-L-PBF heat treatment. Results derived from the wear test indicate that shot peening can obviate the necessity for post-L-PBF heat treatment.
While this study confirms the benefits of shot peening for wear resistance, the authors acknowledge that the observed γ→ε phase transformation may affect long-term corrosion and fatigue behavior. Future work should therefore focus on dedicated tribocorrosion testing to fully validate this process for biomedical applications.
Footnotes
Acknowledgements
No funding from public, commercial, or non-profit sectors was specifically allocated to support this research. We thank digiMODE Informatics Industry and Trade Limited Company and SLM Solutions AG for providing samples we used in our study.
Author contribution(s)
Funding
The authors received no financial support for the research, authorship, and/or publication of this article.
Declaration of conflicting interests
The authors declared no potential conflicts of interest with respect to the research, authorship, and/or publication of this article.
Data availability statement
All data are reported in the research article.