
Abstract
This study investigated the fatigue performance of friction stir lap welds (FSLW) made of AZ31B/Al6061 dissimilar alloys. Specimens showed two fracture modes under different fatigue loading levels, which suggests the stress level significantly affects the weld failure mode. Fracture observation revealed unevenly distributed incomplete fusion defects in the weld seam, and the FSLW joints exhibited brittle-ductile mixed fatigue fracture. Finite element models for notch stress and local stress-strain methods were established accordingly to evaluate fatigue life, and then the prediction results were compared with experimental data. Both methods could effectively predict the fatigue life, with errors mostly falling within a factor of 3. Furthermore, the Manson-Coffin damage model of the local stress strain method was more suitable than Smith-Watson-Topper damage model for fatigue evaluation of the present experimental fatigue data.
Keywords
Highlights
An FE model for fatigue life prediction of dissimilar Mg/Al FSLW joints considering non-uniform distribution of hook defect heights is developed
Notch stress and local stress-strain methods predict the fatigue life of such joints within error of 3 factor
The Manson-Coffin damage model outperforms the Smith-Watson-Topper model for fatigue life prediction of these FSW joints
The selection criteria for fatigue life prediction methods under different stress levels are proposed
Introduction
Magnesium alloys and aluminum alloys, renowned for their excellent properties such as low density, high specific strength, and good vibration damping capacity, 1 have emerged as the most promising lightweight non-ferrous structural materials and functional materials for special applications in high-end equipment manufacturing fields, including aerospace, rail transit, and automotive manufacturing. 2 With the increasing demand for structural light-weighting in these fields, the need for joining Mg/Al dissimilar materials is becoming increasingly urgent. The joining quality and mechanical properties of the joints, particularly the joint strength, are of critical importance. However, magnesium alloys and aluminum alloys exhibit significant differences in physical properties (e.g., melting point, thermal conductivity) and chemical properties. During conventional fusion welding, metallurgical reactions at high temperatures tend to generate a large number of brittle intermetallic compounds (e.g., Mg17Al12, Mg2Al3) and welds are prone to defects such as hot cracks and pores, 3 making it difficult to achieve high-quality joining of the two materials.4,5 Friction stir welding (FSW) is a solid-state joining technology that offers advantages including small welding deformation, few defects, low residual stress in joints, and high weld strength. 6 It is thus recognized as the preferred method for achieving high-quality welding of Mg/Al dissimilar materials.7,8 Notably, FSW joints of Mg/Al dissimilar materials inherently exhibit significant material asymmetry (Significant differences in properties exist between the base metals on either sides of the weld interface). During actual working services, these joints generally withstand complex loads such as cyclic loads, making them prone to become stress concentration zones. Their risk of fatigue failure is much higher than that of welded joints of made of homogeneous materials. Therefore, in-depth research on the fatigue strength of these joints is urgently needed.
In recent years, researchers have conducted valuable research on the properties of FSLW joints of dissimilar materials. Supriyanka 9 found that a proper increase in plunge depth could enhance the mechanical mixing at the lap interface, which is beneficial for improving the interface bonding; however, when the plunge depth is excessively large, the heat input and mechanical force become unbalanced, leading to defects such as voids in the nugget zone. Mohammadi 10 focused on the effects of welding process parameters on mechanical properties. Their studies showed that when the welding speed is 40 mm/min and the rotational speed is 1400 r/min, joints with strength comparable to that of the base metal can be obtained. Further microstructural analysis revealed that the uniformly distributed brittle phases in the nugget zone contribute to the improvement of the mechanical properties of the joints. Chen's 11 comparative study indicated that compared with the conventional fusion welding process, the application of FSW technology not only reduced the content of intermetallic compounds (IMCs) in AZ31B/AA6061 welded joints from 31.79% to 7.8% but also increased the tensile strength of the joints from 92 MPa to 168 MPa, significantly improving the strength of Mg/Al welded joints.
In addition, the fatigue strength of FSW-welded structures for Mg/Al dissimilar materials has always been a key research topic in engineering structure design. Rao 12 analyzed the fatigue behavior and fracture mechanism of FSLW joints of AM60B/AA6022 dissimilar alloys, and found that three typical fatigue failure modes exist in such welded joints. Under low-cycle fatigue loading, the effect of IMCs on fatigue failure is limited; however, when entering the high-cycle fatigue (HCF) stage, micro-voids in the nugget zone become initial crack sources and propagate along the lap interface, eventually leading to interface fracture failure. Peng 13 focused on the unclear mechanism of fatigue crack initiation and propagation in FSLW joints of Mg/Al dissimilar alloys, and explored the stress concentration effect of Hook defects. Their study found that Hook defects with large geometric dimensions tend to become fatigue crack initiation sources under tensile stress; moreover, the stress concentration and release caused by cyclic loading significantly affect the activation and termination behavior of grain twins, promoting crack propagation along a serrated path and aggravating the fatigue damage of the joints. Chowdhury 14 investigated the effect of lap configuration on the fatigue performance of friction stir spot welded (FSSW) joints of AZ31B/Al5754 dissimilar alloys through comparative experiments. The results showed that the fatigue life of homogeneous joints (Al/Al and Mg/Mg) is significantly higher than that of Mg/Al dissimilar joints; especially under HCF conditions, cracks in Mg/Al dissimilar joints preferentially propagate along the circumferential direction of the keyhole, eventually leading to debonding failure of the nugget zone. Rao 15 conducted a study on the mechanism of keyhole defects on the fatigue performance of FSLW joints of AM60B/AA6022-T4 dissimilar alloys. It was found that keyholes significantly shorten the effective load-bearing weld length of the joints, resulting in a decrease in joint fatigue life, but have no obvious effect on the initiation location and propagation path of fatigue cracks.
At present, the most widely used methods for evaluating the fatigue strength of aluminum alloy fusion-welded joints include the nominal stress method, the notch stress method, and the local stress-strain method. The applicability and accuracy of these methods have been extensively validated across numerous engineering structures. However, for Mg/Al dissimilar friction stir welded joints, existing studies primarily focused on experimental analyses of fatigue failure mechanisms, while research on fatigue life prediction remains relatively limited. Rao 15 conducted life prediction studies based on the structural stress method, however they did not consider the effect of local stress concentration. With regard to the fatigue assessment of welded structures, the IIW recommendations and Eurocode 9 provide important reference frameworks for conventional welded joints; however, their application does not yet extend to FSW joints.
To address these limitations, this study focuses on AZ31B/Al6061 dissimilar alloy FSW lap joints. And the Constant-amplitude fatigue tests at various stress levels were carried out. The weldline cross-sectional microstructure and fatigue fracture morphologies were examined to clarify the fatigue failure modes and crack initiation sites. The finite element method was employed to exam the local stress-strain distribution at the weld notch. Finally, the fatigue life of the joints was predicted using both the notch stress method and the local stress-strain method, and the predicted results were compared with the experimental data.
Experiments
The materials used were AZ31B magnesium alloy and 6061 aluminum alloy sheets of 3 mm thickness, with their chemical compositions given in Table 1. The FSW tool, made of H13 tool steel, had a 15 mm-diameter shoulder and a conical threaded pin (3.75 mm long, 4.1–5.5 mm diameter). Welding was conducted on an FSW-LM-AM20–2D machine: the tool rotated counterclockwise and tilted forward by 2.5°, with rotation speed 1400 r/min and traverse speed 40 mm/min. A lap joint structure was used, with AZ31B as the upper leg, 6061 Al as the lower leg. Specimens were then prepared by cutting perpendicular to the weld (Figure 1). Weld cross-section metallographic structures were observed using a Nikon Eclipse MA200 optical microscope. Vickers hardness values across the weld cross-section was measured with a KB30SRW automatic tester.
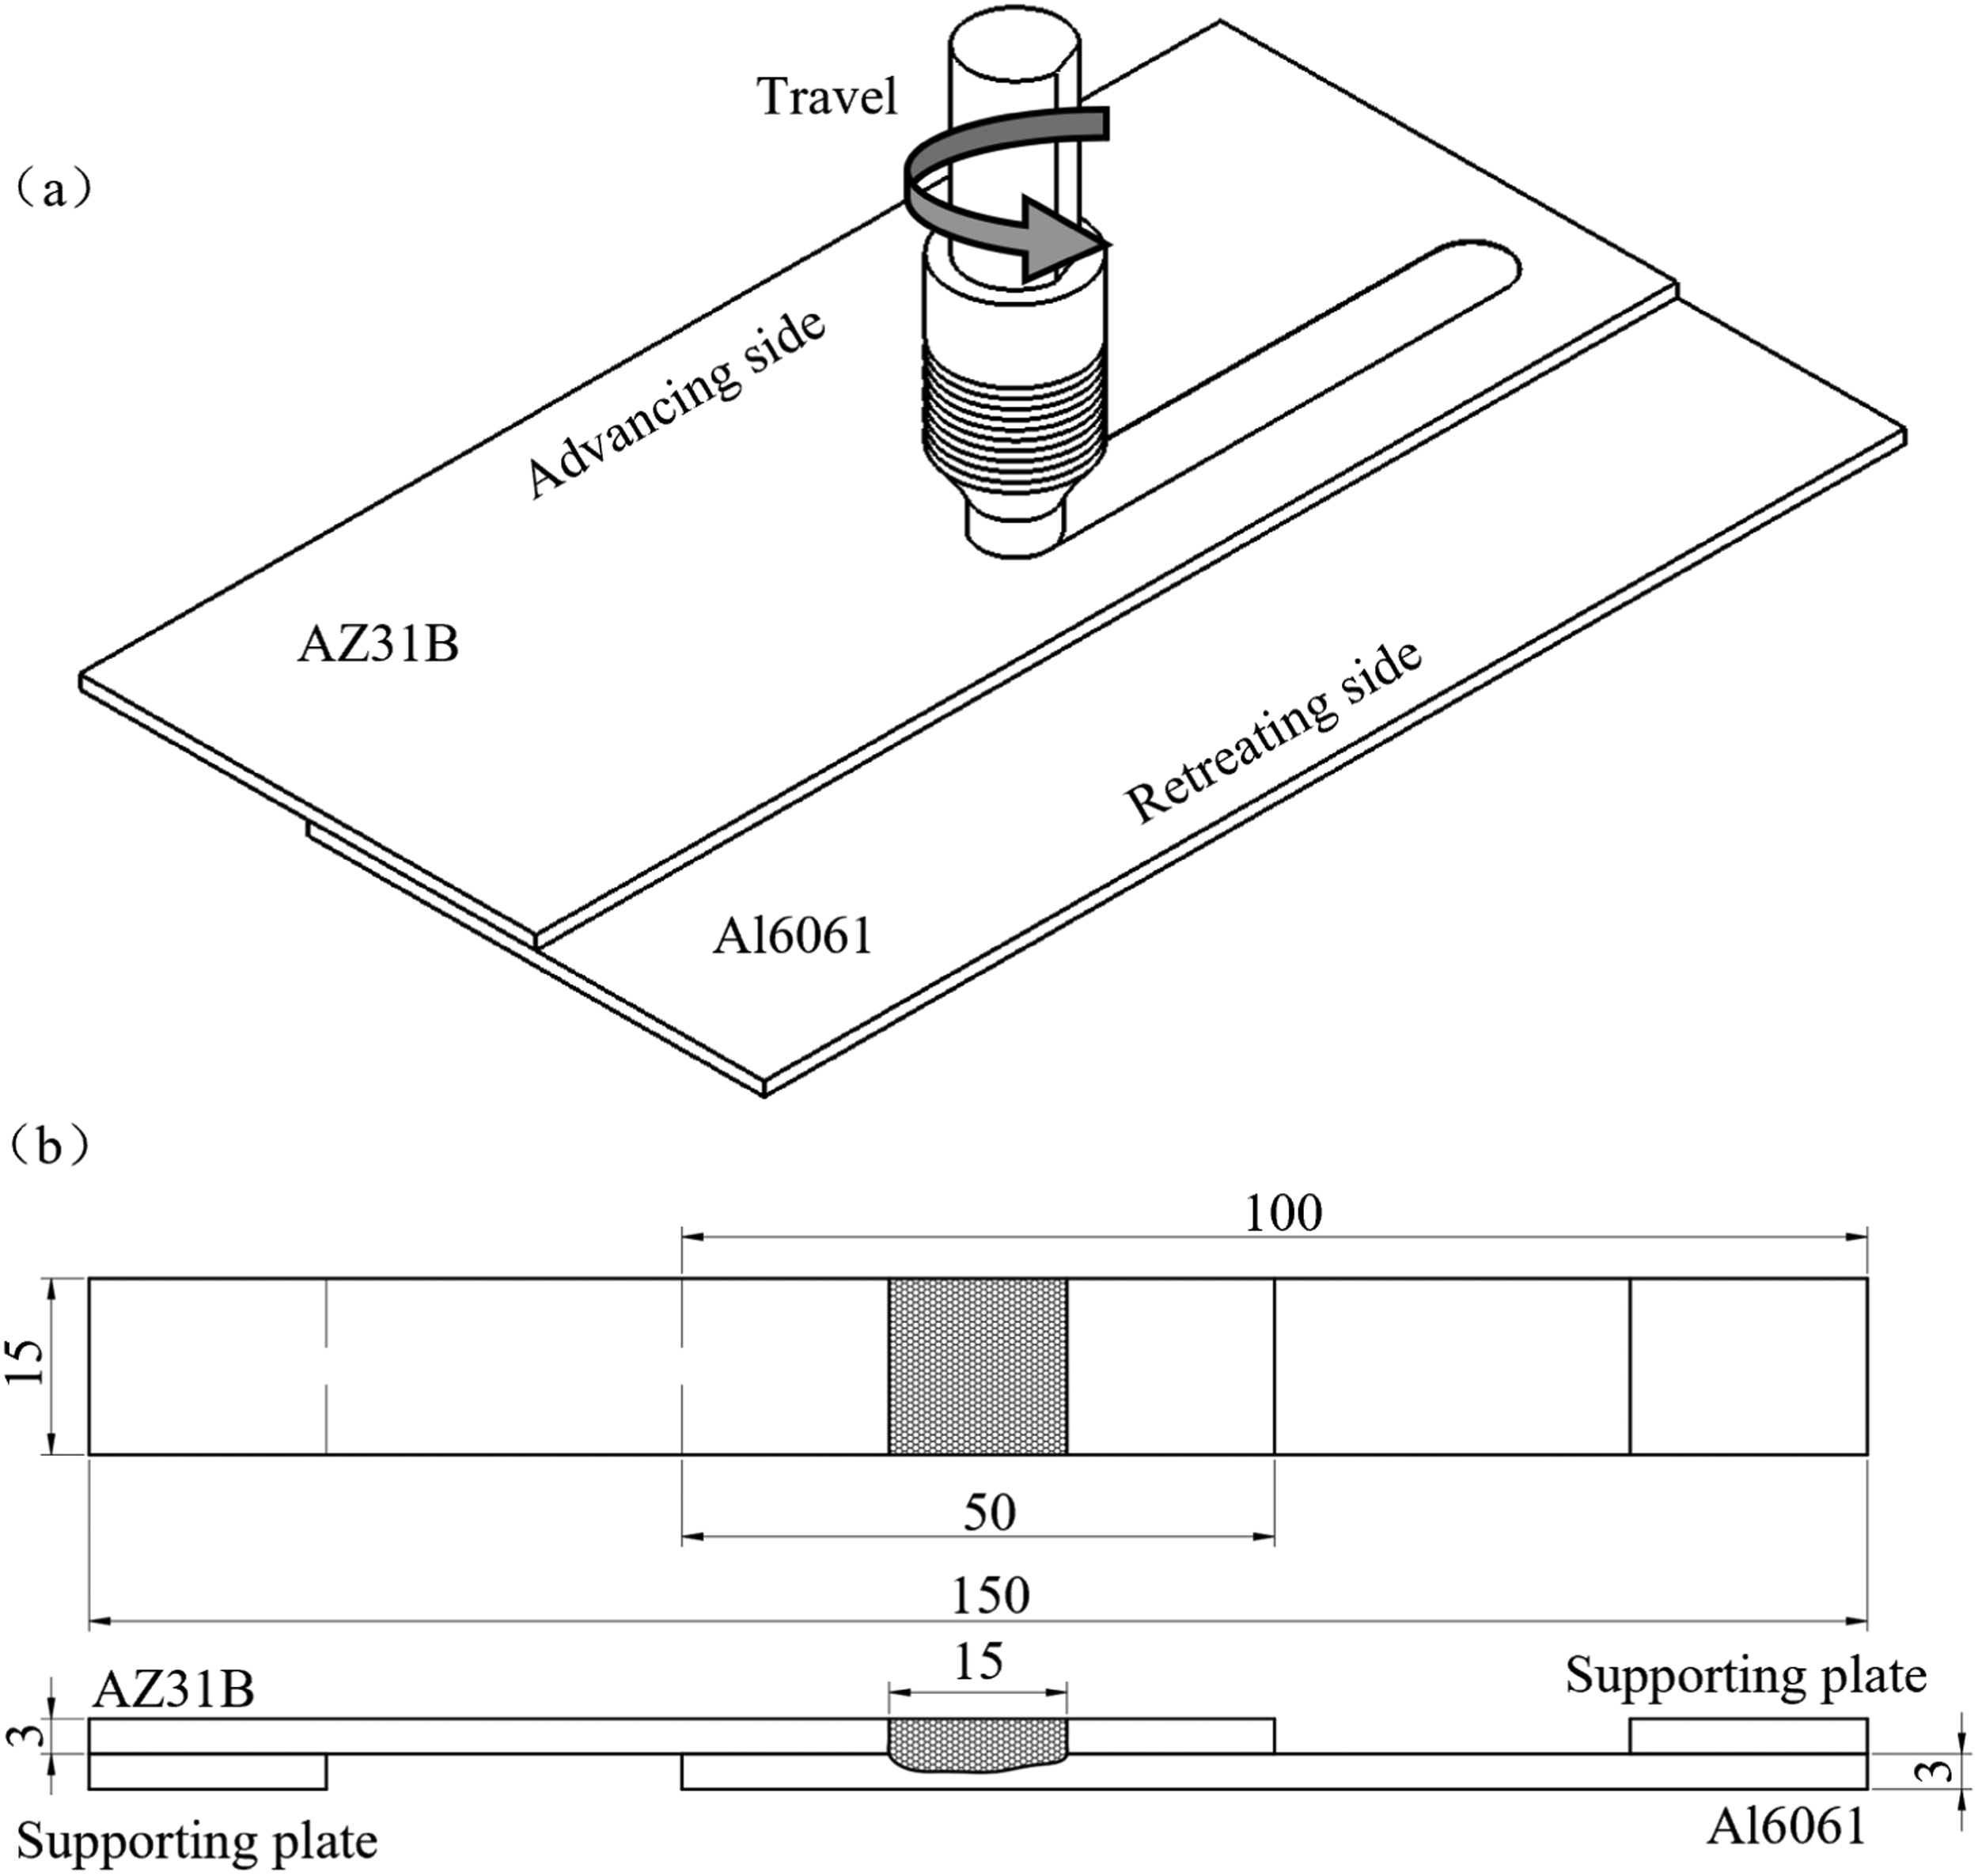
(a) Friction stir welding process; (b) Geometry and dimensions of test specimens (mm).
Chemical compositions of AZ31B magnesium alloy and 6061 aluminum alloy (mass fraction, %). 30
Constant-amplitude fatigue tests were performed on an MTS810 machine at room temperature. Two equal-thickness shims at both ends were used during fatigue tests while specimens were clamped. The loading frequency was 10 Hz, the loading wave was sinusoidal, and a constant mean load of 1 kN was maintained. Loading cycles at failure and fracture locations under different loads were recorded as fatigue life. After fatigue tests, typical fatigue fractures were observed accordingly via a NOVA Nano SEM450 tungsten-filament SEM.
Test results
Microhardness
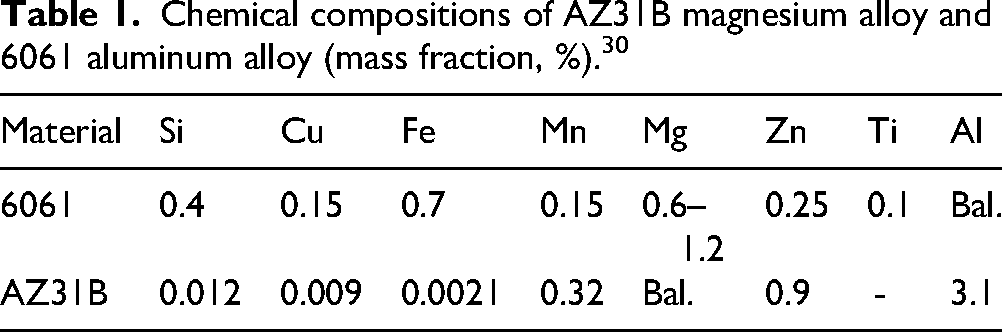
Figure 2(a) shows the distribution of microhardness measuring sites, and Figure 2(b) presents the typical Vickers hardness values distribution on the FSW lap joint weldline cross-section. The hardness test results indicate that the hardness distribution on the advancing side (AS) and retreating side (RS) is asymmetric; AZ31B magnesium alloy and 6061 aluminum alloy exhibit significant differences in hardness value, both showing a typical “W”-shaped hardness distribution profile. The hardness value of the AZ31B magnesium alloy base metal (BM) is approximately 43.65 HV, while that of the 6061 aluminum alloy BM is about 82.14 HV. In the nugget zone (NZ), both materials were mixed together and are harder. Since dislocation slip is mainly hindered by grain boundaries, smaller grain size would result in dense grain boundaries, which enhances the material's resistance to local plastic deformation and thus increases its hardness and strength. 16 Additionally, the presence of different compositions and a small amount of IMCs contribute to the highest hardness value and the largest hardness variation in the NZ. From the NZ to the thermo-mechanically affected zone (TMAZ) and further to the heat-affected zone (HAZ), the hardness changes of the two materials show opposite trends. This suggests that this trend is caused by inconsistent grain refinement degrees, which result from the uneven heat input along the plate thickness direction during the welding process. Compared with the BM, the strengthening phases in the TMAZ and HAZ are dissolved, re-precipitated, and coarsened at the peak temperature, leading to slight softening of the materials. 17
(a) Distribution of microhardness test points; (b) Vickers hardness distribution of FSW lap joints.
Weld cross-section microstructure observation
Figure 3(a) shows the microstructure in the NZ of the AZ31B/Al6061 welded joint, where there is a layered mixed structure. Relevant literatures indicate that the two materials are merged together under the drive of the tool's threaded rotation, thus forming similar alternating annular layers that represent mechanical interlocking. 18 Figure 3(b) is a magnified view of the local area at the bottom of the NZ; this area exhibits uniformly distributed equiaxed grain microstructures, the alternating bright and dark regions correspond to the distribution of the two materials. As shown in Figure 3(c), the grains of the 6061 aluminum alloy BM are elongated along the rolling direction (horizontal direction in the figure) and exhibit a lath-like distribution. Compared with the BM, both the TMAZ and HAZ had undergone grain coarsening, accompanied by a deviation in grain orientation (as shown in Figure 3(d)). The aforementioned microstructural evolution directly governs the hardness distribution characteristics of the welded joint. The high hardness of the 6061 aluminum alloy BM arises from the synergistic effect of rolling-induced work hardening and dispersion strengthening by Mg2Si precipitates. The welding thermal cycle eliminated the work hardening effect, and the grain coarsening also slightly reduced the material hardness, finally leading to a marked decrease in hardness from the BM to the HAZ. Figure 3(e) presents the microstructure of the 6061 aluminum alloy in NZ, where there is obvious grain refinement and equiaxed grains. Some black particles are randomly distributed in Figure 3(c)-(e); this is caused by the corrosion of strengthening phases formed by alloying elements (such as Mg and Cu) and the Al matrix. The rotation of the welding tool drives the flow of plasticized metal, leading to changes in grain orientation. 19 Figure 3(f) shows the microstructure of the AZ31B magnesium alloy BM, which consists of equiaxed grains of uneven sizes, representing a typical hot-rolled structure. Grain growth is observed in both the TMAZ and HAZ of the AZ31B magnesium alloy; in contrast, the NZ exhibits significant grain refinement, but is mixed with some incompletely refined grains (as shown in Figure 3(g)). This phenomenon can be attributed to the difference in original grain sizes and the failure of the welding tool's stirring action to completely break up these plasticized grains.

Microstructure of AZ31B/6061 welded joints (a) Weld nugget zone; (b) Weld nugget zone-bottom; (c) Al6061 base metal; (d) Al6061 weld zone; (e) Al6061 weld nugget zone; (f) AZ31B weld zone; (g) AZ31B weld nugget zone.
Fatigue tests
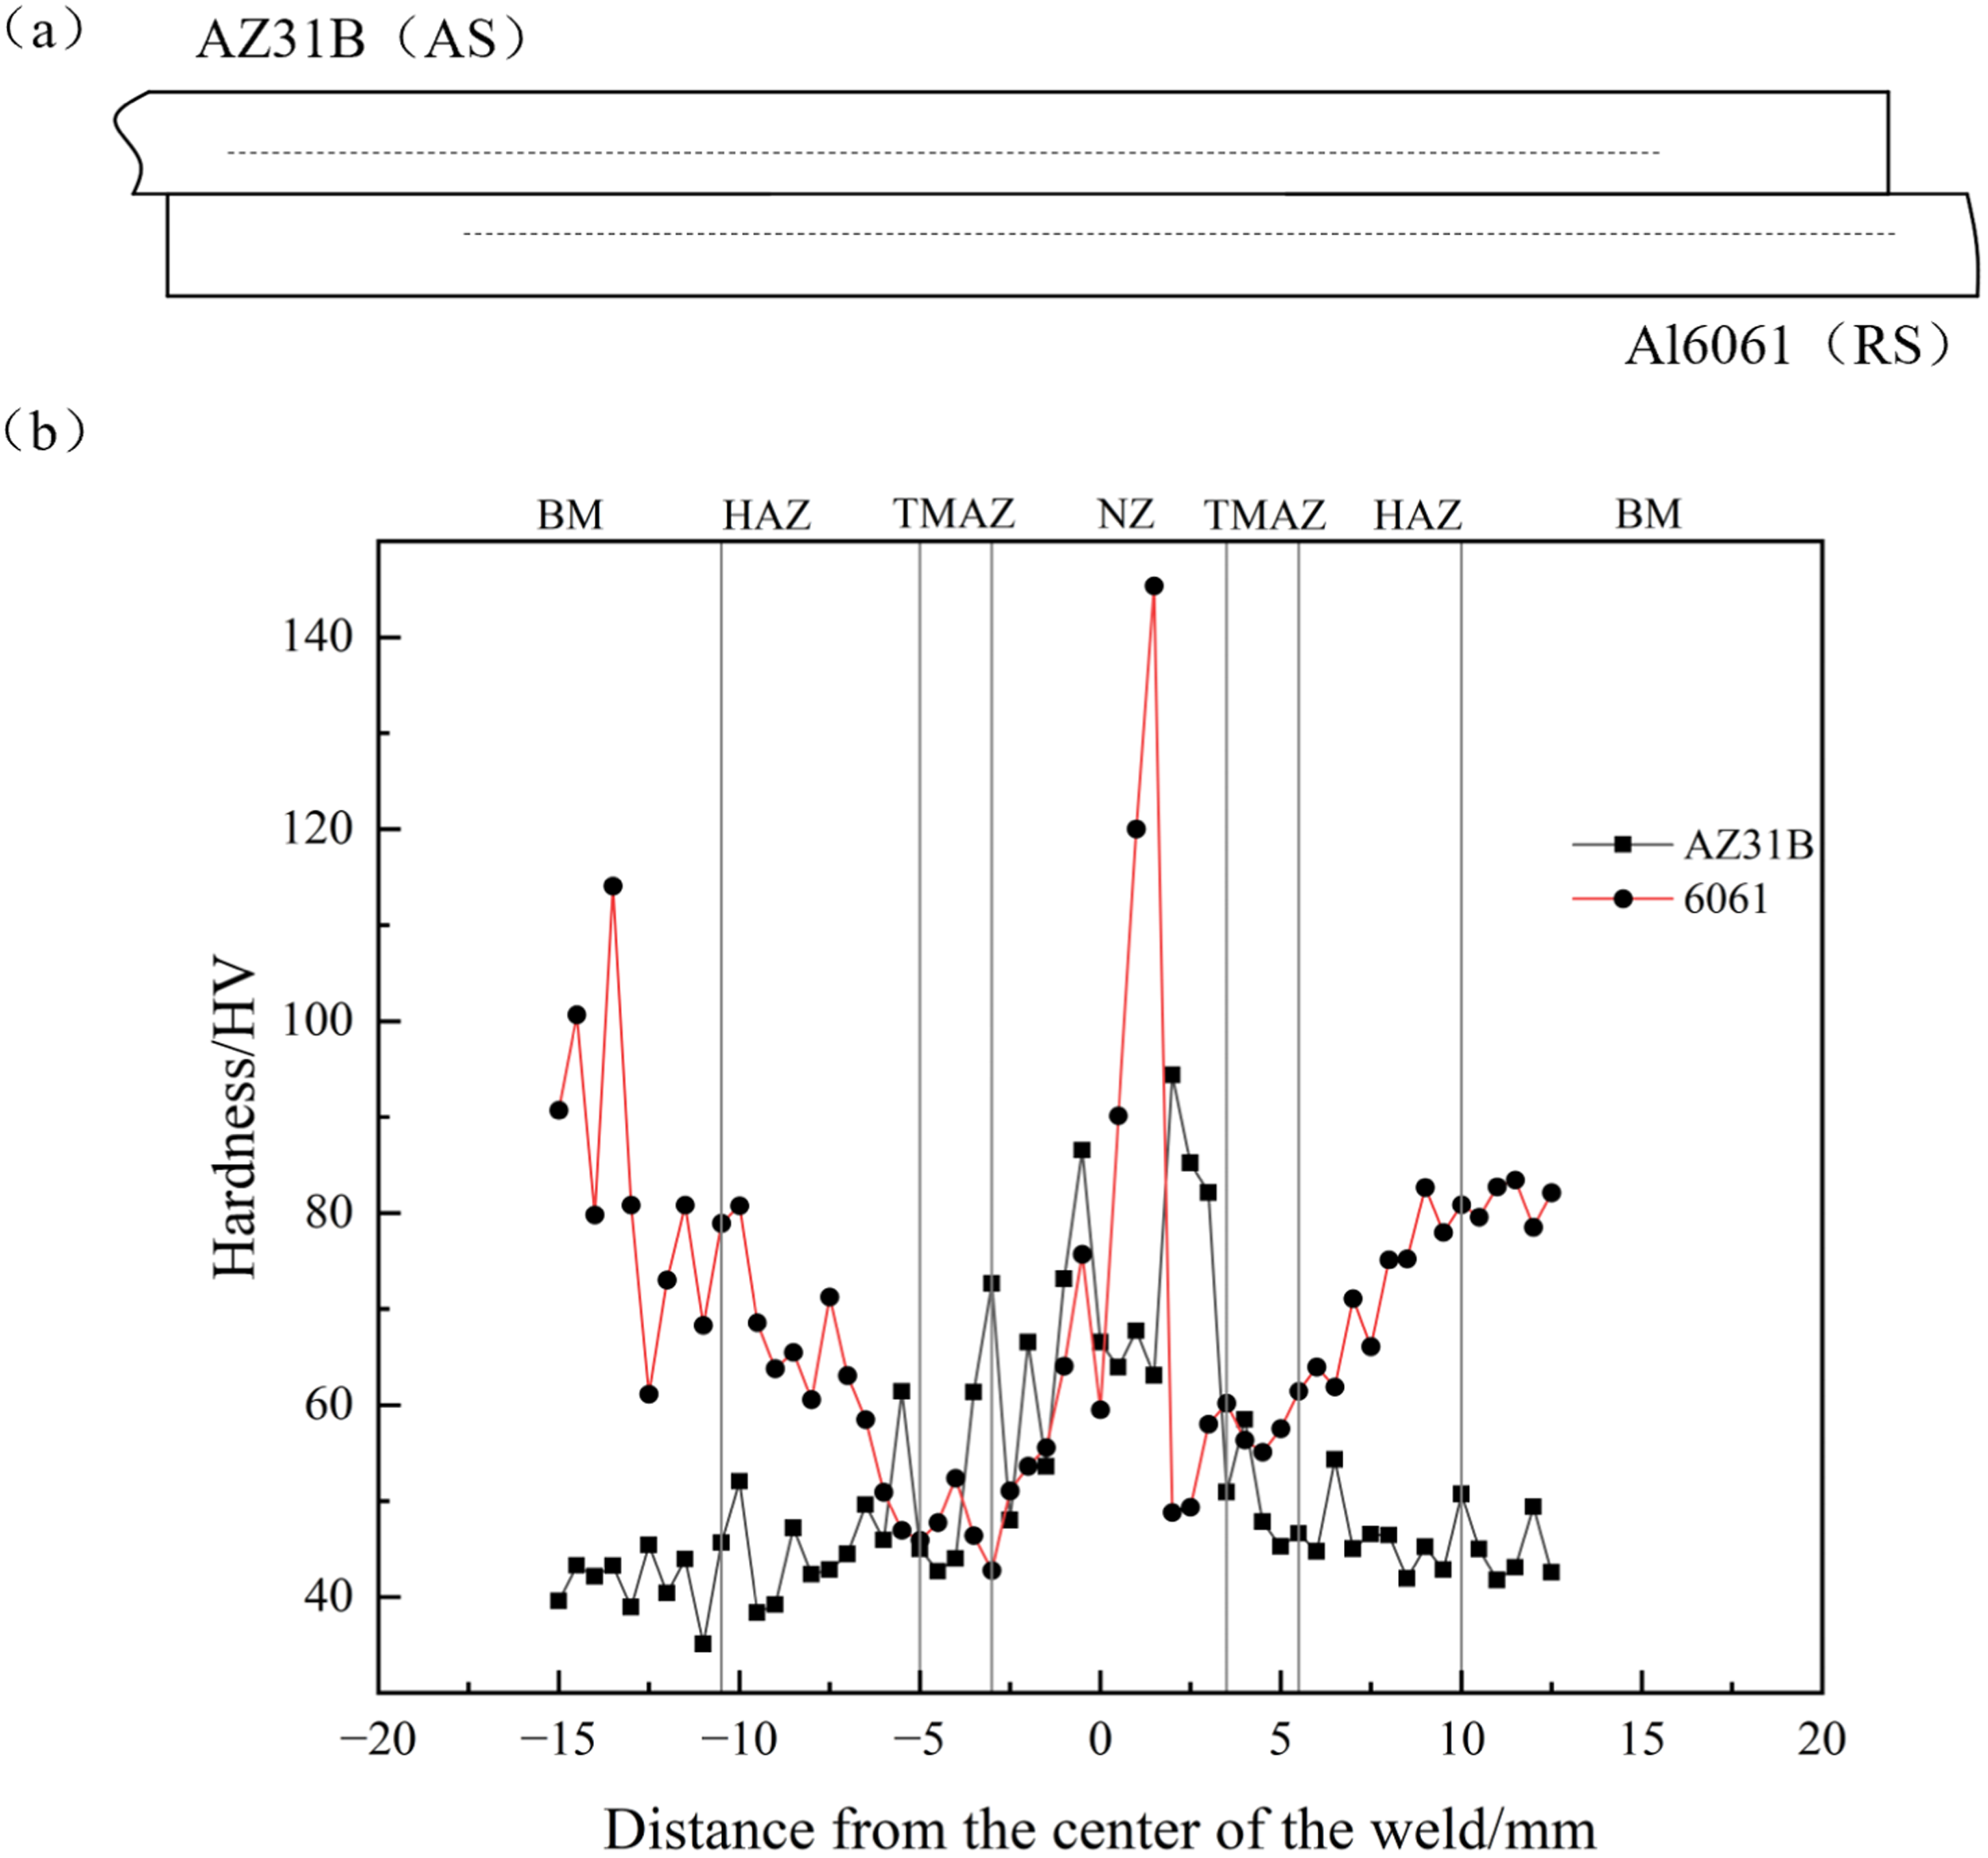
Before fatigue testing, three randomly selected specimens were tensile tested, yielding an average static fracture load of approximately 2100 N. During fatigue tests, specimens exhibited two fracture modes (Figure 4): Mode I was the thickness-direction fracture at the top of Hook defects on the AS of the magnesium alloy, while Mode II was the mixed fracture of interface failure and Mode I. As shown in Table 2, for lives below 3 × 10³ cycles, failure was mainly AS magnesium plate fracture; for lives above 3 × 10³ cycles, mixed fracture dominated, with interface failure and thickness-direction fracture observed (interface failure first, followed by thickness-direction fracture).
Fatigue fracture modes of AZ31/6061 Lap joints (AS: Advancing Side; RS: Retreating Side).
Fatigue test results. 31
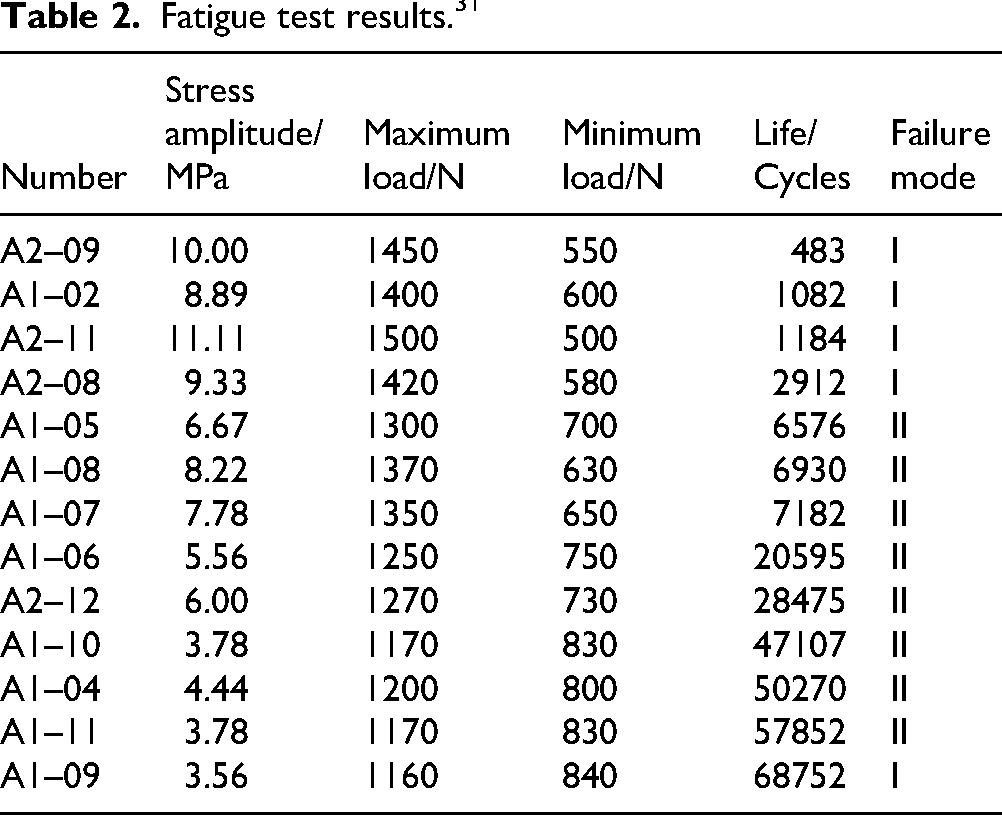
The above test results suggest the Joint failure locations vary with loading levels. It can be seen that the AZ31B/Al6061 welded joints formed were strong enough, but there existed weak bonding at AS Hook defects between the two plates-this weak bonding could withstand certain loading. Under cyclic loading, the stress on both sides of AS Hook defects acts like a Mode I crack. Under low cyclic load levels, this weak bonding at Hook defects would not open, and cracks propagated slowly along the magnesium plate thickness (reducing effective load-bearing thickness). At this stage, the faying surface between the two plates was the main and weak load-bearing region; the small amount of brittle IMCs formed at the lap interface further reduced the plastic deformation coordination of the faying surface, leading to insufficient local plastic deformation capacity. 20 Cracks then propagated along the faying surface (reducing effective load-bearing width), and the final rapid propagation stage caused sequential fracture in both directions. Under relatively high cyclic load levels, the weak bonding at Hook defects would open due to the elongation of the Mode I cracks, cracks propagated along the plate thickness.
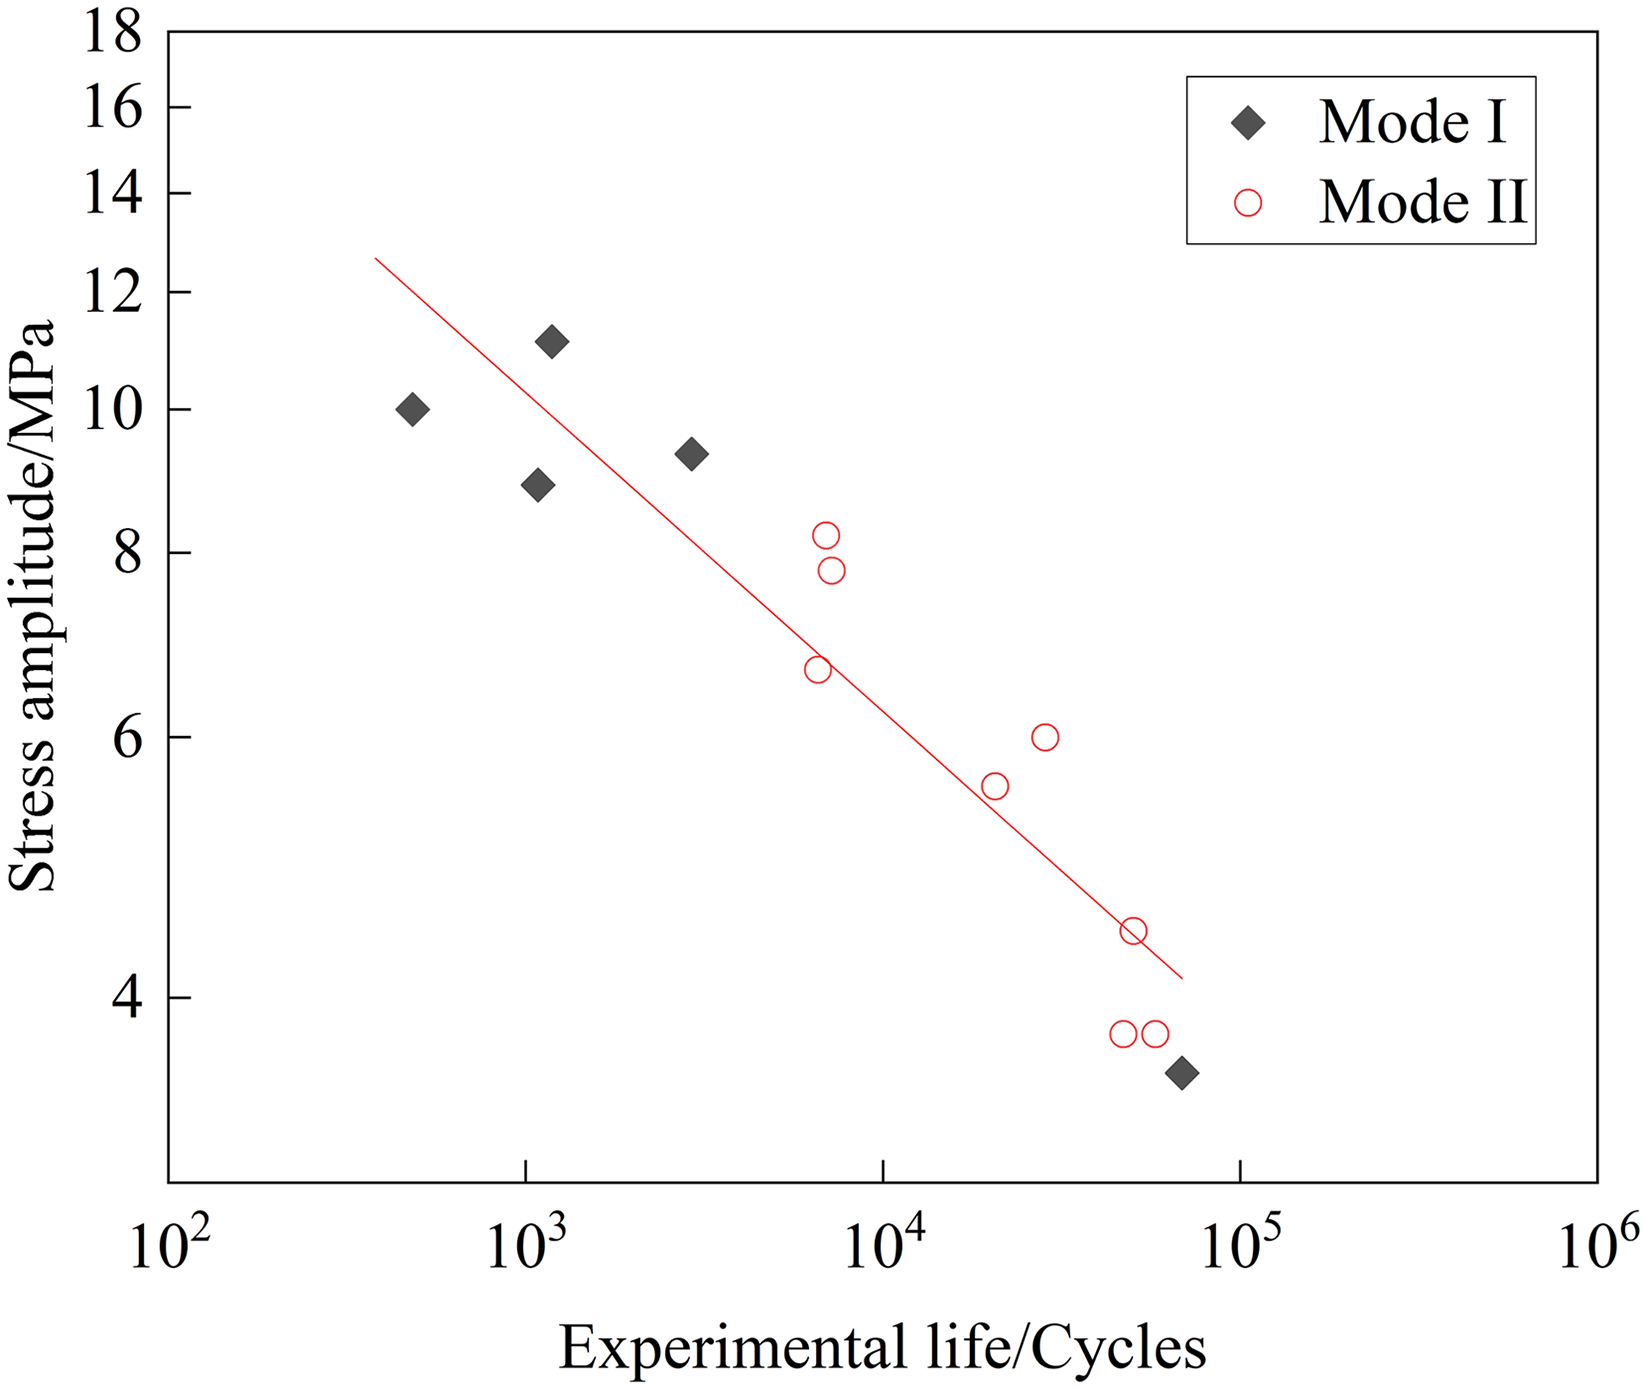
In this study, the stress amplitude range of 3 to 12 MPa was selected, which encompasses the typical service loads experienced by such joints in structures including automotive interior frames and body panels,
21
and enables the fatigue life from low-cycle fatigue (LCF) to high-cycle fatigue (HCF). Figure 5 presents the experimental nominal stress amplitude versus fatigue life under double logarithmic coordinates. Here stress is the ratio of loading applied to sheet cross section area. The data showed there is a good linear correlation between loading stress amplitude and fatigue life, and the fitted S-N curve equation is as Equation (1):
Experimental fatigue S-N curves of AZ31B/6061 FSLW joints.
Where: log denotes the logarithm to base 10, S is the nominal stress amplitude (MPa); N is the fatigue life (cycles).
Fatigue fracture surfaces observation
Figure 6 shows the fatigue fracture morphology on the magnesium plate for Specimen A1-04. It can be seen from the macroscopic fracture morphology in Figure 6(a) that, the fracture is generally flat, exhibiting the typical brittle fracture characteristics; the upper part of the fracture contains a mixed region of Hook defects and lack of fusion (LOF), with irregular wavy boundaries. Due to the low solubility of Mg and Al, insufficient plastic flow and mixing of interfacial materials during welding resulted in local unbonded areas. Multiple crack initiation sites are distributed in the fatigue source region, showing a radial pattern at 45°; there are two obvious tear ridges exist in the crack propagation region, indicating a high crack propagation rate.

Microscopic morphology of fatigue fracture surfaces (a) Macroscopic fracture morphology; (b) Propagation zone; (c) Secondary cracks and fatigue striations; (d) Final fracture zone.
Figure 6(b) presents the micro-morphology of the crack propagation region, where numerous secondary cracks, grooves, and dense reticular small facets are distributed. These microstructures severely disrupt the main crack propagation path, aggravate local plastic deformation, promote intergranular fracture, and thus reduce the fatigue crack propagation life. In Figure 6(c), more distinct secondary cracks and fatigue striations are observed, indicating unsteady crack propagation and local embrittlement of the material during loading. Figure 6(d) shows the final fracture region, where a small number of unevenly distributed dimples and broken secondary-phase particles are observed-indicating the specimen exhibits brittle fracture accompanied by local ductile deformation. Therefore, the fatigue fracture mode of the AZ31B/Al6061 joint is considered a brittle-ductile mixed fracture.
Finite element stress-strain analysis and fatigue life prediction
Fatigue life prediction based on the notch stress method
The notch stress method is an approach for fatigue life prediction that is based on the linear elasticity assumption, predicting fatigue life by analyzing the local stress state at the notch of welded structures. According to the IIW recommendations, 22 for welded structures with a plate thickness of 3 mm, a virtual arc radius of 0.05 mm is recommended for the notch radius; when linear elements are used, it is required that at least 40 elements along one circumference of the virtual arc.
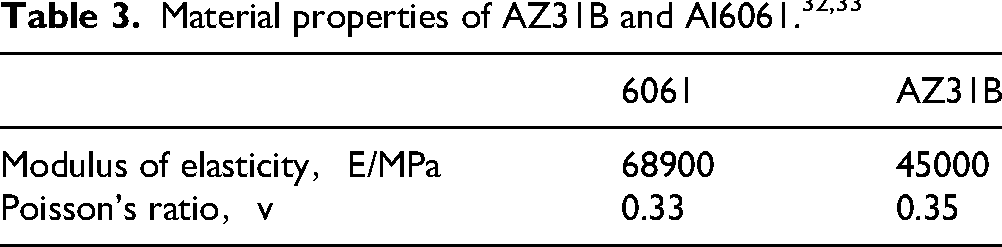
Finite element stress analysis models were established for all FSLW specimens using plane strain elements (CPE4). In each model, the hook defect height was taken as the arithmetic mean value of the measured heights of the corresponding specimens, and a uniform notch root radius of 0.05 mm was introduced at all notch tips. The model of specimen A1-04, shown in Figure 7, was typically discretized into 10812 nodes and 10140 elements. The same meshing criteria were then applied to all other specimens. As can be seen from Figure 4, the bonding interface of AZ31B/Al6061 was relatively clear; this boundary was retained during finite element modeling. Due to thermal cycles and severe plastic deformation during FSW process, the material properties in the weld zone are inherently complex. To simplify the analysis, the influence of the welding process on the material properties in the weld zone was ignored herein, and the material of each zone of the model was assumed to be homogeneous. The properties of the two materials are listed in Table 3. Full constraints was applied to one end of the model, and a load along the length direction was applied to the other end, with the remaining degrees of freedom constrained.
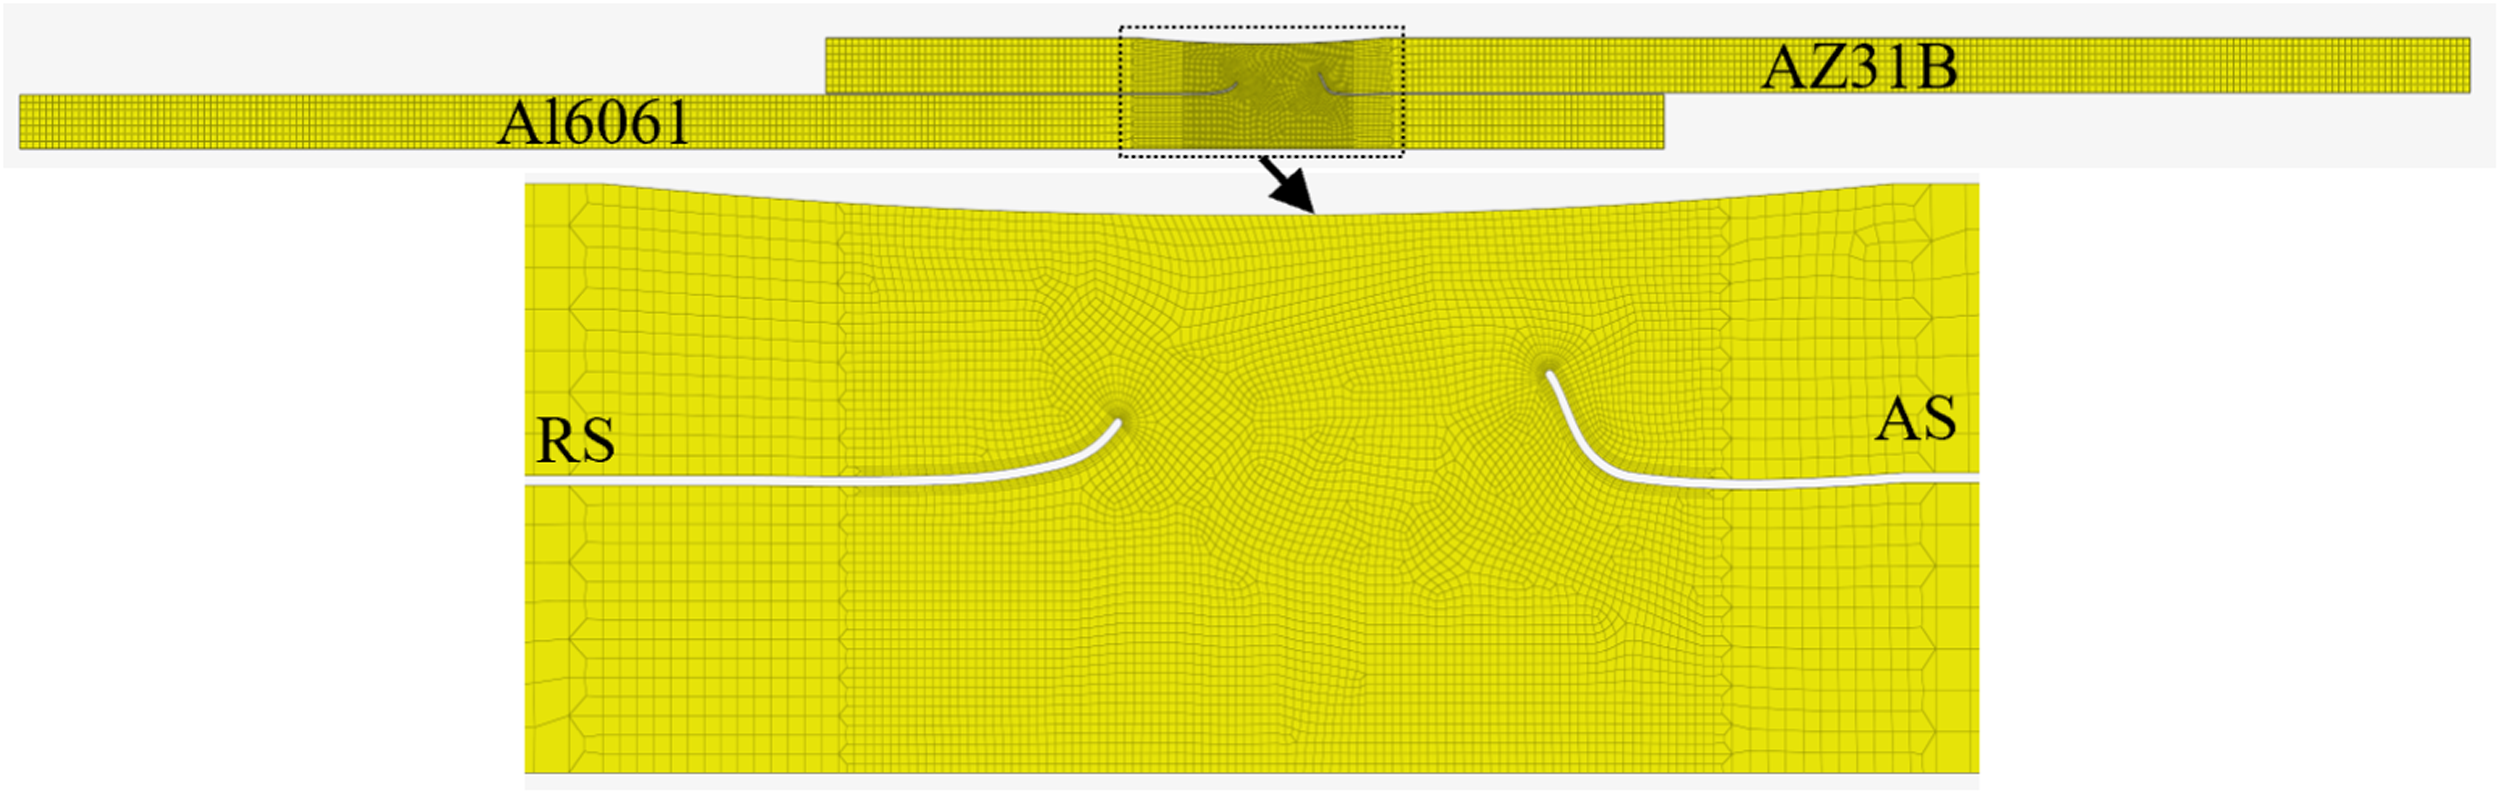
Notch stress model of specimen A1-04 (AS: Advancing Side; RS: Retreating Side).
Fatigue life prediction
The notch stress method uses a single standard S-N curve to evaluate the fatigue life of different types of joints. This curve is divided into two segments, with Nk = 107 cycles serving as the critical point distinguishing high-cycle and low-cycle fatigue life. The equation of the standard S-N curve is given in Equation (2)
23
: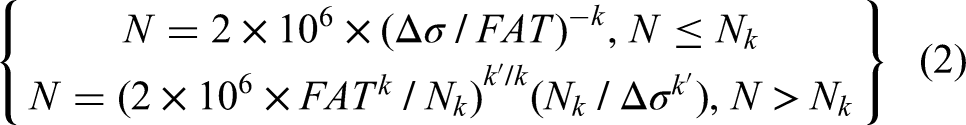
Where: N is the fatigue life (cycles); k and k’ are the slopes of the upper and lower parts of the curve, respectively; Δσ is the stress range (MPa); FAT is the fatigue class value. The FAT values corresponding to Mg and Al materials under different reference radii are listed in Table 4.
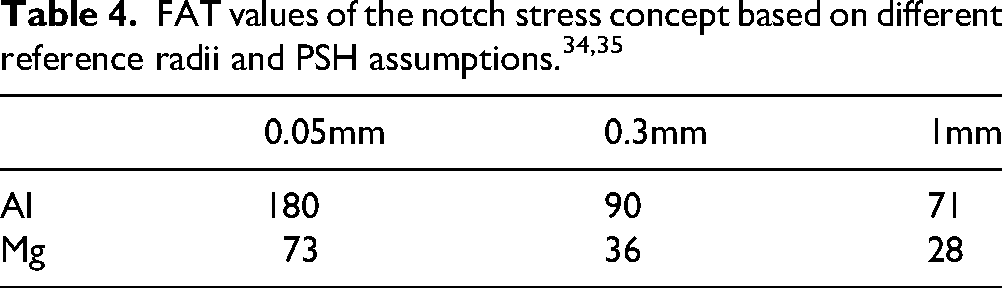
Figure 8 shows the maximum principal stress at notch root of Specimen A1–04. The maximum stress concentration is located at the root of the Hook defect on the AS of the magnesium alloy, which is consistent with the fact that both fracture modes of the actual specimens involve magnesium plate failure. The variation range of the maximum principal stress in the element with the highest stress at the stress concentration zone was extracted and substituted into Equation (2) to estimate the fatigue life. The comparison between the predicted life and the experimental fatigue life is shown in Figure 9. The prediction errors are basically within a factor of 3, indicating that the prediction results of this method are relatively accurate.
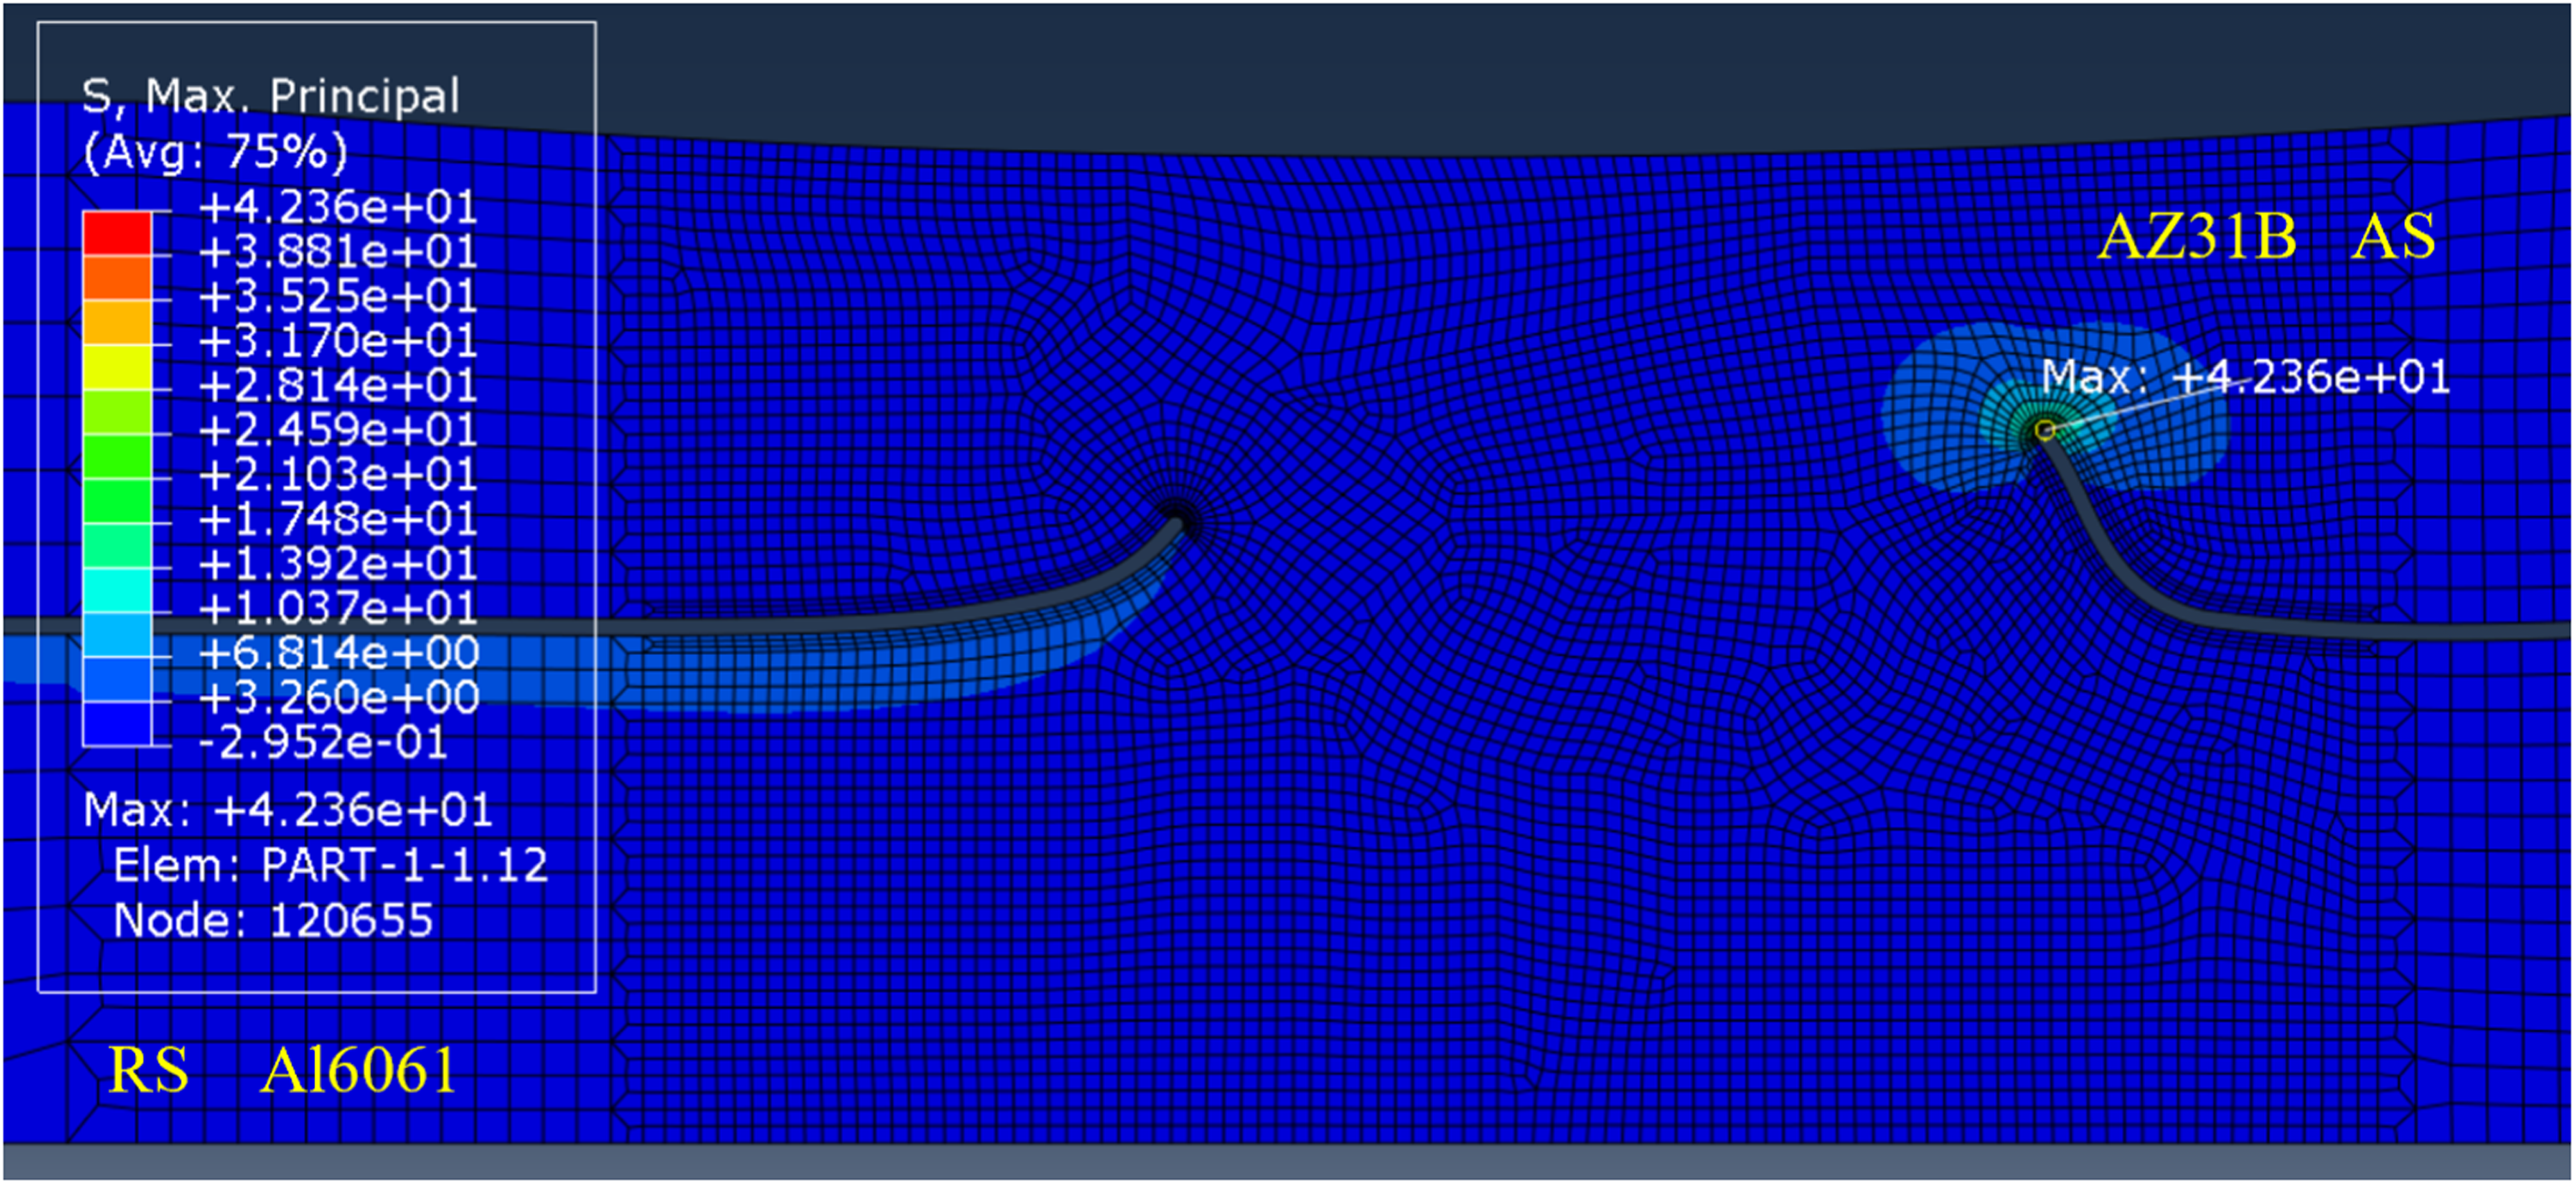
Maximum principal stress contour of specimen A1-04.
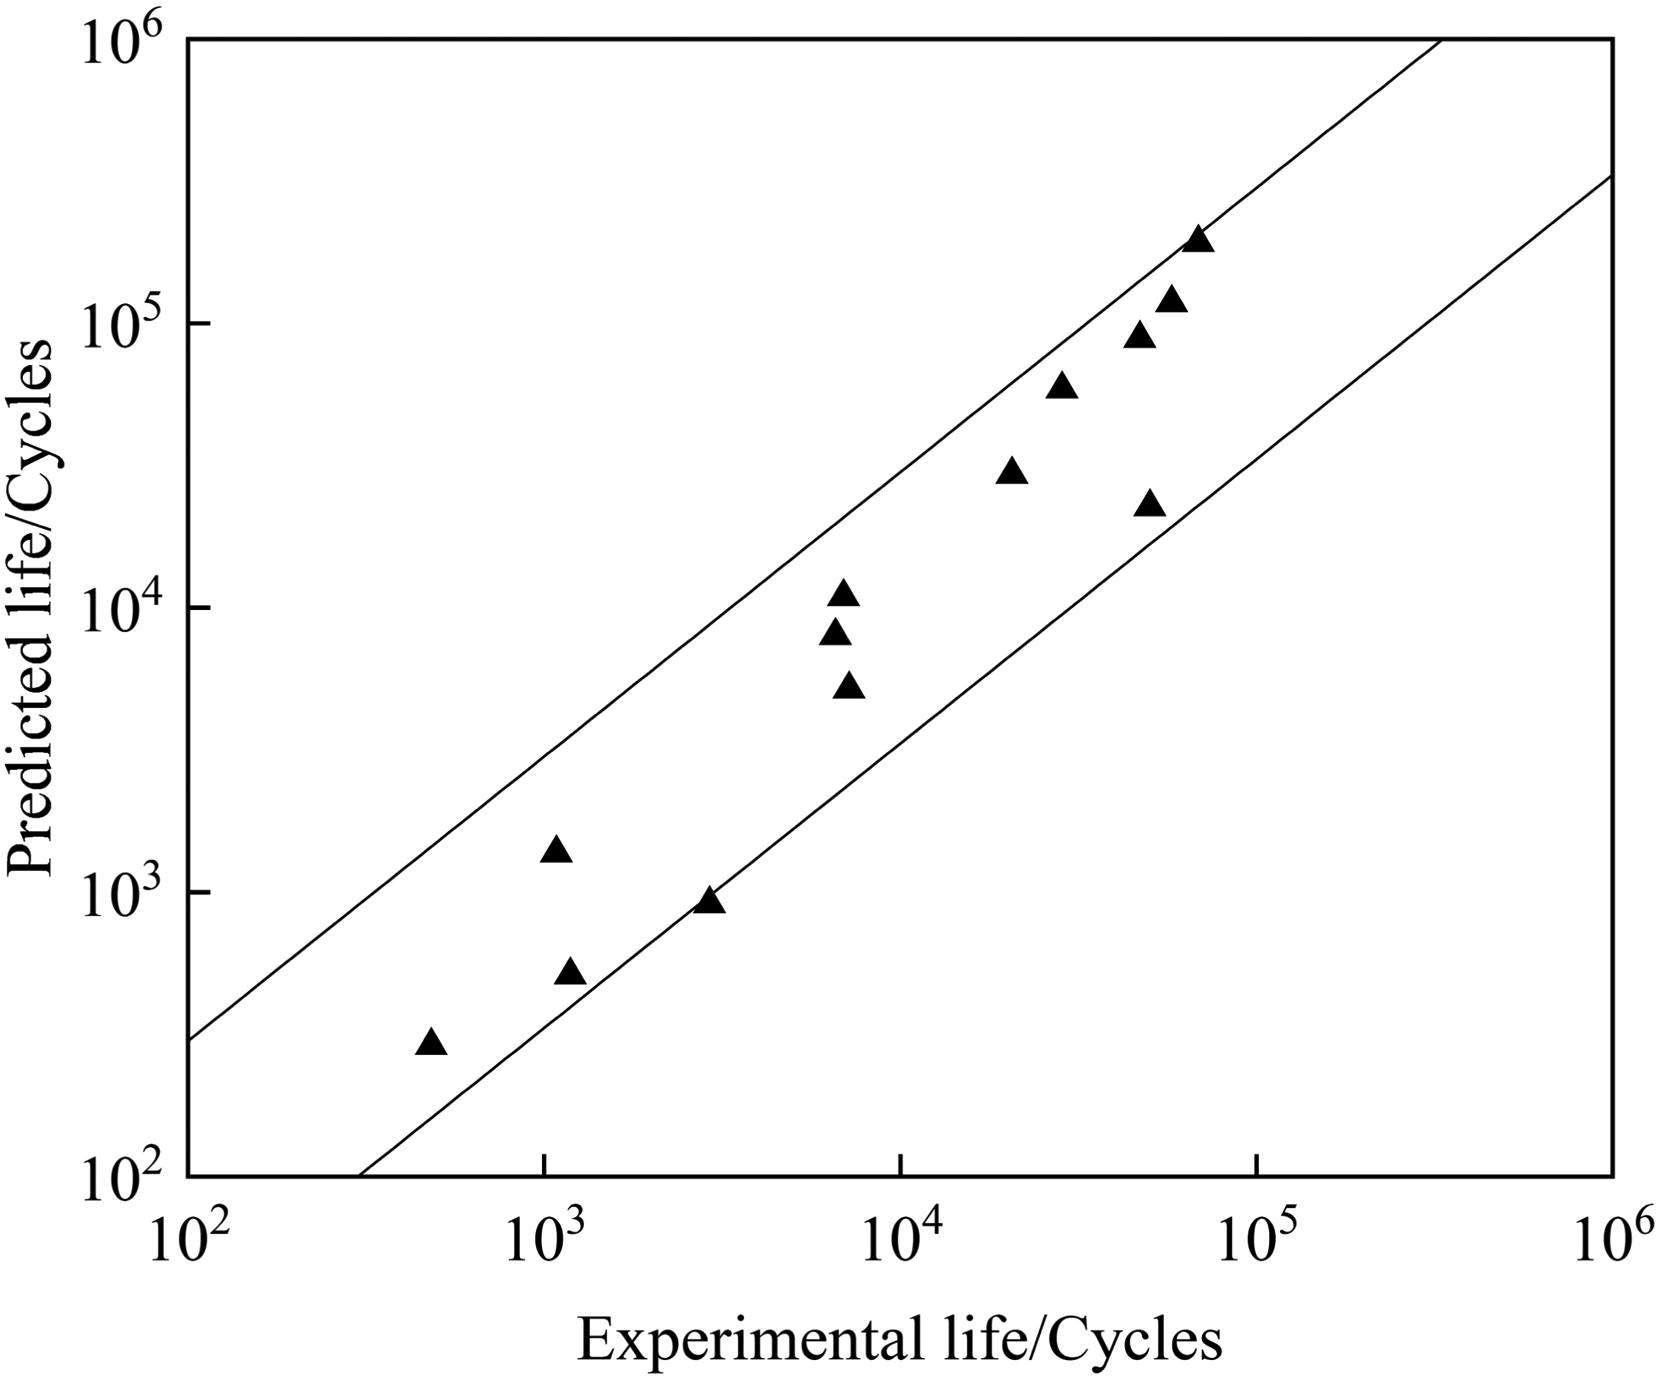
Fatigue life prediction results based on the notch stress method.
Fatigue life prediction based on the local stress-strain method
Plastic deformation of materials under cyclic loading is the fundamental cause of fatigue damage, and local plastic deformation provides conditions for the initiation and propagation of fatigue cracks. The local stress-strain method is a fatigue life prediction approach based on low-cycle fatigue and stress-strain analysis, which would enable accurate elastic-plastic analysis of weak locations (such as notches) in parts and components.
Finite element modeling and analysis
The modeling process is similar to that of the notch stress method described in Section 4.1.1. However, the local stress-strain method uses an average notch radius to establish the finite element model, which has been mentioned and applied in practical studies by Behravesh (0.1 mm)
24
and Pan (0.076 mm).
25
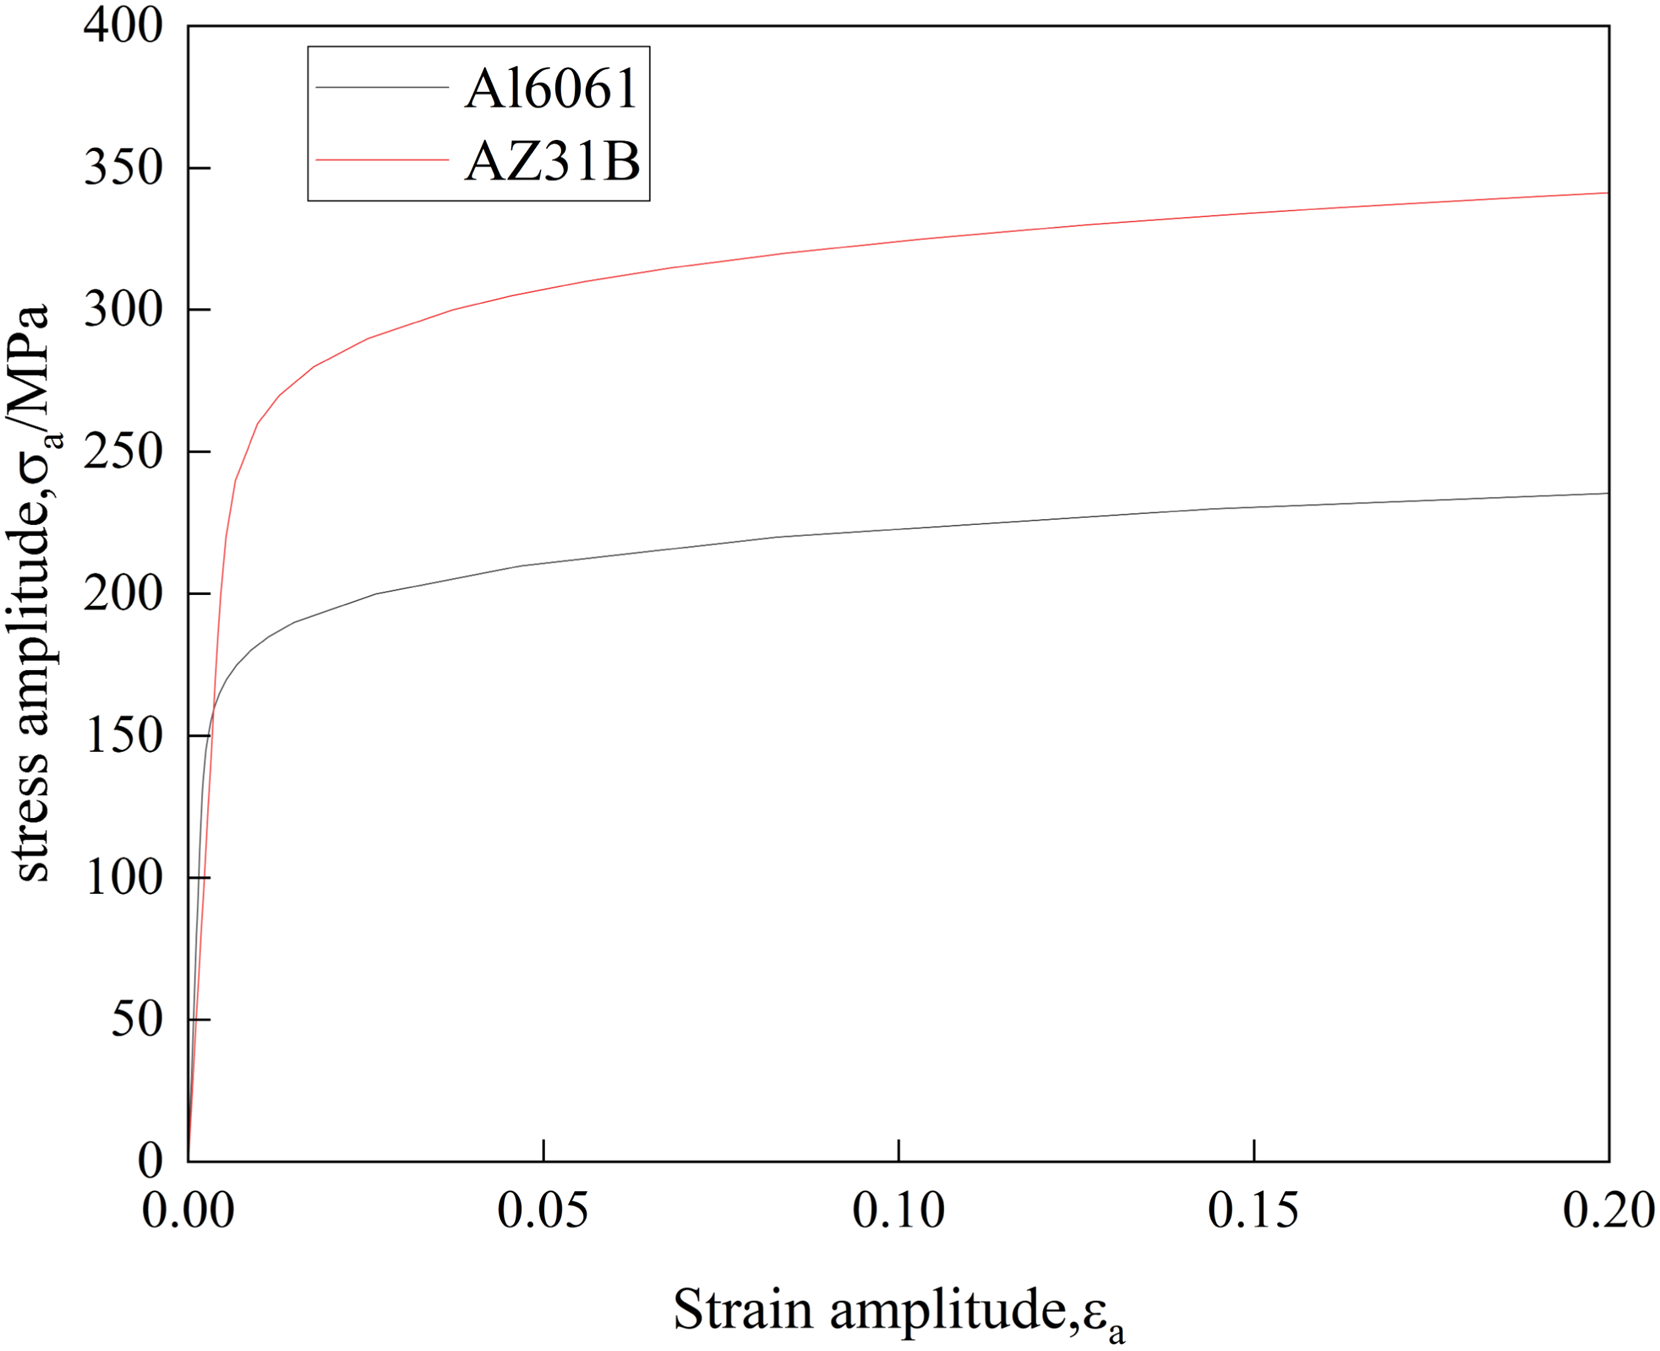
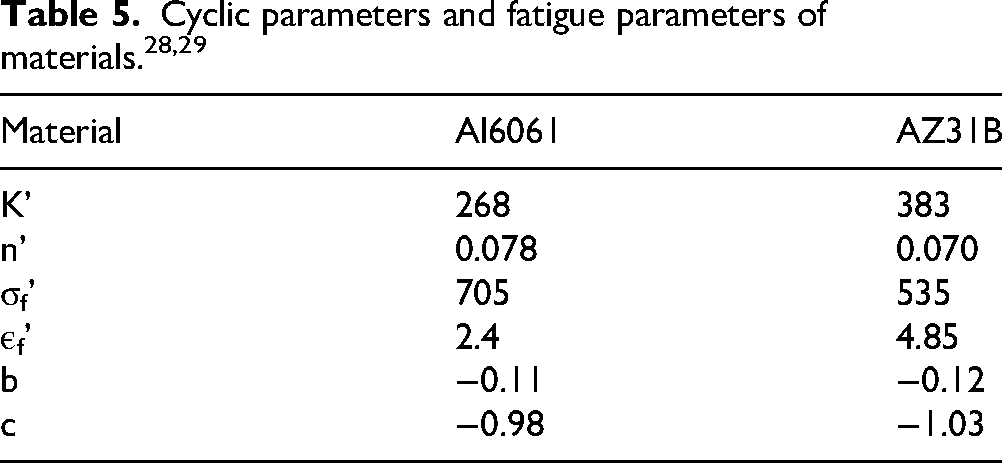
Measurement results in the current work indicate that the average notch diameter of FSW joints in Mg/Al dissimilar materials is approximately 0.05 mm. The finite element model and its details are shown in Figure 10, which consists of 14,577 CPE4 elements and 15,324 nodes. The cyclic stress-strain curves of the two materials (as shown in Figure 11) were obtained by combining the cyclic parameters of the two materials listed in Table 5 with the cyclic stress-strain expression (Equation 3). Baumgartner
26
pointed out that the residual stress in small-sized specimens is usually very low; therefore, the influence of residual stress was not considered in the finite element simulation.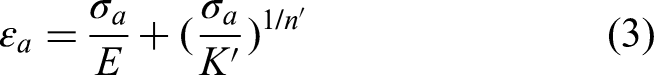
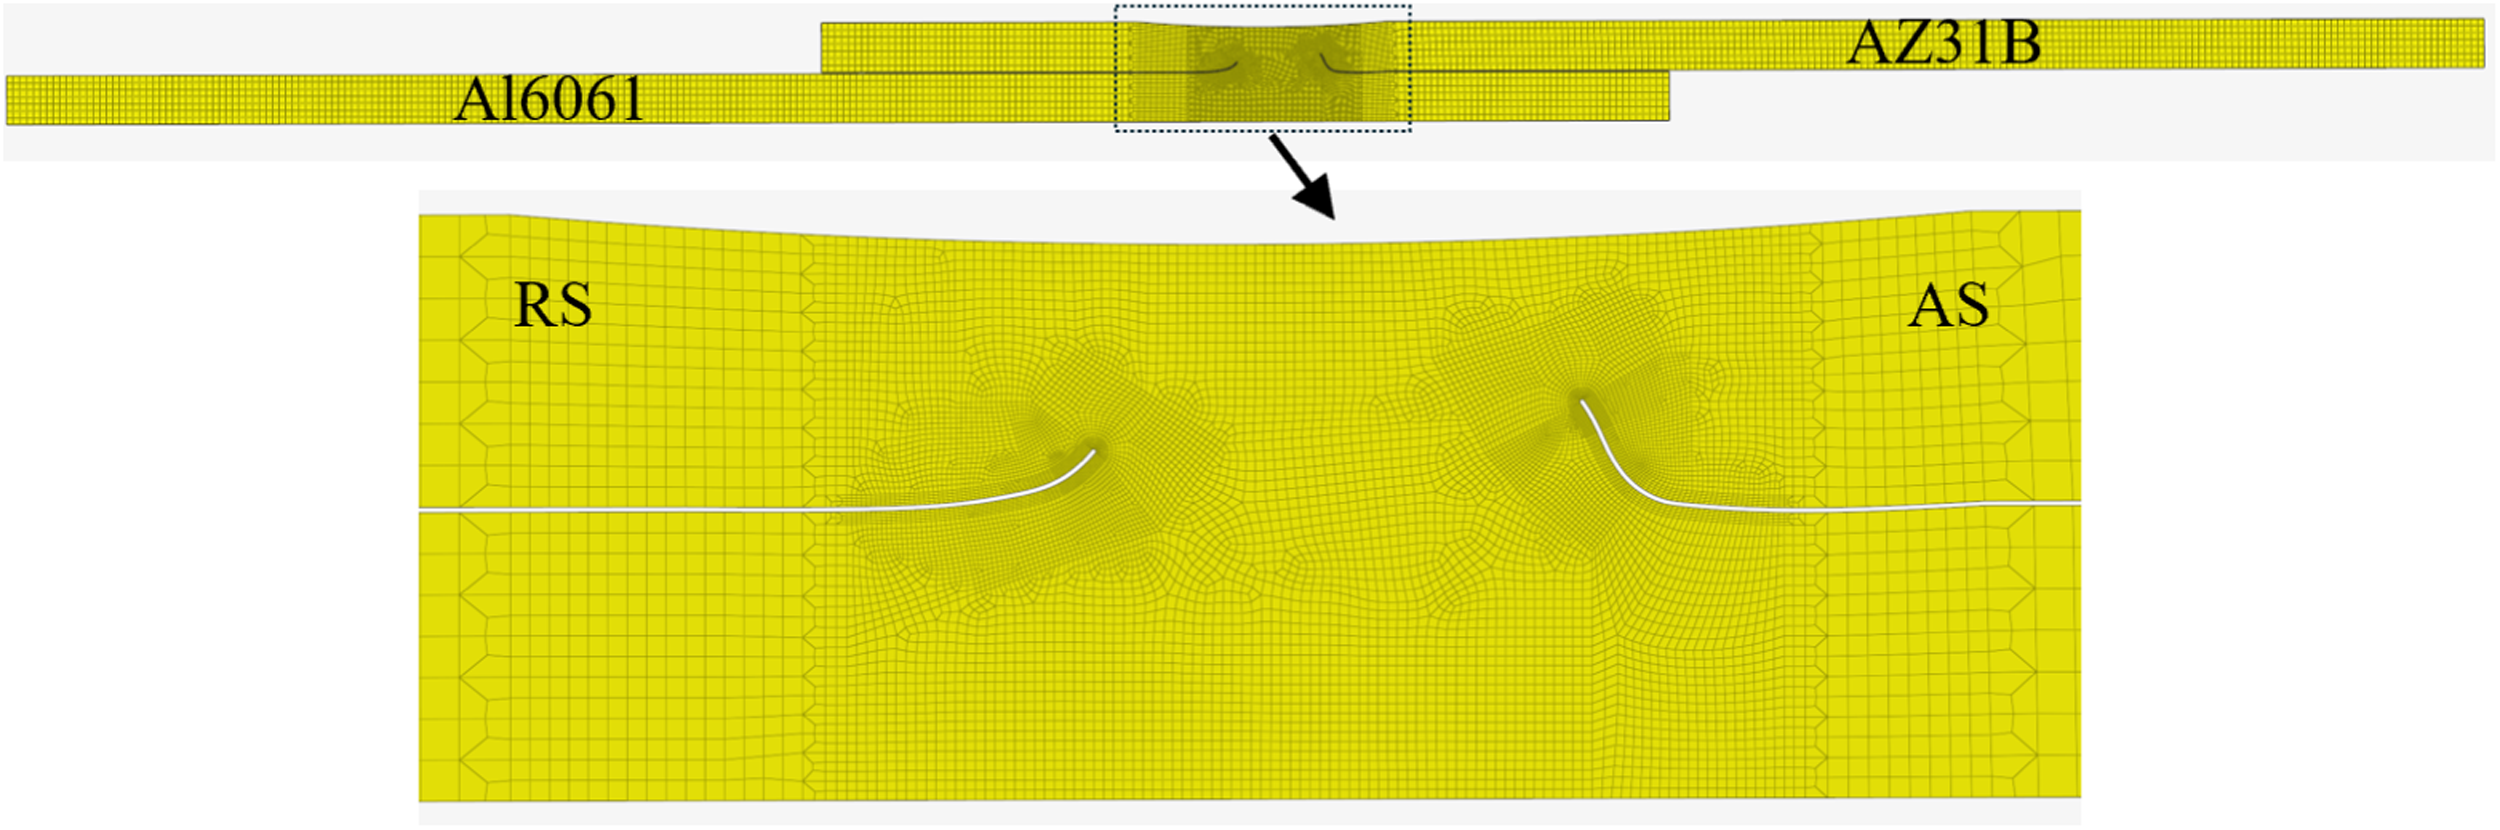
Mesh generation under the local stress-strain method (A1–04).
Where: εa is the strain amplitude; σa is the stress amplitude (MPa); E is the elastic modulus (MPa); K´ is the material cyclic strength coefficient (MPa); n´ is the cyclic strain hardening exponent.
Fatigue life prediction
The total fatigue life consists of two components: crack initiation life and crack propagation life. The local stress-strain method estimates the crack initiation life. Relevant literature indicates that the crack initiation life accounts for approximately 40% to 50% of the total fatigue life.
27
Therefore, in this study, 50% of the total fatigue life is adopted as the crack initiation life for predicting the life of FSLW welds, expressed as:
Where: N is the total fatigue life (cycles); Nm is the crack initiation life (cycles).
In this study, the Morrow-modified Manson-Coffin (MC) model (Equation 5) and the Smith-Watson-Topper (SWT) model (Equation 6) were employed for fatigue life prediction, and both models take the effect of mean stress into account.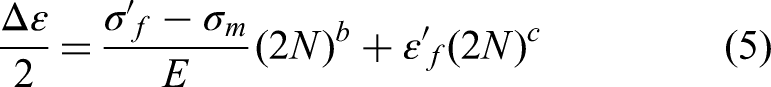
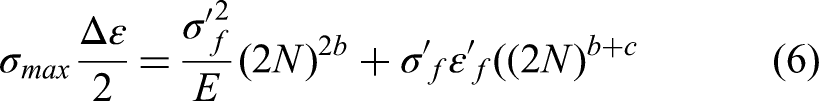
Where: Δε is the strain range; σm is the mean stress (MPa); σmax is the maximum stress (MPa); σf´ is the fatigue strength coefficient (MPa); εf´ is the fatigue ductility coefficient; b is the fatigue strength exponent; c is the fatigue ductility exponent.
Figure 12 shows the equivalent plastic strain (PEEQ) of the specimen under a maximum nominal stress of 30.44 MPa. The stress-strain results obtained from finite element calculations are then substituted into Equations (5) and (6) to calculate the crack initiation lives based on the MC and SWT damage models, respectively. The total fatigue lives are then estimated using Equation (4). Figure 13 showed the estimated total fatigue lives with the experimental fatigue lives. The results showed that the predicted lives of both models tend to be conservative with decreasing load level, and the discrepancy between the two models gradually increases. The errors of all predicted lives by the MC model fall within 3 factor, while some high-cycle predictions from the SWT model are excessively conservative, with multiple results lie below the lower bound of the 3 factor line. This indicates that the MC damage model is more suitable for analyzing the fatigue test data of the present Mg/Al welded joints.
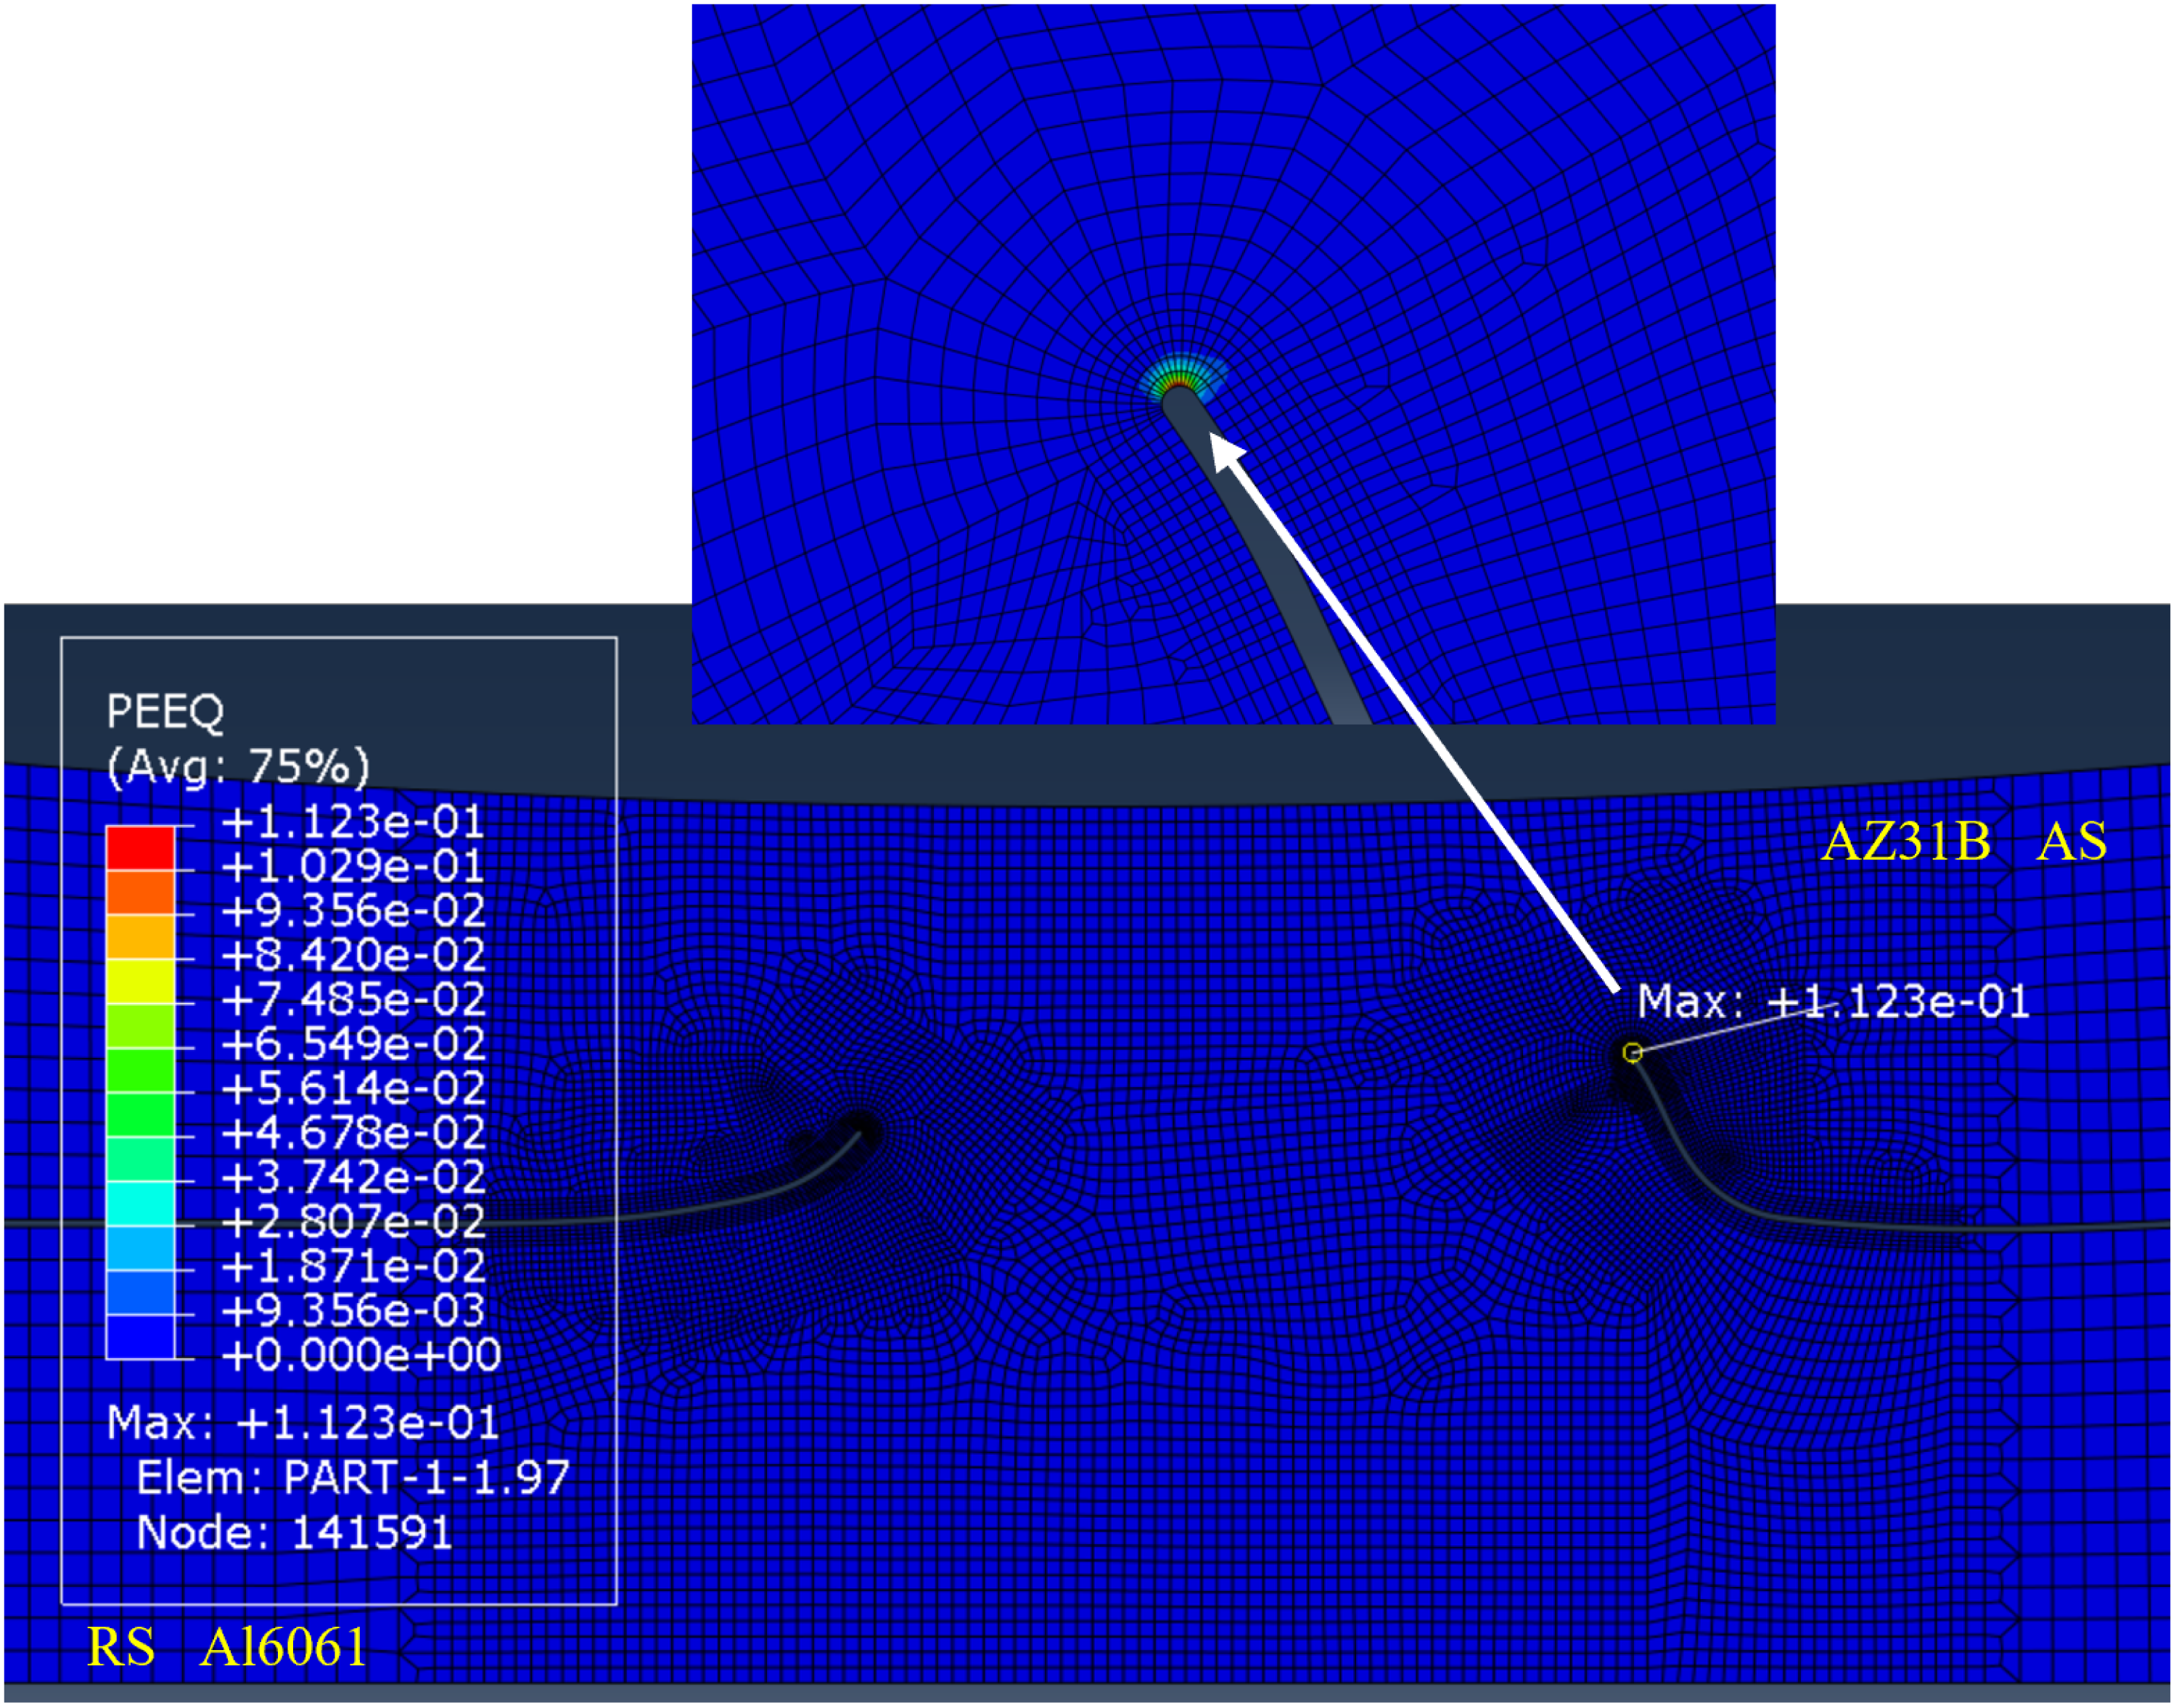
Contour plot of equivalent plastic strain for specimen A1–04.
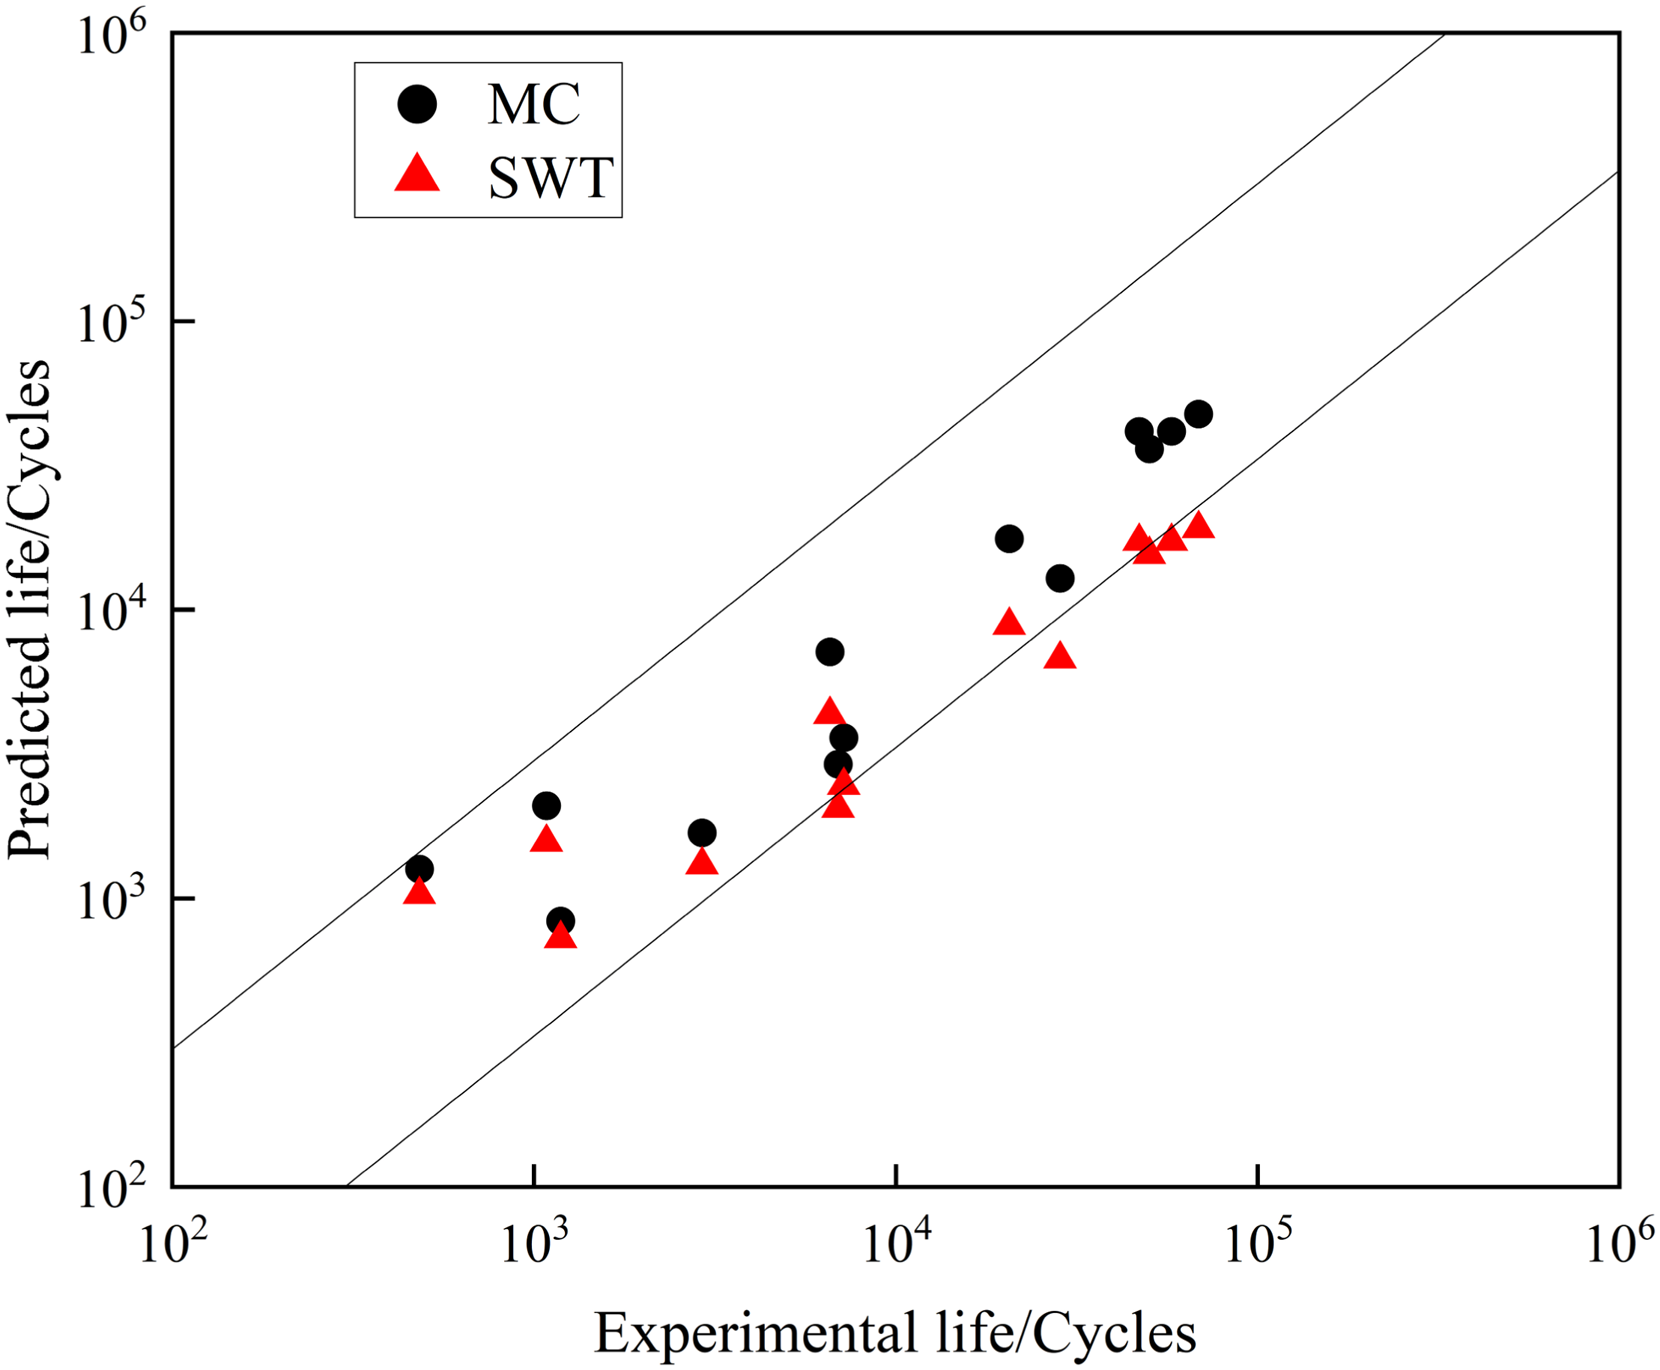
Comparison of estimated total fatigue lives based on mc and SWT models with experimental fatigue lives.
Discussion
Compared with the notch stress method, the local stress-strain method directly takes into account of the elasto-plastic behaviour of the material at the notch root. Especially under high stress levels, plastic strain relieves local stress concentration, resulting in a more uniform stress distribution across the structure. Both the SWT and the MC damage model aim to take into account of mean stress effects, but their underlying assumptions differ fundamentally: SWT focuses on stress-strain coupling under maximum load, while MC emphasizes reducing the material's effective fatigue strength by adjusting the effective stress level via mean stress. In HCF regime, local stress is typically below the yield strength, making local plastic deformation negligible (close to elastic deformation), and mean stress accounts for a larger proportion. Thus, the MC assumption-which directly takes into account the mean stress effect-is more suitable for HCF. In contrast, SWT's elasto-plastic coupling assumption is more sensitive to changes in stress amplitude (σa), amplifying its impact on prediction results; this leads to increasing discrepancies between the two methods’ predictions as experimental life extends.
Fatigue test results were analyzed in Section 3.3, where: under high stress levels, specimens primarily fractured at the magnesium sheet, while mixed fracture modes prevailed at medium-low stress levels. A distinct correlation exists between stress levels and fracture modes; thus, the local stress-strain method (MC) and notch stress method were applied to analyze fatigue results for different fracture modes, respectively-local stress-strain method for high stress (dominated by plastic damage) and notch stress method for low stress (dominated by stress concentration). The comparison between the predicted fatigue lives obtained by these two methods and the experimental fatigue lives is shown in Figure 14. For the 5 prediction results by the local stress-strain method (Mode I), 80% fall within the 2 factor lines. For the 8 prediction results by the notch stress method (Mode II), 75% lie within the 2 factor lines. Overall, for all 13 predictions, 76.9% are within the 2 factor lines, and 100% are within the 3 factor lines. This, to a certain extent, validates the correlation between stress level-dominant fatigue failure mechanism-fatigue fracture mode.
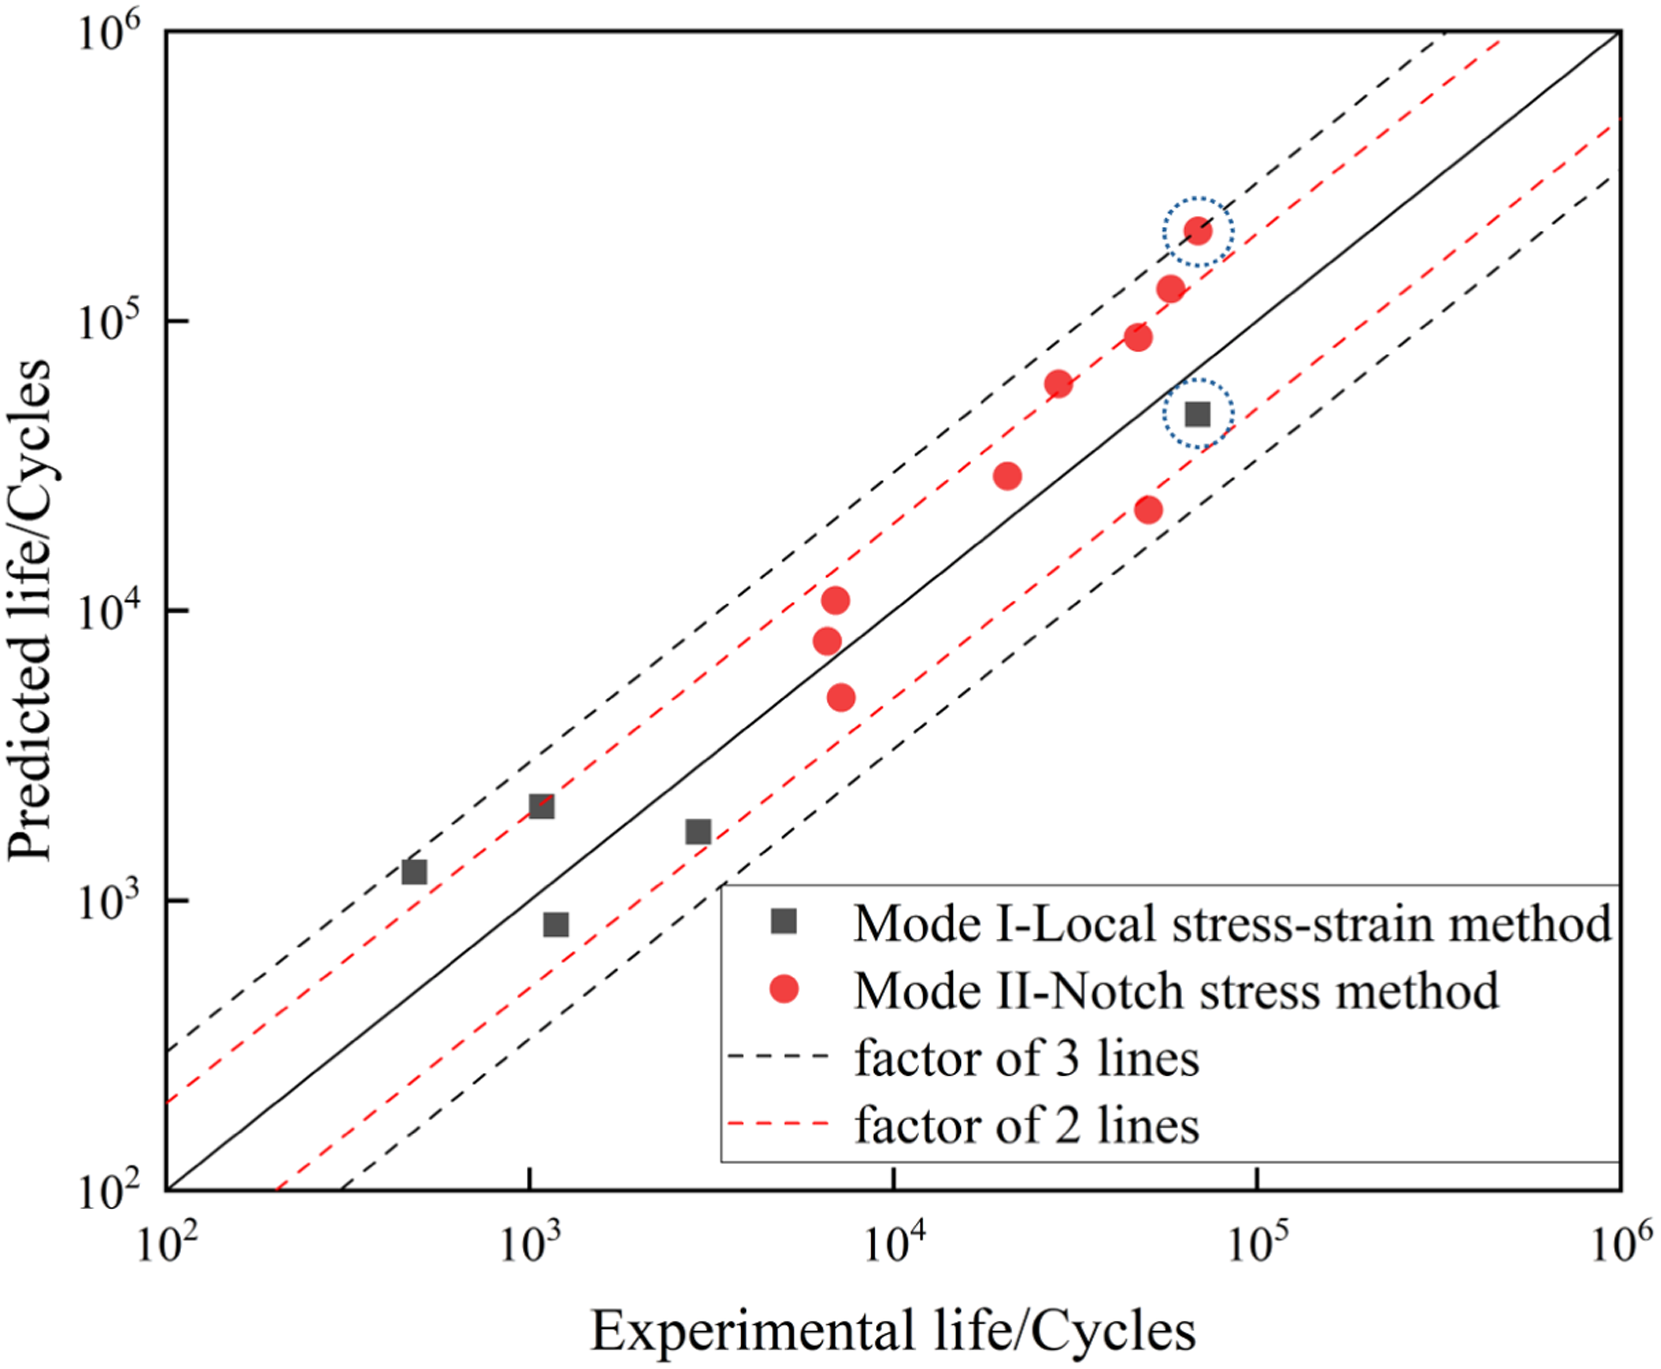
Fatigue life prediction results for different fracture modes.
It is noteworthy that, as shown in Figure 5, one specimen failed in Mode I fracture at approximately 105 cycles, corresponding to specimen A1-09 with the lowest nominal stress level. This specimen exhibited an identical fracture mode to those observed at high stress levels, and the local stress-strain method provided significantly higher prediction accuracy for its fatigue life than the notch stress method (the two data points marked with circles in Figure 14 represent the prediction results for specimen A1-09). Post-fracture analysis indicates that severe hook defects in local regions of the specimen disrupted the uniform stress distribution, resulting in a substantial discrepancy between the local actual stress and the nominal stress. At this low nominal stress level, the local actual stress at the defect tip may have exceeded the material's yield strength, reaching a local stress level comparable to that under high-stress conditions, thereby inducing the same damage mechanism as that occurring at high stress levels. Meanwhile, specimen A1-09 had the highest stress ratio (R = 0.724) in this test, which further intensified the local tensile damage effect at the defect tip under tension-tension cyclic loading and promoted the initiation and propagation of Mode I cracks. Since the local stress-strain method can accurately reflect the local stress-strain state induced by defects and matches well with the actual damage nature of this specimen, it yields more accurate fatigue life prediction results.
Conclusions
For the AZ31B/Al6061 FSW lap welded joints, the failure location of the joint varies with the loading levels. Furthermore, the faying surfaces at the Hook defect on the AS behave like a weak connection. Under relatively high stress levels, the weak connection at the Hook defect on the AS would open, and cracks would propagate along the thickness direction. Under relatively low stress levels, the weak connection would not open, and the bonding interface between the two plates becomes the main load-bearing area, leading to crack propagation along the lap interface.
When the notch stress method is used to evaluate the fatigue life of the specimens, the prediction errors all fall within the 3 factor lines, the prediction results of this method are relatively accurate.
In HCF regime, the MC model's assumption-where mean stress dominates fatigue failure-is insensitive to changes in stress amplitude (σa). In contrast, the SWT model's assumption is more sensitive to changes in σa, which amplifies its impact on prediction results (with some predictions being overly conservative). The MC model is more suitable for evaluating the current fatigue test data than the SWT model.
Footnotes
Author contribution(s)
Funding
This research was partially funded by the National Natural Science Foundation of China (Grant No. 51065012).
Declaration of conflicting interests
The authors declared no potential conflicts of interest with respect to the research, authorship, and/or publication of this article.