
Abstract
A novel carbon nanotube-added low-density steel, Fe56.75Mn25Al15Si2C0.25 + CNT1, was developed via mechanical alloying followed by spark plasma sintering. X-ray diffraction revealed predominant BCC phases (Fe1.90Mn0.10 and Mn0.90Al1.10) along with minor intermetallics (Fe10Si6 and Mn20C8) after milling and were retained after sintering, further, the phases simulated by CALPHAD are closely aligned with those observed by XRD. Electron microscopy confirmed the successful integration of multiwalled carbon nanotubes into the steel matrix. The Spark plasma sintered sample achieved a density of 5.83 g/cm3, significantly lower than conventional steel. Microhardness reached ∼11 GPa with an elastic modulus of 214 GPa and compressive strength is 1134 MPa, indicating superior mechanical performance. The strain hardening exponent n and strength coefficient K are calculated as 0.47 and 3354 MPa respectively.
Introduction
Third-generation low density steels have attracted significant attention in the automotive industry because the addition of aluminium reduces the density of steel while maintaining high strength and ductility. Optimizing steel design and processing will provide lighter steel alloys with retained quantitative mechanical properties, namely hardness, elastic modulus, strength, and ductility.1,2 This leads to an improved strength-to-weight ratio, enabling the design of lighter vehicle components without compromising structural performance, durability, or crash safety. Reduced vehicle weight has been a recent goal to reduce carbon dioxide emissions.2–7 A 10% reduction in vehicle weight is expected to enhance fuel economy by 7% and reduce carbon dioxide emissions by 20 kg per kilogram.8,9 Low-density steel10,11 may be a potential option for lightweight automobile materials.1,11–20 Even though steel has dominated the automotive industry since the 1920s, its weight percentage in typical light vehicles has been steadily declining from 68.1% to 60.1% during 1995 to 2011. 21
The overall reduction in vehicle weight and the corresponding improvement in fuel efficiency are primarily attributed to the increasing use of lightweight materials such as aluminium, magnesium alloys, and polymers in selected automotive components.21–26 However, despite the broad usage, steel remains vital for structural and safety-critical applications due to its superior strength, manufacturability and cost-effectiveness. Consequently, in recent years, advanced high-strength steels (AHSS) have increasingly replaced conventional steels in structural components due to significantly higher strength allowing the use of thinner sections (gauge reduction) while maintaining or improving mechanical performance.8,9 The strength is majorly contributed through the phase transformation, precipitation strengthening, and grain refinement, commonly described by the Hall-Petch relationship.26–31 However, conventional low-density steels often exhibit a reduced elastic modulus and limited hardness or strength compared with commercial AHSS grade. 15 Therefore, current research has focused on multiwall carbon nanotubesreinforced steel matrices 32 because of their unique features. These materials are substantially stronger than metal alloys or nanoparticle-reinforced ones. Beyond mechanical strength, multiwall carbon nanotubes added metal matrix improve thermal stability and corrosion resistance.33,34 Researchers have integrated multi-walled carbon nanotubes (MWCNTs) into magnesium, aluminium, copper, nickel, titanium, and tin matrices using different processing techniques to assure dispersion.32,35–37 The findings demonstrate the adaptability of multiwall carbon nanotubes added metal matrix as advanced materials, which balance strength, elastic modulus, and durability for demanding applications. 37
Metal matrix composites with multiwall carbon nanotubes are produced with diverse methods such stir casting, spark plasma sintering, mechanical alloying, and electrodeposition.31,32,35–37 Among them, mechanical alloying is a manufacturing technique that offers several advantages, including the capability to produce a diverse range of homogenous materials at room temperature. 38 This approach is particularly efficient in preventing phase segregation and the formation of uneven microstructures, which can affect the characteristics and performance of the material.29,30 Mechanical alloying is a process in which repetitive fracture and cold welding of the powder particles assures homogeneous elements distribution and promotes the production of stable fine grained microstructures, thereby increasing the mechanical and thermal characteristics of the final product.21,22,38–40
In view of these advantages, various researchers have studied alternative alloy compositions and production routes for the synthesis of lightweight steels with superior combinations of density reduction and mechanical performance. Song et al. 40 fabricated a lightweight steel with a chemical composition of Fe-0.8C-15Mn-7Al (wt.%) that was produced through vacuum-induction melting and reported a density of 7.04 g/cm3, which is a 10.5% decrease from pure iron. Frommeyer and Brux 41 made a light steel of Fe-xMn-yAl-zC. That comprises 18–28% manganese, 9–12% aluminium, and 0.7–1.2% C (all in mass%). These steels have a low density of 6.5 to 7 g/cm3, mechanical strength of 700 to 1100 MPa, and total elongations of 60%. 41 Rana et al. 23 showed that ferritic Fe-(6–9 wt.%)Al lightweight steels exhibit densities as low as 6.5–7.0 g/cm3, depending on aluminium content and phase constitution. Ma et al. 42 made Fe28Mn10AlC0.5Nb steel which has a density of 6.63 g/cm3, ultimate tensile strength of 1084 MPa, an elongation of 37.5%, and stacking fault energy (SFE) of 84 mJ/m2. In high-Mn alloys, the strengthening process is mainly regulated by deformation twinning (TWIP effect), dislocation interactions and solid solution strengthening, as documented in the literature.3,4,16
Sutou et al. 43 developed an Fe-20Mn-Al-C steel having the aluminium content between 10–14 wt.% and the carbon content from 0.25–1.8 wt.% resulting in a lower density range of 6.9 to 6.5 g/cm3 and hardness varying between 270 and 466 Hv. Composition of Fe-20Mn-11Al-1.8C-5Cr wt.% steel that have FCC single-phase, showed an excellent combination of high tensile strength (1250 MPa) and good ductility (40% elongation). 43 The incorporation of high carbon might adversely affect the ductility by facilitating the development of intergranular κ-carbide. 44 The high strength was mainly attributed to nano-scale κ-carbide precipitation and solid-solution strengthening by Al.16,44–46
Khaple et al. 9 showed that the ferritic Fe-Al steels with 6–9 wt% Al retain a disordered BCC ferritic structure, where strength is primarily improved through solid-solution strengthening while maintaining reasonable ductility. Higher Al contents promote short-range ordering or ordered DO3/B2 phases and κ-carbide precipitation, leading to reduced ductility and brittle fracture behavior.9,22,47 In contrast, austenitic Fe-Mn-Al-C steels exhibit fully austenitic microstructures and benefit from TWIP/TRIP mechanisms, resulting in very high strength and ductility.4,9,48 Duplex low-density steels show intermediate properties depending on the ferrite-austenite percentage. Fe-Al-based low-density steels achieve strength levels comparable to commercial Interstitial Free (IF) steel, High Strength Low Alloy (HSLA), and dual-phase steels while offering a 10–17% density reduction.4,9,23,48 Conventional processing routes involving induction melting, ingot casting, and hot rolling, make them promising for lightweight structural and automotive applications.9,19,49 Although significant progress has been made in the development of Fe-Mn-Al-C based low density steels via casting, thermo-mechanical processing and powder metallurgy approaches, the simultaneous achievement of substantial density reduction and outstanding mechanical performance is still hard.3,4 Additionally, there are few research examining the combined effect of mechanical alloying, spark plasma sintering and CNT reinforcement on the microstructural development and strengthening behavior of low density steels.3,4
Accordingly, the present research aims to address these limitations by developing MWCNT-added low-density Fe56.75Mn25Al15Si2C0.25 (wt.%) steel using mechanical alloying and followed by spark plasma sintering, emphasizing microstructural characteristics and phase evolution, density reduction, and mechanical performance.
Experimental procedure
Materials and method
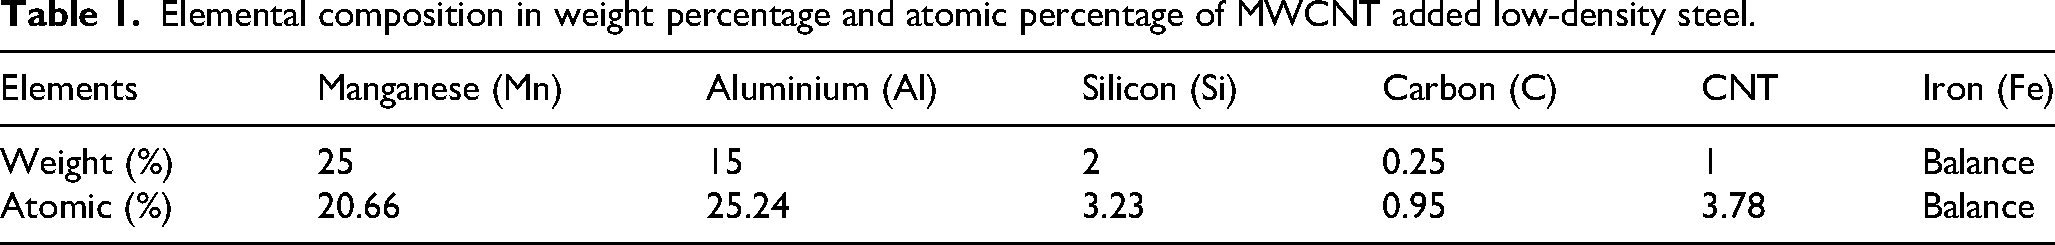
The chemical composition of multiwall carbon nanotube added Fe-Mn-Al-Si-C+CNT low-density steel is given in Table 1. For mechanical alloying, elements had particle sizes and purity levels as follows: Fe is approximately 200 mesh with a purity of at least 99.6%; Mn is approximately 325 mesh with 99% purity; and Al is approximately 325 mesh with 99% purity. Silicon has a particle size of approximately 200 mesh and a purity of 98.5%, while carbon has a particle size of approximately 50 mesh and a purity of 98%. The elemental powder of all elements was purchased from Sisco Research Laboratories Pvt. Ltd. Multiwall carbon nanotubes have a purity of >99% and possess lengths ranging from 5 to 10 µm, with diameters between 10 and 20 nm. Table 2 represents the physical properties of the materials used in consolidating the MWCNT-added low-density steel.
Elemental composition in weight percentage and atomic percentage of MWCNT added low-density steel.
Properties of various elements used in this work. 58
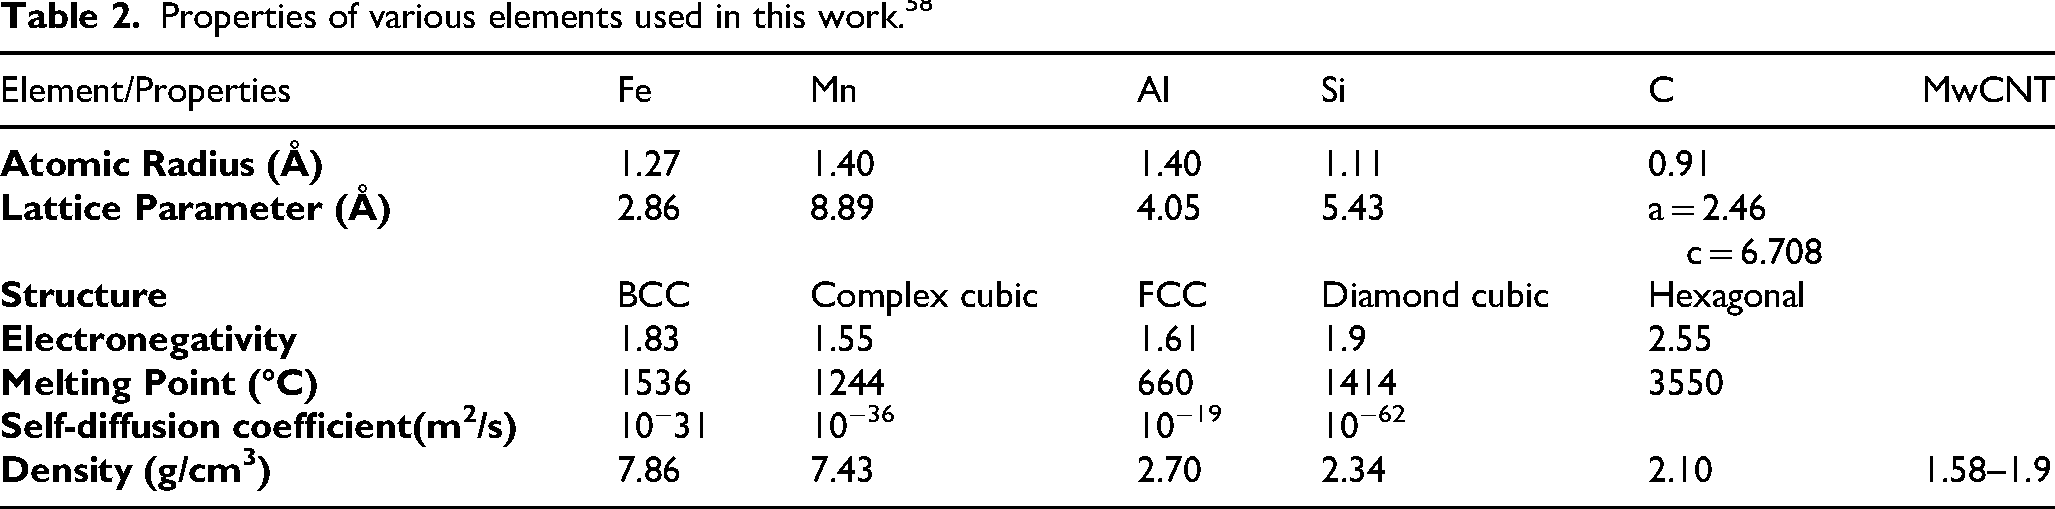
Figure 1 illustrates the fabrication of the MWCNT-added LDS, the powder was precisely measured by an electronic weighing balance (Shimadzu Corporation, Japan) having a minimum resolution of 0.1 mg. A total of 60 grams of the mixed metal powder was utilized in the proportions specified in Table 1. Tungsten carbide vials are subjected to mechanical milling using a planetary ball mill, model: Fritsch 2010. The milling operation was executed at 300 rpm, a ball-to-powder ratio was chosen as 10:1, and toluene was used as a process control agent. At the first step, the powders underwent a 10- min dry milling; after that, 2–3 grams of material were collected for characterization. The milling process was continued for up to 35 h, and 2–3 grams of powder were taken out at the intervals of 10 min, 5 h, 10 h, 20 h, 30 h, and 35 h for analysis. To control overheating and reduce wear, following each operating hour, milling was stopped for 20 min.
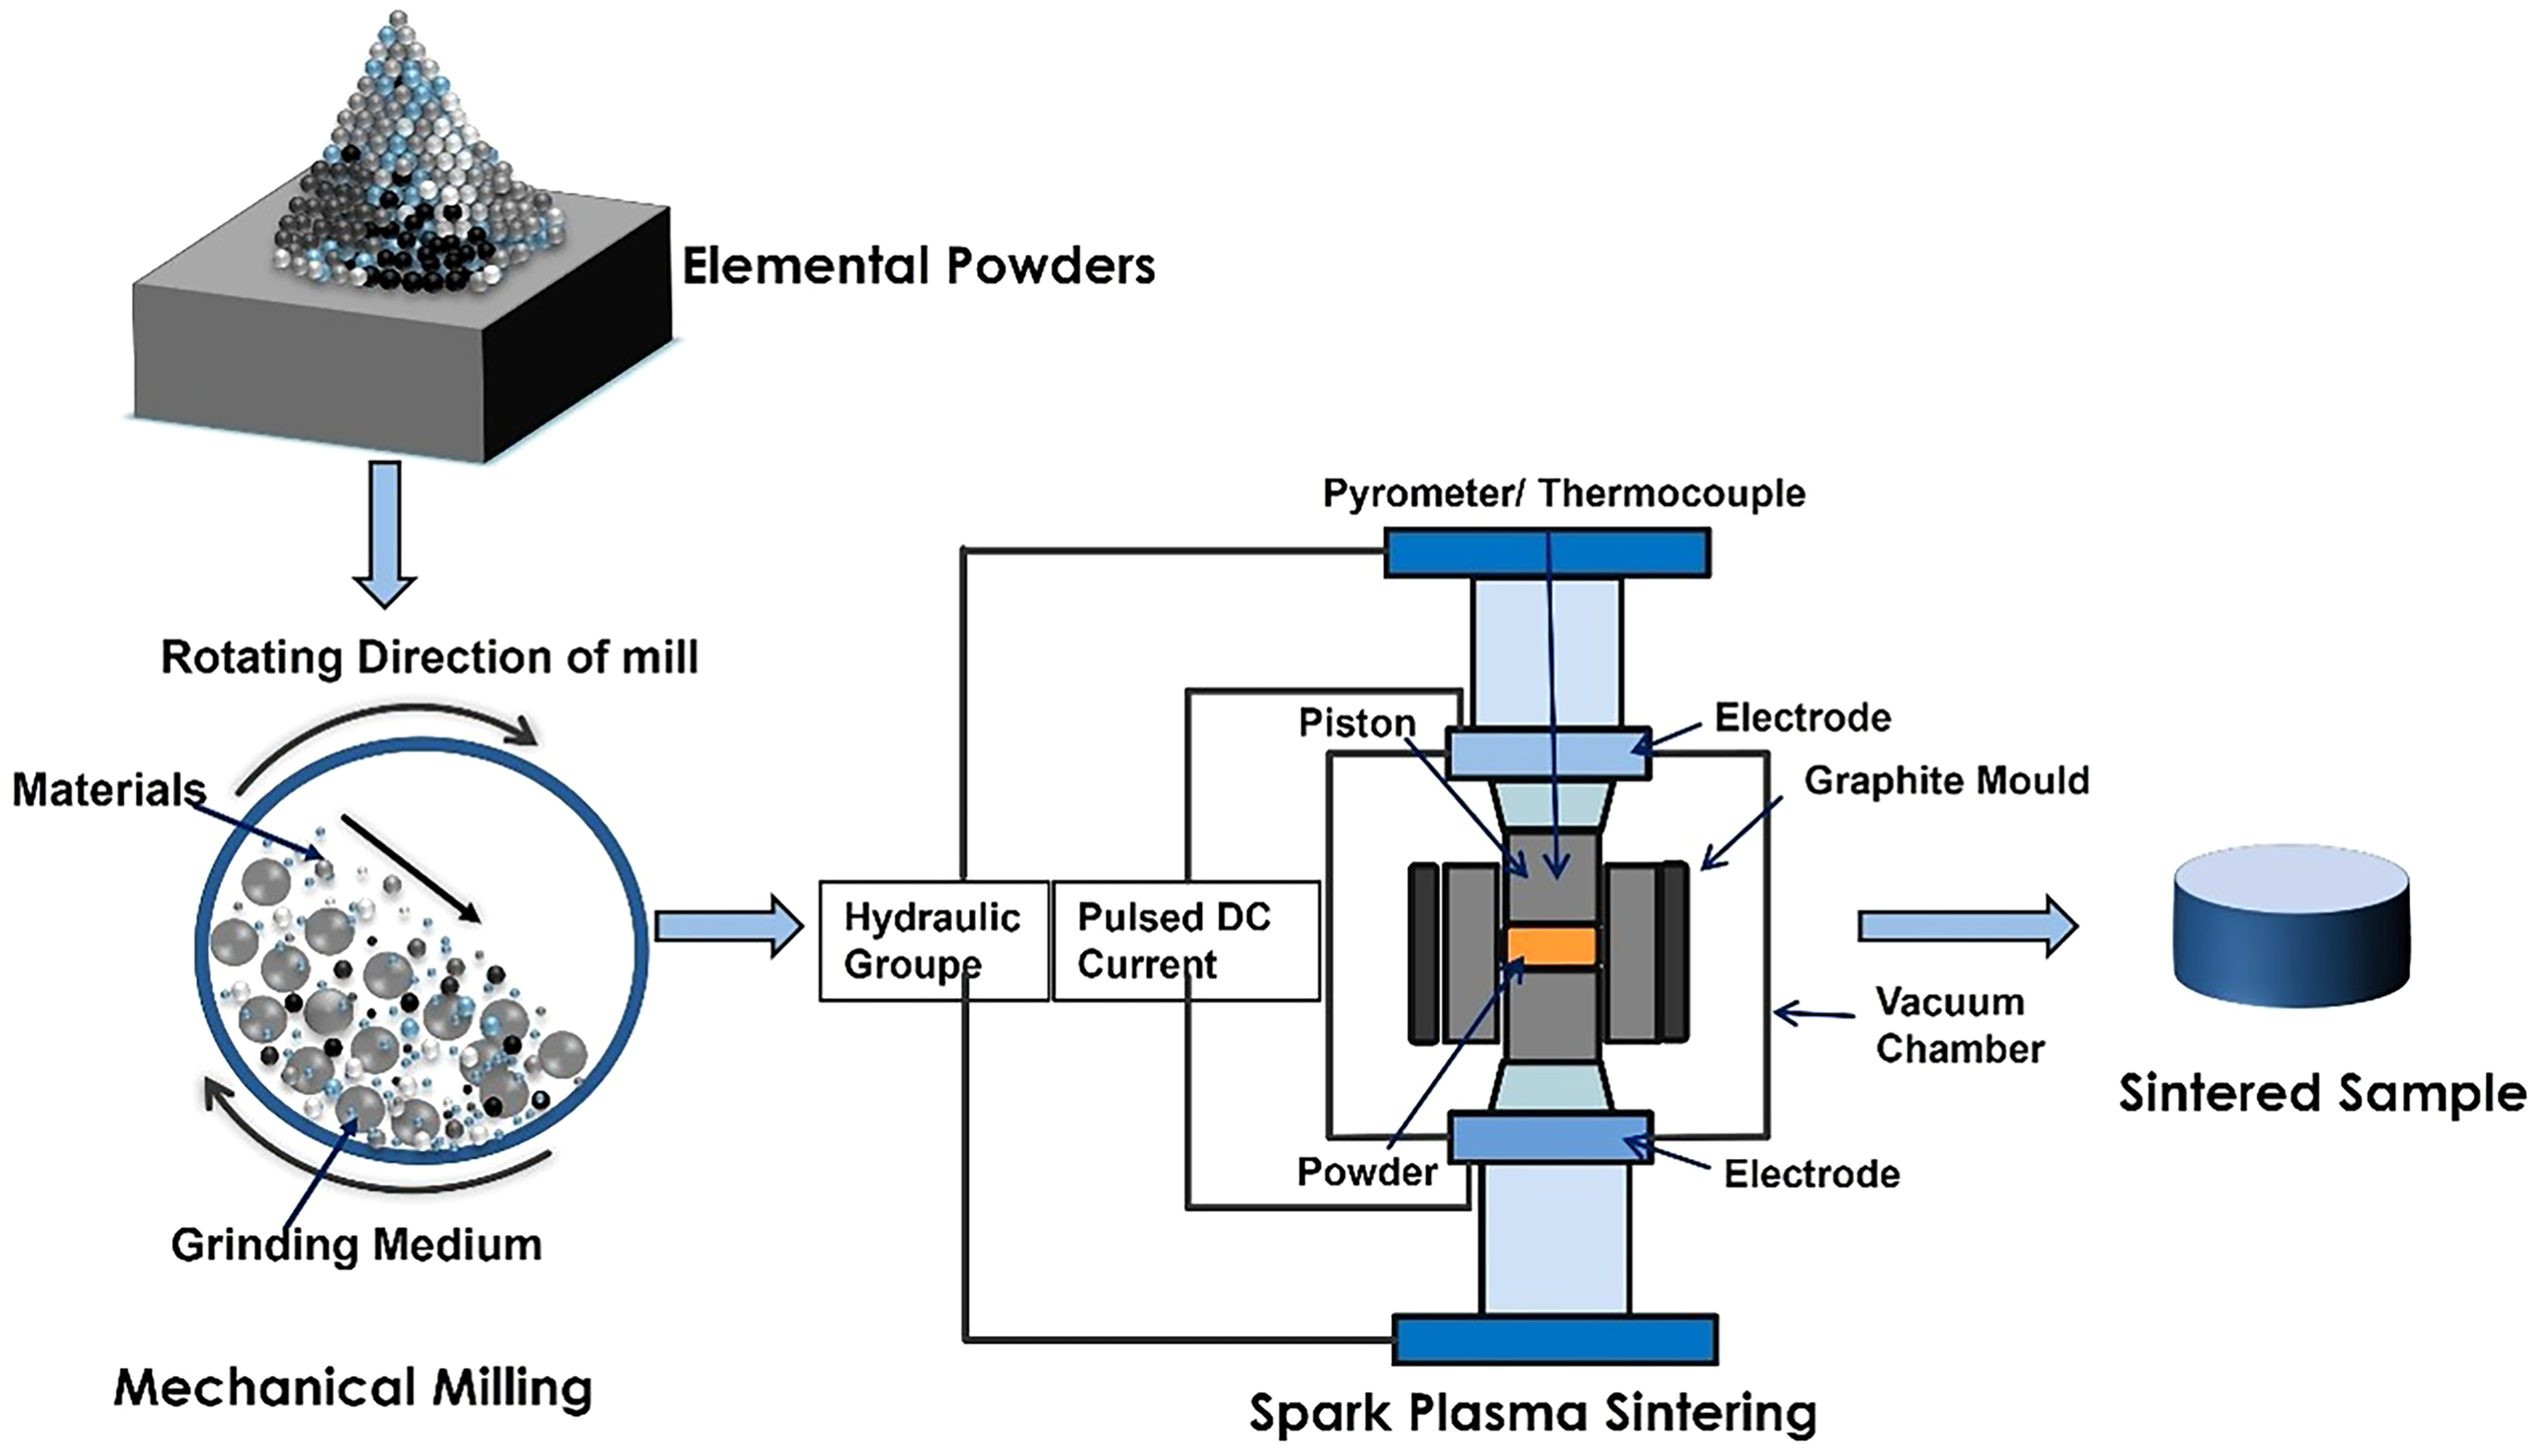
Schematic diagram of steps involved in fabrication of MWCNT added low-density steel.
After 35 h of milling, the powder was subjected to drying for two hours at 150°C and subsequently sintered at 900°C for 5 min under a pressure of 50 MPa and a heating rate of 100°C/ min, utilizing the spark plasma sintering technology (Dr Sinter SPS-625 Machine, Fuji Electronic Industrial Co. Ltd, Japan). The diameter and thickness of the sintered pellet were 13 mm and 6.5 mm, respectively. The sample was prepared by removing a 1 mm layer from the surface and polishing the pellet with silica gel (particle size 0.1 micron) and diamond paste (particle size 0.5–1 micron). The hardness of the MWCNT added low-density steel was then measured using these polished samples.
Characterizations
Phase and structural characterizations
Thermo-Calc simulations were performed using the metallic alloy composition Fe-Mn-Al-Si-C to predict phase stability under thermodynamic equilibrium conditions with accurate compositions. Multiwall carbon nanotubes were not included in the Thermo-Calc calculations because carbon nanotubes are non-equilibrium, discrete reinforcements.50, 51 It cannot be treated as thermodynamically soluble phases within Thermo-Calc databases. Multiwall carbon nanotubes are not natively modelled as a single inclusion entity in the TCFE8 database; their presence was accounted for by adjusting the carbon activity within the system. Their contribution is primarily mechanical and interfacial rather than thermodynamic.
Although CALPHAD analysis gives thermodynamic predictions on phase stability over a large temperature range, experimental validation of phase evolution during mechanical alloying is necessary for understanding the real microstructural development under non-equilibrium processing conditions. So, XRD analysis was performed for varied milling time to evaluate the phases evolution during mechanical alloying. X-ray diffraction analysis of the powder was carried out by a PANalytical Empyrean machine, employing a radiation of CuKα having a typical 0.154 nm wavelength. The data acquisition was at a 0.01° step size and a constant scan rate of 0.0016°/sec. Phase identification was performed with X'Pert HighScore. Key parameters of the milled powder sample, including crystallite size, lattice strain, and phase fraction, were calculated from the XRD pattern. Calphad modelling was also employed to predict the phases at various temperatures.
Microstructural characterizations
The gradual phase transition and crystallite refinement seen from XRD measurements are strongly correlated to the morphological evolution of the powder particles during the mechanical alloying. So, SEM analysis was performed to study the changes in the particle shape and particle size distribution with increasing milling time. To examine the surface morphology and microstructure of the sintered sample, mechanical polishing was carried out using emery papers followed by cloth polishing with alumina powder. Microstructural and elemental composition analysis of the sintered sample was conducted on FEI Quanta FEG450 (USA) equipment with a scanning electron microscope equipped with energy-dispersive spectroscopy (EDS). For transmission electron microscopy, a 35- h milled powder sample is ultrasonically dispersed in the ethanol to ensure a uniform suspension and minimize particle agglomeration. Drop casting on a copper grid is done and then dried with an infrared lamp to evaporate the solvent, leaving behind a thin layer of dispersed particles. The resulting specimen, once dried, is inserted into the JEOL JEM-F200 microscope for high-resolution imaging and microstructural analysis.
Physical properties
Density measurements were performed using a densitometer (CY224GT, ACZET PVT LTD), which is based on the Archimedes principle. 52 Eight measurements were taken and then averaged to determine the density of multiwall carbon nanotubes added low-density steel.
Mechanical properties
Besides the realization of large density reduction, the proposed low-density steel should also provide sufficient mechanical performance for the possible structural applications. Detailed mechanical characterization was thus carried out to assess the hardness, elastic modulus, compressive strength and strain hardening behavior of the SPS consolidated alloy. Microhardness was evaluated using an instrumented microhardness tester with a Berkovich tip at 1000 mN load, with each indentation having a dwell time of 10 s. At least five indentations were taken per sample, and an average hardness value was reported. The load versus displacement curve was plotted from the indentation data. The compression test was conducted using a universal testing machine in accordance with the ASTM E9 standard. Three specimens were prepared from the sintered pallets using precision cutting and surface grinding. The samples were machined into rectangular specimens with a gauge length of 9 mm and a cross-sectional area of 3 × 3 mm2. The strain rate was 1 mm/min in the compression testing.
Thermal analysis
Thermal stability is determined by thermogravimetric analysis (TGA) of the milled powder, which was conducted using an STA 2500 Regulus NETZSCH instrument, featuring an ultra-micro weighing balance with an accuracy of 0.03 µg and a weighing capacity of ±250 mg. The analysis utilized an alumina crucible (85 µL) with approximately 5.6 mg of sample. An inert environment was maintained by continuously purging the argon gas throughout TGA with a flow rate of 250.0 mL/min.
Results and discussions
Phase analysis
The phase diagram of the MWCNT-added Fe-Mn-Al-Si-C steel is shown in Figure 2 and demonstrates how temperature affects phase evolution. The limitations of the CALPHAD database likely cause the differences between the predicted and experimental outcomes, which in this study relied on the older TCFE8 database. The existence of room temperature phases at 40–50°C is clearly visible from the phase diagram, and the phases that exist are majorly BCC_A2 and BCC_A2#2 and minor M3Si and M23C6 phases. At temperatures approximately 300°C, the MWCNT added steel predominantly consists of BCC_A2 and BCC_A2#2, with minorly M3Si, M7C3 phases. As the temperature increases above 300°C, the BCC_A2#2 phase starts to diminish, while the BCC_A2 phase becomes more stable, reaching nearly 100% molar fraction up to nearly 1330°C. The stability of the BCC_A2 phase over a wide temperature range indicates its suitability as the primary structural phase within this LDS. Around 1200°C, the BCC_A2 phase begins to decrease as the alloy starts transitioning to a liquid state. The formation of the liquid phase becomes dominant above 1300°C, indicating the melting point of the alloy. Simultaneously, the BCC_A2 phase declines rapidly as it transitions into the liquid phase. Minor phases such as M3Si and M23C6, indicating the formation of intermetallic compounds that can influence the MWCNT-added steel hardness and wear resistance. The addition of multiwall carbon nanotubes (MWCNTs) significantly modifies phase stability by creating high-energy interfaces that act as heterogeneous nucleation sites, thereby lowering the activation energy for secondary phase formation. 34 Although CALPHAD predicts bulk equilibrium phases, the localized high carbon activity at multiwall carbon nanotube-matrix interfaces promotes the uphill diffusion of silicon and manganese, leading to the formation of silicides observed in XRD (Figure 3). Furthermore, the Zener pinning effect of MWCNTs and the rapid cooling during spark plasma sintering kinetically stabilize the BCC_A2 phase by suppressing long-range diffusion and intermetallic precipitation.50,53 Minor silicide and carbide phases appear due to locally increased chemical potential at CNT interfaces, consistent with reported interfacial reaction mechanisms in CNT-reinforced alloys. The BCC_A2 phase remains dominant over a wide temperature range, while the formation of intermetallic compounds and the liquid phase at higher temperatures highlight critical changes in phase composition that affect the alloy properties during thermal processing. Table 3 outlines the phases and their compositions within the low-density Fe-Mn-Al-Si-C+CNT steel. The phase fraction was calculated from the phase diagram data points (volume fraction versus temperature) obtained from the Thermo Calc software. According to the phase diagram at room temperature, the LDS primarily exhibits a BCC phase with a minor presence of carbides and silicide.
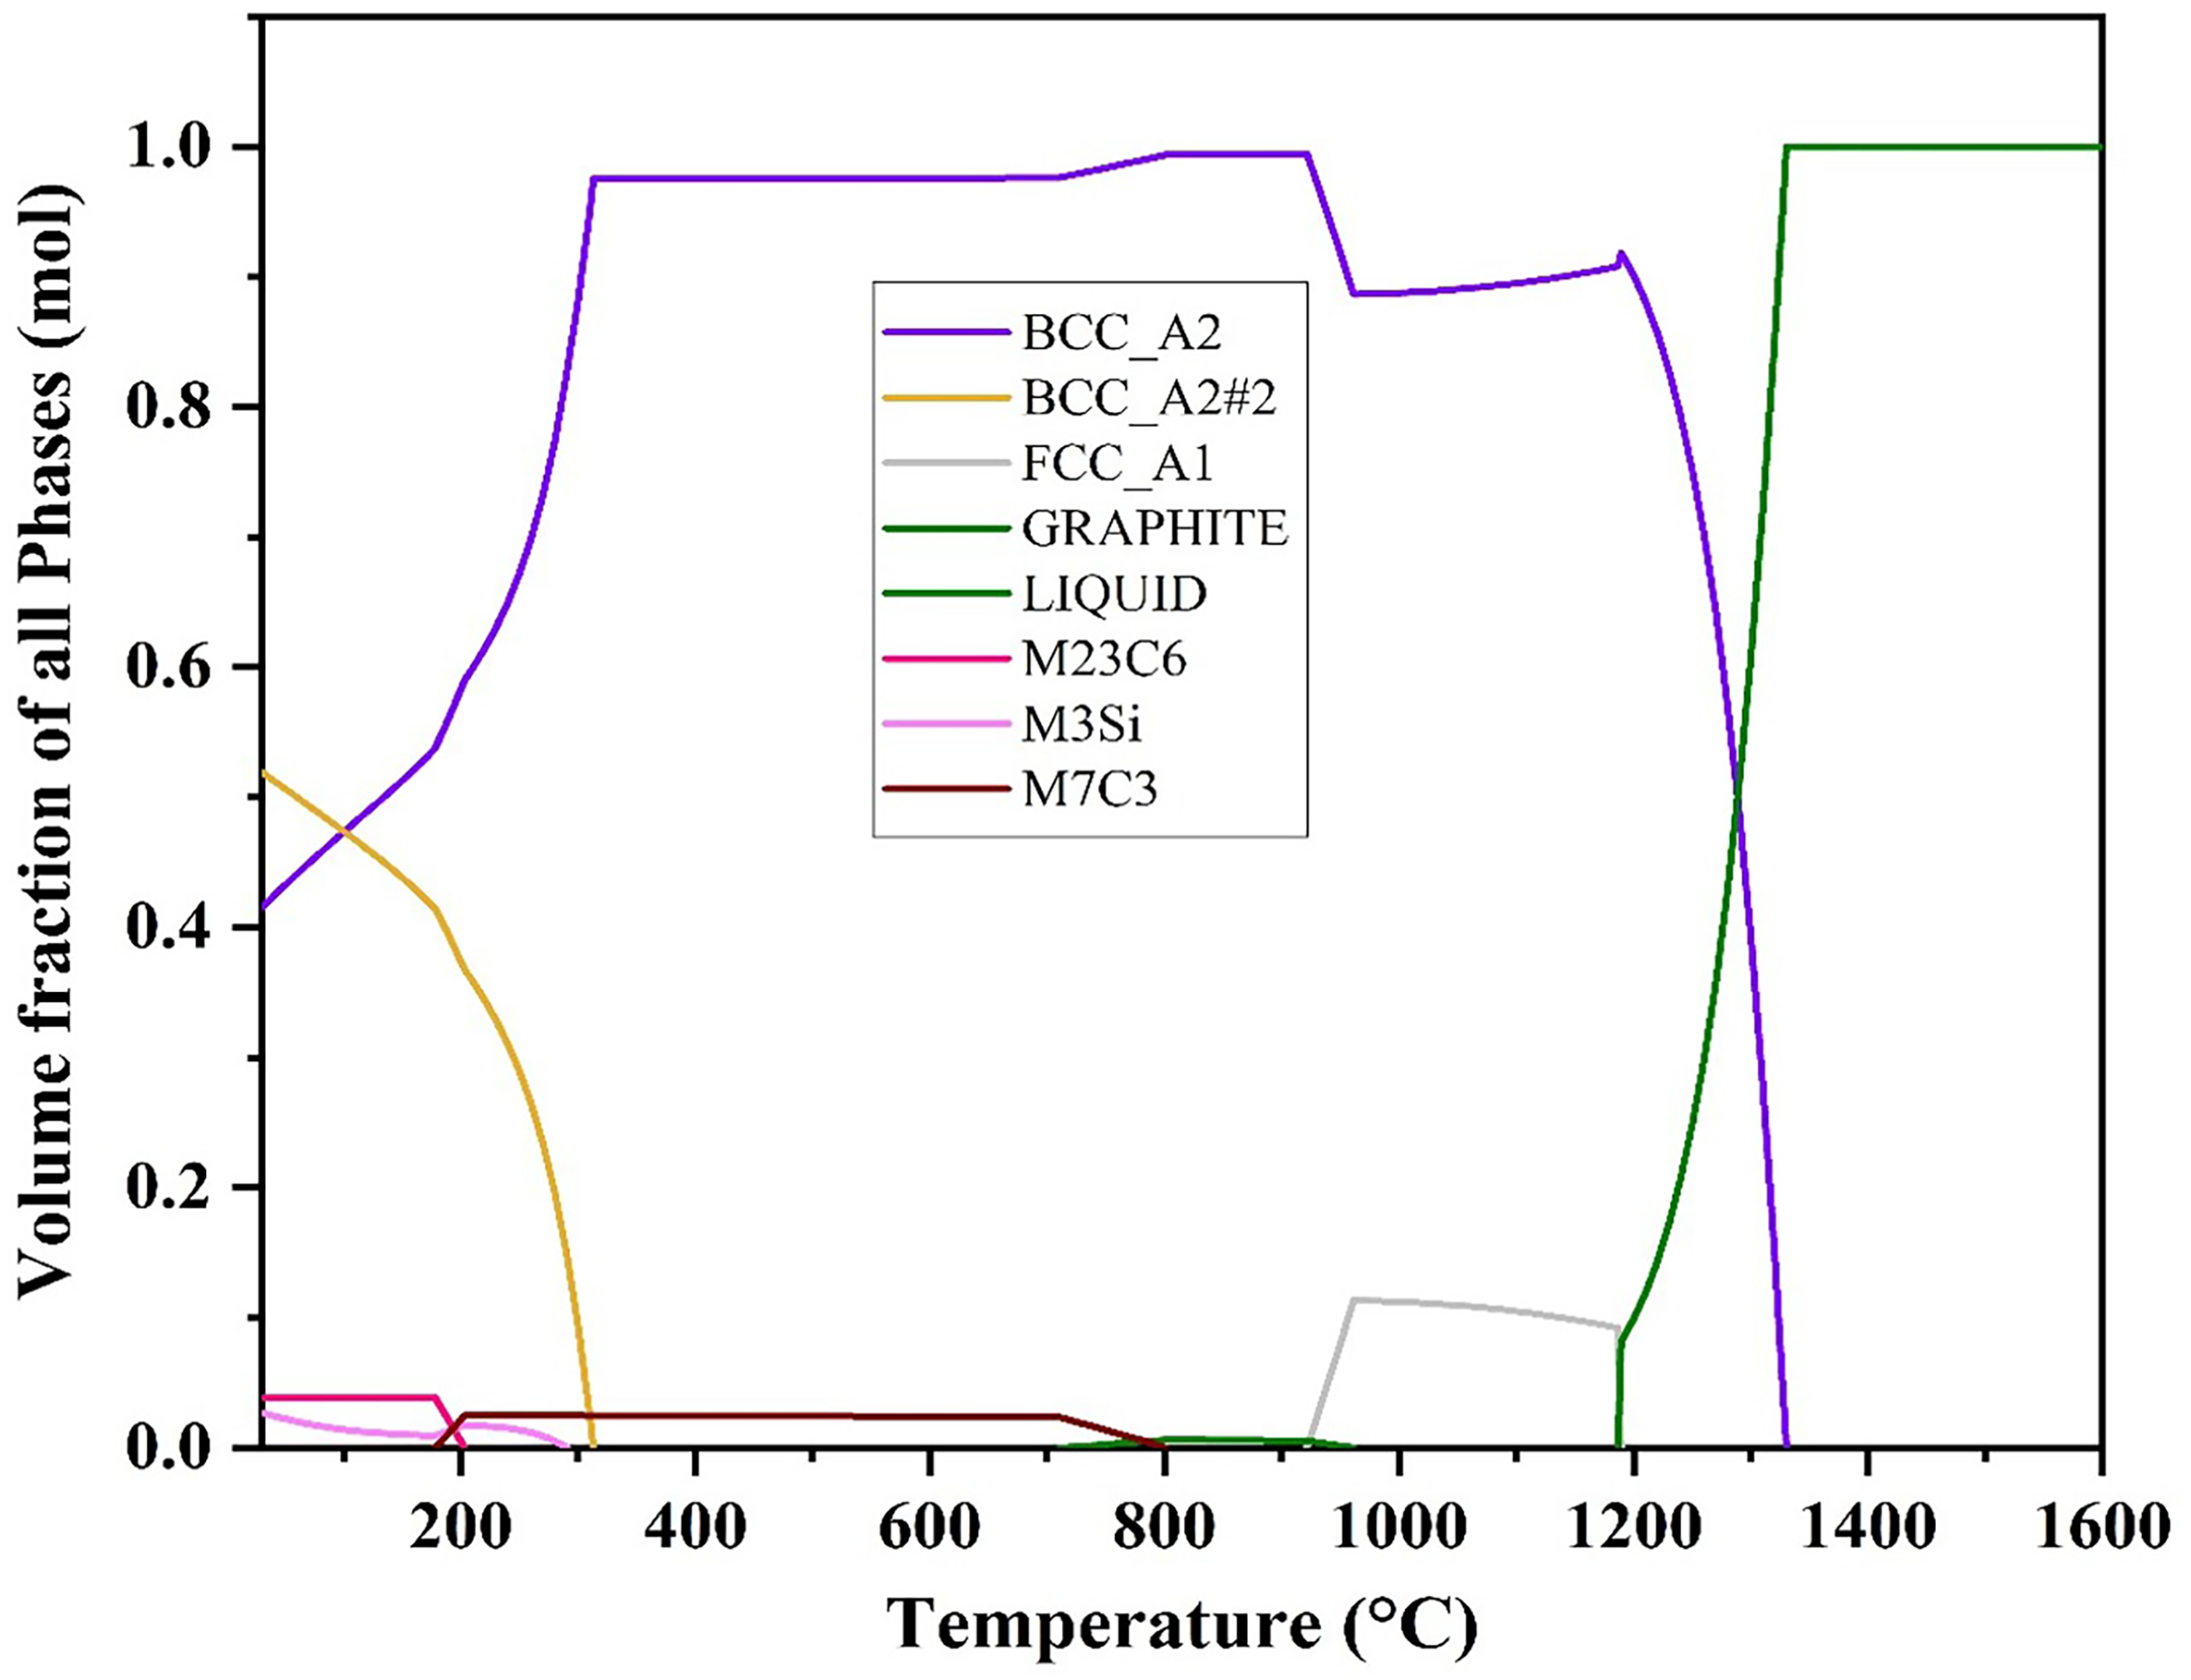
The phase diagram of MWCNT added low-density Fe-Mn-Al-Si- C steel.
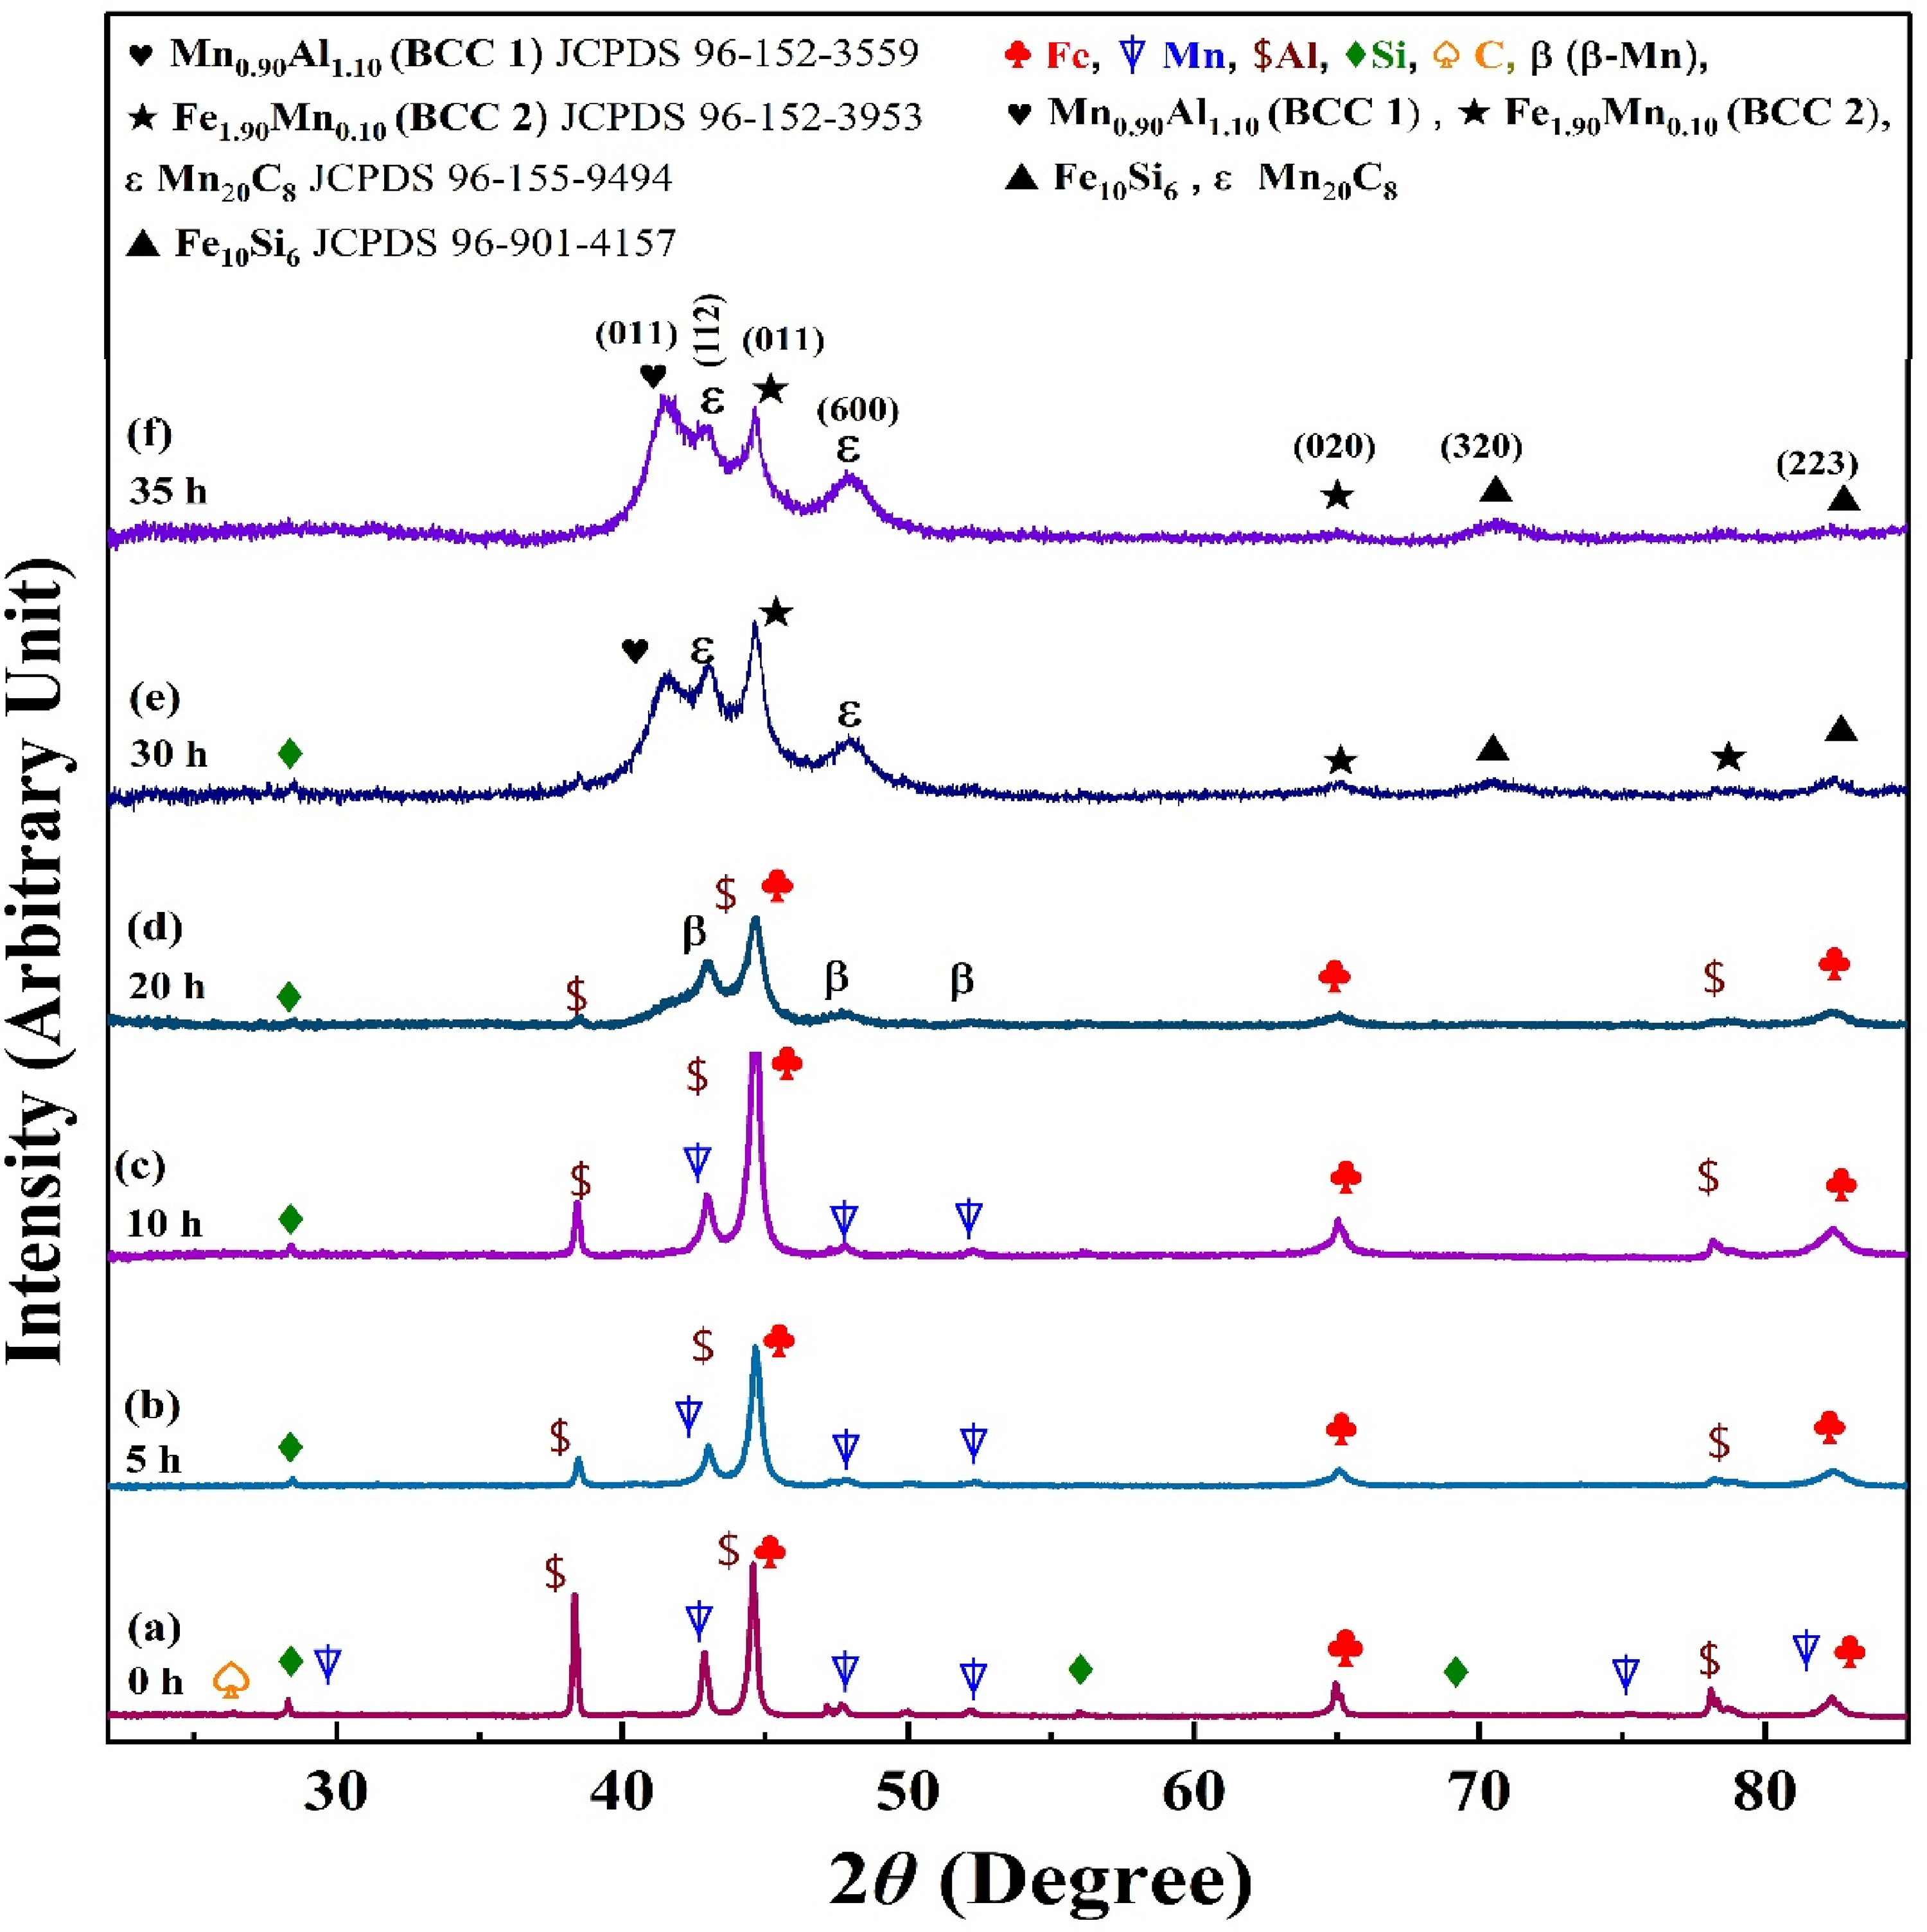
XRD patterns of 1wt% MWCNT-reinforced Fe-Mn-Al-Si-C steel subjected to different milling durations: (a) 0 h (dry mixed), (b) 5 h, (c) 10 h, (d) 20 h, (e) 30 h, and (f) 35 h.
Phases and phase fractions at various temperatures as determined using CALPHAD modeling (Thermo-Calc software).
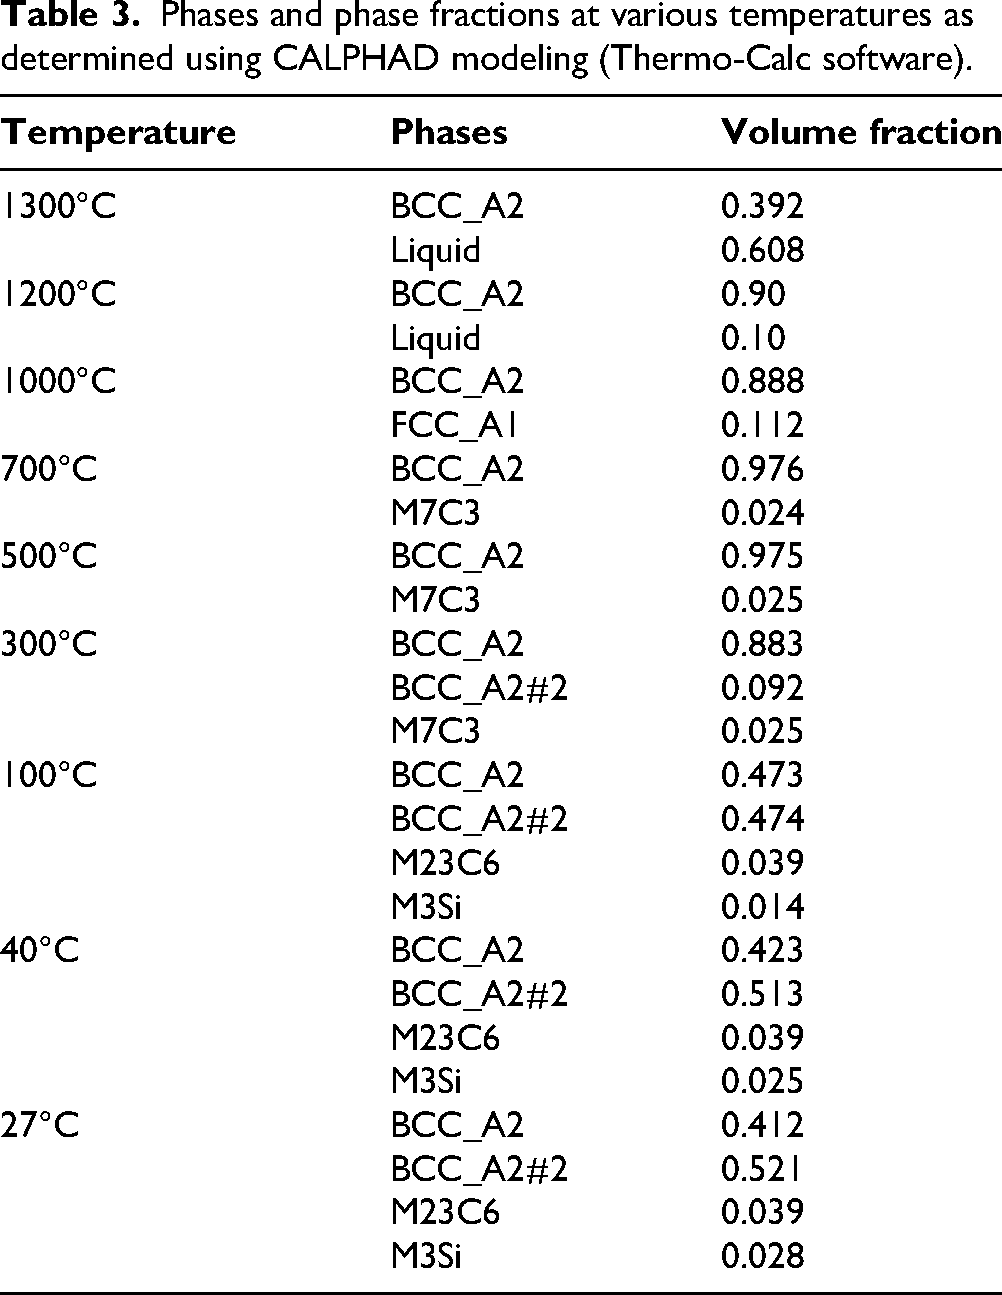
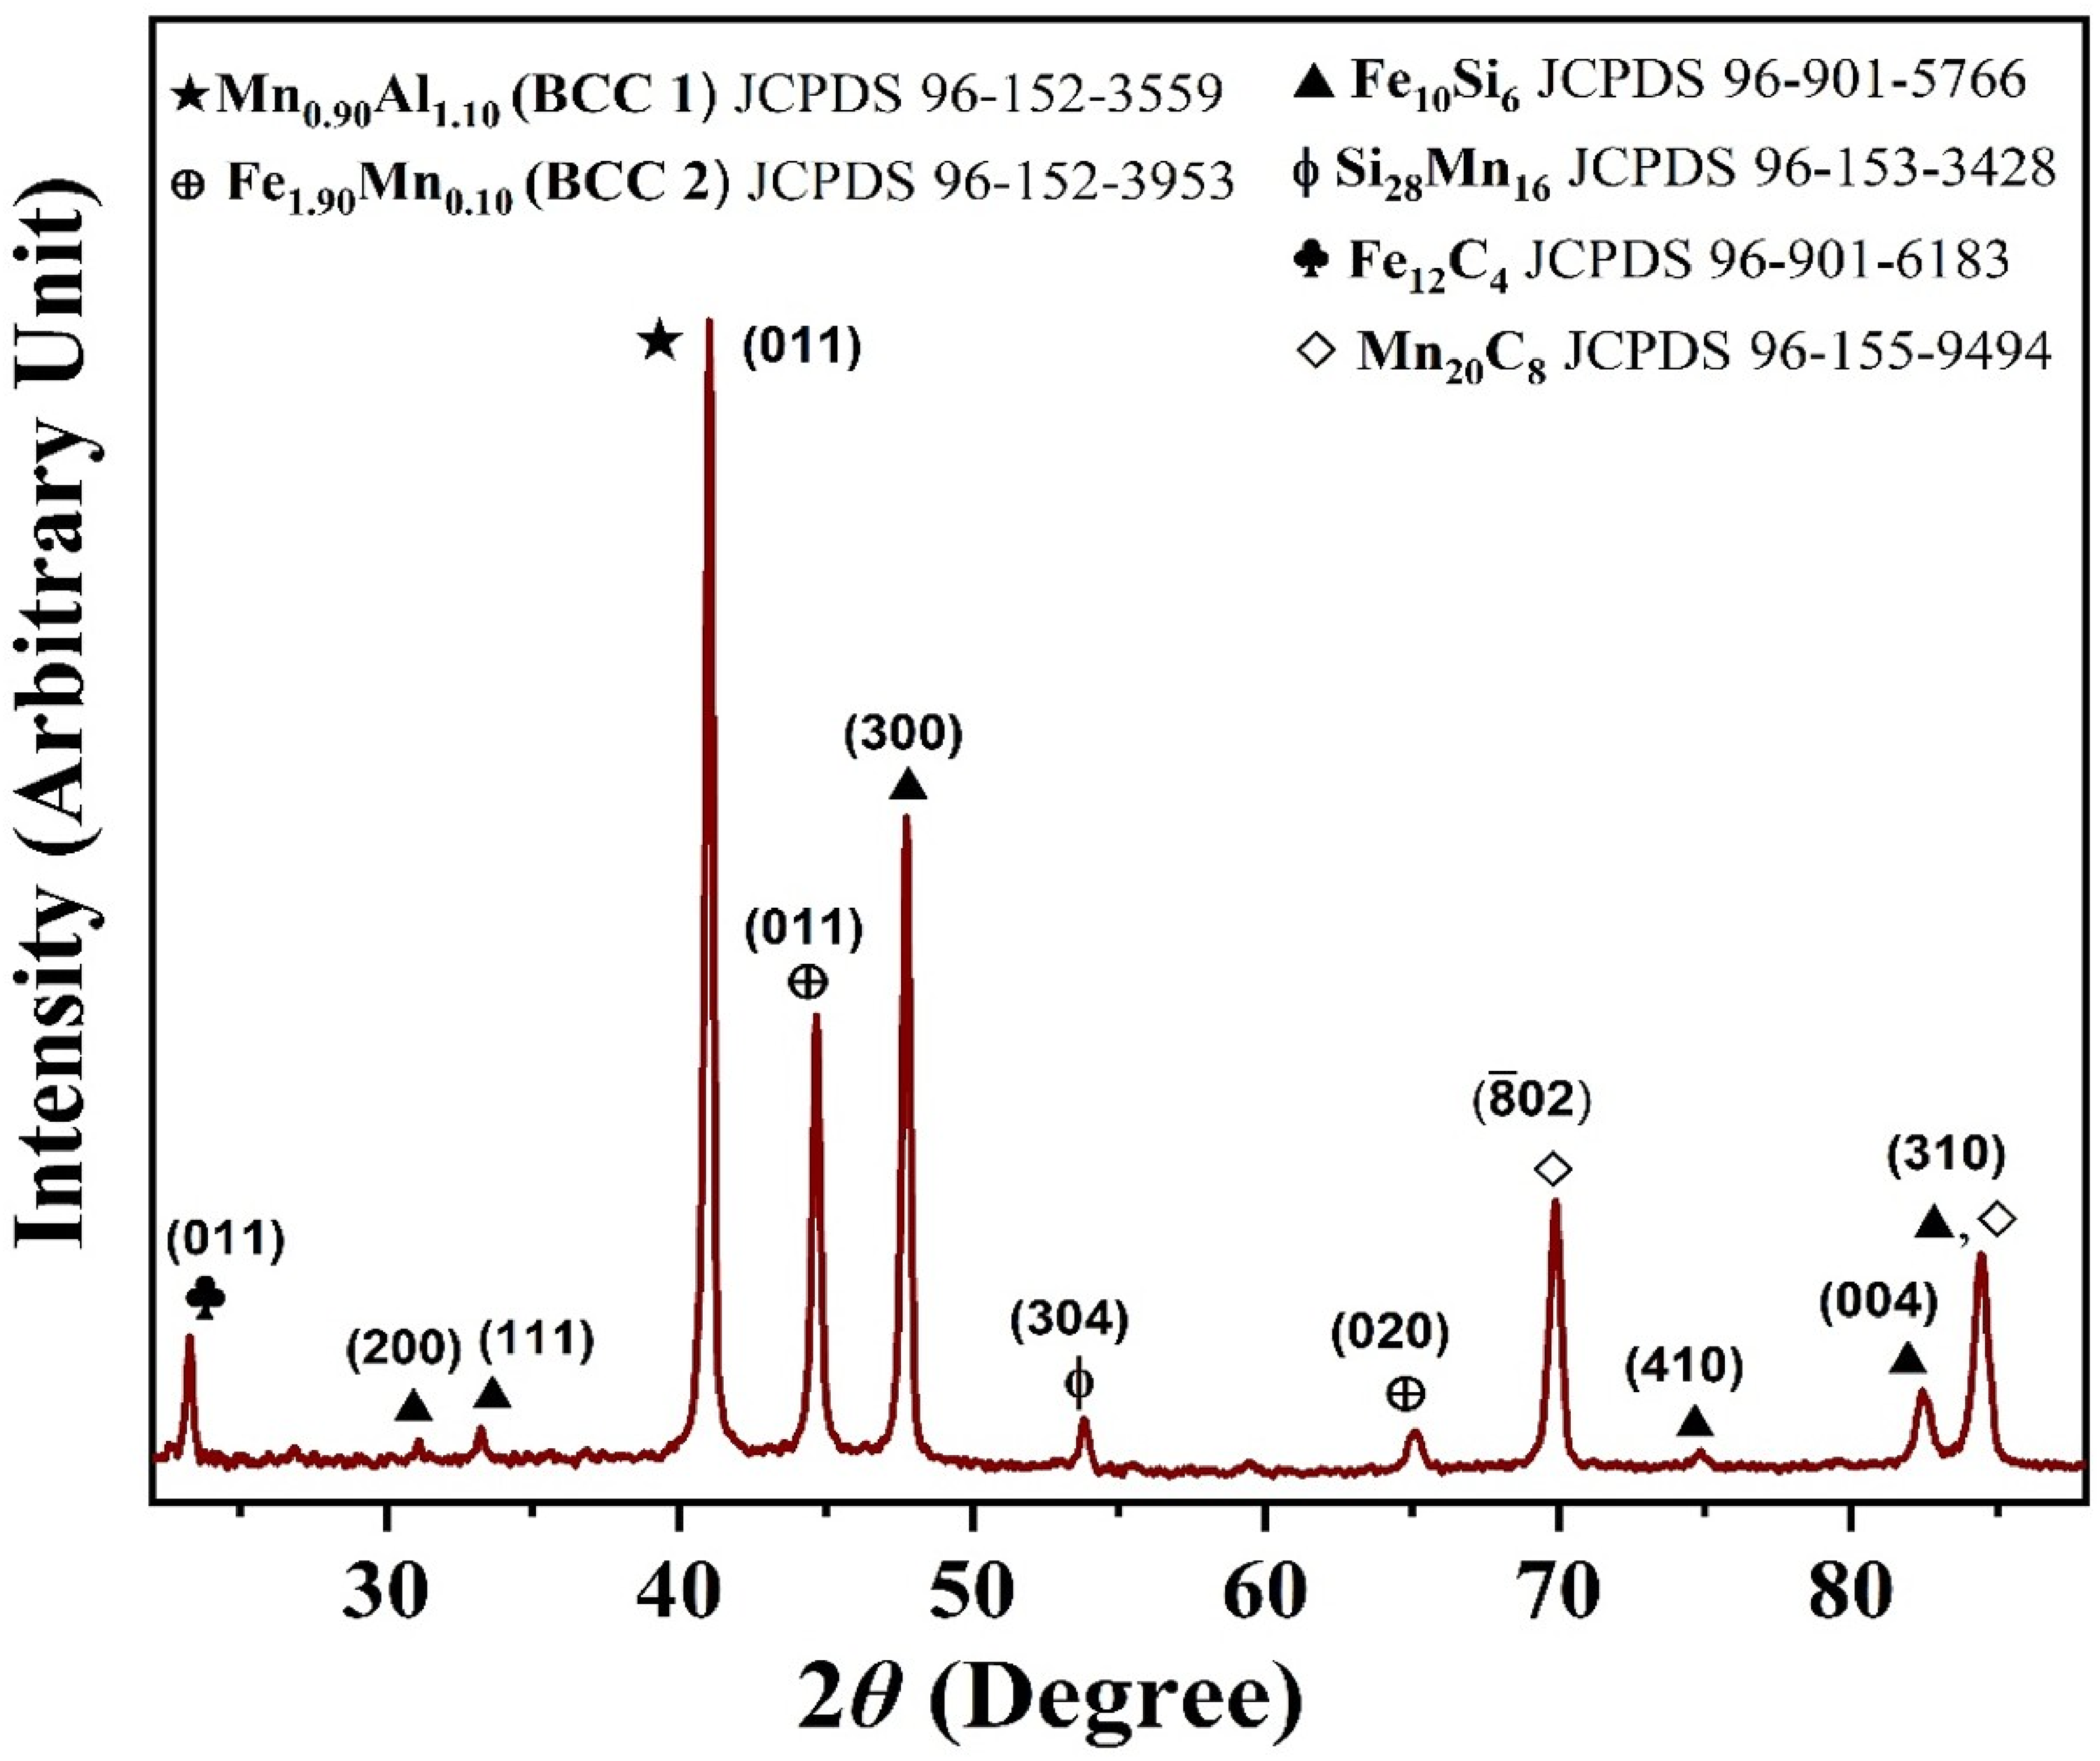
Figure 3 shows the XRD patterns, illustrating the phase evolution of a low-density steel during a mechanical alloying process, with diffraction patterns recorded at various milling times: 0 h, 5 h, 10 h, 20 h, 30 h, and 35 h. Each diffraction pattern presents the intensity as a function of the 2θ angle, revealing changes in phase composition as milling time increases. The XRD pattern intensities are normalized, and the JCPDS card numbers for the marked phases are included in the Figure 3 for reference. Initially, the XRD pattern of the dry-milled powder reveals distinct diffraction peaks corresponding to each alloying element, specifically Fe (JCPDS 96-900-8537), Mn (JCPDS 96-901-1069), Al (JCPDS 96-900-8461), Si (JCPDS 96-450-7227), and C (JCPDS 96-901-1578). At 0 h (10 min of dry milling), highly intense peaks representing the elements present in the milled powder, in which Fe is clearly visible, indicate the initial composition of the alloy. Prominent peaks corresponding to Mn, Al, Si, and C further reveal the presence of these elements in their unalloyed states. As shown in Figure 3, the intensity of these diffraction peaks diminishes progressively with increased milling time. For instance, the diffraction peak associated with carbon decreases notably within the first five hours of milling. Initially, carbon dissolves owing to its lower concentration and smaller atomic radius. There is an inverse relation between the melting point and alloying rate of that element. Furthermore, elements characterized by lower melting points have higher diffusion coefficients in comparison to those with higher melting points.54,55 After 10 h, the formation of β-Mn (marked with β symbols) becomes noticeable, indicating the beginning of phase transformation.
The broadening and shifting of peaks show increased lattice strain and grain refinement due to extended milling, a typical phenomenon in mechanical alloying. Aluminium diffraction peaks disappear after 20 h, suggesting significant dissolution of this element. The alloy becomes more homogeneous at 30 and 35 h, and intense peaks of Fe10Si6 and Mn20C8 phases are formed. These phases represent stable compounds formed through extended milling, suggesting that equilibrium phases are being approached. The disappearance or significant reduction of elemental peaks for Fe and Mn at this stage indicates that most of the elemental components have been incorporated into alloyed or compound phases. Peaks from Mn0.90Al1.10 (BCC 1) and Fe1.90Mn0.10 (BCC 2) throughout milling indicate their stability and compatibility with the alloy system. A homogeneous solid solution exhibiting a body-centered cubic (BCC) lattice structure, primarily Mn0.90Al1.10 (BCC 1) (a = 3.06 Å) and Fe1.90Mn0.10 (BCC 2) (a = 2.86 Å), forms as the majority phase, observed alongside minor intermetallic compounds such as Fe10Si6 and Mn20C8 which are also detected. These phases are also predicted at room temperature in the phase diagram as shown in Figure 1, as majorly BCC_A2, BCC_A2#2, and minorly silicide and carbide phases. The stability of the BCC phase across a broad temperature range suggests that it is well-suited to serve as the primary structural phase in the present low-density steel. This transformation is mostly completed within 30 h of milling, after which no additional phase change is detected, even with further milling up to 35 h. This XRD analysis highlights the progressive development of a homogeneous alloy structure with distinct intermetallic compounds as milling time increases. This reduction in crystallite size continues with increased milling time, ultimately reaching saturation. Importantly, no impurity peaks are observed in the diffraction patterns of the milled powder samples, indicating high alloy purity. The observed dissolution of alloying elements and phase transitions during milling closely relate to the melting points and bonding strengths of the constituent elements. Elements with higher bonding strengths establish the primary lattice structure, facilitating the integration of other alloying elements into the solid solution, 56 which is especially advantageous in multicomponent alloys such as this Fe-Mn-Al-Si-C + CNT system.
To determine the crystallite size and phase fraction, the XRD peak fitted using Lorentz fitting.
10
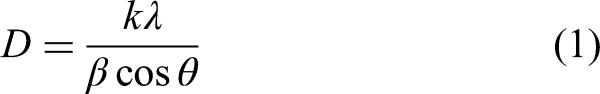
Lorentzian functions accurately model peak shapes, enabling full width at half maximum (FWHM) measurement. Crystallite size (CS) was calculated using the Scherrer equation.
10
To determine the microstrain, a Gaussian function was used to quantify the peak broadening, which quantifies structural flaws and localized lattice distortions using the Stokes and Wilson relation. 57 In Table 4, the calculated values of crystallite size, microstrain, and phase fraction are given.
Crystallite size and micro-strain of MWCNT added low-density steel.
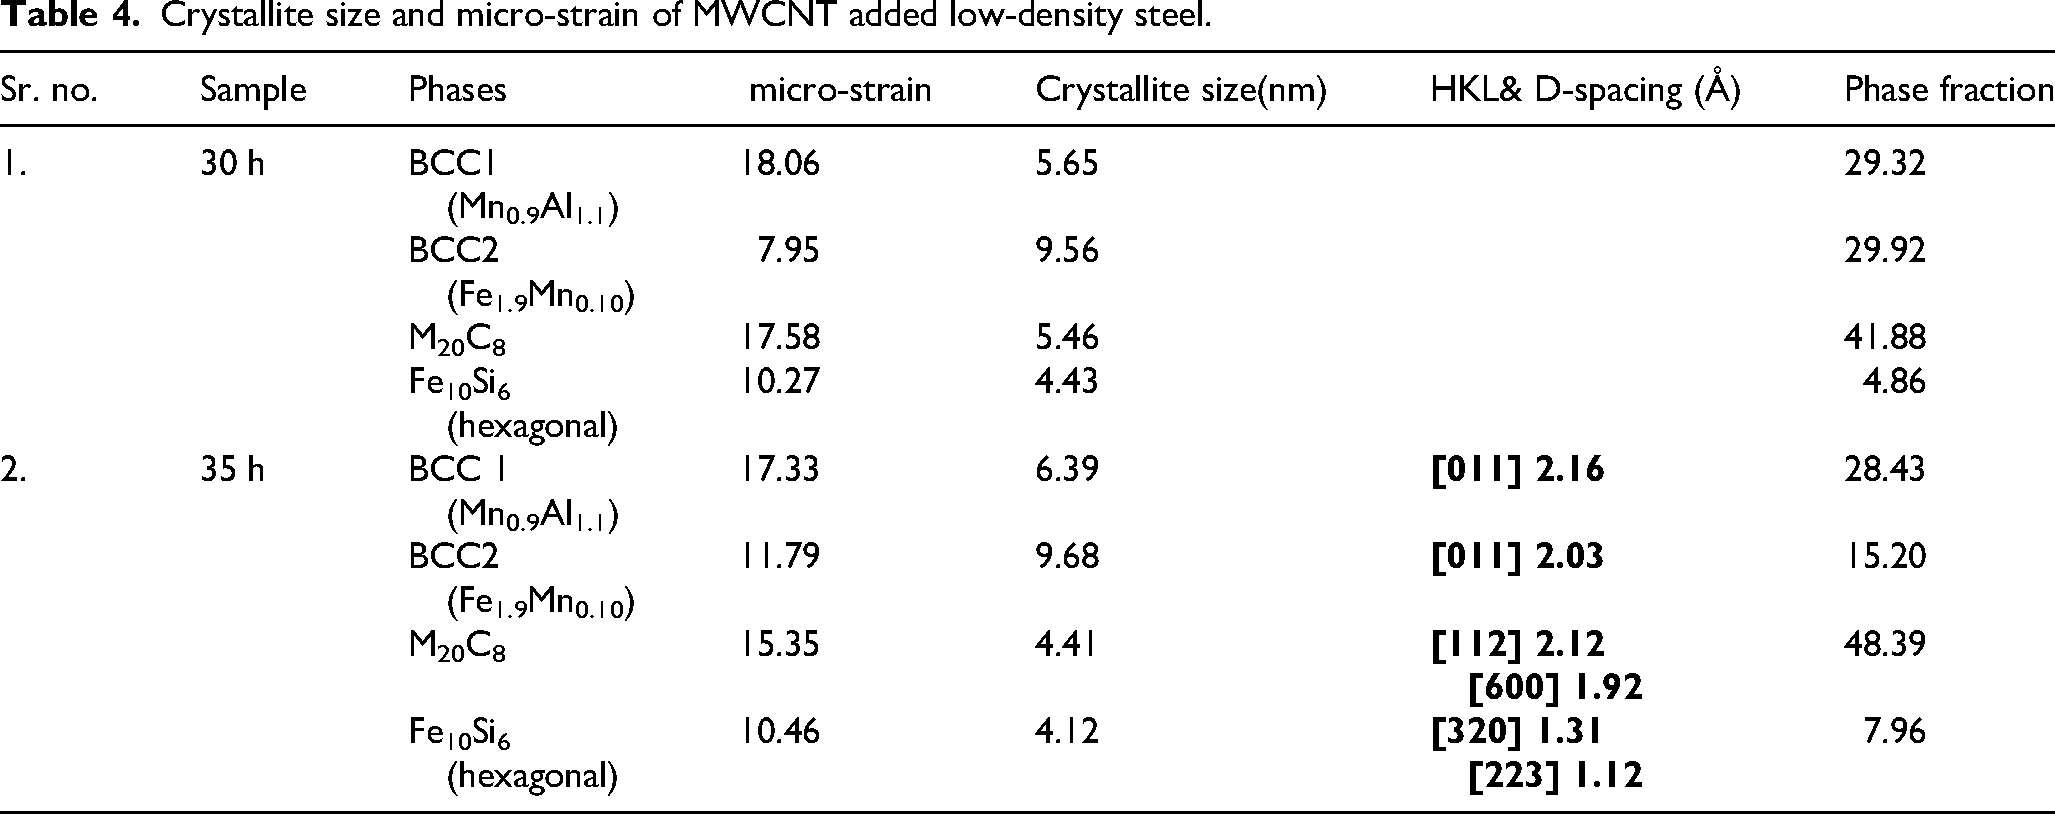
The crystallite size of the BCC phase increases somewhat from 30 to 35 h of milling, although it should decrease due to milling phenomenon. 39 In the BCC phase, the increase in crystallite size with extended milling can be attributed to a balance between defect introduced and dynamic recovery processes. During the early stages of milling, the introduction of defects such as dislocations and vacancies reduces crystallite size. However, as milling continues, the accumulation of defects raises the internal energy of the system. This stored energy promotes dynamic recovery and partial recrystallization, where defect reduction mechanisms such as dislocation annihilation allow the grain coalescence. 10 Additionally, mechanical milling generates heat like low-temperature annealing, promoting grain growth and coalescence and increasing crystallite size. 7
The effect of milling time on microstrain is evident in the observed variations across the samples. Microstrain, indicative of lattice distortions and internal stresses, increases with milling time due to the accumulation of defects and dislocations within the crystal structure.58,59 The 30- h milling sample has reduced microstrain values. In contrast, the 35- h milling sample exhibits higher microstrain in most phases, particularly in BCC1 and BCC2, highlighting enhanced strain due to prolonged mechanical deformation. This increase can influence the crystallite size, as seen in the reduction of crystallite dimensions for certain phases with higher microstrain. 57 Thus, microstrain plays a critical role in defining the structural evolution and mechanical properties of milled elemental powder.
The XRD pattern of SPSed MWCNT added Fe-Mn-Al-Si-C steel in Figure 4 shows multiple phase-specific peaks. Standard JCPDS cards identified these peaks for material compounds. Fe1.90Mn0.10 (JCPDS 96-152-3953) and Mn 0.90Al1.10 (JCPDS 96-152-3559) phases suggest manganese and aluminium engage in body-centered cubic structures.
XRD pattern of spark plasma sintered MWCNT added Fe-Mn-Al-Si-C low density steel.
SPS processing can cause carbon nanotubes to undergo partial structural degradation, dissolution into the matrix, or transformation into carbide phases such as Fe3C or amorphous carbon. 36 Also, Al4C3 formation is thermodynamically feasible at elevated temperatures, but experimental detection depends on kinetic factors, phase fraction, and crystallite size. In the present study, the absence of Al4C3 or Fe3C peaks in the XRD patterns may be attributed to their low volume fraction, nanoscale size, or possible overlap with matrix peaks. Even the rapid heating, short dwell time, and applied pressure during SPS can suppress extensive carbide growth, favoring metastable or amorphous carbon-rich regions instead of well-crystallized carbide phases as observed in Figure 4.
Additionally, Fe12C4 and Mn20C8 peaks indicate carbide phases, whereas Fe10Si6 and Si28Mn16 indicate silicide phases. Other observed phases include Mn10Si6, which highlights the role of manganese and silicon in forming complex intermetallic structures. These phases suggest strong interactions among the alloying elements under SPS conditions, resulting in a complex microstructure. Local Si enrichment and elemental segregation during high-energy ball milling and quick SPS consolidation, when diffusion is very non-uniform and equilibrium is not reached, might cause silicide production despite the nominal Si content of 2 wt.%. The severe plastic deformation introduced during milling and the non-equilibrium heating, pulsed current, and short dwell time associated with SPS can promote the formation of kinetically stabilized or metastable silicide phases, even at low bulk Si contents. According to the phase diagram, the primary phase formed is BCC, with smaller amounts of silicide and carbide phases. Based on experimental data, Figure 4 shows that ferrite (α-Fe) predominantly combines with silicide and carbide. The similar electronegativity and atomic radius of Fe and Si likely contribute to the formation of iron silicide compounds.
Microscopic studies
Scanning electron microscopy
Figure 5 (a-f) shows SEM micrographs of Fe-Mn-Al-Si-C-CNT low-density steel powder, and Figure 6 shows particle size distribution after 10 min., 5 h, 10 h, 20 h, 30 h, and 35 h of mechanical milling. At 10 min of milling, Figure 5(a) displays coarse, irregular, angular powder particles with sharp edges, indicating discrete constituent particles with limited contact. The particle size is 6.2 ± 2.2μm, as seen in Figure 6(a). After 5 h of milling (Figure 5(b)), particles undergo plastic deformation and fragmentation, resulting in flattened, flaky, and fractured particles with increased agglomeration from cold welding. The average particle size decreases to 4.0 ± 1.8μm (Figure 6(b)). After 10 h of milling (Figure 5(c)), repeated cold welding and fracturing refine particle size, resulting in more equiaxed but irregular particles with a wider size variation (0–13 μm) and a size drop to 3.7 ± 1.9 μm. At 20 h of milling, Figure 5(d) shows particles getting finer and more homogeneous, with fewer sharp edges, showing a balance between welding and fracture mechanisms. Figure 6(d) shows the particle size decreasing to 3.0 ± 0.9 μm. Figure 5(e) shows much refined and homogenous powder morphology after 30 h of milling, with smaller, compact, and semi-spherical forms created by continuous deformation and work hardening. The average particle size decreases to 2.7 ± 0.9 μm (Figure 6(e)). After 35 h of milling, Figure 5(f) shows a refined and uniform powder morphology, with fine, equiaxed particles and smoother surfaces. This suggests fracturing prevailed over cold welding, resulting in a steady-state particle size distribution of 0–6 μm with an average particle size of 2.6 ± 0.9 μm (Figure 6(f)). The rate of size reduction decreases with extended milling durations, suggesting particle size stability. In Figure 6(a-f), the size distribution narrows over time, indicating increasing particle size homogeneity during milling.
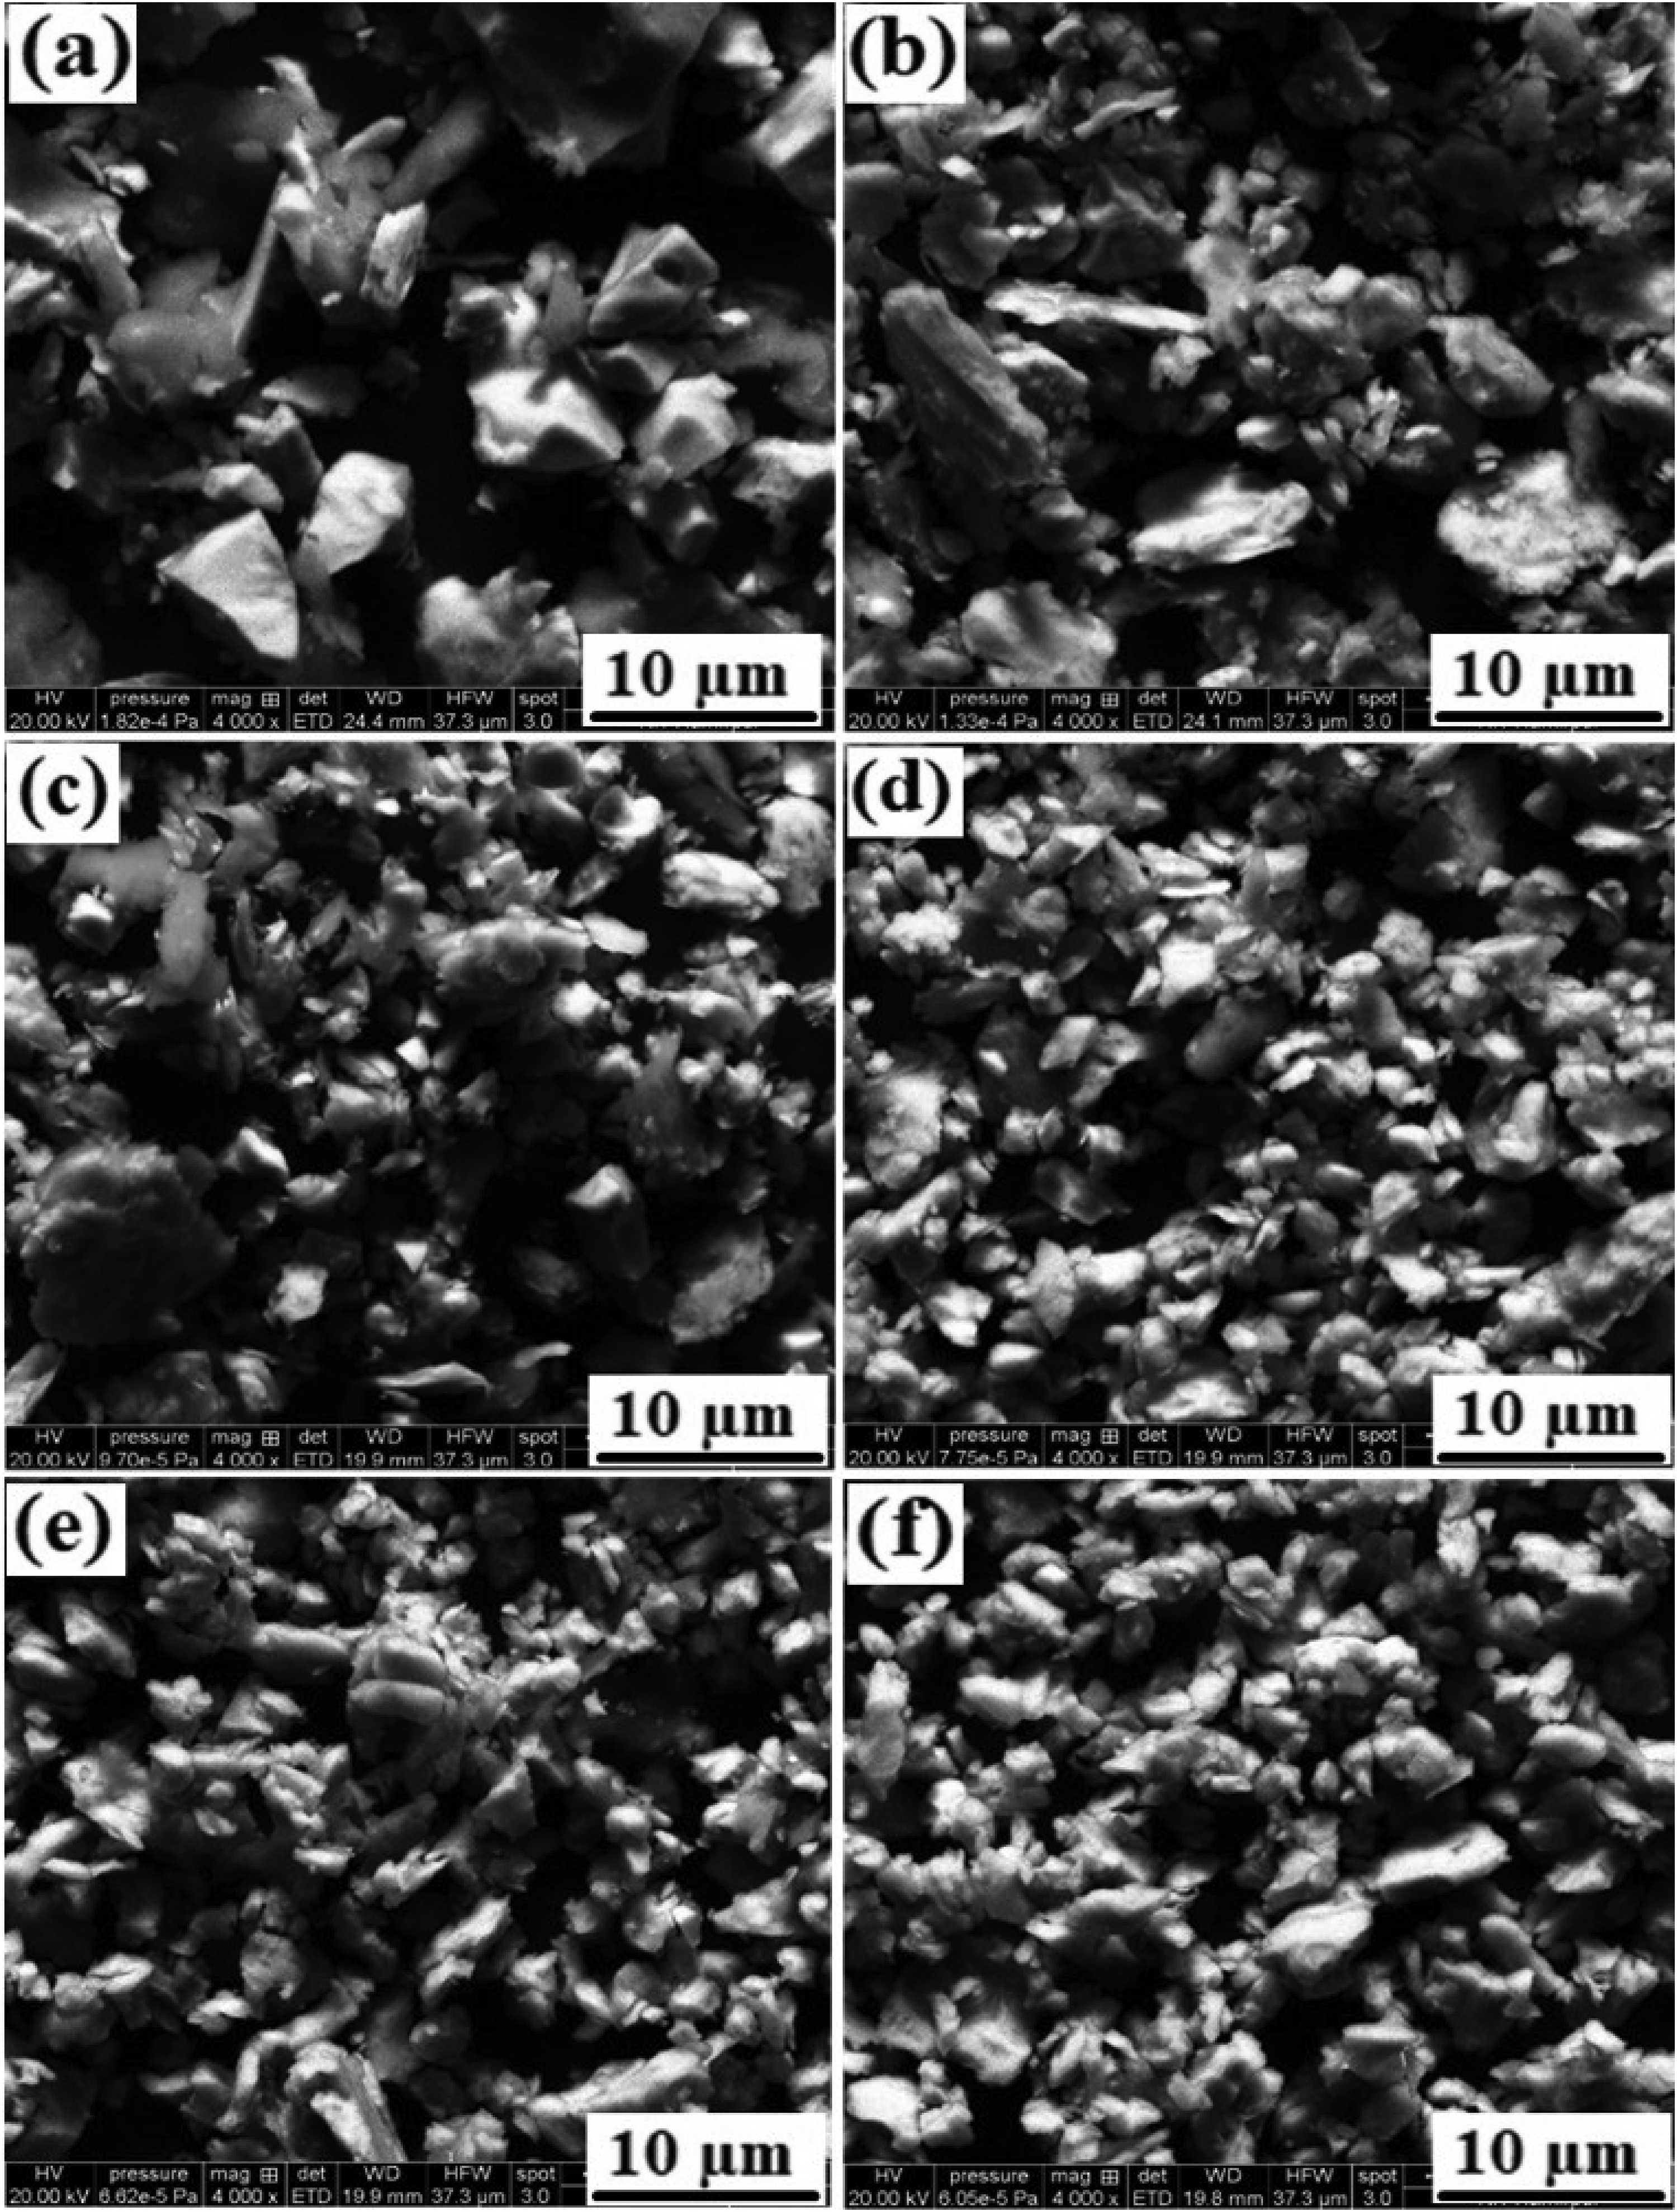
FESEM micrographs are showing the morphological evolution of mechanically alloyed powders, (a) unmilled (dry-mixed) powder, and powders milled for (b) 5 h, (c) 10 h, (d) 20 h, (e) 30 h, and (f) 35 h.
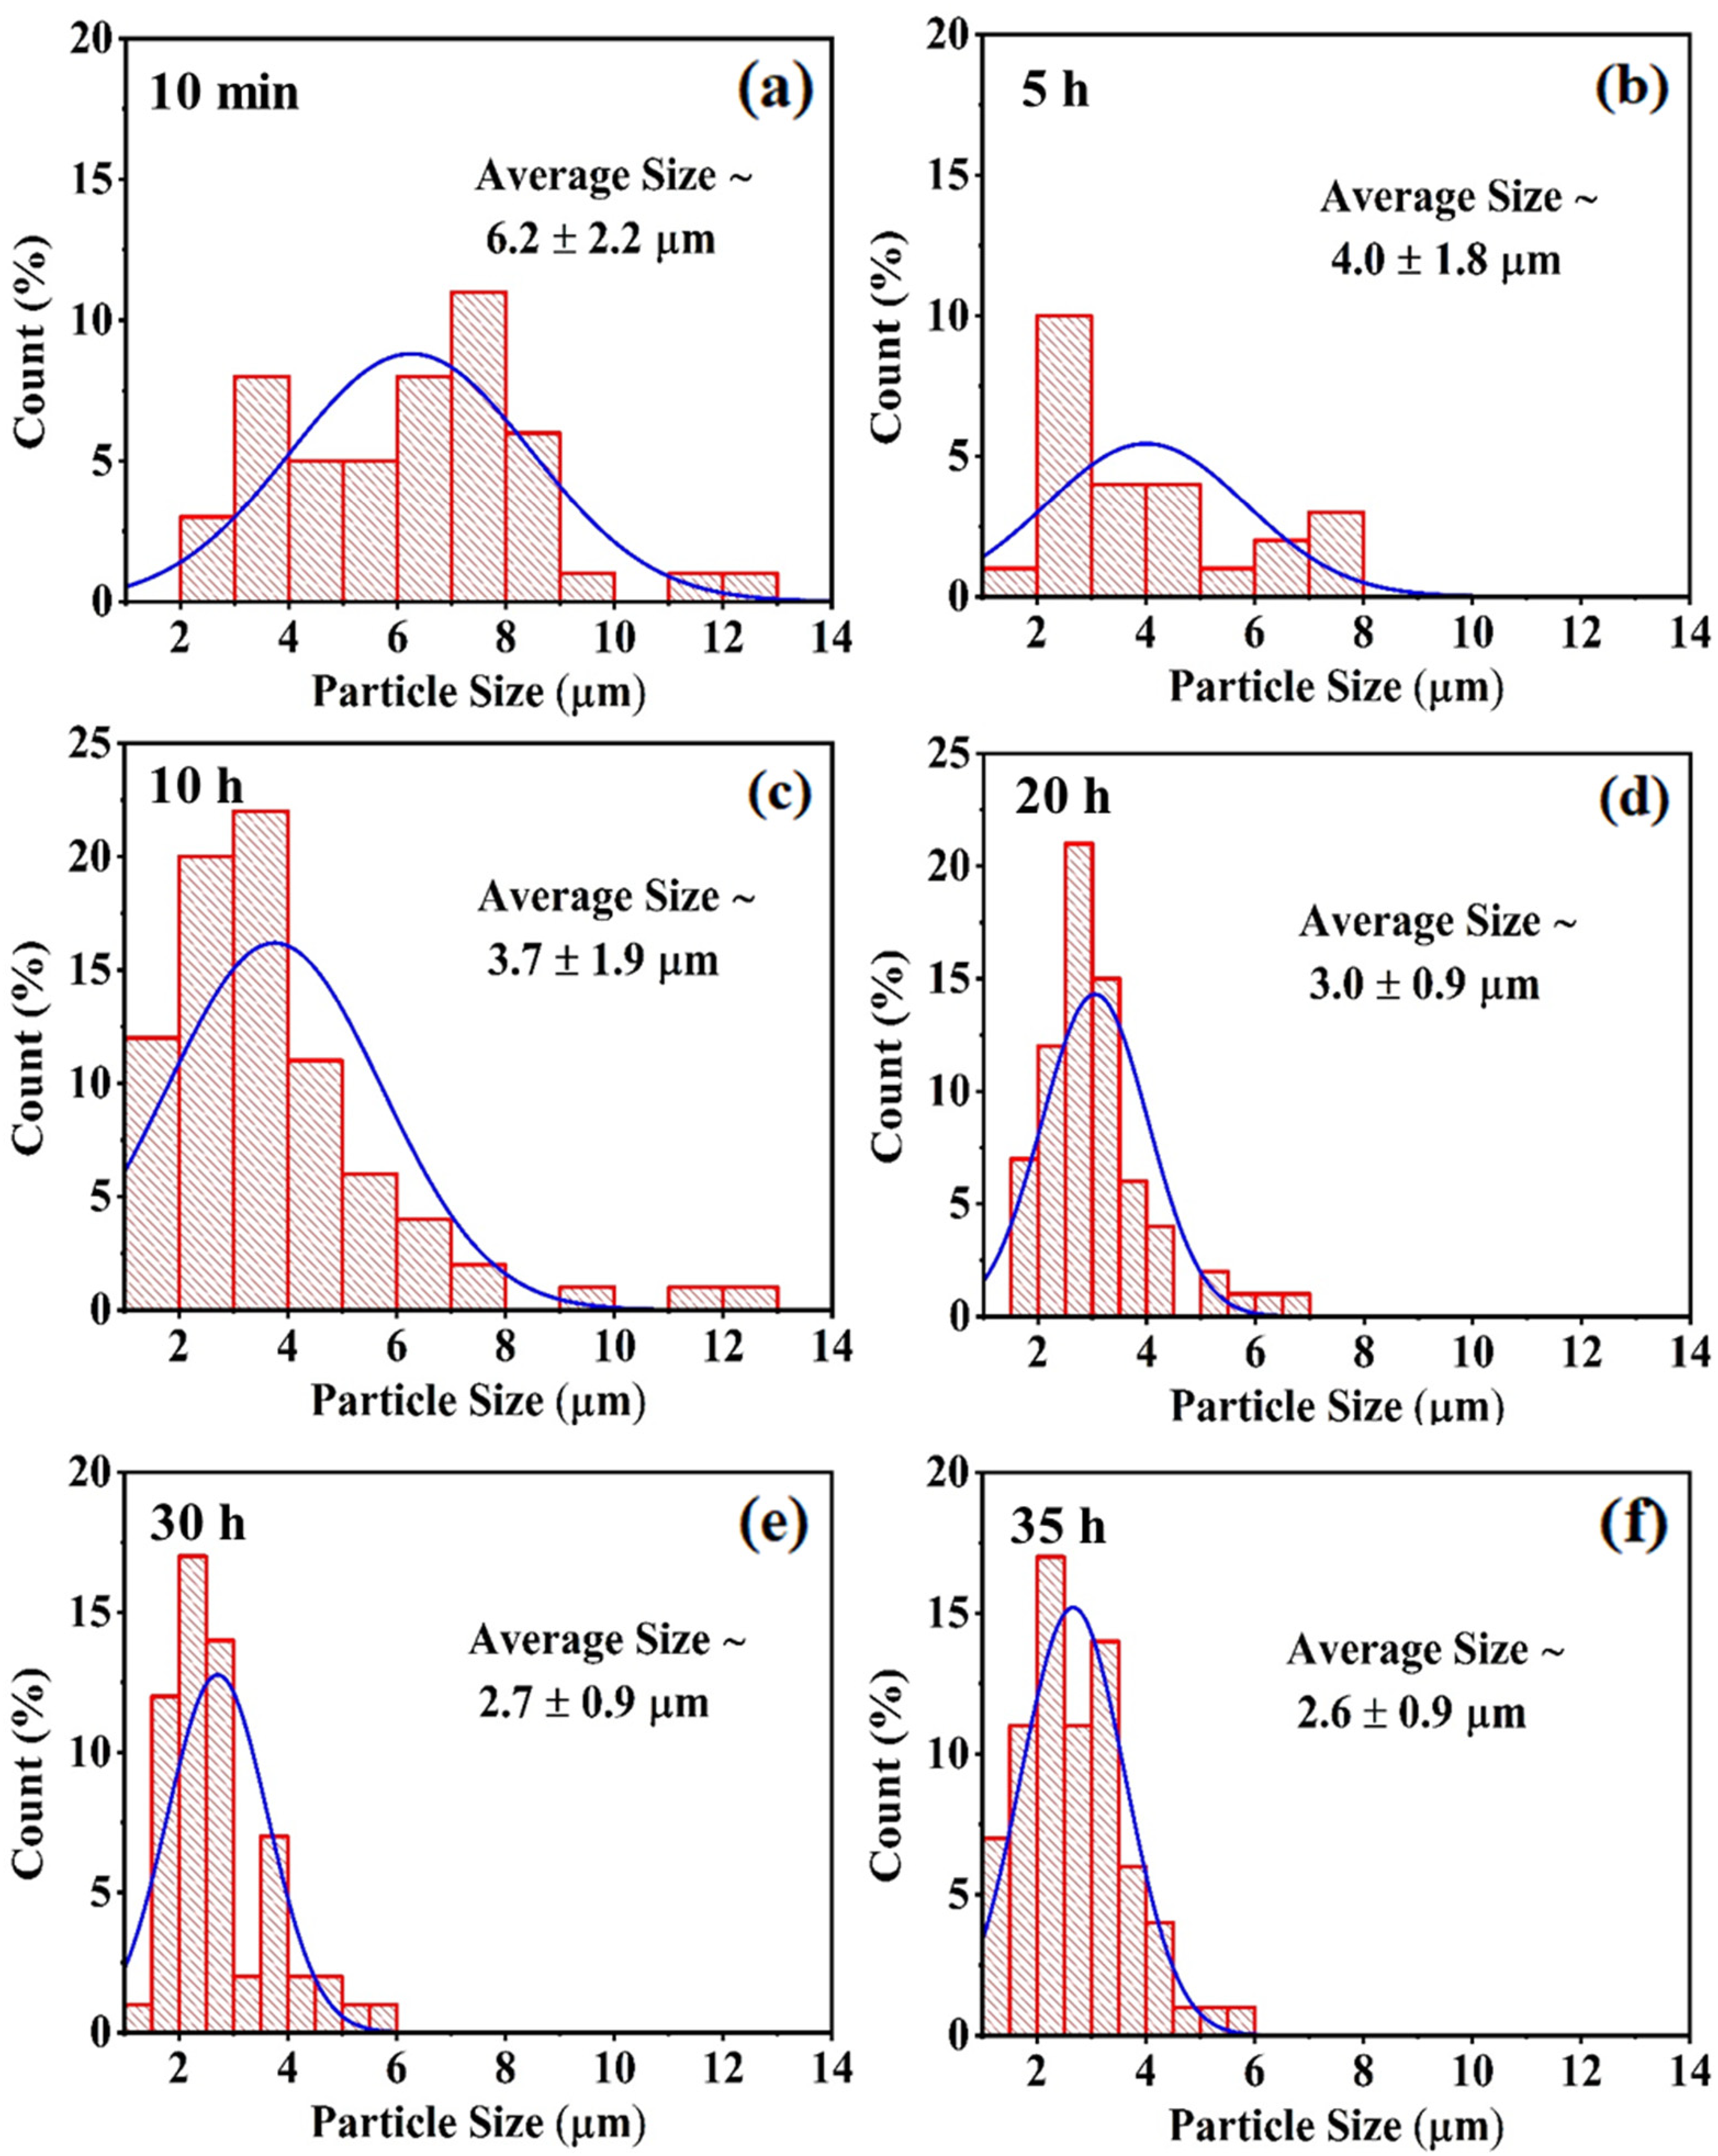
Average particle size distribution of MWCNT added Fe-Mn-Al-Si-C + CNT steel elemental powder at different milling times, using the SEM micrographs: (a) 10 min of dry milling, (b) 5 h, (c) 10 h, (d) 20 h, (e) 30 h, (f) 35 h.
Figure 7 shows the SEM micrograph of spark plasma sintering (SPS)-treated Fe-Mn-Al-Si-C+CNT steel, and Figure 8 shows EDS spectra of components of the same. The SEM micrographs show the alloy's BCC ferritic matrix and relatively few secondary carbide and silicide phases. In Figure 7, the sintered microstructure reveals a dense matrix distributed throughout. The homogeneity of the particle distribution suggests effective dispersion of alloying elements and reinforcement phases, a result of both the mechanical alloying and SPS. The particle size is relatively uniform, which could contribute in improving the mechanical properties of MWCNT-added low density steel. The microstructure of the SPSed sample indicates the regions with white contrast likely correspond to the BCC phase, whereas the areas with dark contrast are associated with an Fe12C6-type phase.29–31 The primary phase appears to be represented by the dark and light gray areas, as these occupy a larger portion of the volume.
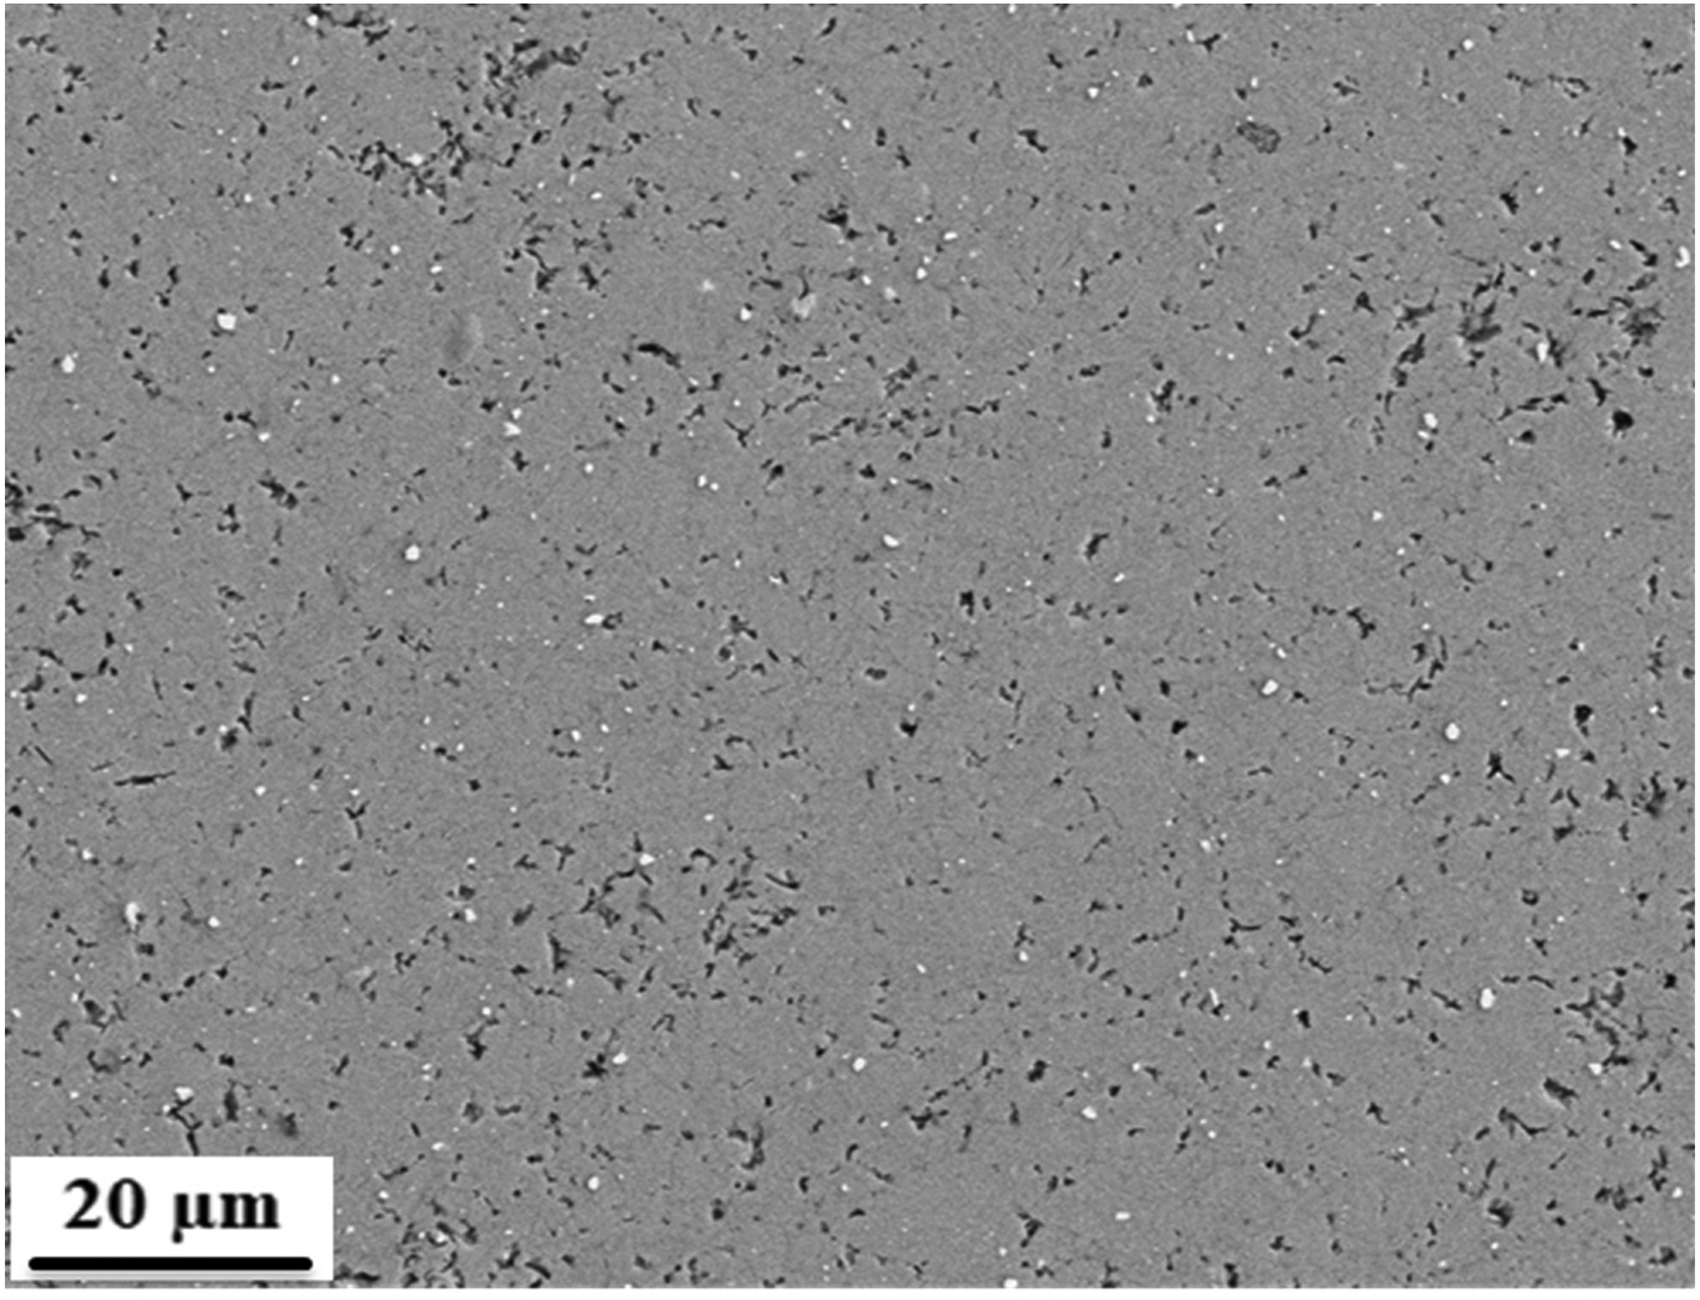
SEM image of spark plasma sintered pallet.
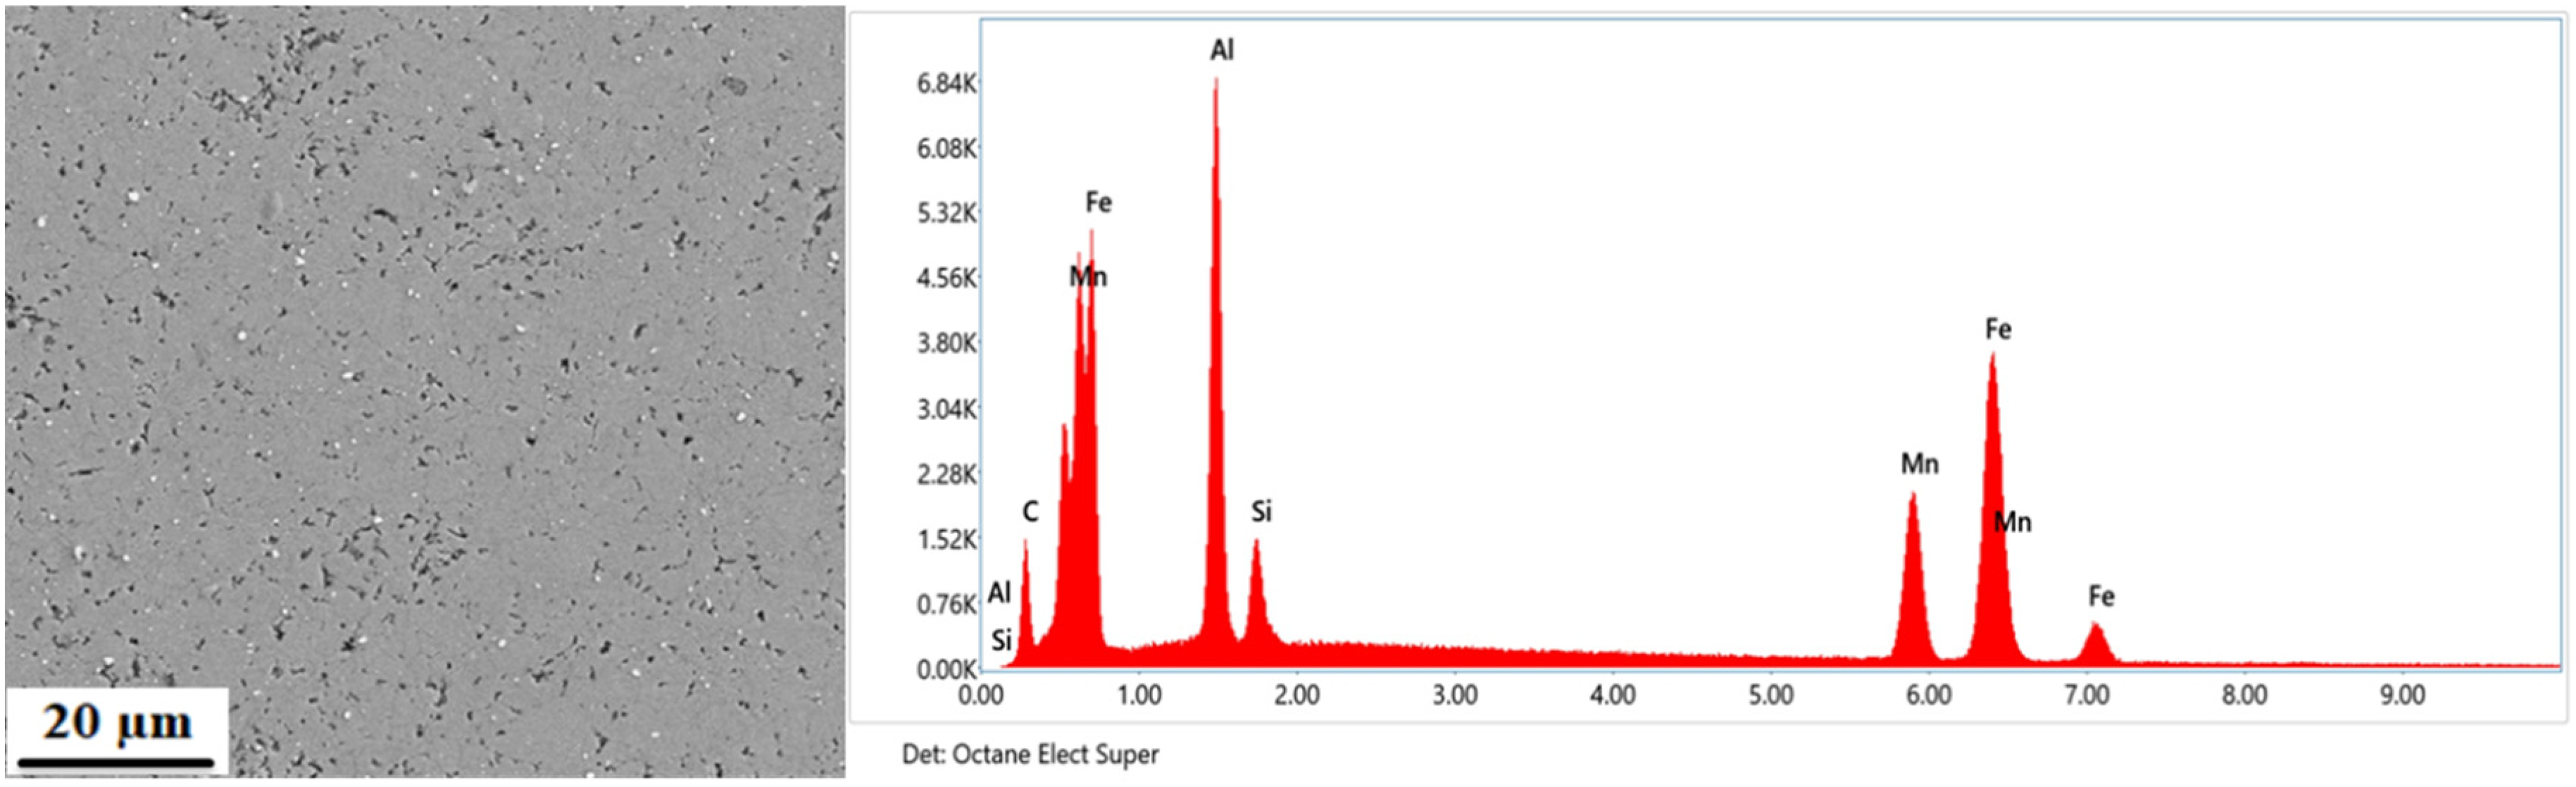
The EDS spectra of elements present in the spark plasma sintered sample.
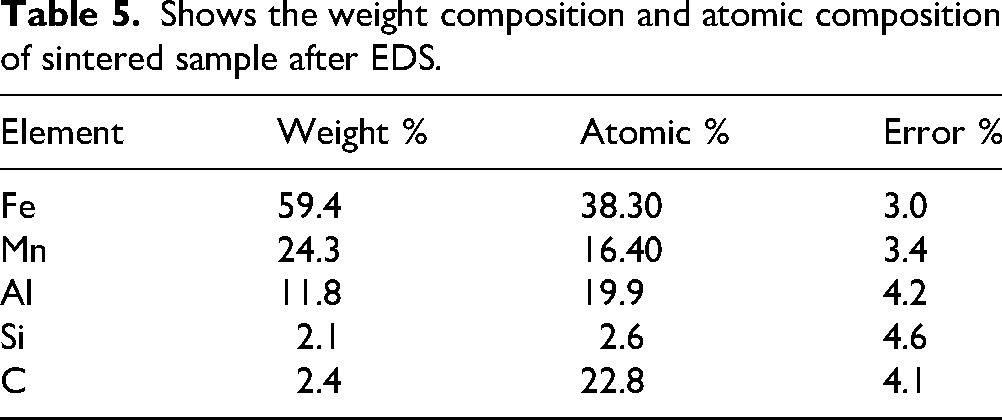
The EDS mapping provides a detailed elemental distribution of the MWCNT-added low-density steel. Figure 9(a) shows the field of view with the region selected for elemental analysis. The elemental overlay, Figure 9(b), highlights the uniform distribution of Fe, Mn, Al, Si, and C in the analyzed area. Individual elemental maps Figure 9(c-g) confirm the homogeneous dispersion of each element within the alloy matrix. Table 5 shows the weight composition and atomic composition of the sintered sample after EDS, which is closer to the original composition added in Table 1.

Elemental mapping of SPSed sample (a) SEM image, (b) Elemental overlay, (c) Fe, (d) Mn, (e) Al, (f) Si, (g) C respectively.
Shows the weight composition and atomic composition of sintered sample after EDS.
Transmission electron microscopy
Transmission electron microscopy (TEM) examined the microstructure and nanoscale properties of 1% MWCNT-added low-density Fe56.75Mn25Al15Si2C0.25 steel (Figure 10(a-b)). Bright field TEM imaging reveals low-density steel secondary phases and precipitates. Figures 10(a-b) show CNT dispersion and steel matrix integration. This detailed microstructural investigation revealed the complicated interactions between Fe, Mn, Al, Si, and C elements and MwCNTs, which reduce steel density and increase specific strength.
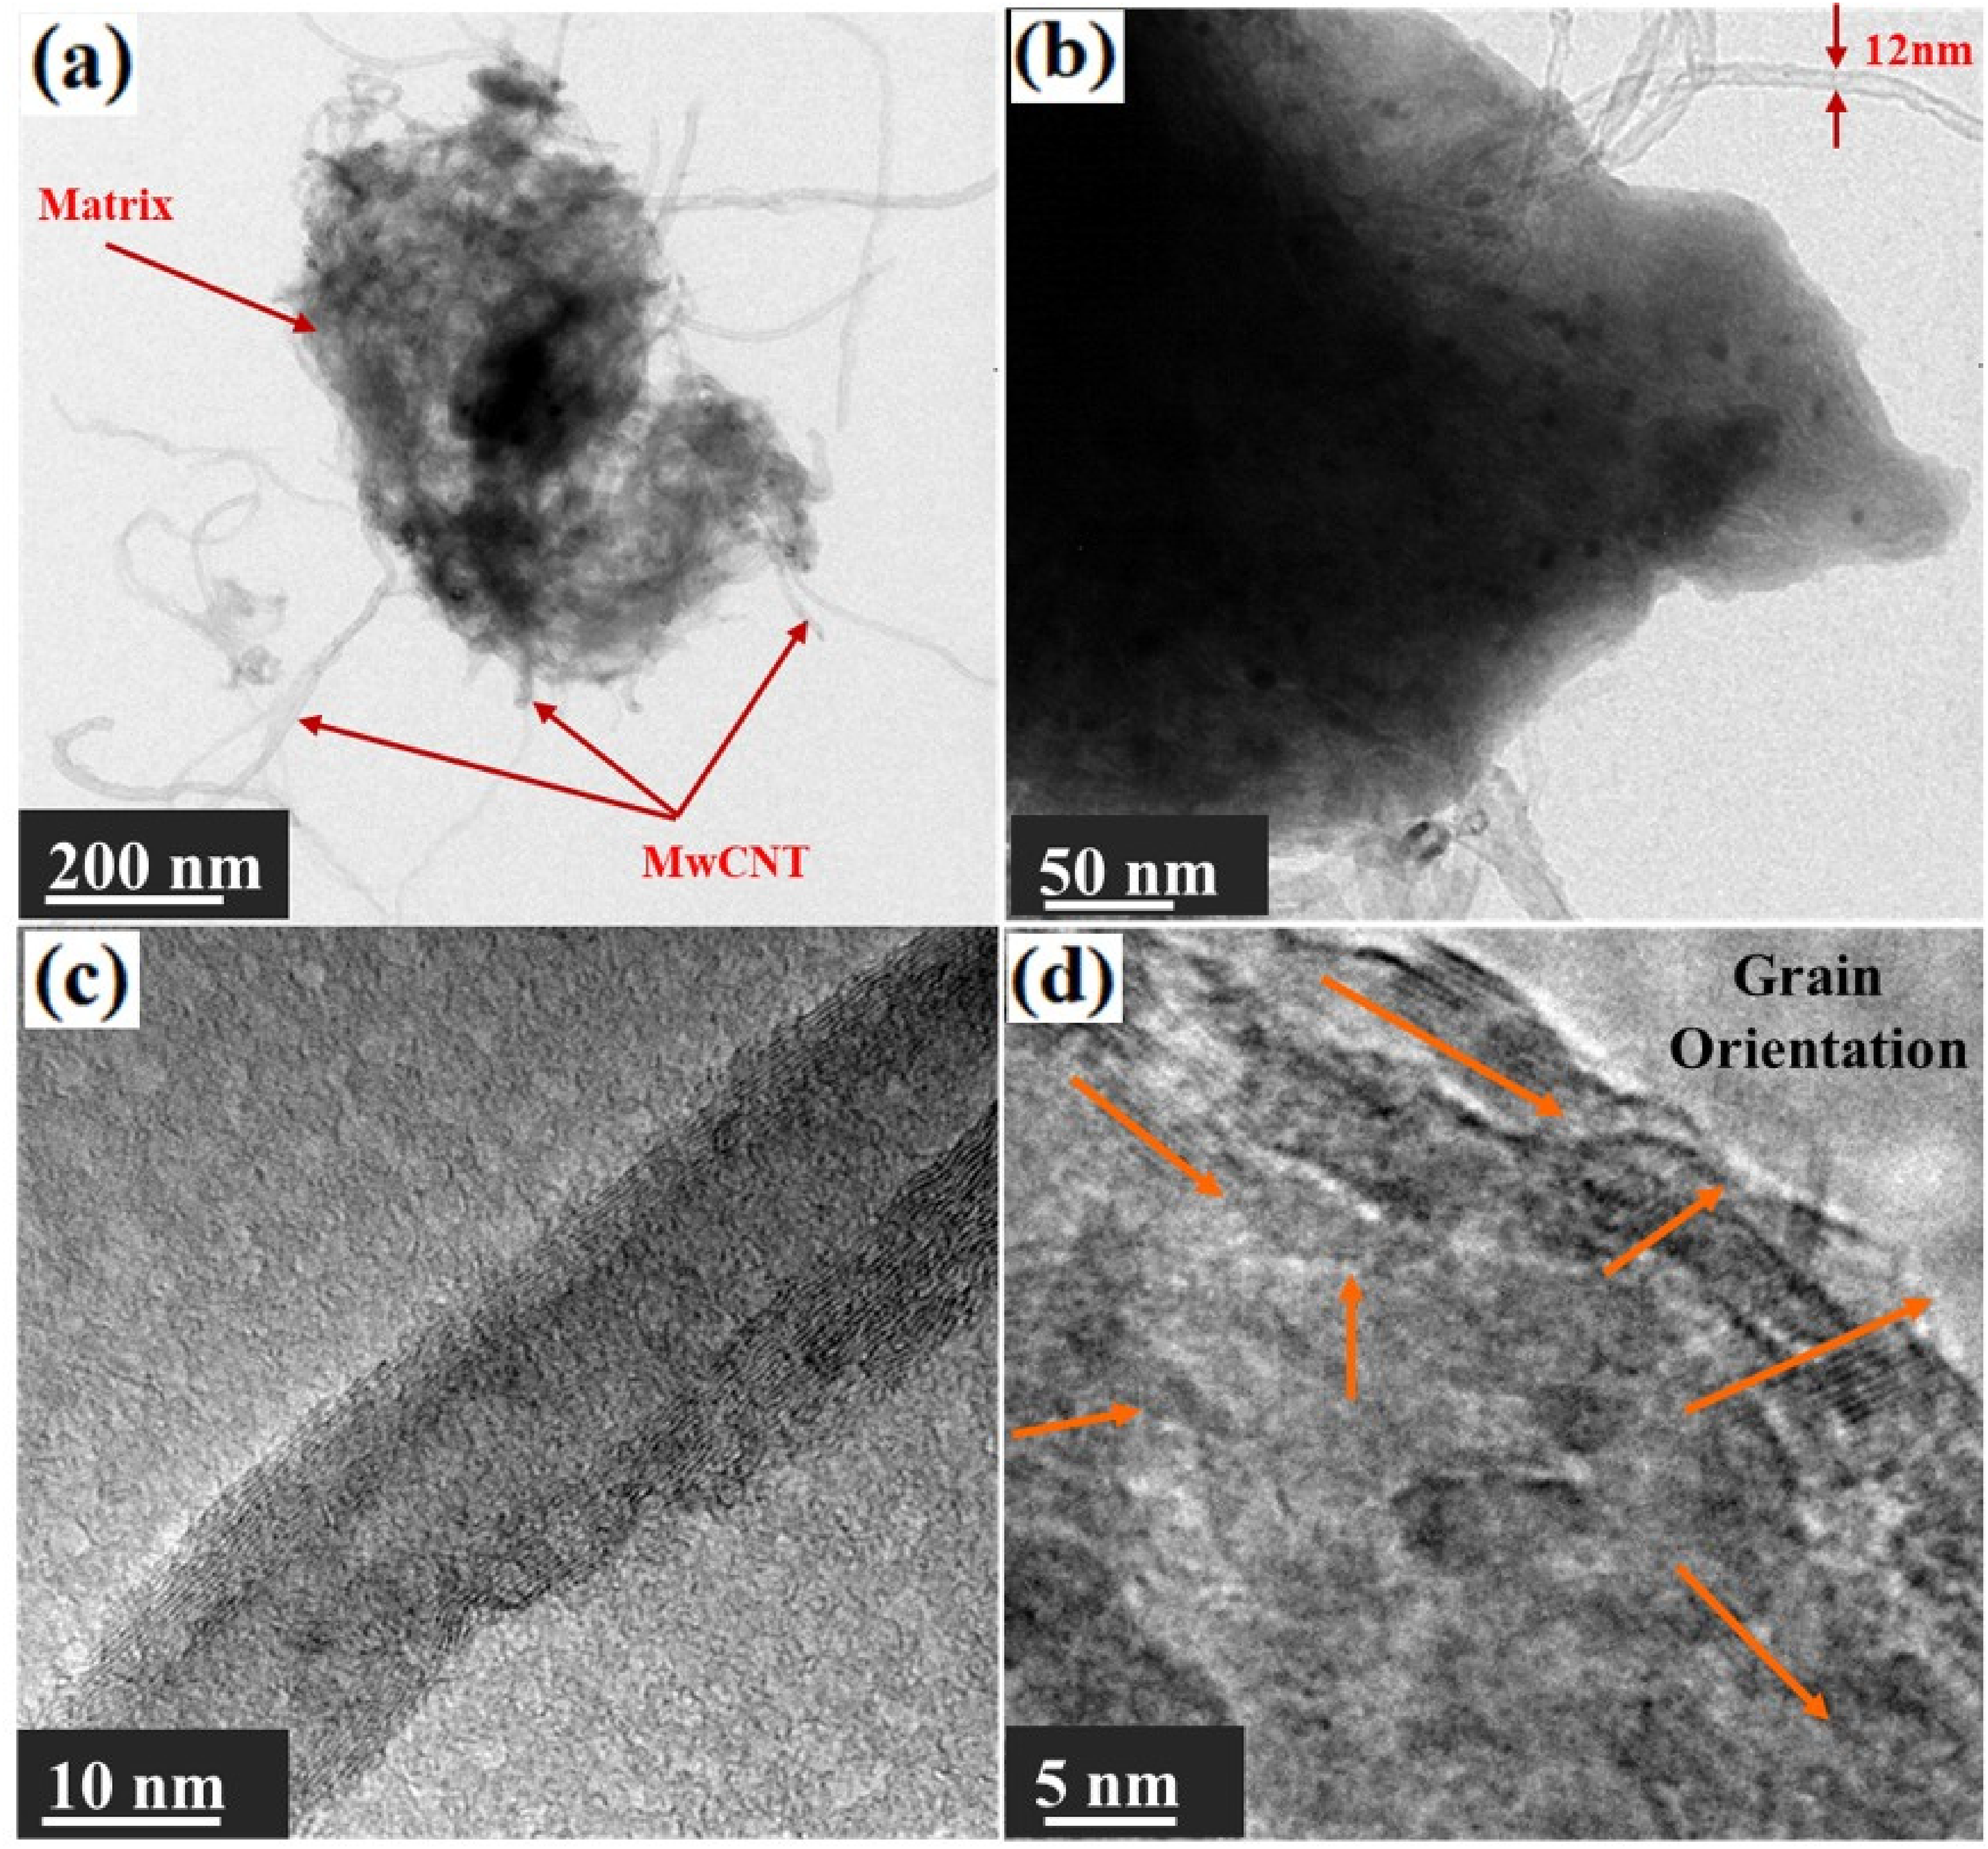
TEM bright field images (a) MWCNT added Fe-Mn-Al-Si-C steel elemental powder after 35 h of milling, (b) magnified TEM bright field image of the same material, (c) shows HR-TEM image of multiwall carbon nanotubes and (d) shows HR-TEM image of MWCNT added low-density steel matrix grain orientation.
The Figure 10(c) shows nanoscale structural features from high-resolution transmission electron microscopy (HRTEM) investigation of the carbon nanotube (CNT) sample. The HRTEM picture shows multi-walled carbon nanotubes (MWCNTs) with concentric graphene layers along the tube axis. Figure 10(c) displays nanotubes with a 20 nm diameter. MWCNTs interlayer spacing between graphene walls may be measured by counting visible layers and measuring their thickness. Approximately 10 layers are visible throughout the 3.4 nm span, with an average interlayer spacing of ∼0.34 nm, aligning with the usual graphite interlayer gap of 0.335 nm, indicating the graphitic nature of MWCNT walls. The straight shape nanotube and uniform diameter imply exceptional structural quality, with no kinks or amorphous carbon deposits. These findings suggest that the MWCNT well-ordered graphitic structure makes it a viable option for high-mechanical strength and electrical conductivity applications.
In Figure 10(d), the high-resolution transmission electron microscopy (HR-TEM) micrograph of the MWCNT added low-density Fe-Mn-Al-Si-C steel shows a well-defined boundary between the CNT and the steel matrix, indicating good interfacial bonding. The lattice fringes along the edges of the multiwall carbon nanotubes suggest a crystalline structure with an interplanar spacing of 0.34 nm, comparable with graphitic carbon normal d-spacing. This nanoscale integration of CNTs into the Fe-Mn-Al-Si-C matrix strengthens low-density steel due to the CNT's reinforcing effect and strong contact with the steel matrix. These findings suggest CNT-added low-density steel might be used in advanced structural applications.
Density
Using Archimedes’ principle, 52 the resulting SPSed pellet has a density of 5.83 g/cm3, much lower than conventional steel (7.85 g/cm3). In this study, lighter elements including aluminium, silicon, carbon, and manganese with low atomic masses diminish density. These factors affect the lattice characteristics of low-density steel, affecting MWCNT-added steel density. Due to its low atomic mass and capacity to extend lattice parameters, aluminium reduces density.3,8 Aluminum features, particularly its lower atomic mass than iron and its influence on lattice expansion in steel's ferrite and austenite phases (both FCC and BCC structures), reduce density. The difference in iron and aluminium atomic densities reduces mass density in these phases, especially as aluminium concentration and ferrite portion grow. Although dislocations and slips cause localized lattice distortions and volumetric expansion, which marginally increase molar volume and reduce density. 60 Their density contribution is secondary to structural and thermodynamic variables.
Figure 11 compares the density of steel alloys with varying aluminium content, showing a clear reduction in density with increasing aluminium addition.23,40,54–56,58,61,62 As shown in Figure 11, most of the reported data exhibit a consistent downward trend in density with increasing aluminium concentration across different studies. The present work represents the alloy studied in this research, which shows a relatively low density of 5.83 g/cm3 at around 15 wt% aluminium, demonstrating the effectiveness of the Fe-Mn-Al-Si-C+CNT alloy composition in achieving a lightweight structure. Compared to other alloys, the present work achieves a favorable balance of density reduction, emphasizing the potential of this composition for applications that require low-density materials.
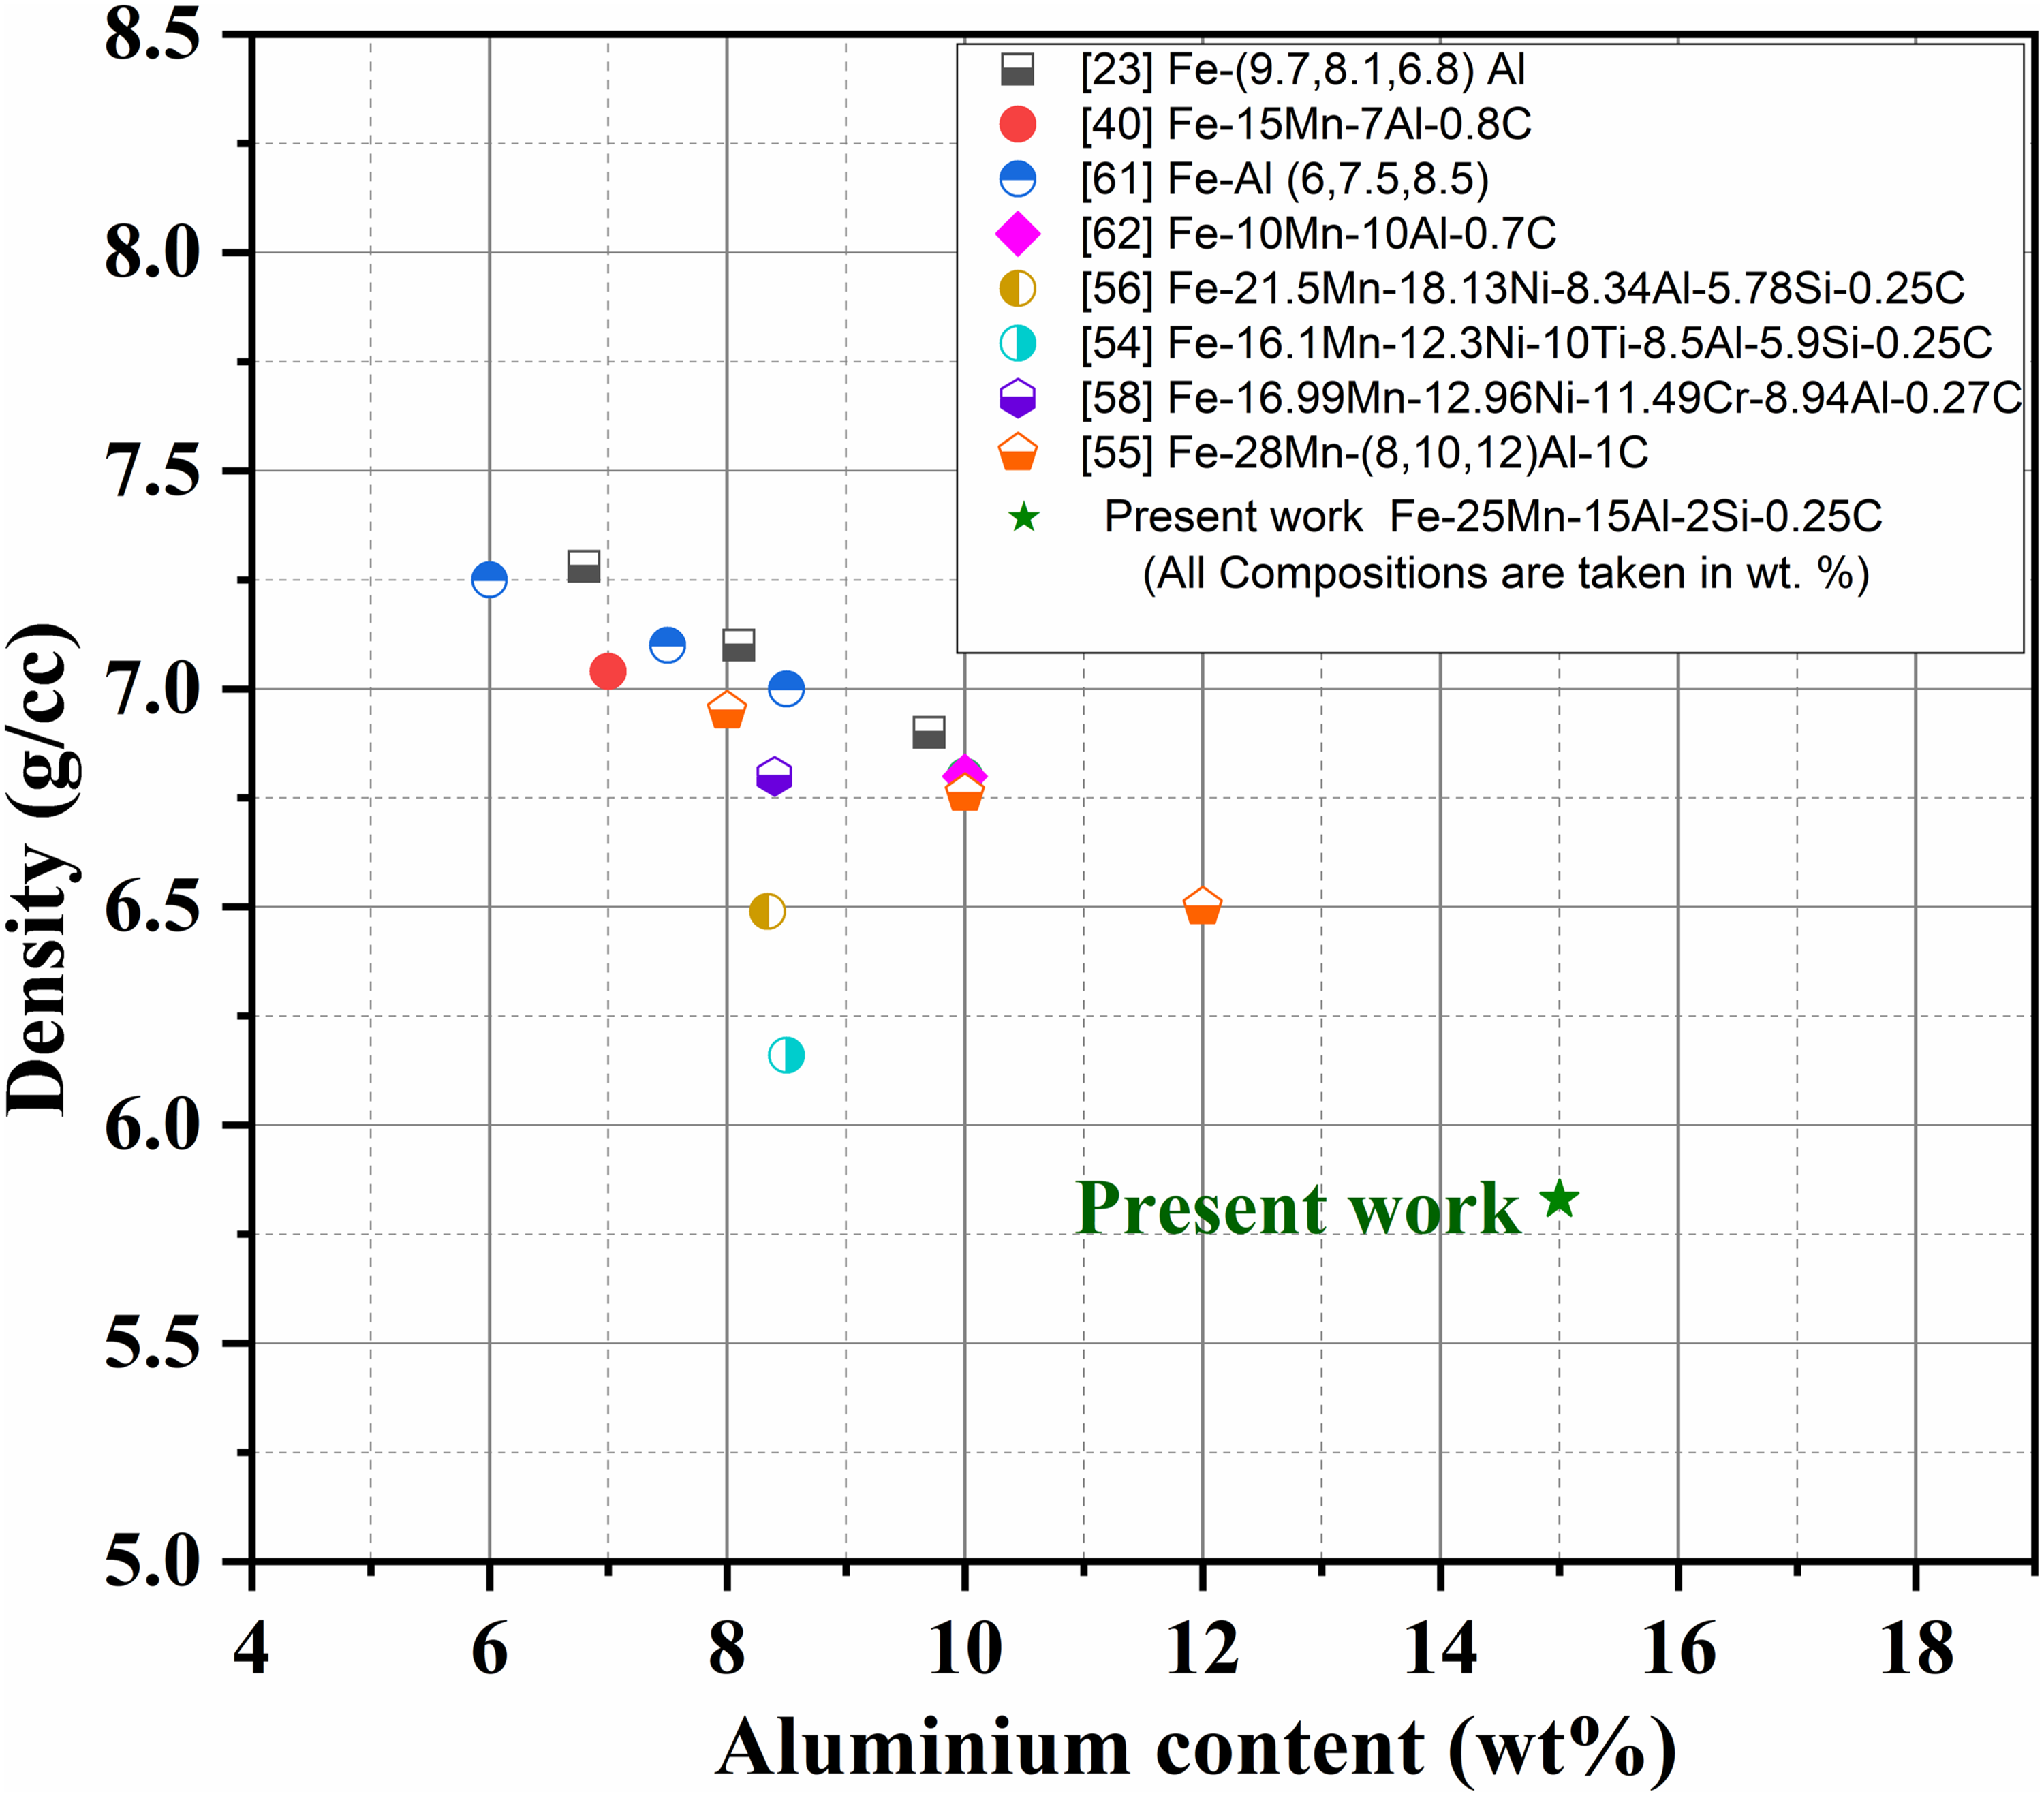
Density versus wt.% aluminium graph of low-density steels with varying aluminium compositions.
Mechanical properties
In low-density steels, mechanical behavior is strongly influenced by alloy chemistry, phase constitution, microstructural refinement, and processing route. Previous studies have shown that the presence of FCC and ordered B2 phases provides a favorable balance between strength and ductility through combined solid-solution strengthening and phase-boundary strengthening mechanisms.4,24,63 Grain refinement induced by mechanical alloying further enhances strength via dislocation strengthening, while advanced consolidation techniques such as spark plasma sintering improve densification and interfacial bonding. 38 The addition of nanoscale reinforcements such as carbon nanotubes has been reported to improve mechanical performance through load transfer, dislocation pinning, and grain-boundary strengthening, provided uniform dispersion is achieved. 50 Therefore, the mechanical properties of the present alloy system result from the combined effects of alloy design, phase stability, microstructural control, and multiwall carbon nanotube reinforcement.
Microhardness
Figure 12(a) and (b) show the indent at the surface of the sample and the corresponding p-h plot of the penetration depth versus indentation load, respectively. The instrumented micro-indentation test results in a hardness of 11 GPa at room temperature and a Young's modulus of 214 GPa. Solid solution strengthening, Orowan strengthening, load transfer from the ductile low-density matrix to the high-stiffness multiwall carbon nanotubes, and Hall-Petch strengthening increase hardness (Bakshi et al. 50 ). During the mechanical alloying and SPS, the interaction between the matrix elements (Si and Mn) and the MWCNTs promotes the localized formation of hard silicides and complex carbides, as evidenced by the XRD data in Figure 3. These hard secondary phases act as additional barriers to dislocation motion. The significant increase in the hardness of the Fe56.75Mn25Al15Si2C0.25CNT1 low-density steel is likely due to several factors, including the formation of a BCC structure, the development of the Fe12C6 intermetallic, and the refined nanostructure. The finely precipitated intermetallic particles exhibit irregular morphologies and are uniformly distributed throughout the matrix, thereby contributing significantly to the enhanced hardness of the alloy. The hardness of the alloy is further enhanced through the homogeneous dispersion of multiwalled carbon nanotubes (MwCNTs) in the matrix, achieved using ball milling for 35 h. This extended milling time ensures that multi-wall carbon nanotubes are evenly distributed throughout the matrix, where they function as effective reinforcement material. 34
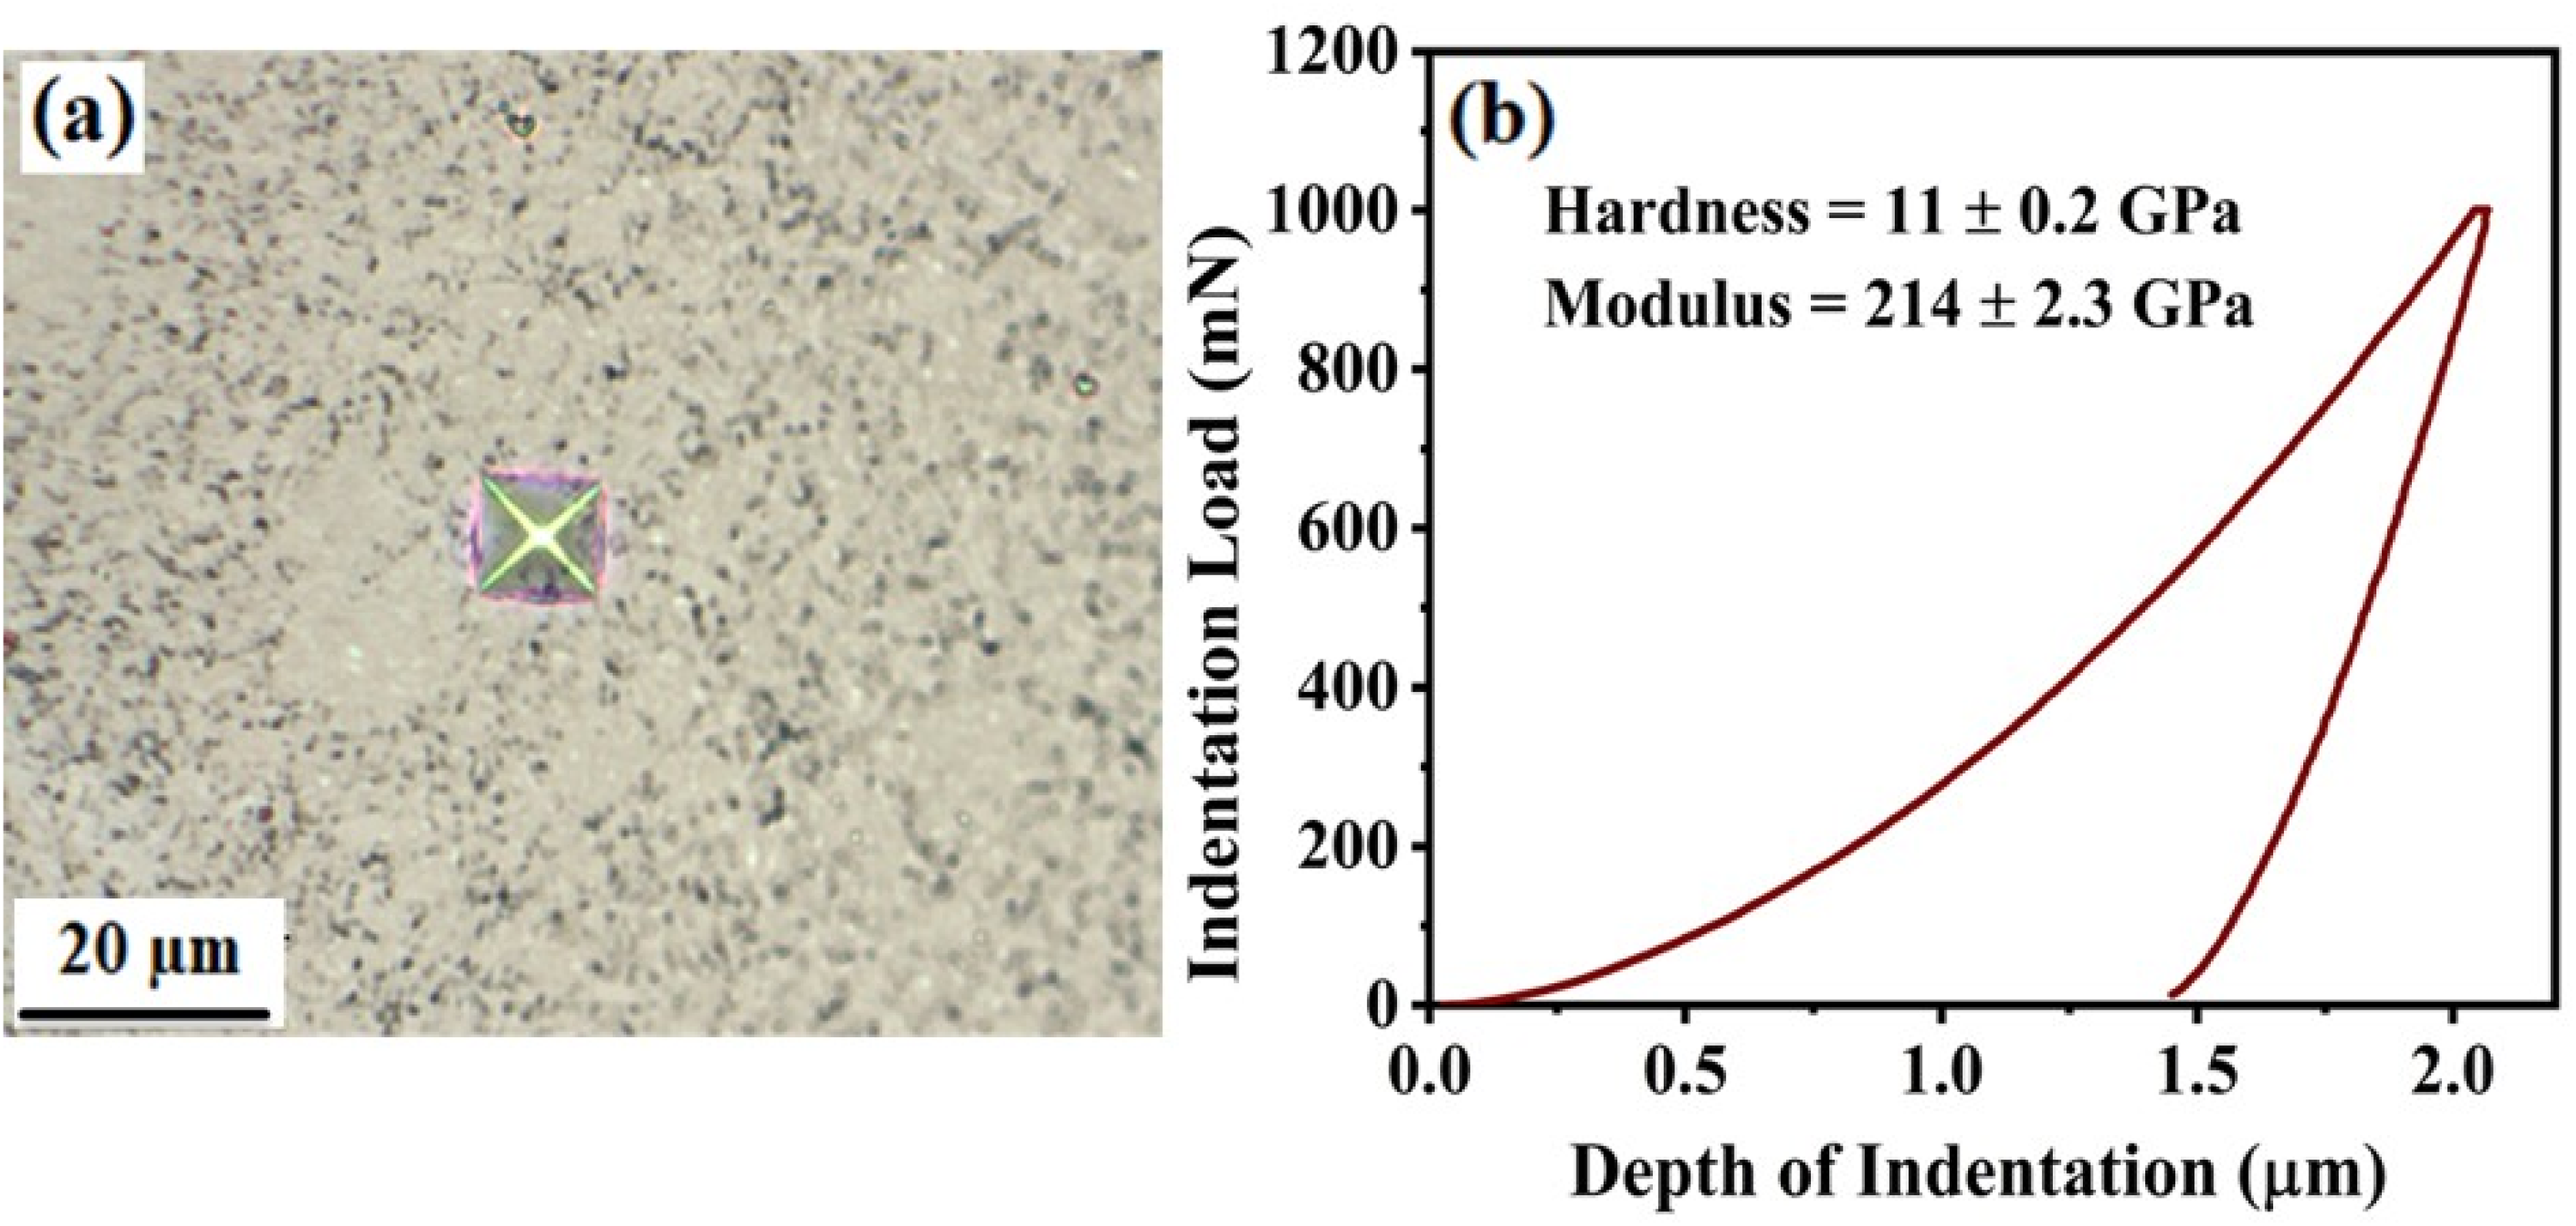
(a) Representative indent mark on SPSed sample at room temperature. (b) Load-penetration depth (p-h) curve obtained from instrumented micro-indentation testing at a maximum load of 1000 mN.
The comparison graph shown in Figure 13 illustrates the relationship between microhardness and density for various steel alloys, highlighting the performance of the present work in comparison to other compositions.6,43,54,56,58
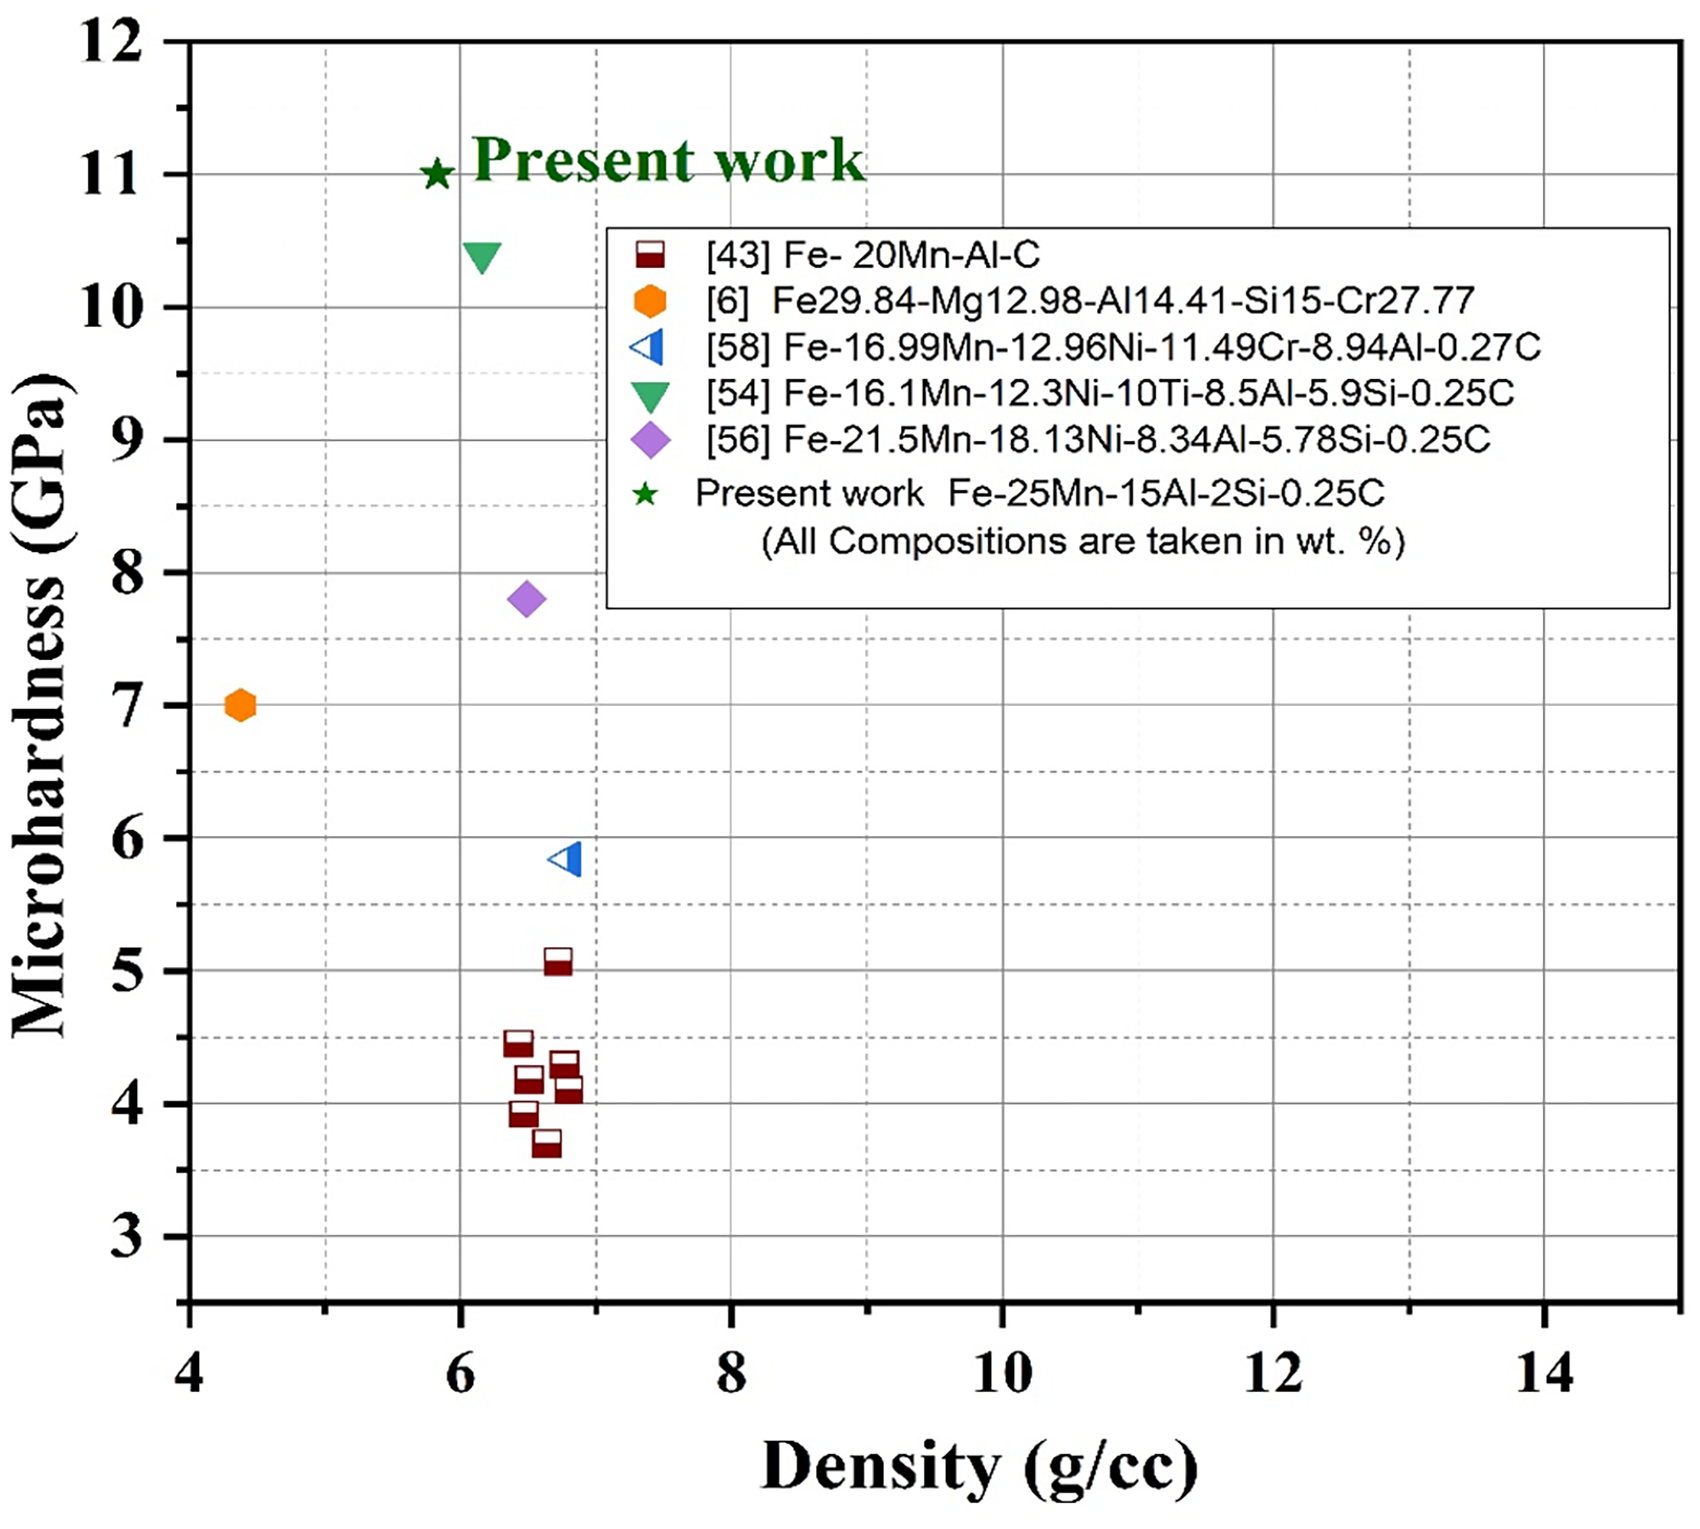
Plot between microhardness versus density of various low-density Fe-Mn-Al-C steel.
The present alloy has a very high microhardness of 11 GPa and a very low density of about 5.83 g/cc. This performance is much better than most other data points, which show lower microhardness values at the same or higher densities. The graph emphasizes the ability of the present work to achieve a remarkable balance between low density and high hardness, showcasing its potential as a lightweight material with enhanced mechanical properties. The incorporation of multiwall carbon nanotubes (MWCNTs), intermetallic compounds, and a nanocrystalline structure likely contributes to the superior performance of the alloy.64,65 This combination of properties positions the present material as a promising candidate for applications requiring both strength and weight reduction, outperforming traditional steel compositions in these key metrics.
The Figure 14 shows Young's modulus vs aluminium (Al) concentration in various steel compositions.23,54,56,61 The present work stands out with the highest Young's modulus of 214 GPa at 15 wt.% Al content, surpassing other alloys. Most of the other compositions exhibit lower modulus values, ranging between 160 GPa and 190 GPa, corresponding to Al contents of 6–10 wt.%. The Young's modulus of present low-density steel can be increased primarily through the incorporation of high-stiffness reinforcements like multiwall carbon nanotubes, enabling efficient load transfer from the matrix to the reinforcement due to their superior elastic modulus (∼1TPa) compared to conventional steel (∼200 GPa).50,66 Strong interfacial bonding enhances this load transfer efficiency and prevents debonding under elastic deformation. Also, reduction in porosity and improved densification increase stiffness by eliminating voids. 66 Minor contributions may arise from grain refinement, although elastic modulus is largely governed by atomic bonding rather than microstructure. The results emphasize the effectiveness of the alloy design in achieving a higher modulus while incorporating significant aluminium content, which is critical for structural and automotive applications requiring rigidity and weight reduction.
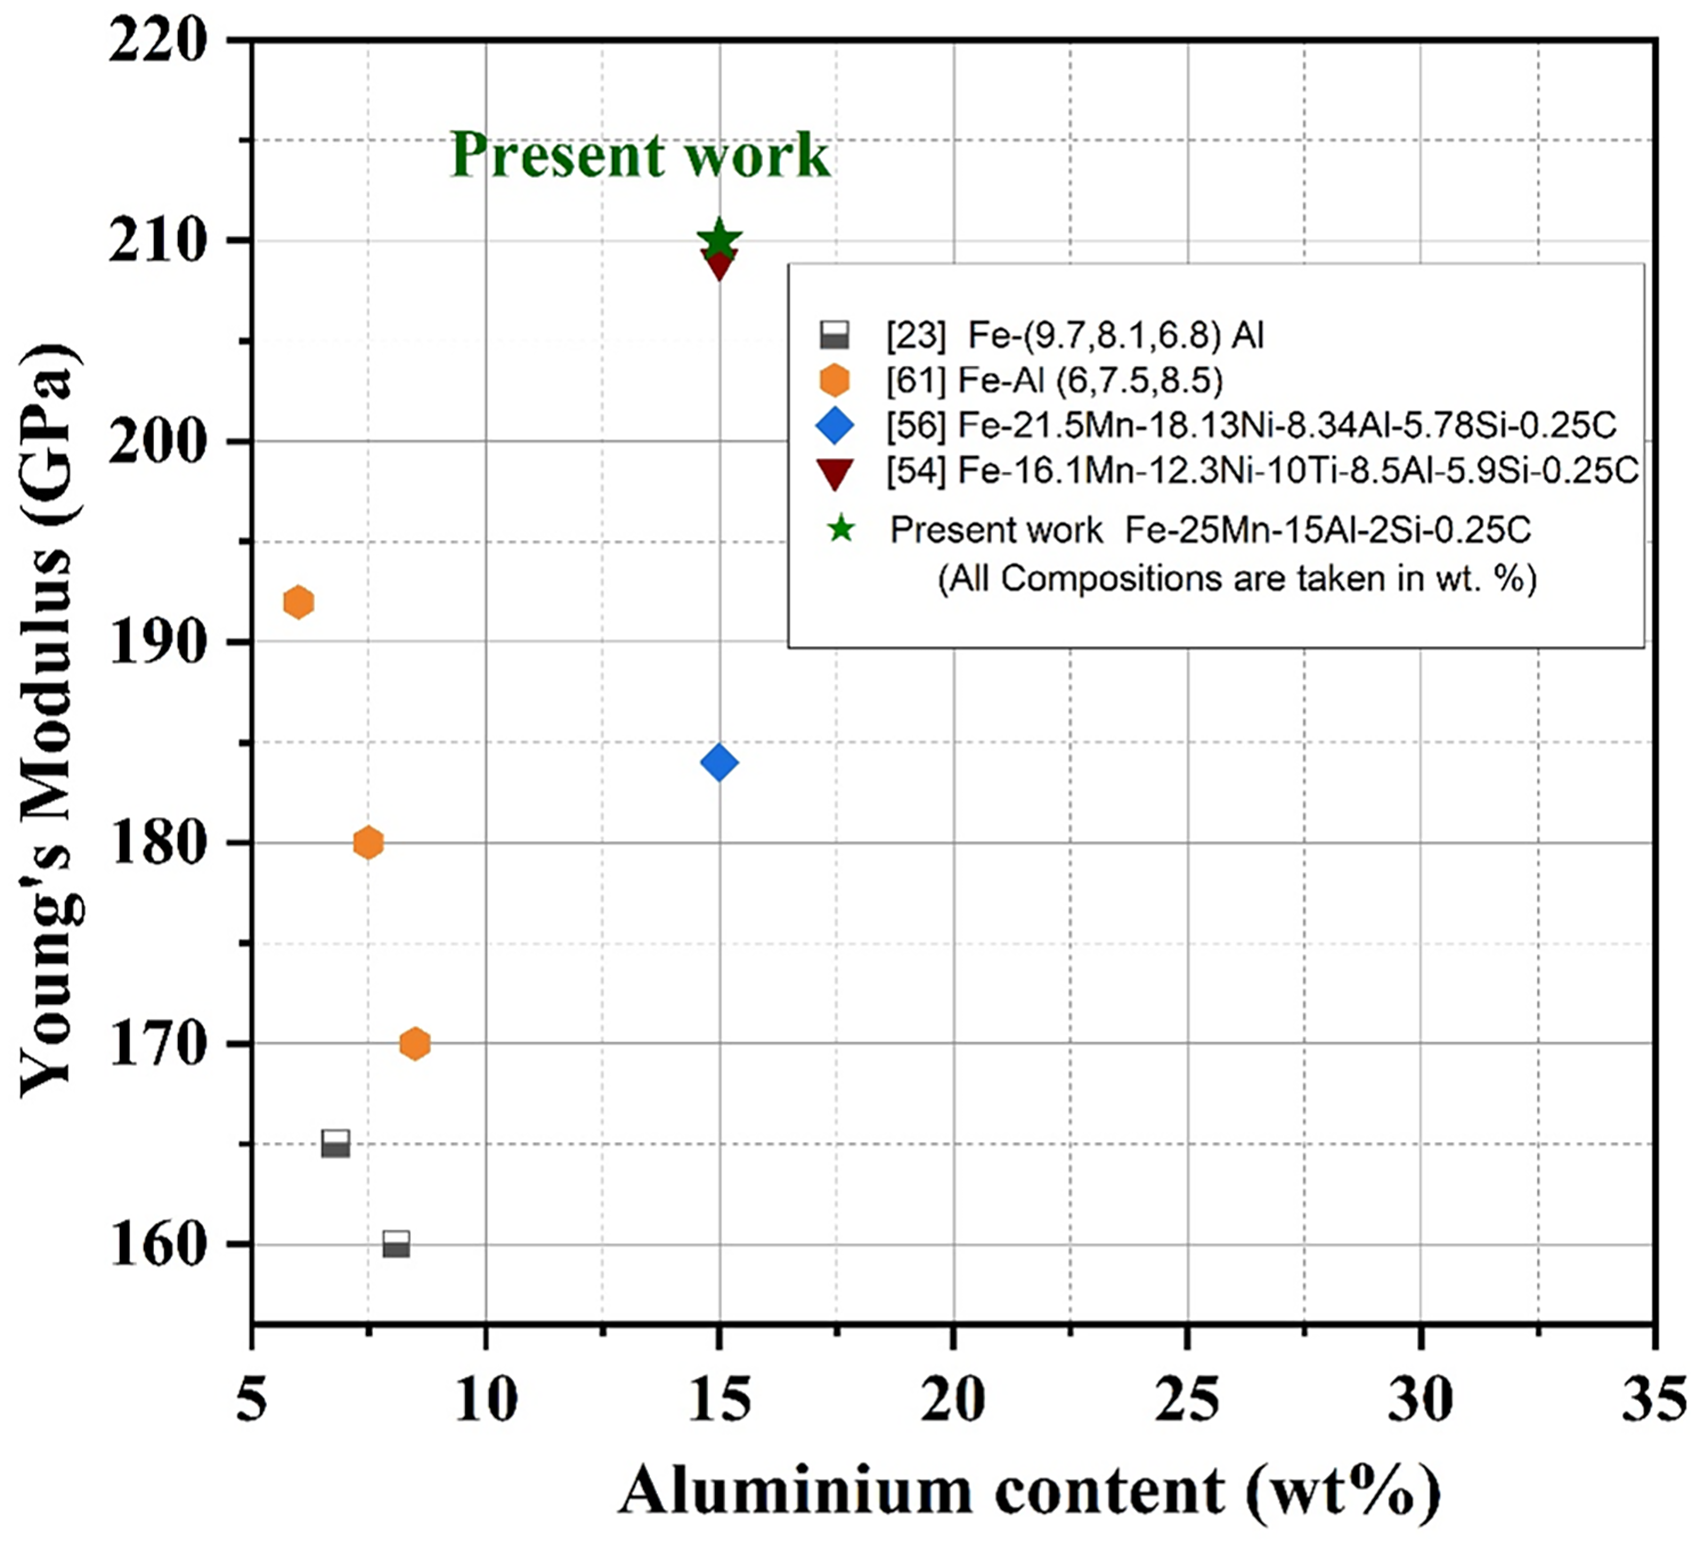
Plot between Young's modulus and aluminium content of various low-density steel.
Compression test
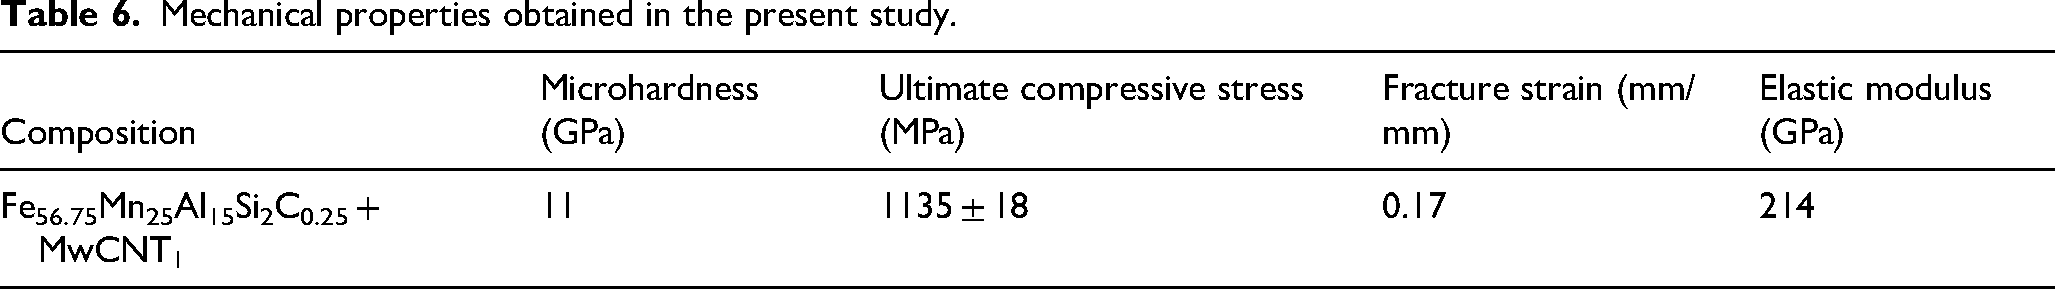
Figure 15 represents the engineering compressive stress versus engineering compressive strain behaviors of the spark plasma sintered Fe-Mn-Al-Si-C-MWCNT steel under uniaxial compression, and mechanical properties are given in Table 6. The initial linear region corresponds to elastic deformation, consistent with Fe-based low-density steels. A smooth elastic-plastic transition is observed without a distinct yield point, indicating continuous dislocation activation and effective solid-solution strengthening by Al and Si. With increasing strain, the alloy exhibits pronounced strain-hardening behaviour, reaching a high peak compressive strength of about 1135 ± 18 MPa. This strong work-hardening response is attributed to grain refinement, high dislocation density, and multiwall carbon nanotubes-induced strengthening mechanisms, including Orowan looping and load transfer. The presence of silicides and carbides phases further impedes dislocation motion, contributing to sustained hardening. Upon closer analysis of the stress-strain curve and the tested specimens, it is observed that in a typical compression test, engineering stress should not decrease solely due to barrelling. The gradual decrease observed after the peak stress (1135 ± 18 MPa) actually signifies the onset of localized internal damage and structural softening. This drop corresponds to the initiation of micro-cracking and shear band localization within the material, which eventually led to a loss of load-bearing capacity. The post-peak softening is a result of progressive damage accumulation and localized deformation rather than geometric effects. Compared with similar Fe-Mn-Al-C-based steel alloys, which typically exhibit compressive strengths in the range of 1000–1500 MPa,67,68 the present alloy also possess a good compressive strength of 1135 MPa and sustained strain-hardening behaviour.
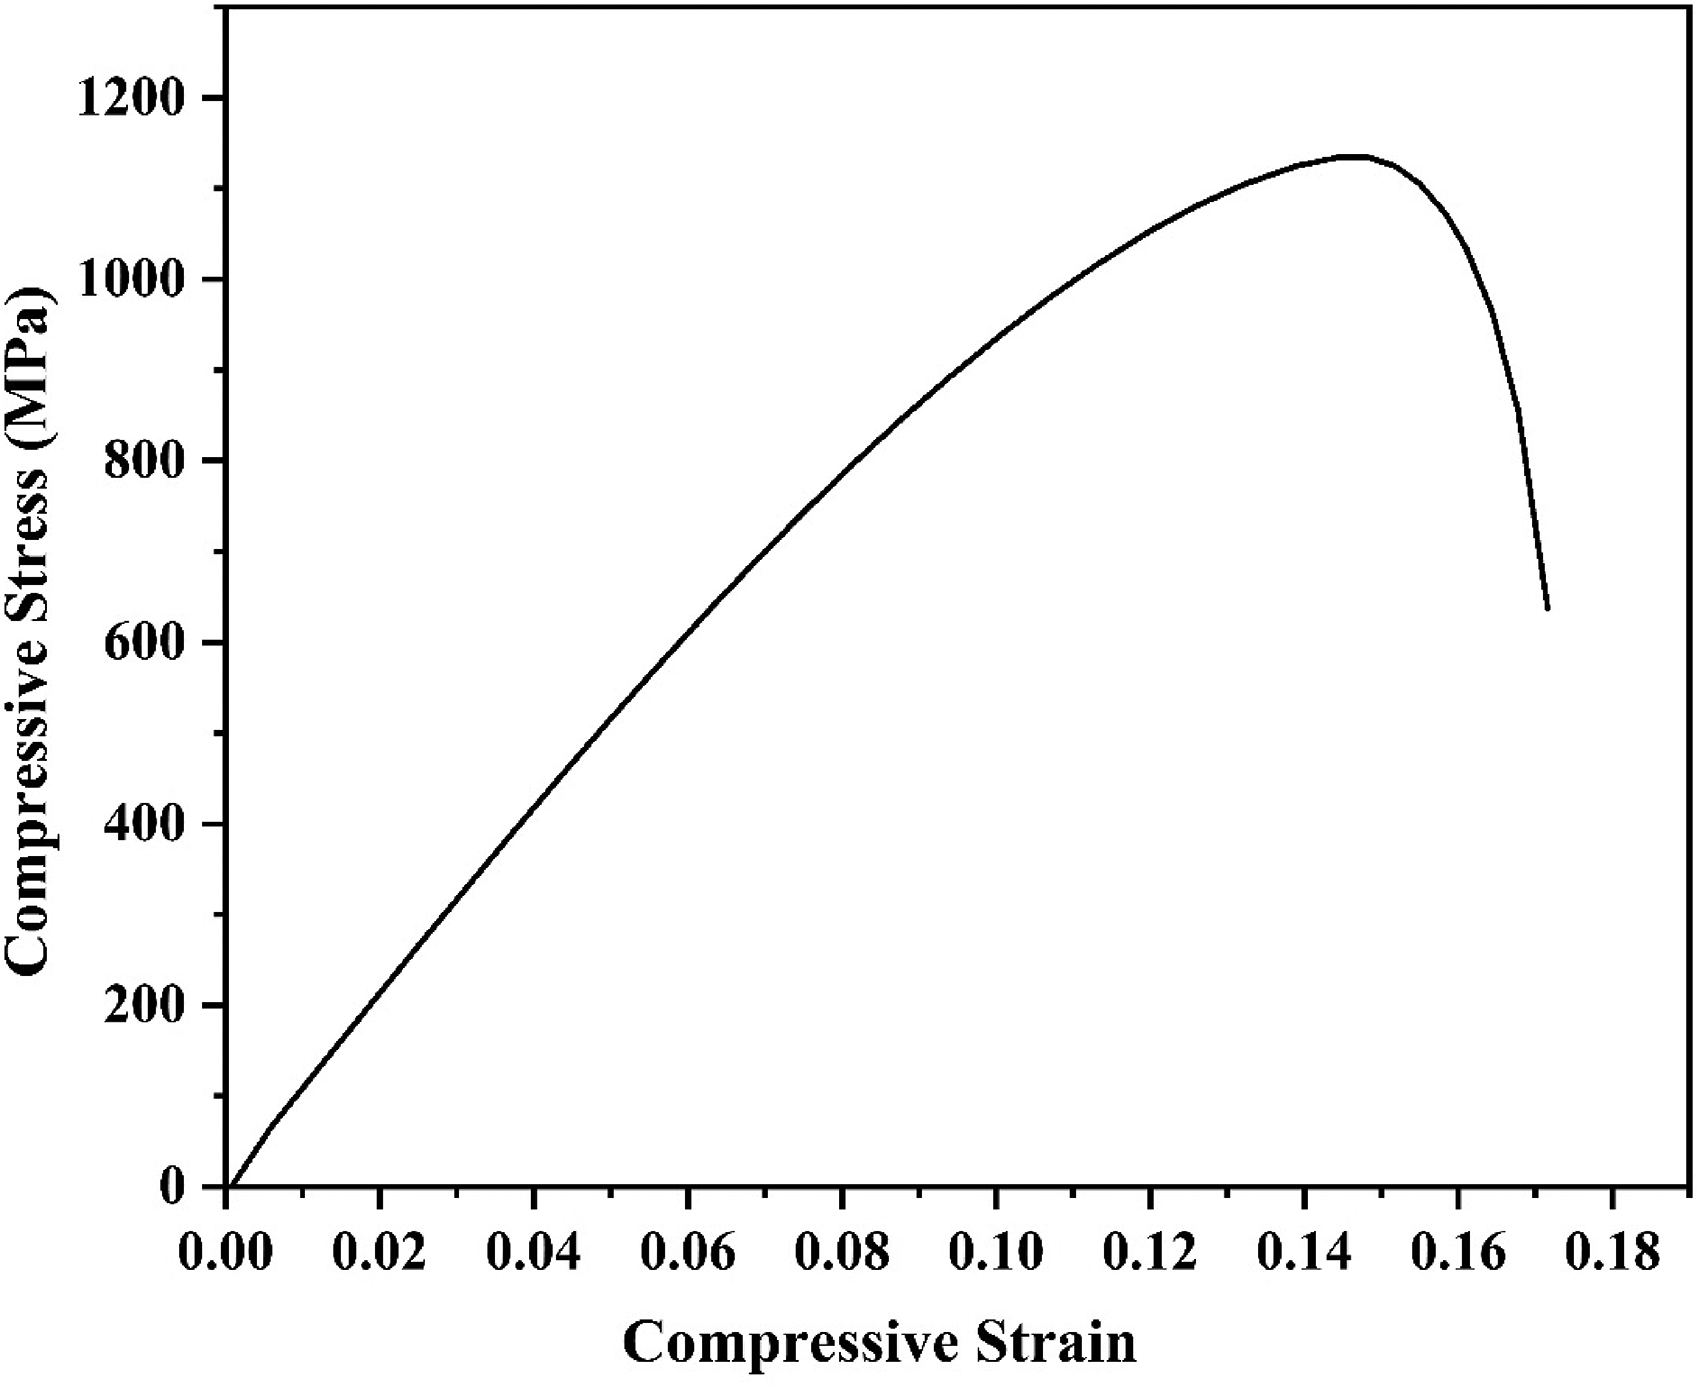
Compressive stress-strain curve of the SPSed sample under compression at room temperature.
Mechanical properties obtained in the present study.
Strain hardening behaviour analysis with different empirical models
The pronounced strain-hardening behaviour observed during compression indicates the strong resistance of the alloy against plastic deformation. To quantitatively analyse this deformation behaviour and evaluate the work-hardening capability of the developed alloy, different empirical constitutive models including Hollomon, Ludwik, and Swift equations were employed. The experimentally obtained true stress-true strain data within the plastic deformation region were transformed into logarithmic form and subjected to linear regression analysis to determine the parameter like strain-hardening exponent (n), strengthening coefficient (K), which indicate work-hardening capability during compressive deformation. Also, the strain-hardening rate was evaluated to understand the evolution of deformation behaviour and the associated strengthening mechanisms.
Hollomon model
To quantitatively describe the strain-hardening behaviour, the plastic deformation region of the stress-strain curve was analyzed using the Hollomon power-law equation69,70:

To determine the material constants, the experimentally obtained true stress-strain data within the plastic deformation region, starting from the yield point up to the maximum applied strain, were mathematically transformed into their logarithmic form, as shown in equation (3). A linear regression analysis was then carried out on the transformed data to obtain the best possible linear correlation with a high coefficient of determination (R2). By comparing the obtained linear equation with the Hollomon relation as shown in Figure 16, the values of the strain-hardening exponent (n) and strength coefficient (K) were determined from the slope and intercept of the fitted line, respectively. 70 The strain hardening exponent n, (slope of curve) and strength coefficient K are calculated as 0.47 and 3354 MPa respectively. The calculated strain-hardening exponent reflects the work-hardening capability of the alloy and indicates significant dislocation multiplication and interaction with CNT reinforcements during deformation. A relatively high value of the strain-hardening exponent suggests that the alloy maintains a strong resistance to localized deformation.
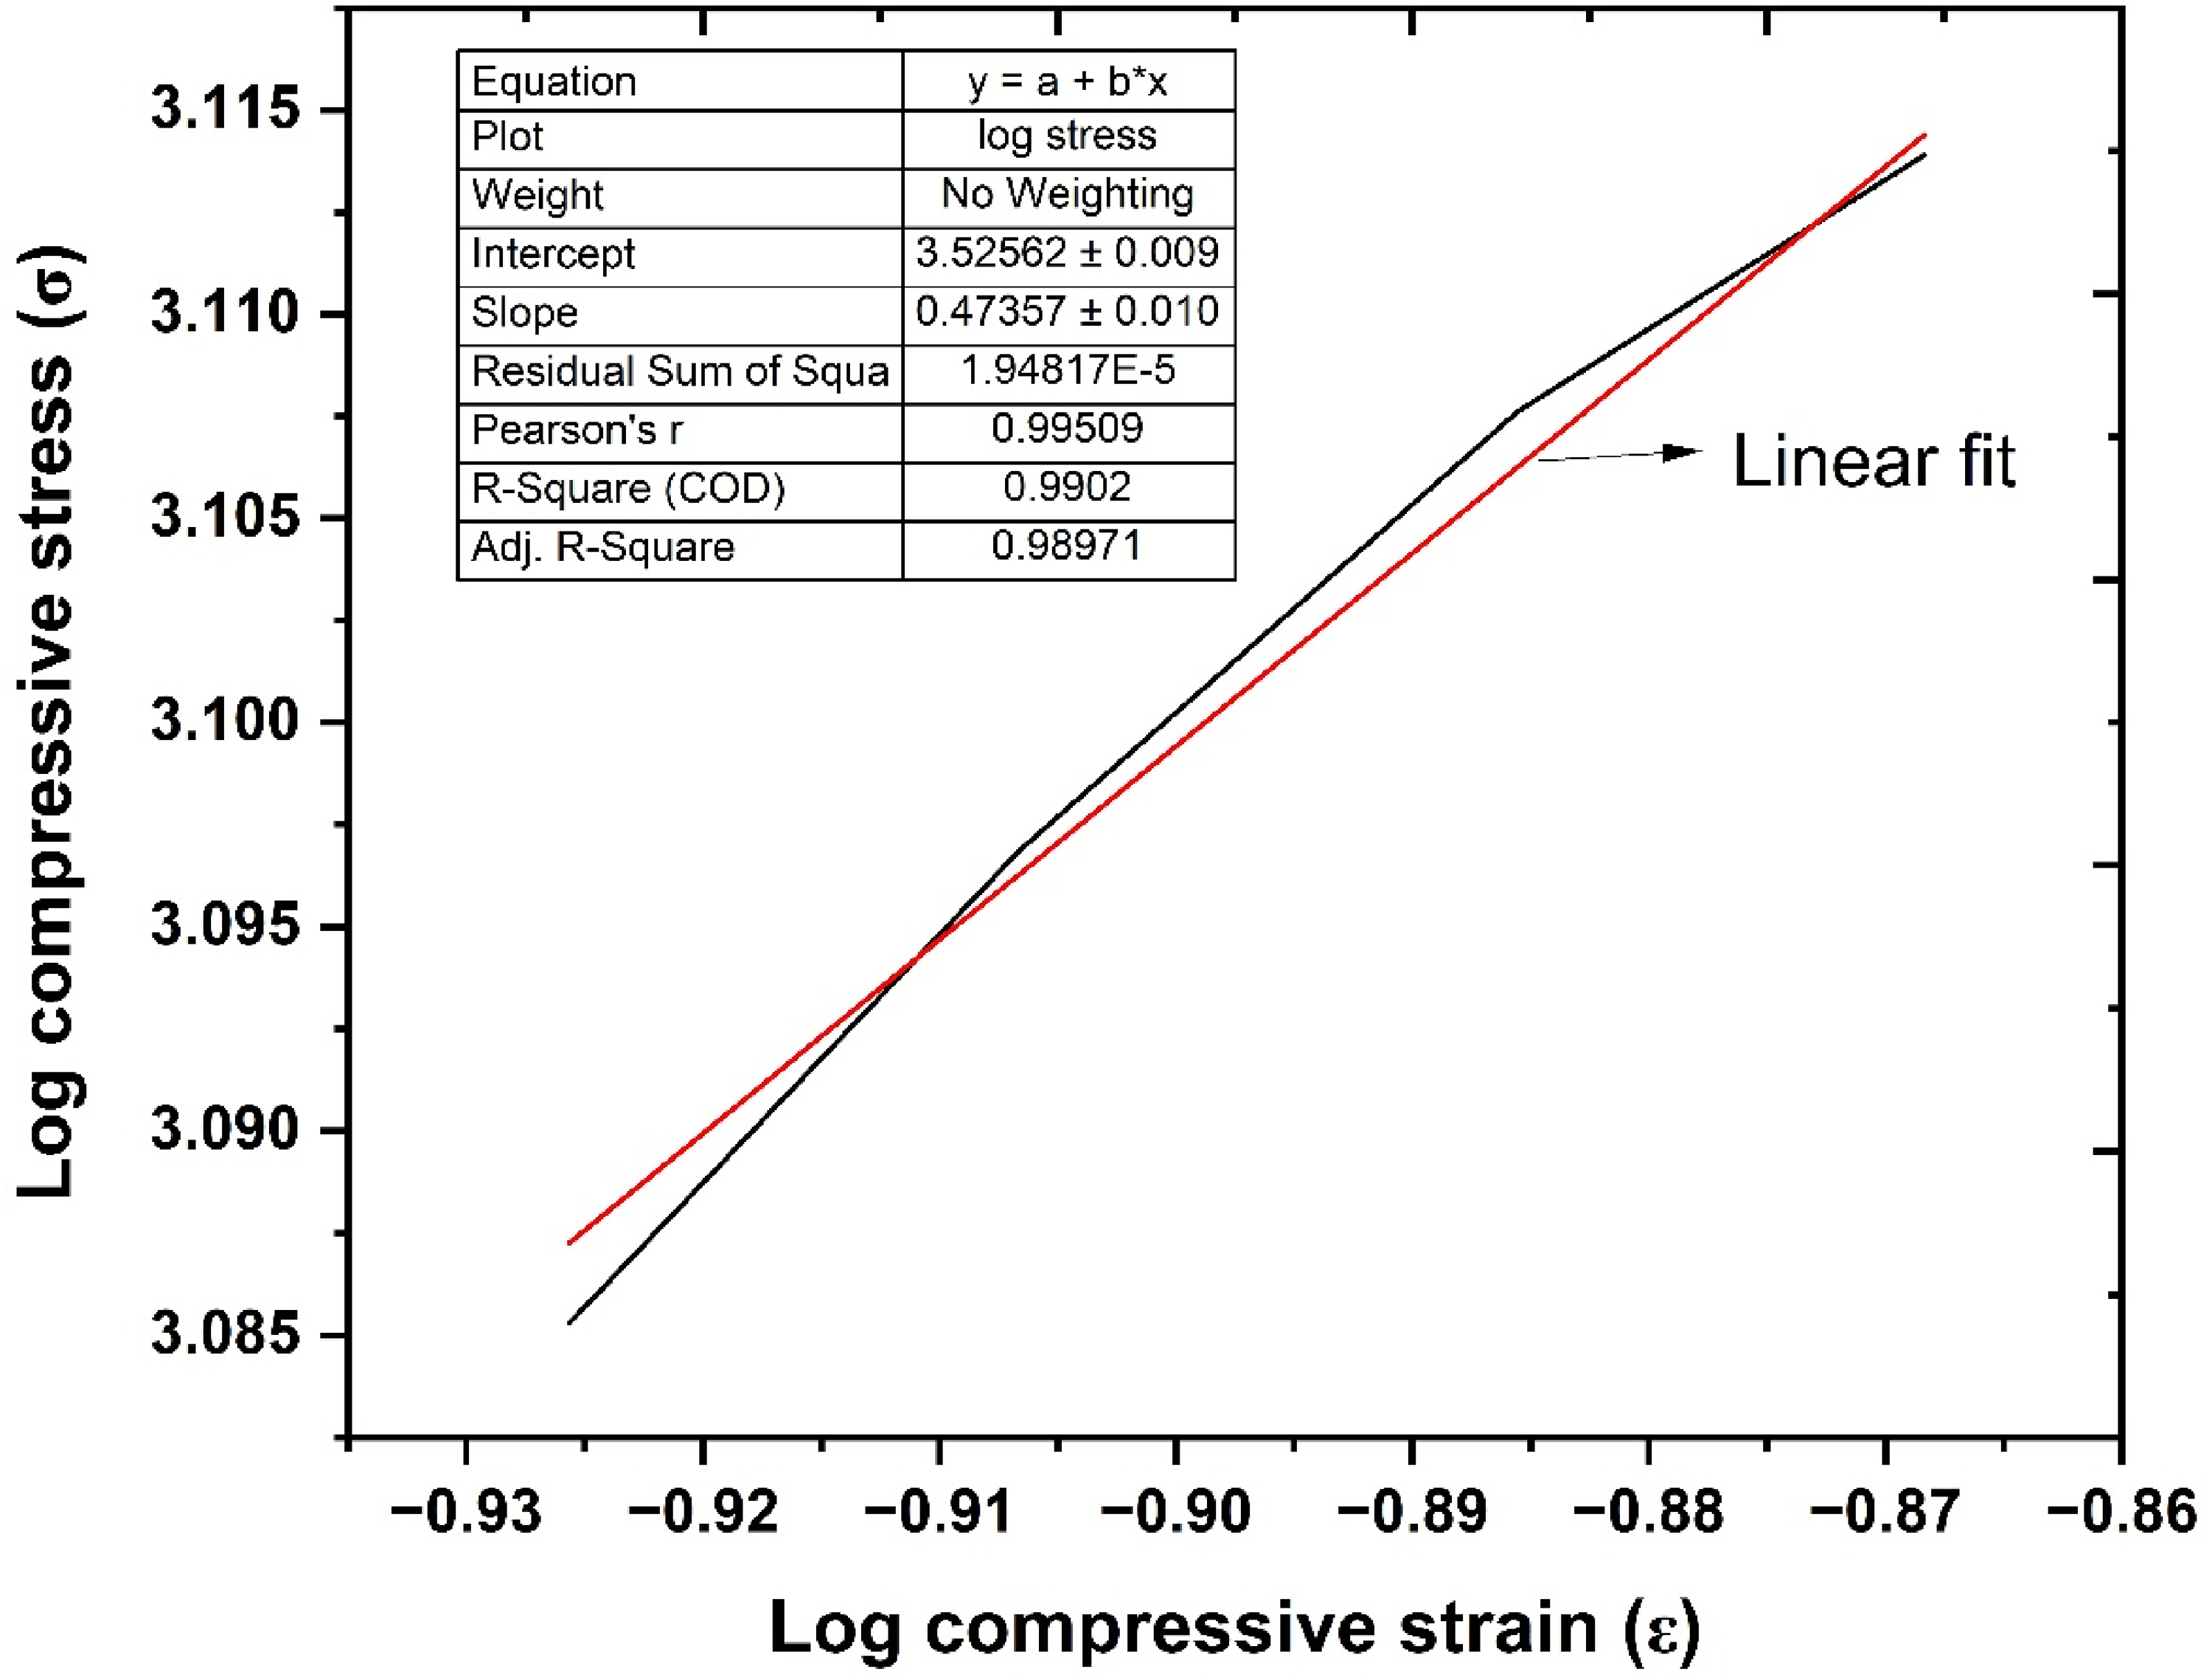
Logarithmic representation of compressive stress versus compressive strain.
Ludwik model
Ludwick model
71
widely used to describe the strain-hardening behaviour of metallic materials during plastic deformation. It establishes a mathematical relationship between true stress and plastic strain and is particularly useful for analysing the work-hardening characteristics of alloys subjected to compressive loading. The equation (4) represents the Ludwick model
71

Here, σ is the true stress, σy is the yield stress, ɛ is the true plastic strain, n is the strain-hardening exponent, and K is the strength coefficient.
On rearranging the above equation,
Taking logarithm on both sides, the standard Ludwick equation can be expressed in a linear form as:
The strain-hardening behaviour of the developed alloy was further analyzed using the Ludwik constitutive model. By rearranging the Ludwik equation into logarithmic form as shown in equation (5), a graph is plotted between log (σ-σy) and log(ɛ) represented in Figure 17. The experimental data demonstrates an exceptional fit to the model with a correlation coefficient (R2) of 0.994, indicating that the Ludwik relationship accurately describes the plastic flow of this alloy. The extracted strain-hardening exponent (n) of 0.55 signifies a remarkably high work-hardening capacity. The elevated strain-hardening exponent can be attributed to the synergistic interaction between multiwall carbon nanotube-induced dislocation barriers and solid-solution strengthening arising from the high aluminium content. The carbon nanotubes serve as potent pinning sites that effectively hinder dislocation glide, forcing the formation of dislocation loops and generating significant back-stress. This results in a sustained rate of dislocation accumulation throughout the plastic regime, which not only accounts for the high “n” value but also explains the alloy ability to resist localized deformation and achieve a high ultimate compressive strength.
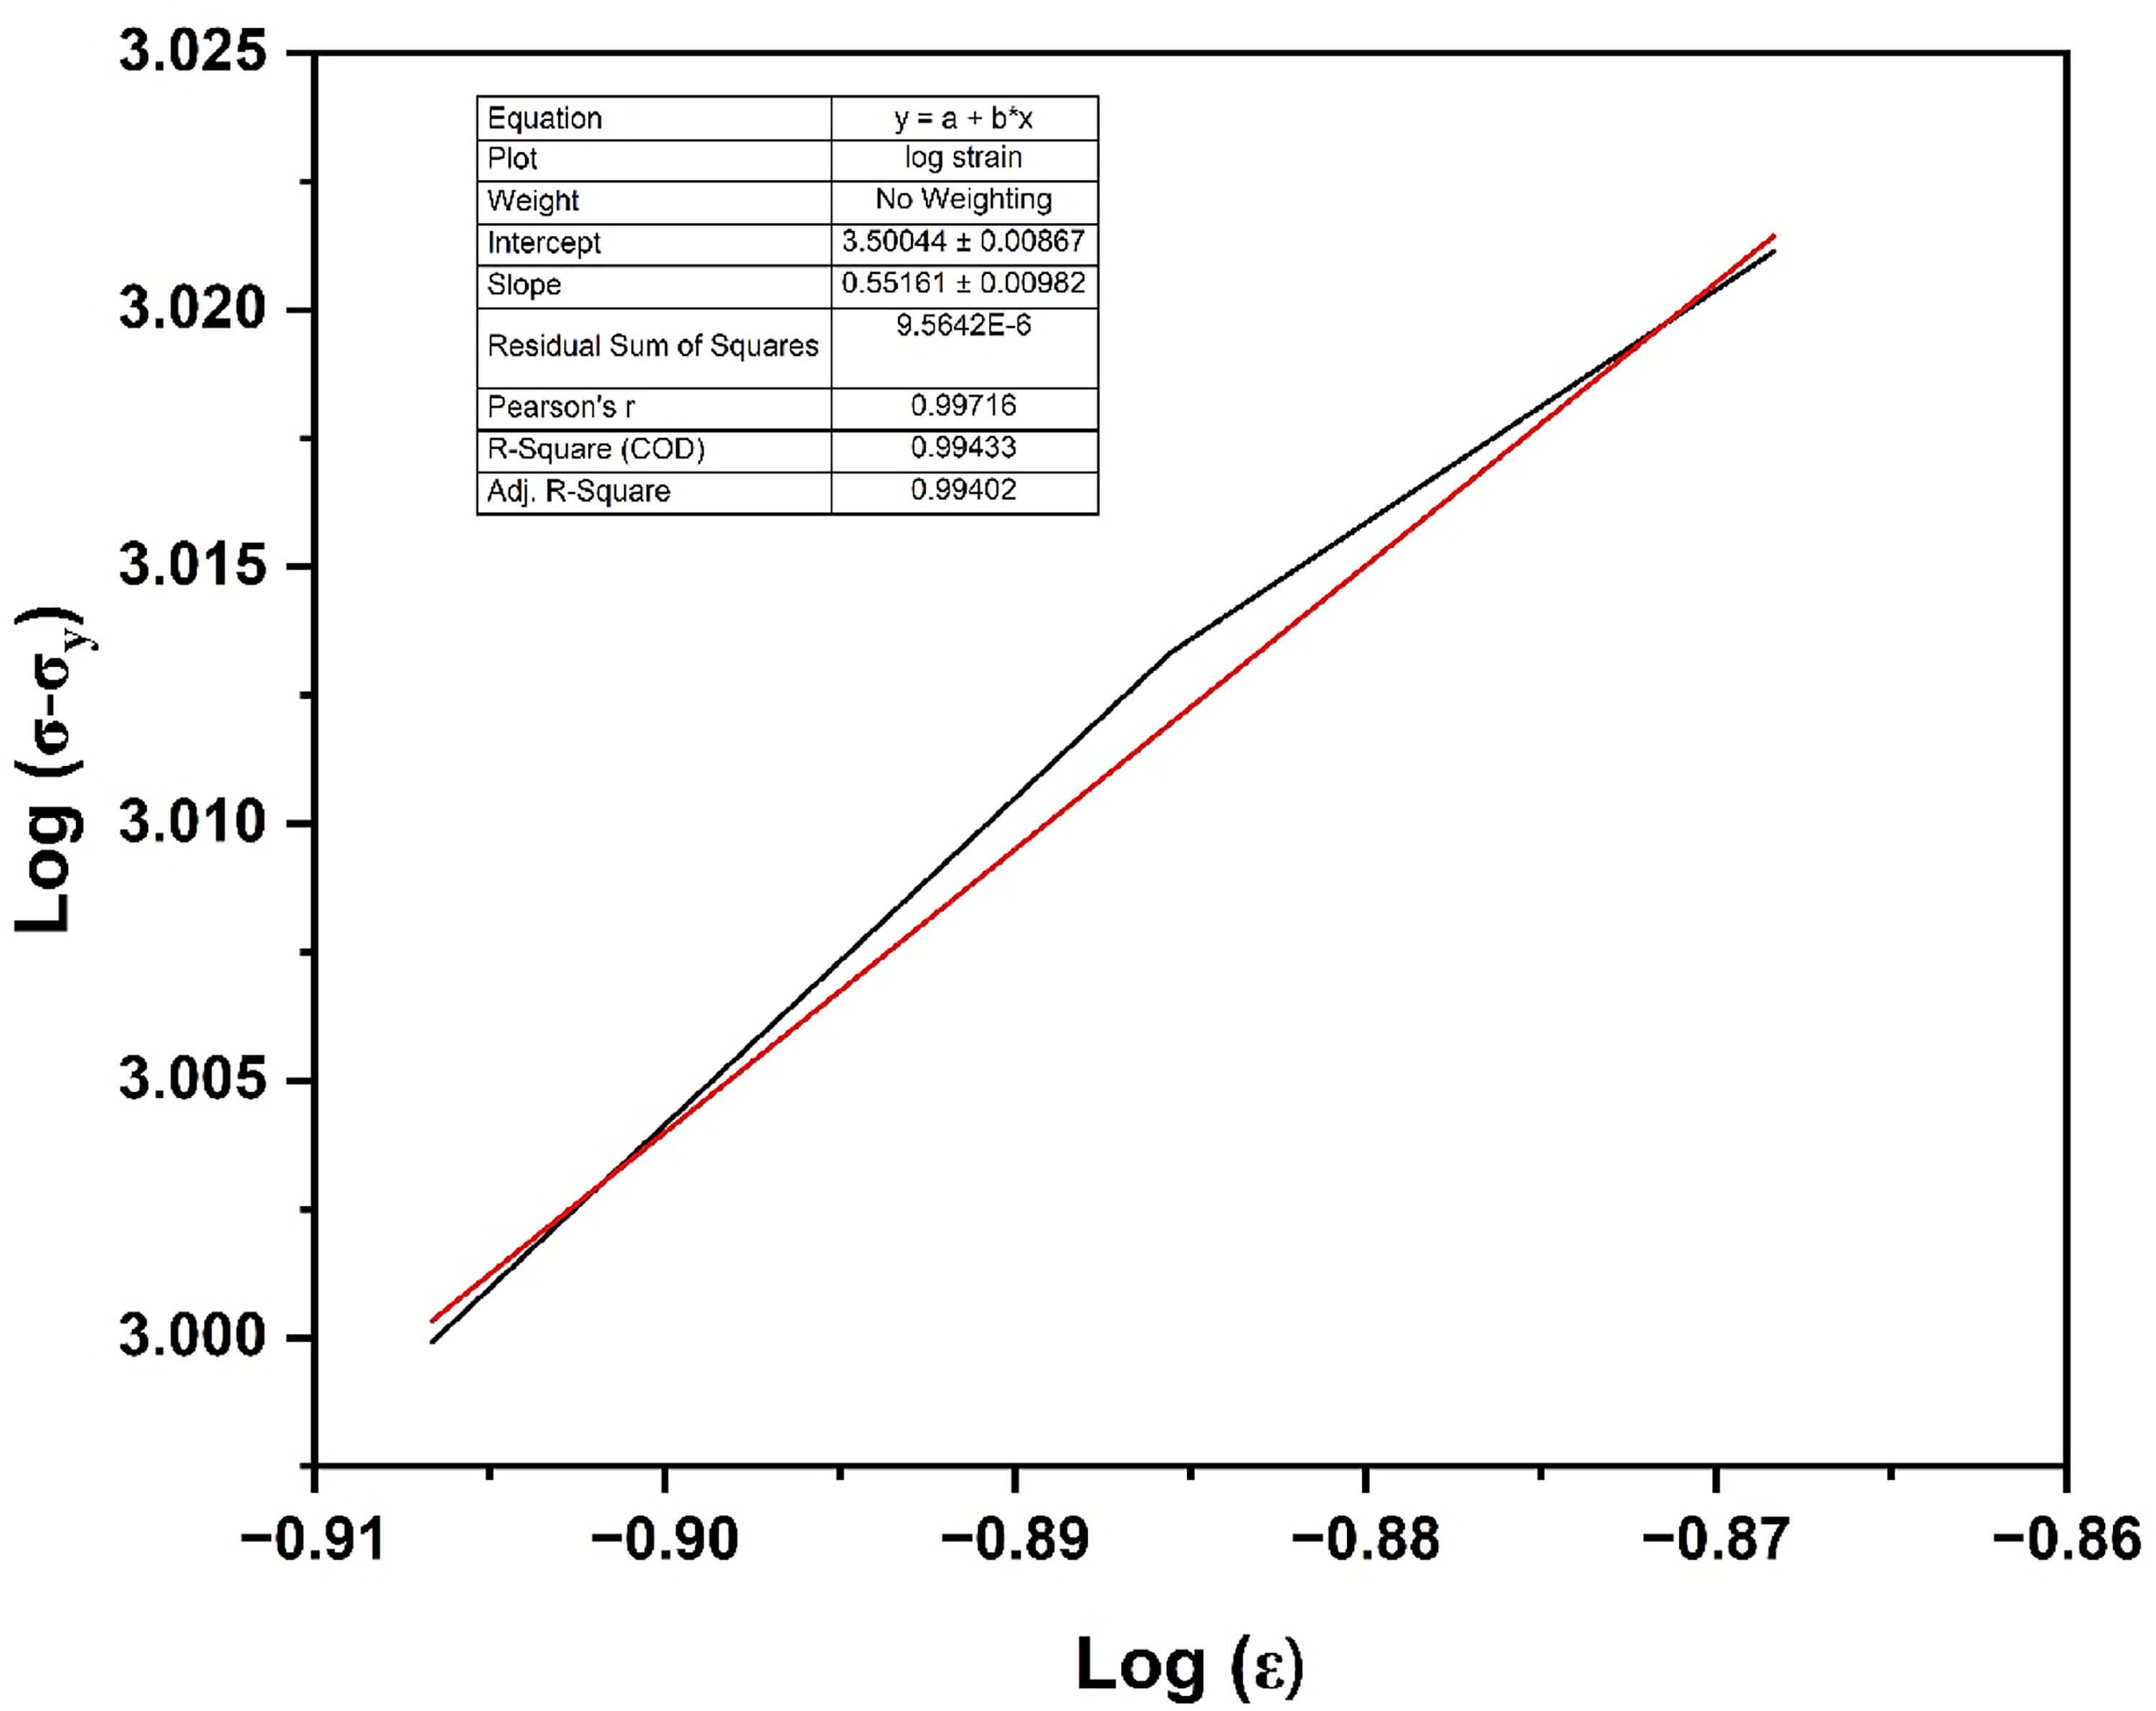
Logarithmic representation of compressive stress-strain behaviour according to the Ludwik constitutive model.
Swift model
The Swift model
71
is a widely used constitutive equation employed to describe the plastic deformation and strain-hardening behaviour of metallic materials. Unlike the Hollomon model, the Swift model incorporates a pre-strain ɛ0, which improves the prediction accuracy at low strain regions and during continuous plastic deformation. The equation (6) written below represents swift model
71

Taking logarithm on both sides, the Swift equation can be expressed in a linear form as:
In this model, the experimentally obtained true stress-true strain data were used for the fitting of Swift model as represented by equation (7). A pre-strain value of 0.002 was used in the Swift constitutive analysis and their logarithmic plot, log (σ) and log(ɛ+ɛ0) is shown in Figure 18.
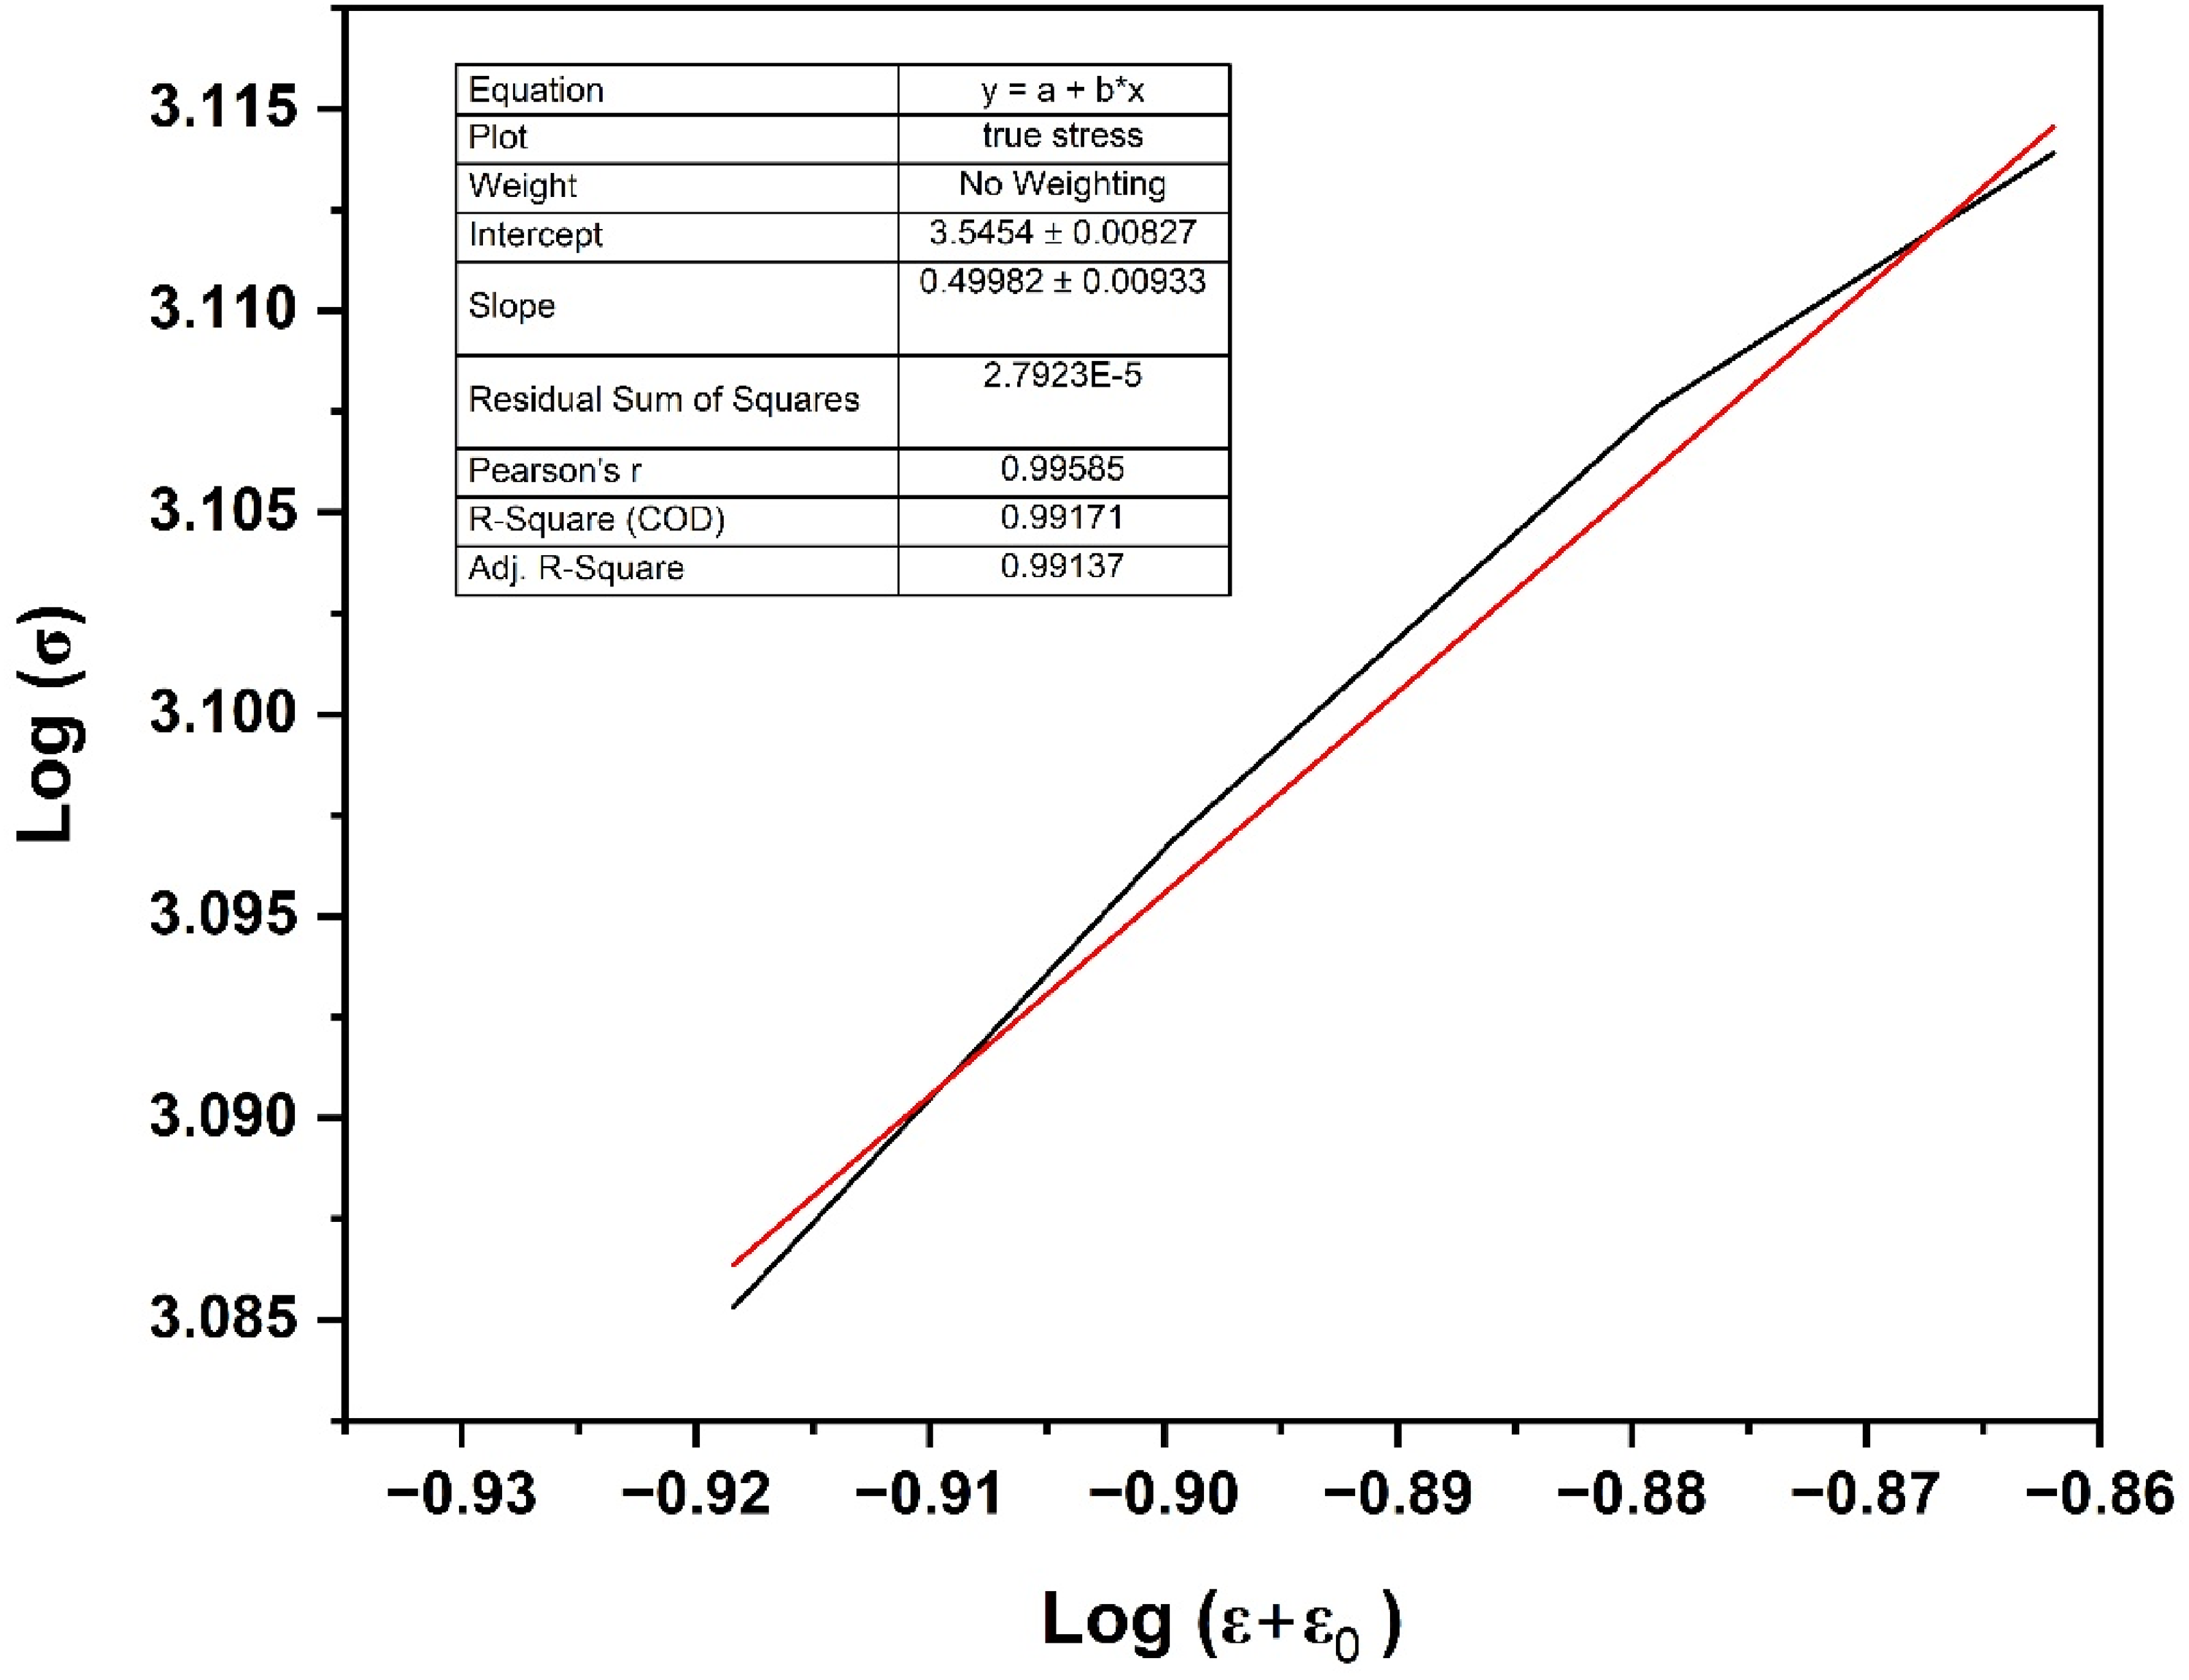
Logarithmic representation of compressive stress-strain behaviour according to the Swift constitutive model.
The linear fitting exhibited excellent agreement with the experimental data, as evidenced by the high correlation coefficient (R2 = 0.9917) indicating the suitability of the Swift model for describing the compressive deformation behavior of the alloy. The strain-hardening exponent (n) and strength coefficient (K) were determined from this model as 0.49 and 3510.7 MPa, respectively. The obtained higher strain hardening exponent (n) value suggests significant work-hardening and enhanced resistance to plastic deformation during compression. The incorporation of the pre-strain (ɛ0) in the Swift equation improved the fitting accuracy, particularly in the low strain deformation region, thereby providing a more realistic representation of the strain-hardening behaviour.
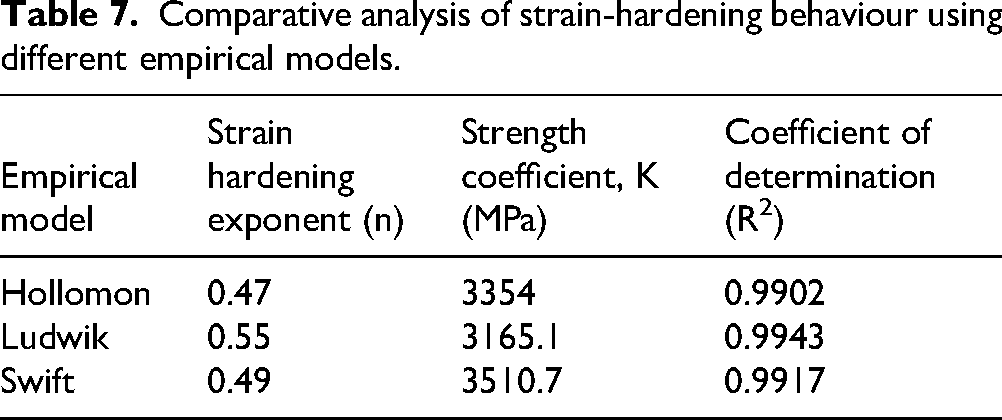
Table 7 presents the comparative analysis of strain hardening exponent (n), strength coefficient (K), and correlation coefficient (R2) obtained from different empirical constitutive models. The Hollomon, Ludwik, and Swift models exhibited excellent agreement with the experimental compression data, as indicated by the high (R2) values exceeding 0.99. Among the employed models, the Ludwik model showed the highest fitting accuracy (R2 = 0.9943), suggesting its better suitability for describing the compressive deformation behaviour of the developed alloy. The variation in the strain-hardening exponent (n) and strength coefficient (K) among different models may be attributed to the incorporation of yield stress and pre-strain terms in the Ludwik and Swift equations, respectively. The relatively higher strain hardening exponent (n) values obtained from all models indicate significant work-hardening capability and enhanced resistance to plastic deformation during compression.
Comparative analysis of strain-hardening behaviour using different empirical models.
Strain hardening rate analysis
Although the empirical constitutive models effectively describe the overall plastic deformation behaviour, further insight into the evolution of deformation resistance during compression can be obtained through strain-hardening-rate analysis. Therefore, the variation of strain-hardening rate with true compressive strain was investigated to better understand the deformation and strengthening mechanisms functioning in the developed alloy. Figure 19 illustrates the variation of strain-hardening rate with true compressive strain during plastic deformation. The strain-hardening rate was calculated from the experimentally obtained true stress-true strain data. The initially higher strain-hardening rate indicates rapid dislocation multiplication and strong resistance to plastic deformation during the early stages of compression. And further, there is monotonic decrease in strain hardening rate from 5955 MPa to 3565 MPa within the plastic strain regime. This decrease in strain-hardening rate, may be attributed to dynamic recovery, dislocation rearrangement, and reduced dislocation storage capability at higher deformation levels. 72 Despite this decrease, the absolute values of strain hardening rate remain remarkably high, staying well above 3500 MPa throughout the investigated regime. This sustained hardening capacity is primarily attributed to the multiwall carbon nanotubes, which functions as a system of non-deformable Orowan obstacles that pin dislocation motion and promote the formation of dislocation loops.50,73,74 The combined effect of back-stress strengthening and solid-solution strengthening delays dislocation saturation, thereby improving the work-hardening behaviour and deformation stability of the alloy during compression.
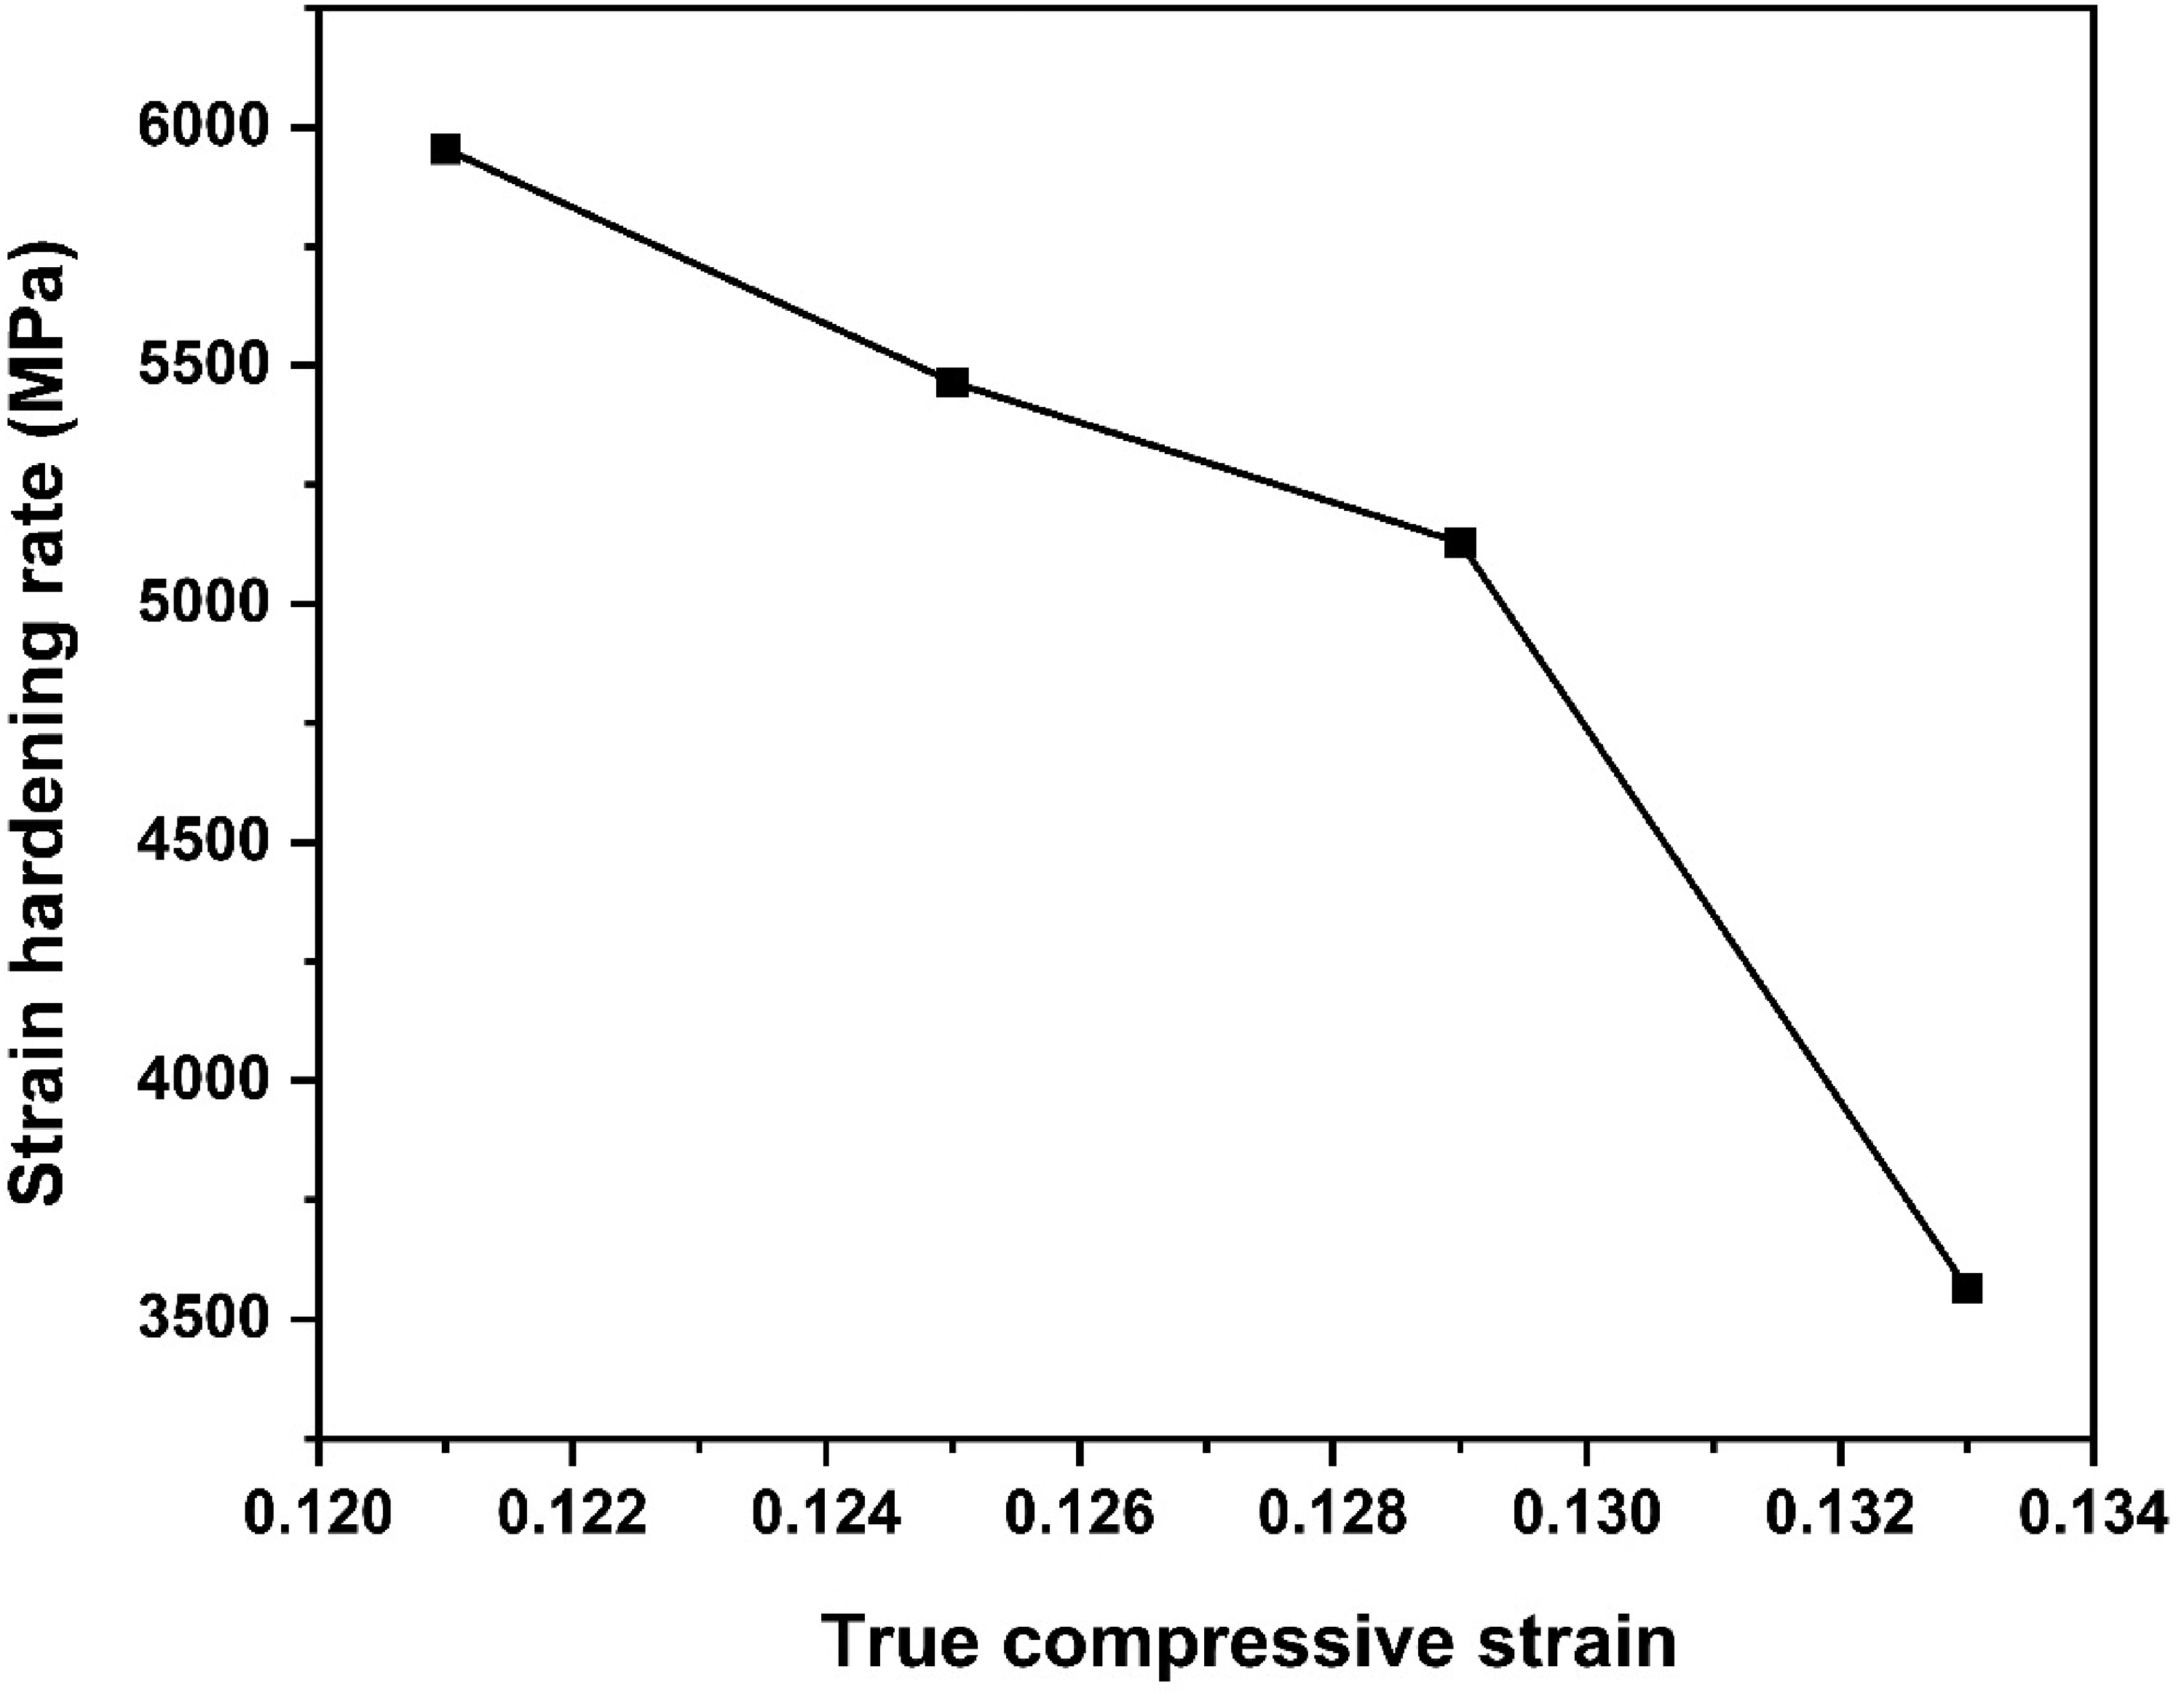
Variation of strain-hardening rate with true compressive strain.
Thermogravimetric analysis:
The thermogravimetric analysis (TGA) curve presented in Figure 20 illustrates the weight change of the low-density steel as a function of temperature, measured up to 1000°C. Initially, the weight remains comparatively constant from room temperature to approximately 200°C, indicating thermal stability in this range. Beyond 200°C, a gradual increase in weight is observed, which becomes more pronounced as the temperature rises. This weight gain is due to oxidation in the sample, where oxygen interacts with alloying elements to form oxides, contributing to the mass increase. The steady rise in weight continues up to around 1000°C, suggesting ongoing oxidation throughout the temperature range. The absence of any weight loss indicates minimal or no thermal decomposition, reflecting the stability of the alloy under elevated temperatures. From the above graph (Figure 20), it is evident that the alloy is thermally stable until 300°C, after which it adds weight by up to 13%. TGA analysis provides insight into the oxidation behaviour and thermal stability of the developed steel alloy, crucial for understanding its high-temperature performance in applications. 74
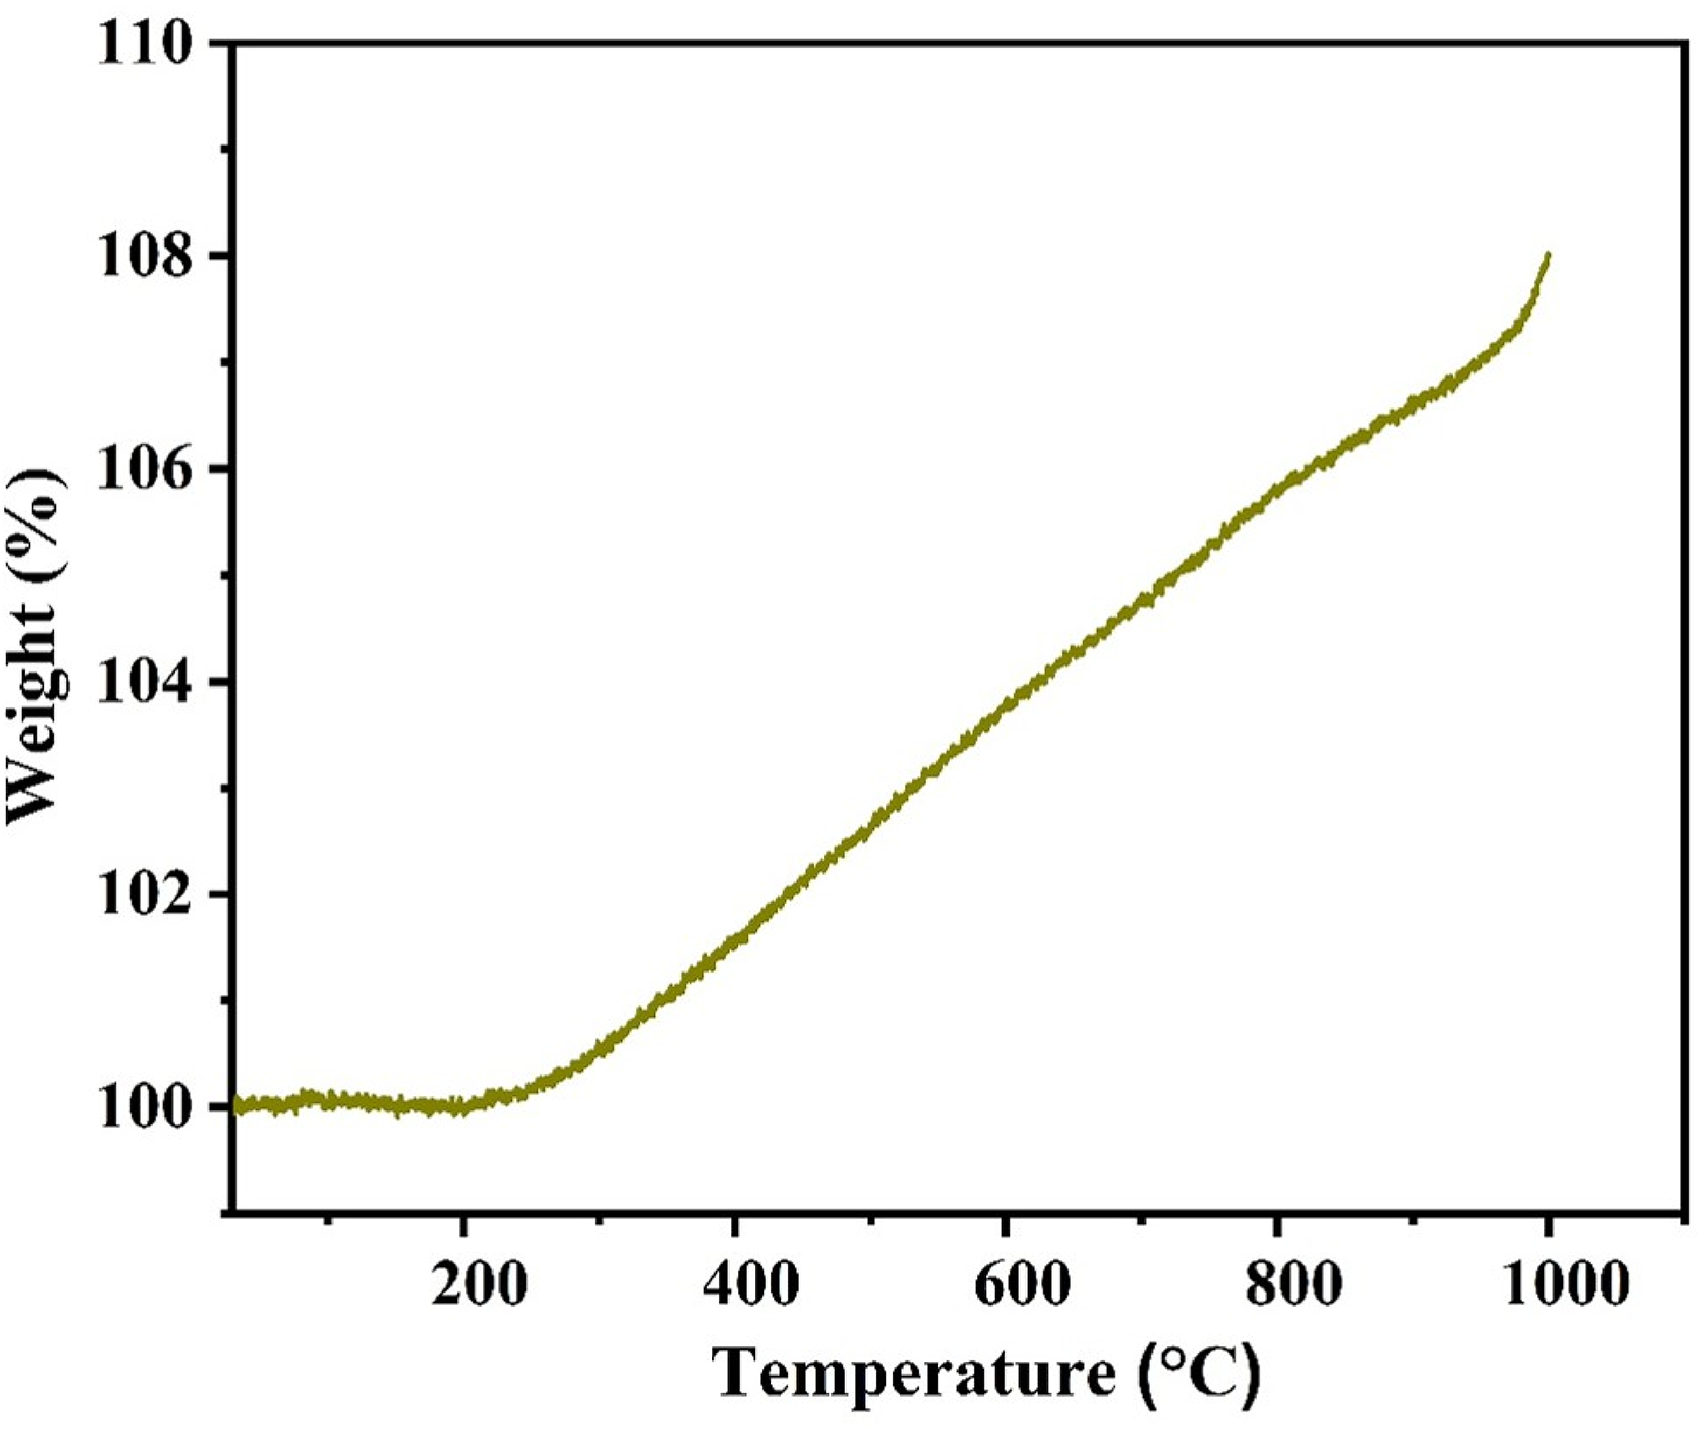
Thermogravimetric analysis of elemental powder at 35 h of milling.
Conclusion
This study effectively synthesized 1% MWCNT added Fe56.75Mn25Al15Si2C0.25 low density steel after 35 h of ball milling. The low-density steel was studied using X-ray diffraction, scanning electron microscopy, and thermal analysis. Spark plasma sintering was used to consolidate the milled powder at an optimal temperature of 900°C. The phase evolution, surface morphology, hardness, compressive strength, Young's modulus, and density were examined. This investigation yields the following conclusions:
A 1% MWCNT added Fe56.75Mn25Al15Si2C0.25 low density steel was successfully developed with a major single-phase BCC solid solution after mechanical alloying for 35 h, and after spark plasma sintering, it entails a BCC phase with some intermetallics. These phases are approximately matched with the simulated phases by the CALPLAD modelling with Thermocalc. The spark plasma sintering process preserves the fine microstructure with no porosity and exhibits a density of 5.83 g/cm3, representing a 25% reduction compared to conventional steel. Developed low density steel has the microhardness of 11 GPa and the Young's modulus of 214 GPa. A remarkable compressive strength of 1135 ± 18 MPa was obtained for the Fe-Mn-Al-Si-C-CNT low density steel, which can be primarily ascribed to synergistic strengthening mechanisms including grain refinement, solid-solution strengthening, carbide and silicide formation, and effective reinforcement by uniformly dispersed MWCNTs The alloy showed a pronounced strain-hardening tendency during compressive deformation. Among the constitutive models applied, the best correlation with the experimental data was obtained by the Ludwik model, which suggests that it is appropriate for characterizing the deformation behavior of the current alloy. The large strain-hardening exponent and the constant strain-hardening rate imply effective dislocation interaction, strengthening impact of CNTs and increased resistance to localized deformation. The enhanced mechanical properties in the SPSed sample can be attributed to its distinctive phases in the microstructure, which consists of body-centred cubic (BCC), intermetallic compounds, and uniform dispersion of multi-walled carbon nanotubes.
Footnotes
Acknowledgment
Author(s) acknowledges Dr Deepak Dwivedi, Rajeev Gandhi Institute of Petroleum Technology, Amethi, India, for providing the spark plasma sintering facility. We are also grateful to Professor N. K. Mukhopadhyay, IIT (BHU) Varanasi, India to providing micro-indentation facility.
Author contribution(s)
Funding
The authors received no financial support for the research, authorship, and/or publication of this article.
Declaration of conflicting interests
The authors declared no potential conflicts of interest with respect to the research, authorship, and/or publication of this article.