






Abstract
Residual thermal stresses from Physical Vapor Deposition (PVD) trigger premature delamination in DLC/TiAlN coatings by weakening interfacial adhesion. To improve coating reliability, this study establishes a thermo-mechanically coupled finite element framework to quantify how deposition temperature and film thickness dictate stress evolution. Simulation results demonstrate that a 150 °C deposition temperature and a 3 μm TiAlN interlayer synergistically reduce interfacial shear stress by 42%. Experimental validation confirms an optimized wear depth of 2.9 ± 0.3 μm and a 68% increase in critical load (Lc). The optimized architecture triggers a transition from brittle fracture to ductile-dominated failure, providing a quantitative “low-stress, high-toughness” design paradigm for DLC-based composite coatings.
Keywords
Introduction
The significant advancement of Industry 4.0 and high-end equipment manufacturing demonstrates that physical vapor deposition (PVD) coatings—particularly diamond-like carbon (DLC) coatings—provide critical value in surface protection for automotive components and cutting tools, given their exceptional hardness, low friction coefficient, and favorable chemical properties.1,2 During the PVD process, inherent mismatches in physical properties between the coating material and substrate generate substantial residual stresses within the coating. 3 Furthermore, elevated residual stresses often lead to a deterioration in the adhesive strength binding the coating to its substrate. Thus, failures such as cracking and spalling affect service performance. However, these failure modes remain a central challenge in coating design.
Based on empirical findings on multilayer structures, constructing composite architectures such as DLC/TiAlN provides an effective solution to these critical challenges. TiAlN acts as an intermediate support layer, providing a favorable mechanical gradient between the substrate and the top DLC layer due to its high hardness and excellent thermal stability.4,5 Nevertheless, research shows composite coating structural parameters significantly affect stress distribution. Given that findings reveal these complexities, traditional trial-and-error methods affect process optimization outcomes. 6
Finite Element Analysis (FEA) has emerged as a critical tool for predicting coating performance and guiding structural design. For instance, Hao et al. 7 developed a finite element model to investigate the thermo-mechanical coupling behavior of coated cutting tools during orthogonal machining, revealing the influence of cutting heat on tool wear. Meanwhile, Yuan et al. 8 utilized a Cohesive Zone Model to capture progressive damage and interfacial failure modes under multi-particle erosion. While FEA is indispensable for modeling coating responses to external loads like cutting or impact, the evolution of endogenous residual thermal stresses remains insufficiently explored. Consequently, a quantitative understanding of how preparation parameters dictate dynamic scratch failure modes is still lacking, presenting a critical gap in micrometer scratch testing and crack propagation verification. To address this gap, this study comprehensively analyzes how deposition temperature and film thickness dictate thermal stress within DLC/TiAlN multilayer systems by systematically simulating the spatial profile of residual thermal stresses using an ANSYS thermo-mechanical coupled model.
Moreover, optimal structural parameters minimize interfacial stress concentrations.Friction-wear testing and micron-scale scratch testing of physical specimens strictly validate these simulation predictions. Thus, combined microstructural and stress analysis reveals dynamic failure mechanisms, establishing a solid theoretical foundation for designing DLC-based composite coatings with extended service life.
Materials and methods
Theory of thermal stress calculation
Heat transfer during the physical vapor deposition (PVD) process is a complex physical phenomenon involving thermal conduction, convection, and radiation. As shown in Fig 1, the substrate and coating system primarily exchange heat with the environment through the following three mechanisms within the vacuum chamber.

Three modes of heat transfer: (a) thermal conduction; (b) thermal convection; (c) thermal radiation.
During the cooling stage, assuming the system is isotropic and remains within the linear elastic range, Clyne and Tsui
9
proposed an analytical model based on planar geometry. To improve the precision of thermal stress evaluations, this framework was incorporated into the classic Stoney equation, yielding the following mathematical expression:


In the above equation, the thicknesses of the deposited coating and the underlying substrate are designated by
Finite element model development
A two-dimensional axisymmetric model was developed in ANSYS to simulate the coating-substrate system under critical thermodynamic conditions. 10 Moreover, thermal radiation effects during cooling of the DLC/TiAlN coating were neglected, and the substrate surface temperature gradient was also excluded from the model. Additionally, findings indicate surface distribution differences were excluded. Because the DLC/TiAlN coating surface exhibits homogeneous properties, these key assumptions support the analytical framework established for this study.
Geometric Model: As shown in Figure 2, to reduce computational complexity and enhance efficiency, a cylindrical body was selected to represent the system composed of a DLC/TiAlN composite coating bonded to a cemented carbide substrate, as depicted in Figure 2(a). Due to the cylindrical body's axisymmetric nature, it is simplified into a two-dimensional model, as illustrated in Figure 2(b). This simplifies the simulation model, requiring analysis only of three superimposed rectangular planes within the X-Z plane. In the established simulation model, the dimensional parameters H,
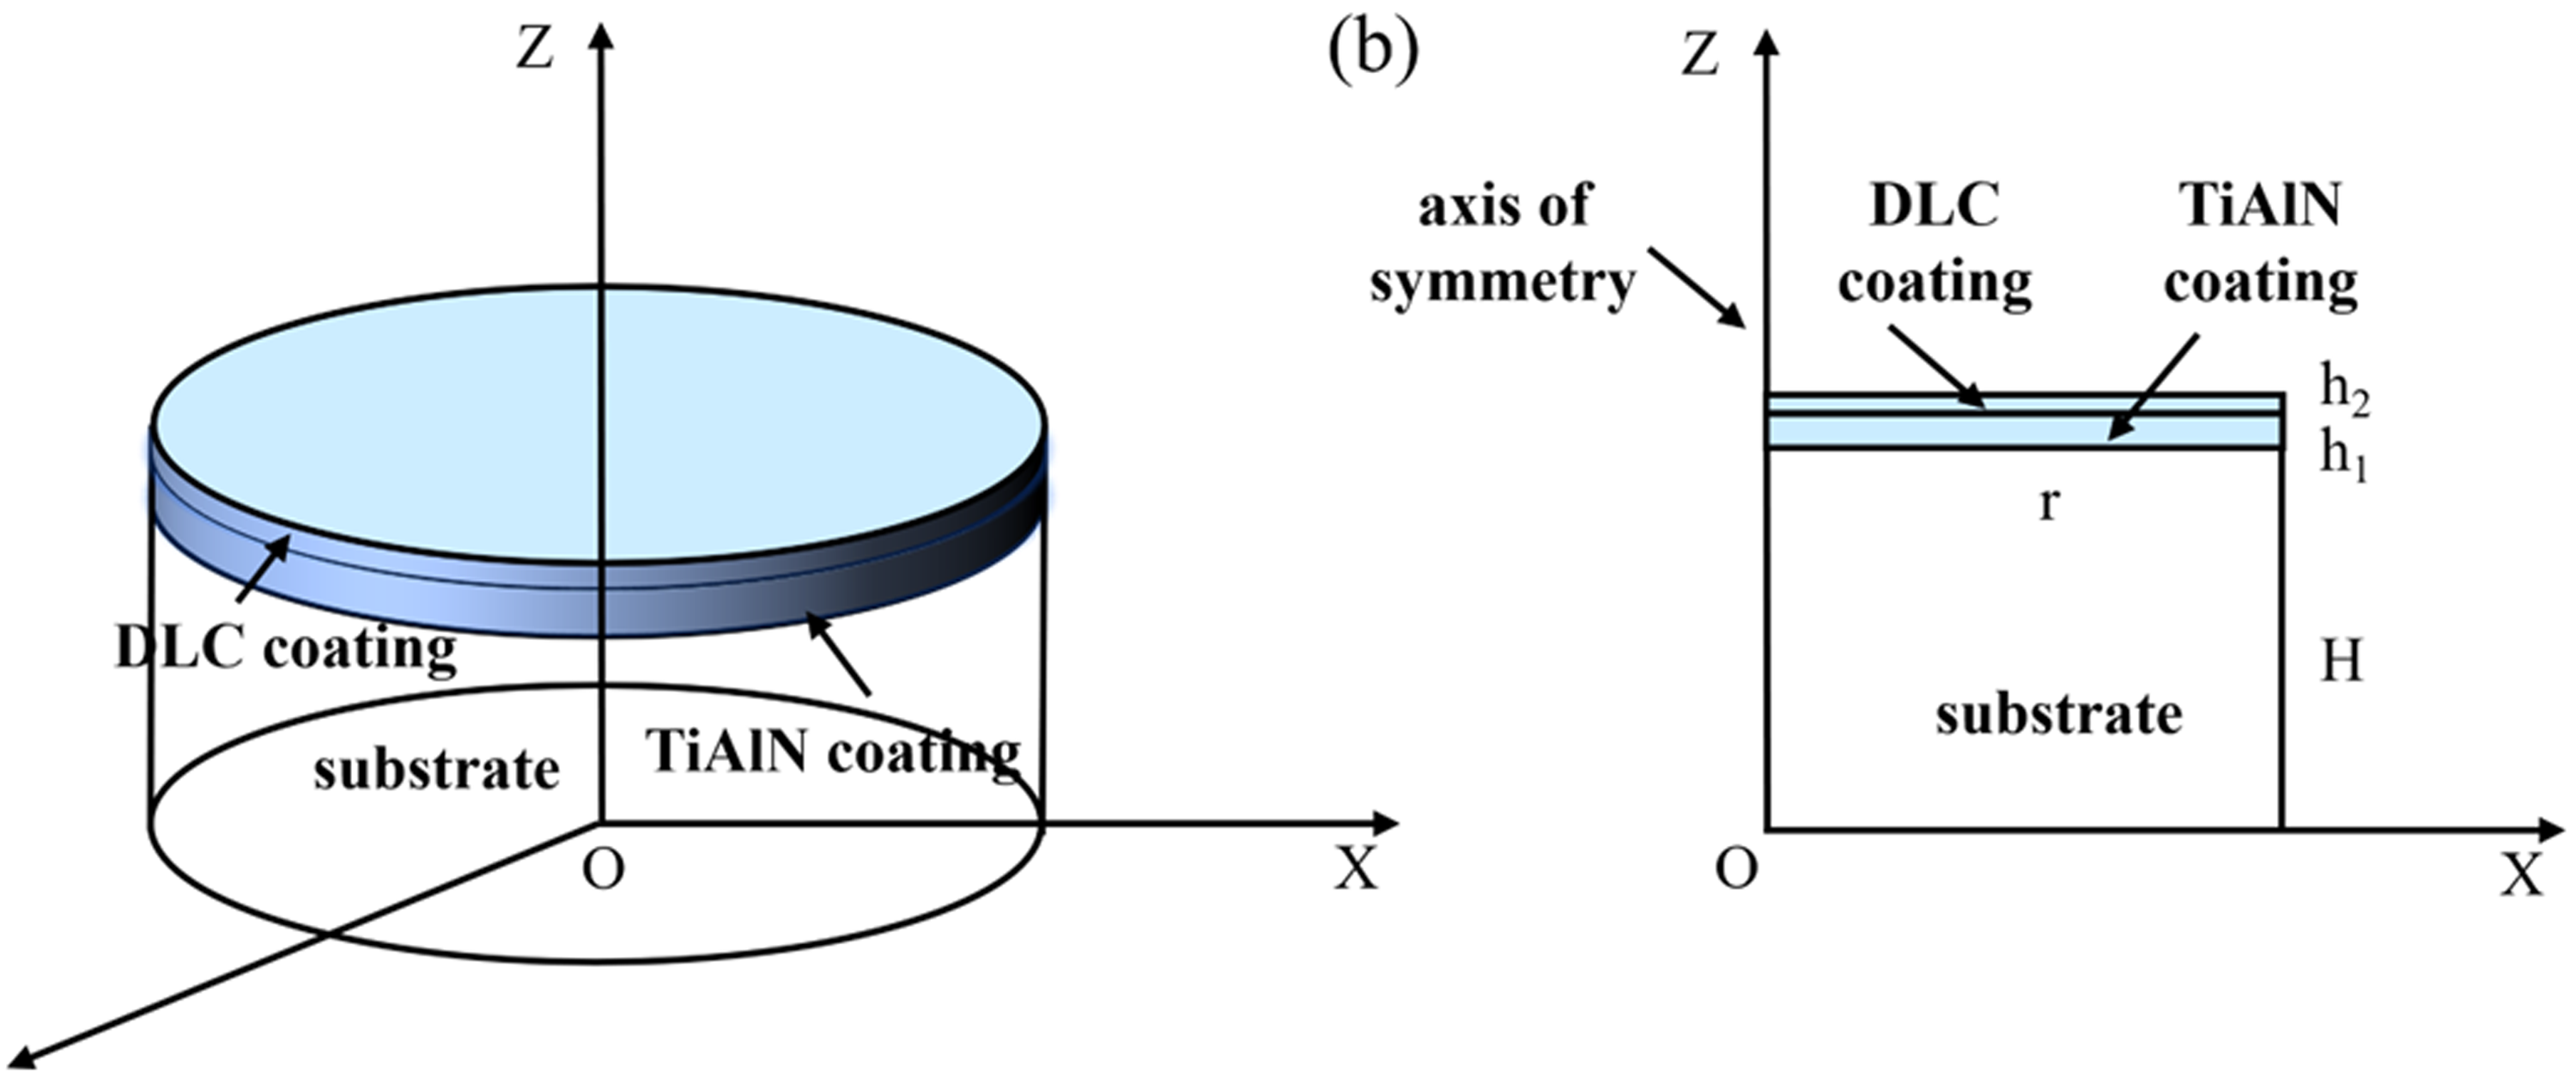
Geometric schematic diagram of an axially symmetric model.
Mesh Partitioning Strategy: Mesh quality directly determines the accuracy of stress calculations. Given the extreme dimensional disparity between the micrometer-thick coating and the millimeter-scale substrate, applying a uniform meshing strategy would inevitably lead to either prohibitive computational costs or compromised numerical precision.Therefore, this study employed a gradient mesh partitioning technique (Mapping Mesh), as shown in Figure 3. A local refinement method 11 was applied in the contact region between DLC/TiAlN and the substrate, with the minimum element size reduced to 0.1 μm to capture stress variations at the interface, 12 as illustrated in Figure 3.
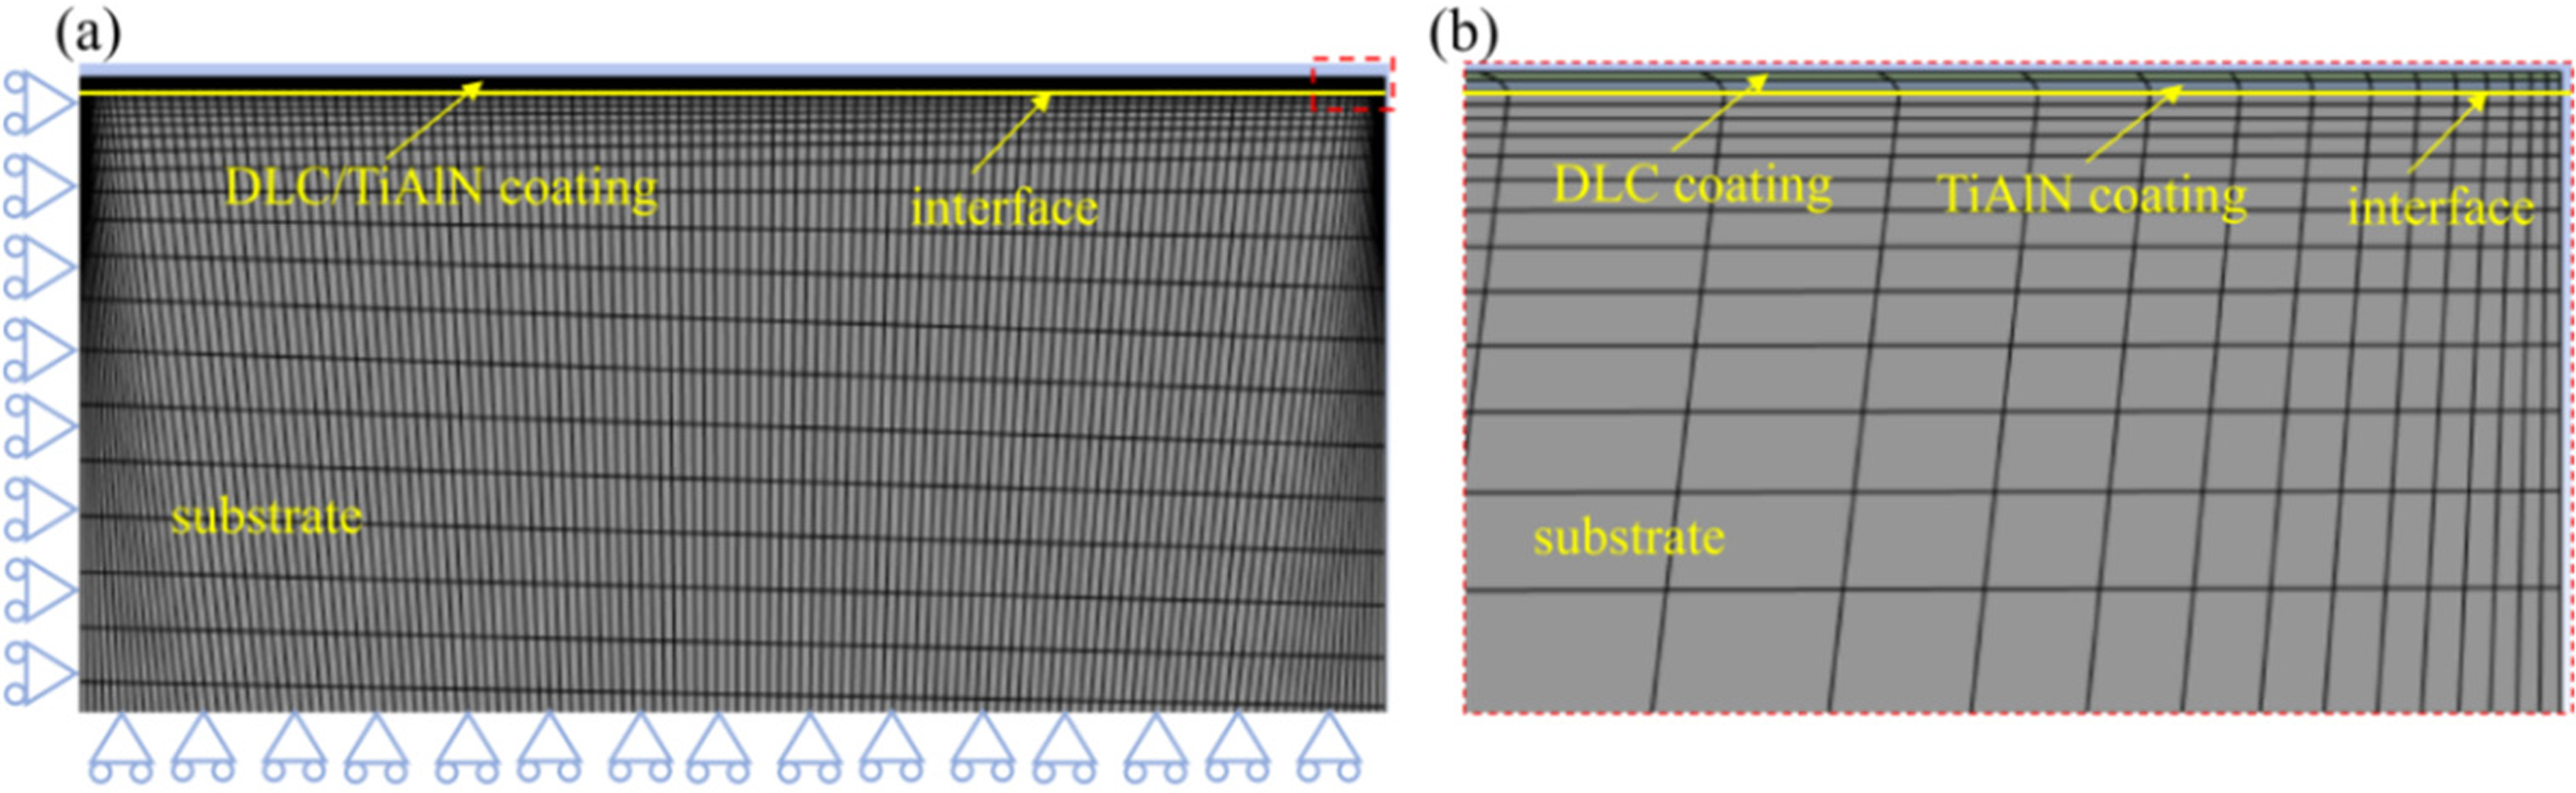
Model mesh and boundary conditions: (a) global mesh configuration; (b) localized mesh refinement at the interface.
Material Parameters and Boundary Conditions: The initial temperature of the model was set to 150 °C, 250 °C, 350 °C, and 450 °C, cooling it from the initial temperature to room temperature. Coating thickness parameters were set as coating combinations of 2 μm DLC coating + 3 μm TiAlN coating, 2.5 μm DLC coating + 2.5 μm TiAlN coating, and 3 μm DLC coating + 2 μm TiAlN coating. The resulting thermal stress variations were obtained. The contact boundary heat transfer coefficient in the simulation was set to 25 W/m2·°C, and the fixed-base heat transfer coefficient was set to 40 W/m2·°C.12–15 Following model simplification, the materials involved in the simulation were assumed isotropic. Furthermore, the physical parameters required for simulation—including elastic modulus, specific heat capacity, and thermal expansion coefficient—were determined,16–18 with their properties shown in Table 1.
Material parameters.

While assuming isotropic materials and neglecting complex transient thermal effects simplify the real PVD process, these engineering assumptions are justified. Temperature-dependent anisotropic elastic constants are rarely available in the literature, and the macroscopic thermal stress field is primarily governed by the bulk thermal expansion mismatch between the coating and substrate. Furthermore, as shown in the error analysis framework ( Figure 10), the minimal deviation (1%–4%) between the simulation results and analytical calculations confirms that these simplifications do not compromise the accuracy or reliability of the overall stress evolution trends.
Coating preparation and characterization
Substrates of commercial YG8 (WC-Co) cemented carbide were selected, mirror-polished, ultrasonically cleaned, and thoroughly dried. A sequential TiAlN interlayer and top DLC film were progressively deposited via physical vapor deposition (PVD) using a closed-field reaction pulsed magnetron sputtering system (Hauzer Flexicoat 1000). The process involved in-situ Ar+ etching pre-treatment at 360 °C (20 min target cleaning) and 90 °C (2.5 h workpiece etching), followed by high-voltage (−1000 V) Cr ion bombardment etch cleaning to remove surface contaminants. The DLC coating was deposited at 150 °C using two WC targets. To verify sample integrity prior to subsequent testing, the coatings were characterized.
Figure 4 confirms the successful deposition of a dense, coherent DLC/TiAlN composite system. SEM illustrate the homogeneous surface morphology (Figure 4(a)) and the distinct multilayer architecture (Figure 4(b)). Furthermore, associated EDS maps (Figures 4(b)-1 and 4(b)-2) verify the expected distribution of Carbon and Aluminum within the layers, while crystalline phase compositions across different thickness specifications are documented in Figure 4(c).
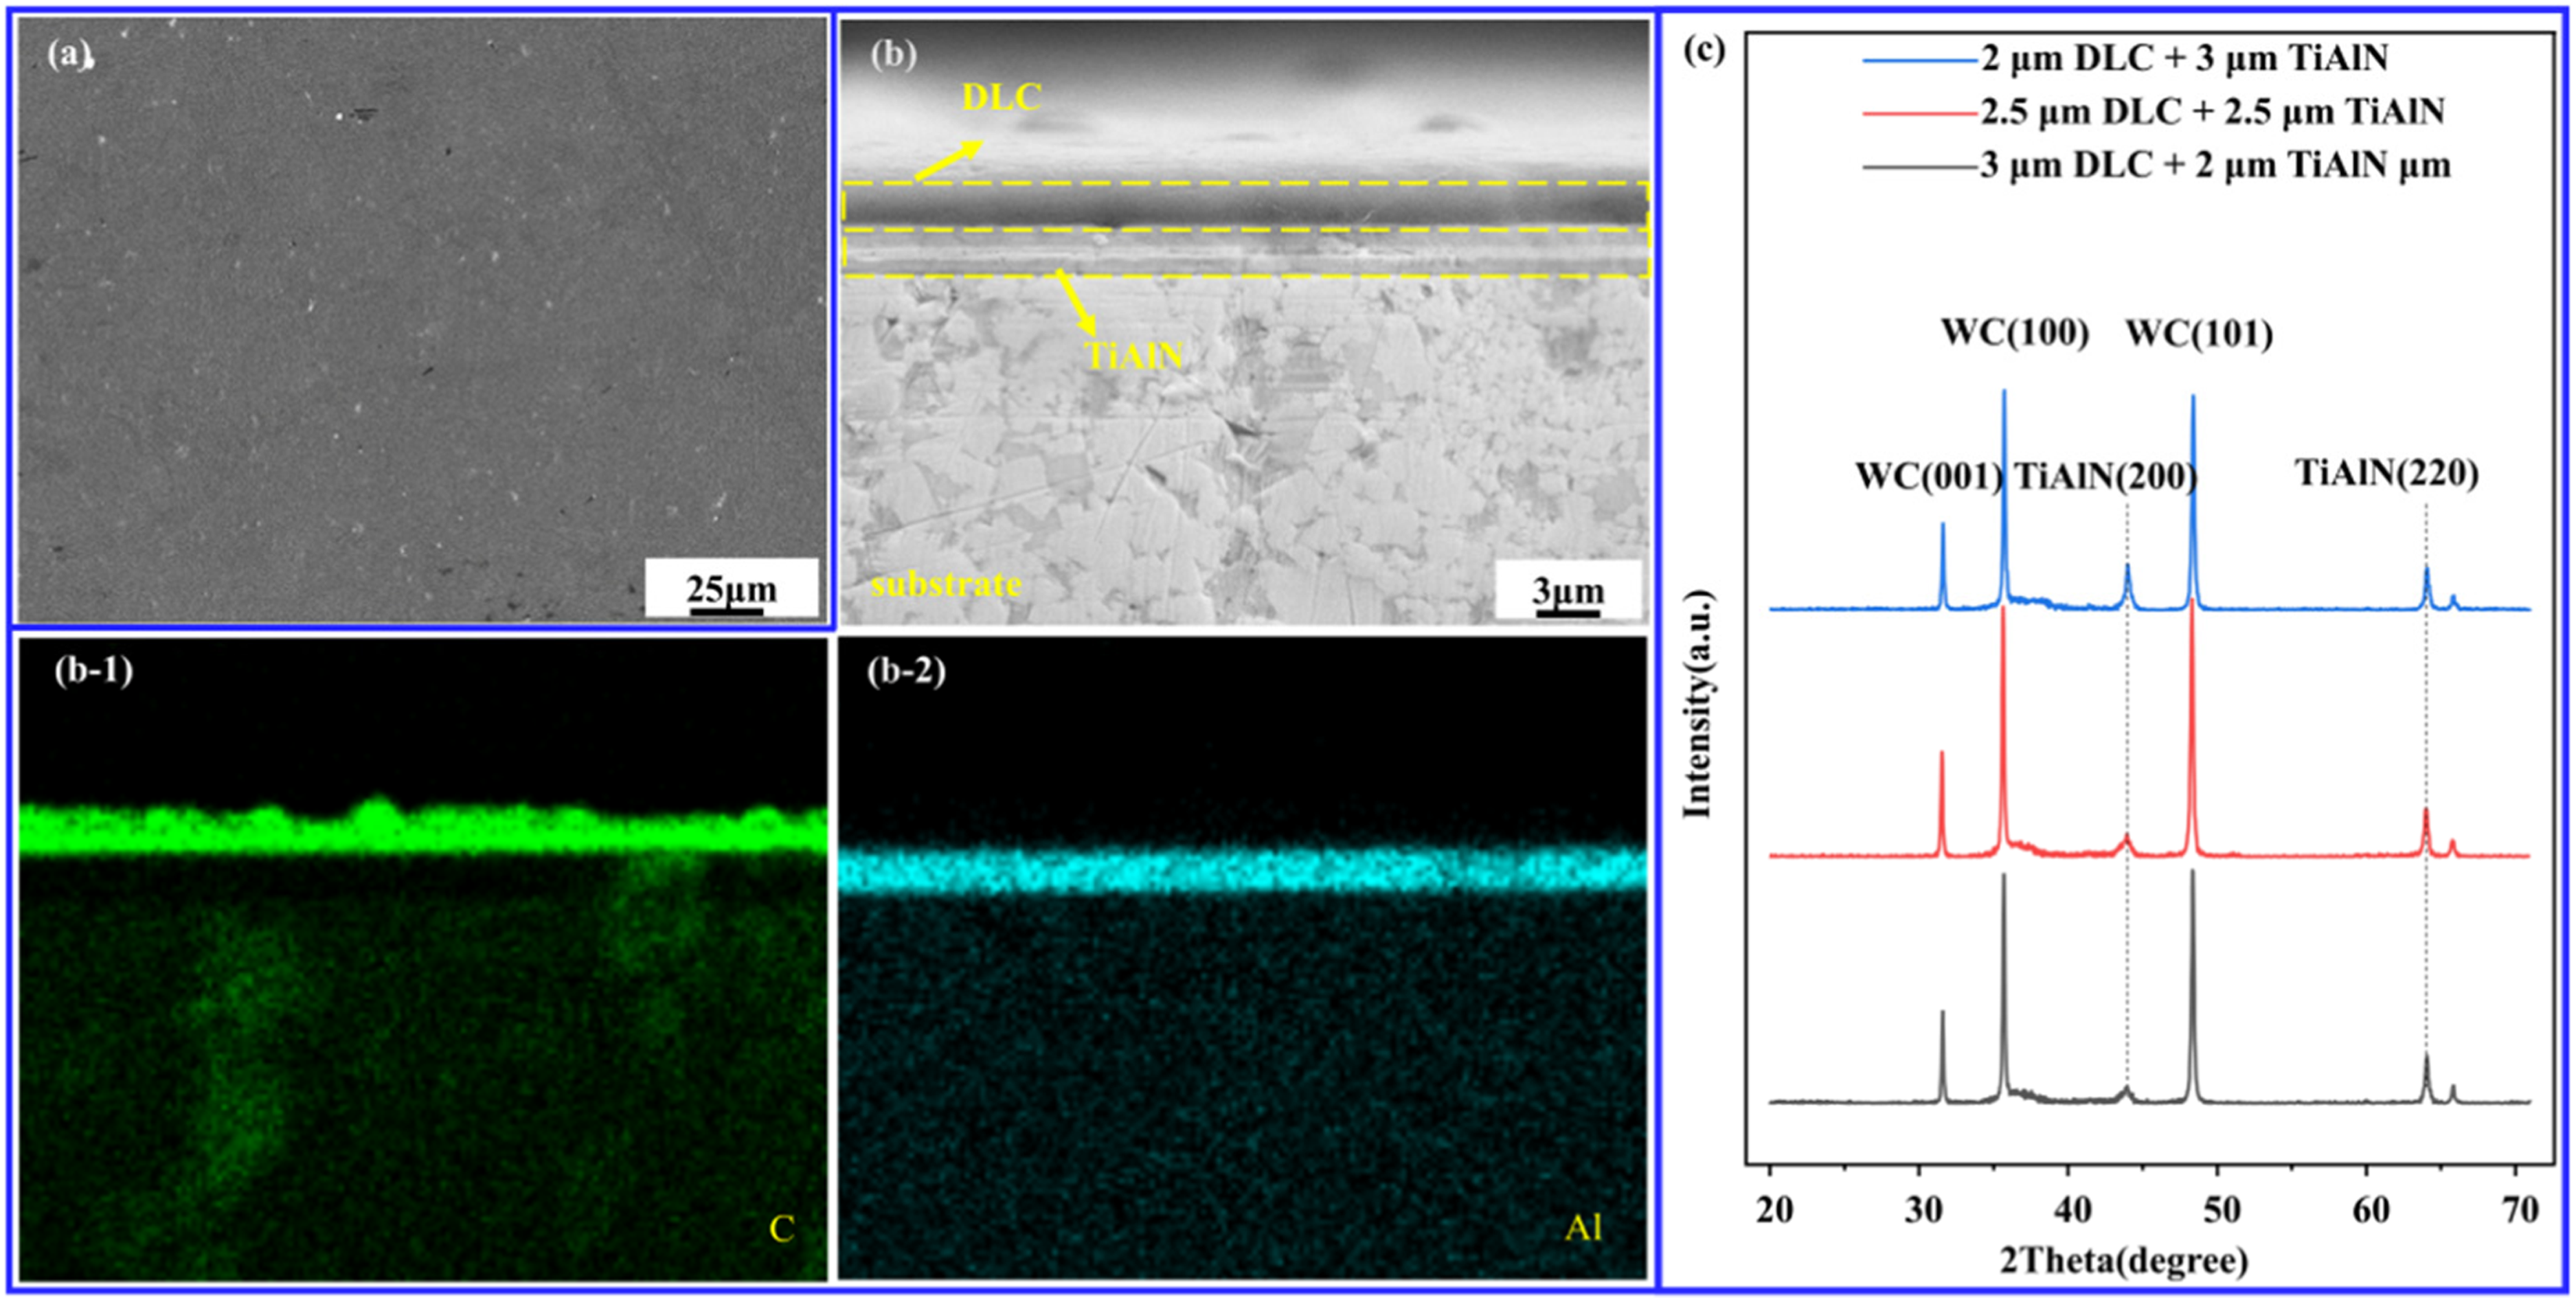
Physical and structural characterization of the deposited DLC/tiAlN composite coatings: (a) SEM surface morphology; (b) SEM cross-sectional view, with corresponding EDS mapping of (b-1) carbon and (b-2) aluminum; (c) XRD diffraction patterns.
Friction and wear test
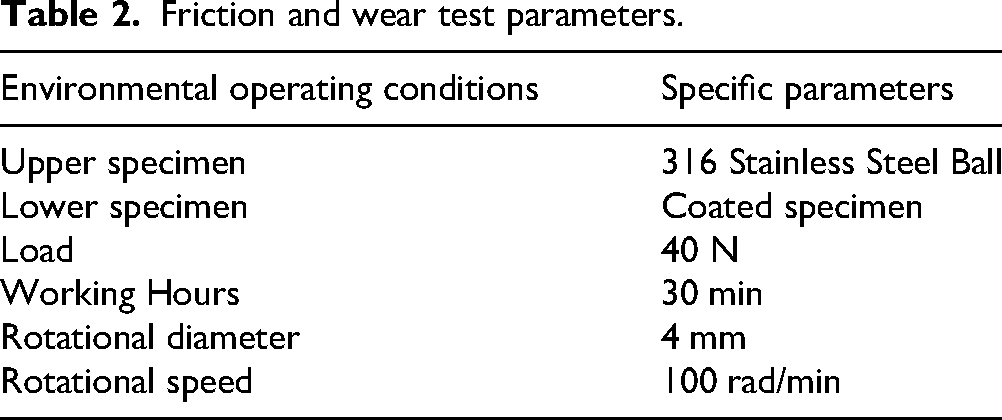
Friction and wear testing serves as a direct method for evaluating coating service life. 19 This experiment employed an MMW-1D universal friction and wear tester (manufactured by Shandong Baohang Machinery Equipment Manufacturing Co., Ltd). A 316 stainless steel ball was used as the wear material, while different coating samples served as the lower test specimens for friction and wear testing. The specific parameters are shown in Table 2. Characterization was performed using scanning electron microscopy (SEM, TESCAN VEGA3, TESCAN, China) and energy-dispersive X-ray spectroscopy (EDS, X-Max20, Oxford Instruments, UK). The friction coefficient, wear condition of the stainless steel balls, and wear morphology of the specimens were analyzed to identify the coating specimen with optimal tribological performance and its associated parameters.
Friction and wear test parameters.
Micro-scratch test
Dynamic failure mechanisms of the deposited films were further evaluated via a CSM-MCT micro-scratch tester (Switzerland). A 50-μm-radius Rockwell-50 diamond tip was utilized to execute the scratches over a 3 mm distance at a velocity of 3 mm/min, under a peak normal load of 15 N.The surface topography and elemental composition of different coated samples after scratch test were examined by using SEM/EDS.
Results and discussion
Effect of deposition temperature and coating thickness on thermal stress
Deposition temperature and coating thickness are critical process parameters determining the quality of PVD coatings. Figure 5 displays the Von Mises equivalent stress contour plots at different deposition temperatures (150°C, 250°C, 350°C) and varying structural thicknesses.
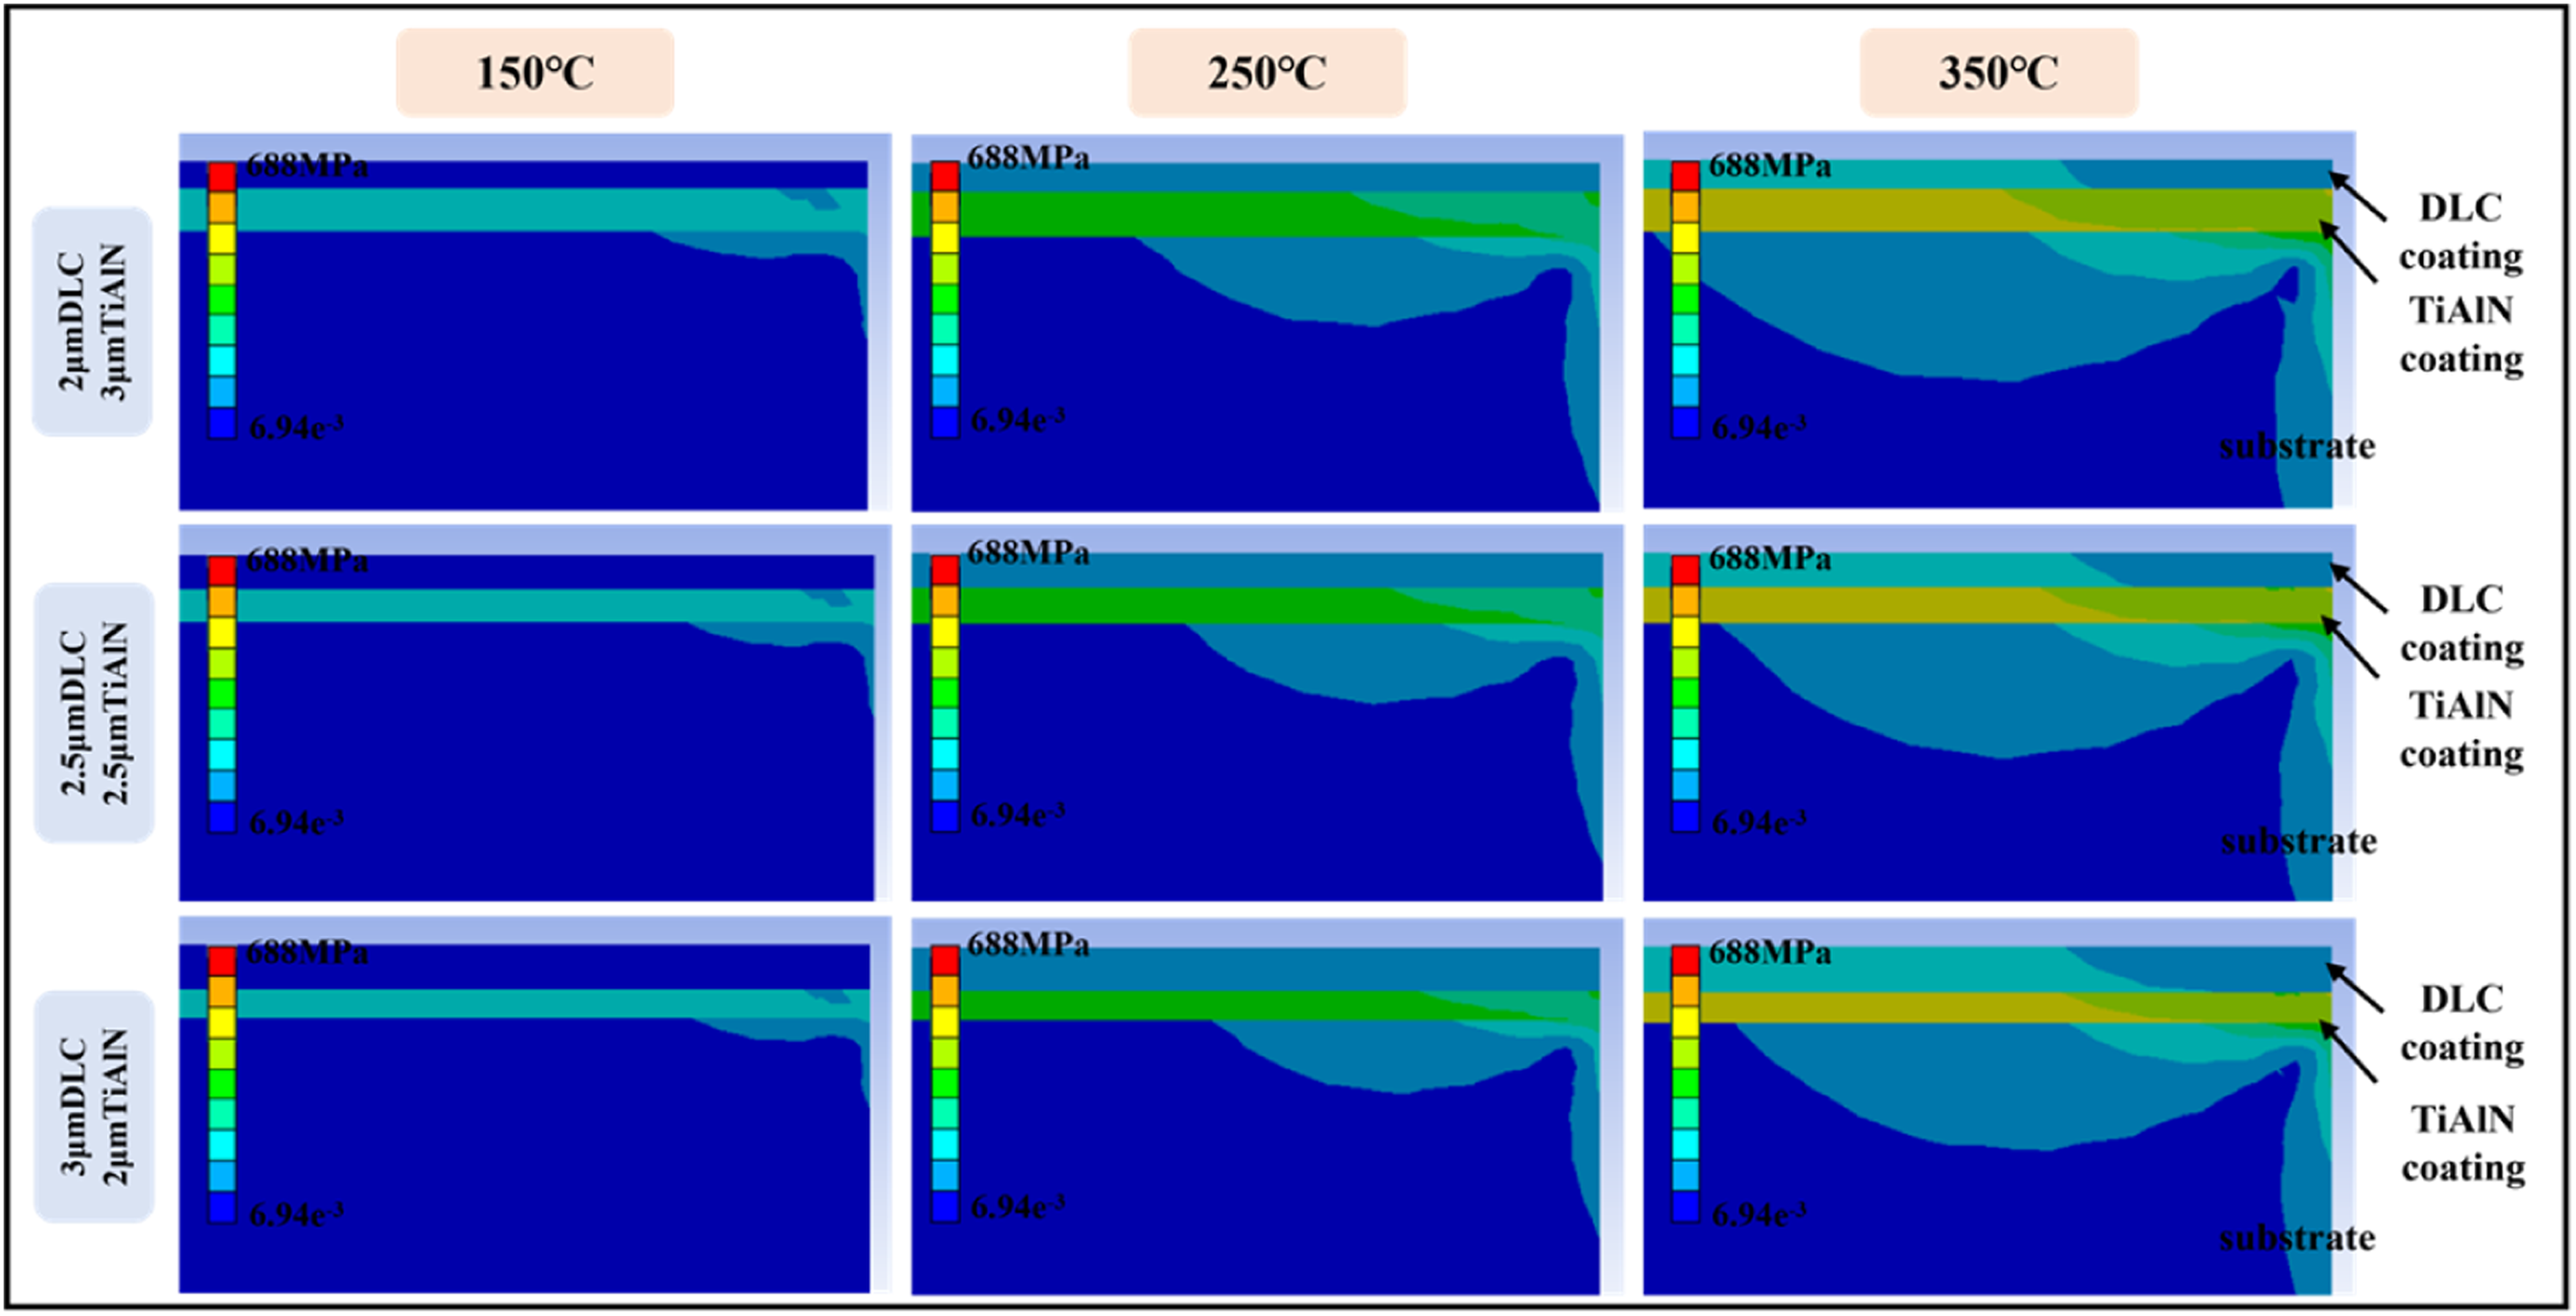
Stress simulation results for DLC/tiAlN composite coating.
Residual stresses within the coating increase exponentially with rising deposition temperature, with the minimum thermal stress occurring at 150 °C across the evaluated 150–350 °C range. Thus, stress accumulation shows reduced magnitude at this critical threshold. However, findings indicate operating closer to this temperature helps mitigate thermal stress. Additionally, the results show that at a total coating thickness of 5 μm, overall stress gradually decreases with increasing TiAlN coating thickness.
The composite coating structure—a 2 μm DLC overlaid with a 3 μm TiAlN at 150 °C—exhibits the lowest stress. This indicates that this coating combination demonstrates superior thermal stress performance at this temperature.
Stress simulations in the X-direction were performed using Ansys for the following coatings at 150 °C, 250 °C, and 350 °C: 2 μm DLC coating + 3 μm TiAlN coating, 2.5 μm DLC coating + 2.5 μm TiAlN coating, and 3 μm DLC coating + 2 μm TiAlN coating, as shown in Figure 6. It can be seen that at 350°C, the 3 μm DLC coating combined with a 2 μm TiAlN coating exhibits the highest X-direction stress. The 2 μm DLC coating paired with a 3 μm TiAlN coating exhibits the lowest X-direction stress at 150 °C. This reduction in radial stress minimizes localized stress concentrations, thereby lowering the risk of cracking and spalling.The maximum difference in radial thermal stress between 350 °C and 150 °C reaches 182 MPa. Furthermore, the results indicate that the coating experiences radial tensile stress and compressive shear stress at elevated temperatures. Thus, findings show differing thermal expansion coefficients affect uneven expansion. Additionally, results shows stresses arise in different directions. The figure also shows significant stress variations at the coating-substrate interface. Compressive stress does not cause damage to the entire system. Within the DLC/TiAlN multilayer architecture, peak stress concentrations are predominantly localized at the boundary between the film and the underlying substrate. Specifically, the maximum radial stress manifests directly on the top face of the substrate. Tensile stress induces surface damage in the coating, forming microcracks. Although the bond strength between the substrate and TiAlN coating is typically relatively high, thermal stresses at elevated temperatures can lead to microcrack formation. The combination of a 2 μm DLC coating and a 3 μm TiAlN coating exhibits the lowest thermal stress at 150°C, minimizing the impact on coating performance.
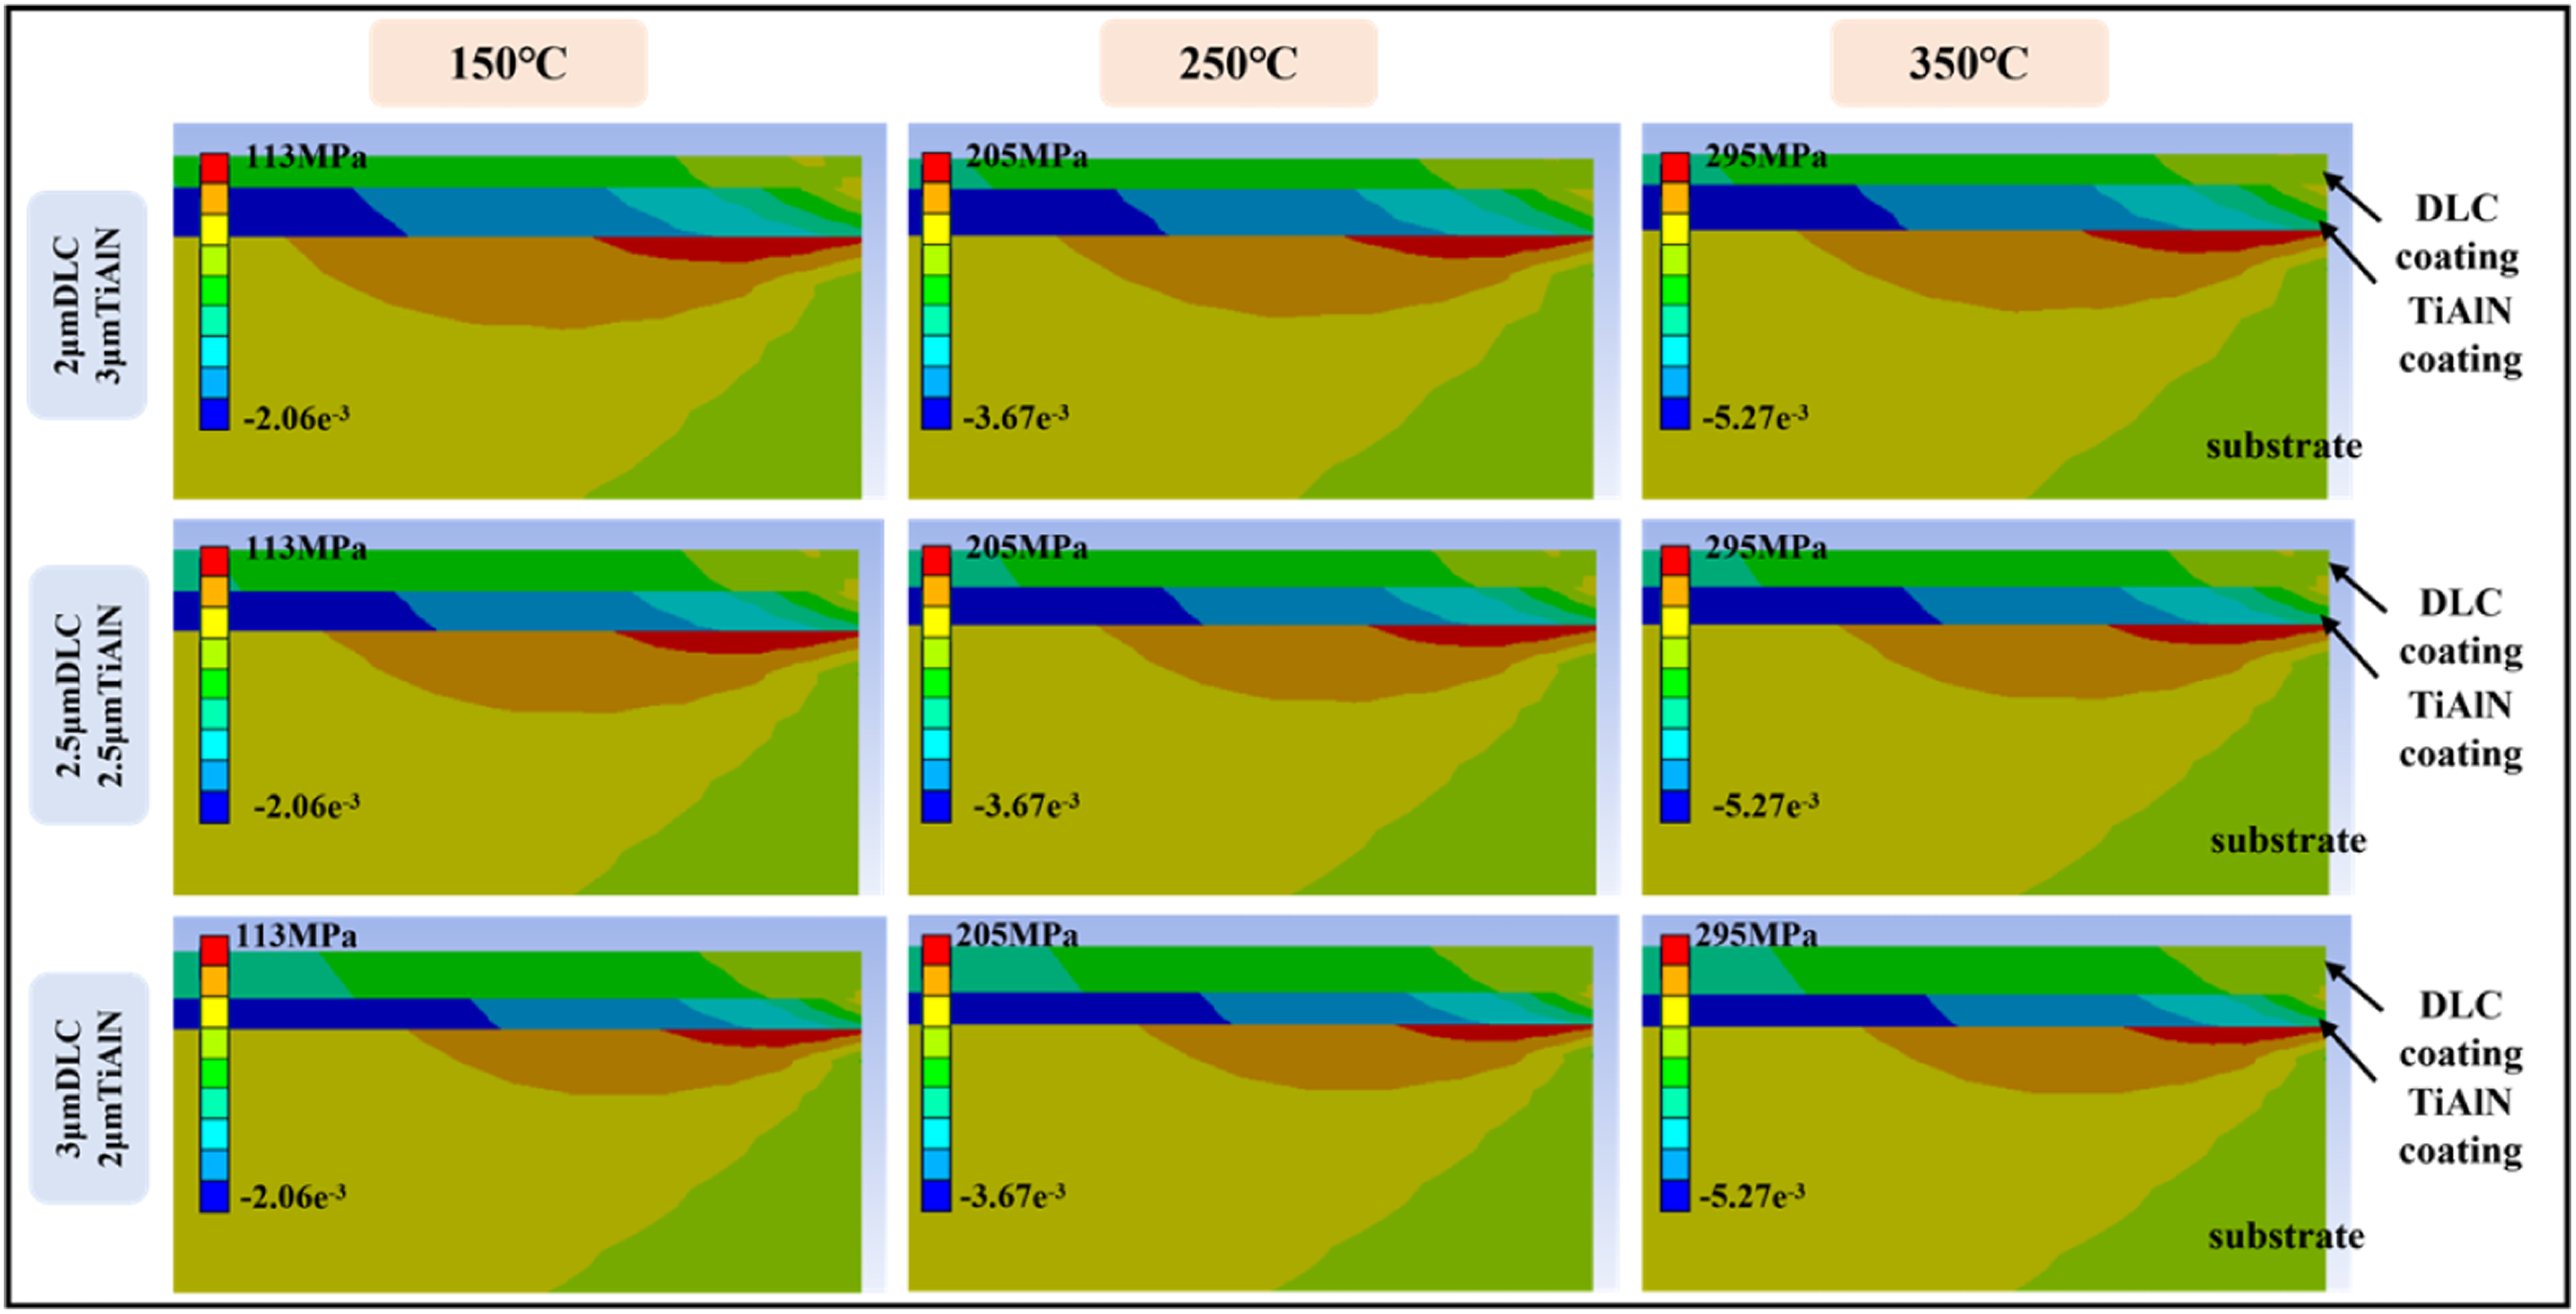
Simulation results for X-direction stress.
Further stress simulations in the Z-direction were conducted for the 2 μm DLC coating + 3 μm TiAlN coating, 2.5 μm DLC coating + 2.5 μm TiAlN coating, and 3 μm DLC coating + 2 μm TiAlN coating at 150 °C, 250 °C, and 350 °C, as shown in Figure 7. Figure 7 indicates that at 350 °C, the 3 μm DLC coating + 2 μm TiAlN coating exhibits the highest Z-direction stress. This increases interfacial stress between the coating and substrate material, enhancing coating brittleness. At 150°C, the 2 μm DLC coating + 3 μm TiAlN coating exhibits the lowest Z-direction stress. The maximum difference in thermal stress effects between 350°C and 150°C reaches 87.4 MPa. Figure 6 demonstrates that despite a generally uniform shear stress trajectory, a notable inversion effect characterizes the stress development at the substrate-TiAlN interface.This inversion arises from the abrupt thermomechanical property mismatch (e.g., coefficient of thermal expansion and elastic modulus) across this dissimilar-material junction, which induces localized stress redistribution and alters the interfacial shear state relative to adjacent regions. The highest levels of compressive shear stress are concentrated at the edges and in the vicinity of the film-substrate interface.Consequently, this leads to weakened interfacial bonding, which inevitably impairs the long-term stability and efficacy of the coating system. Delamination occurs at the coating edges, causing the coating to peel off and reducing its stability and service life.
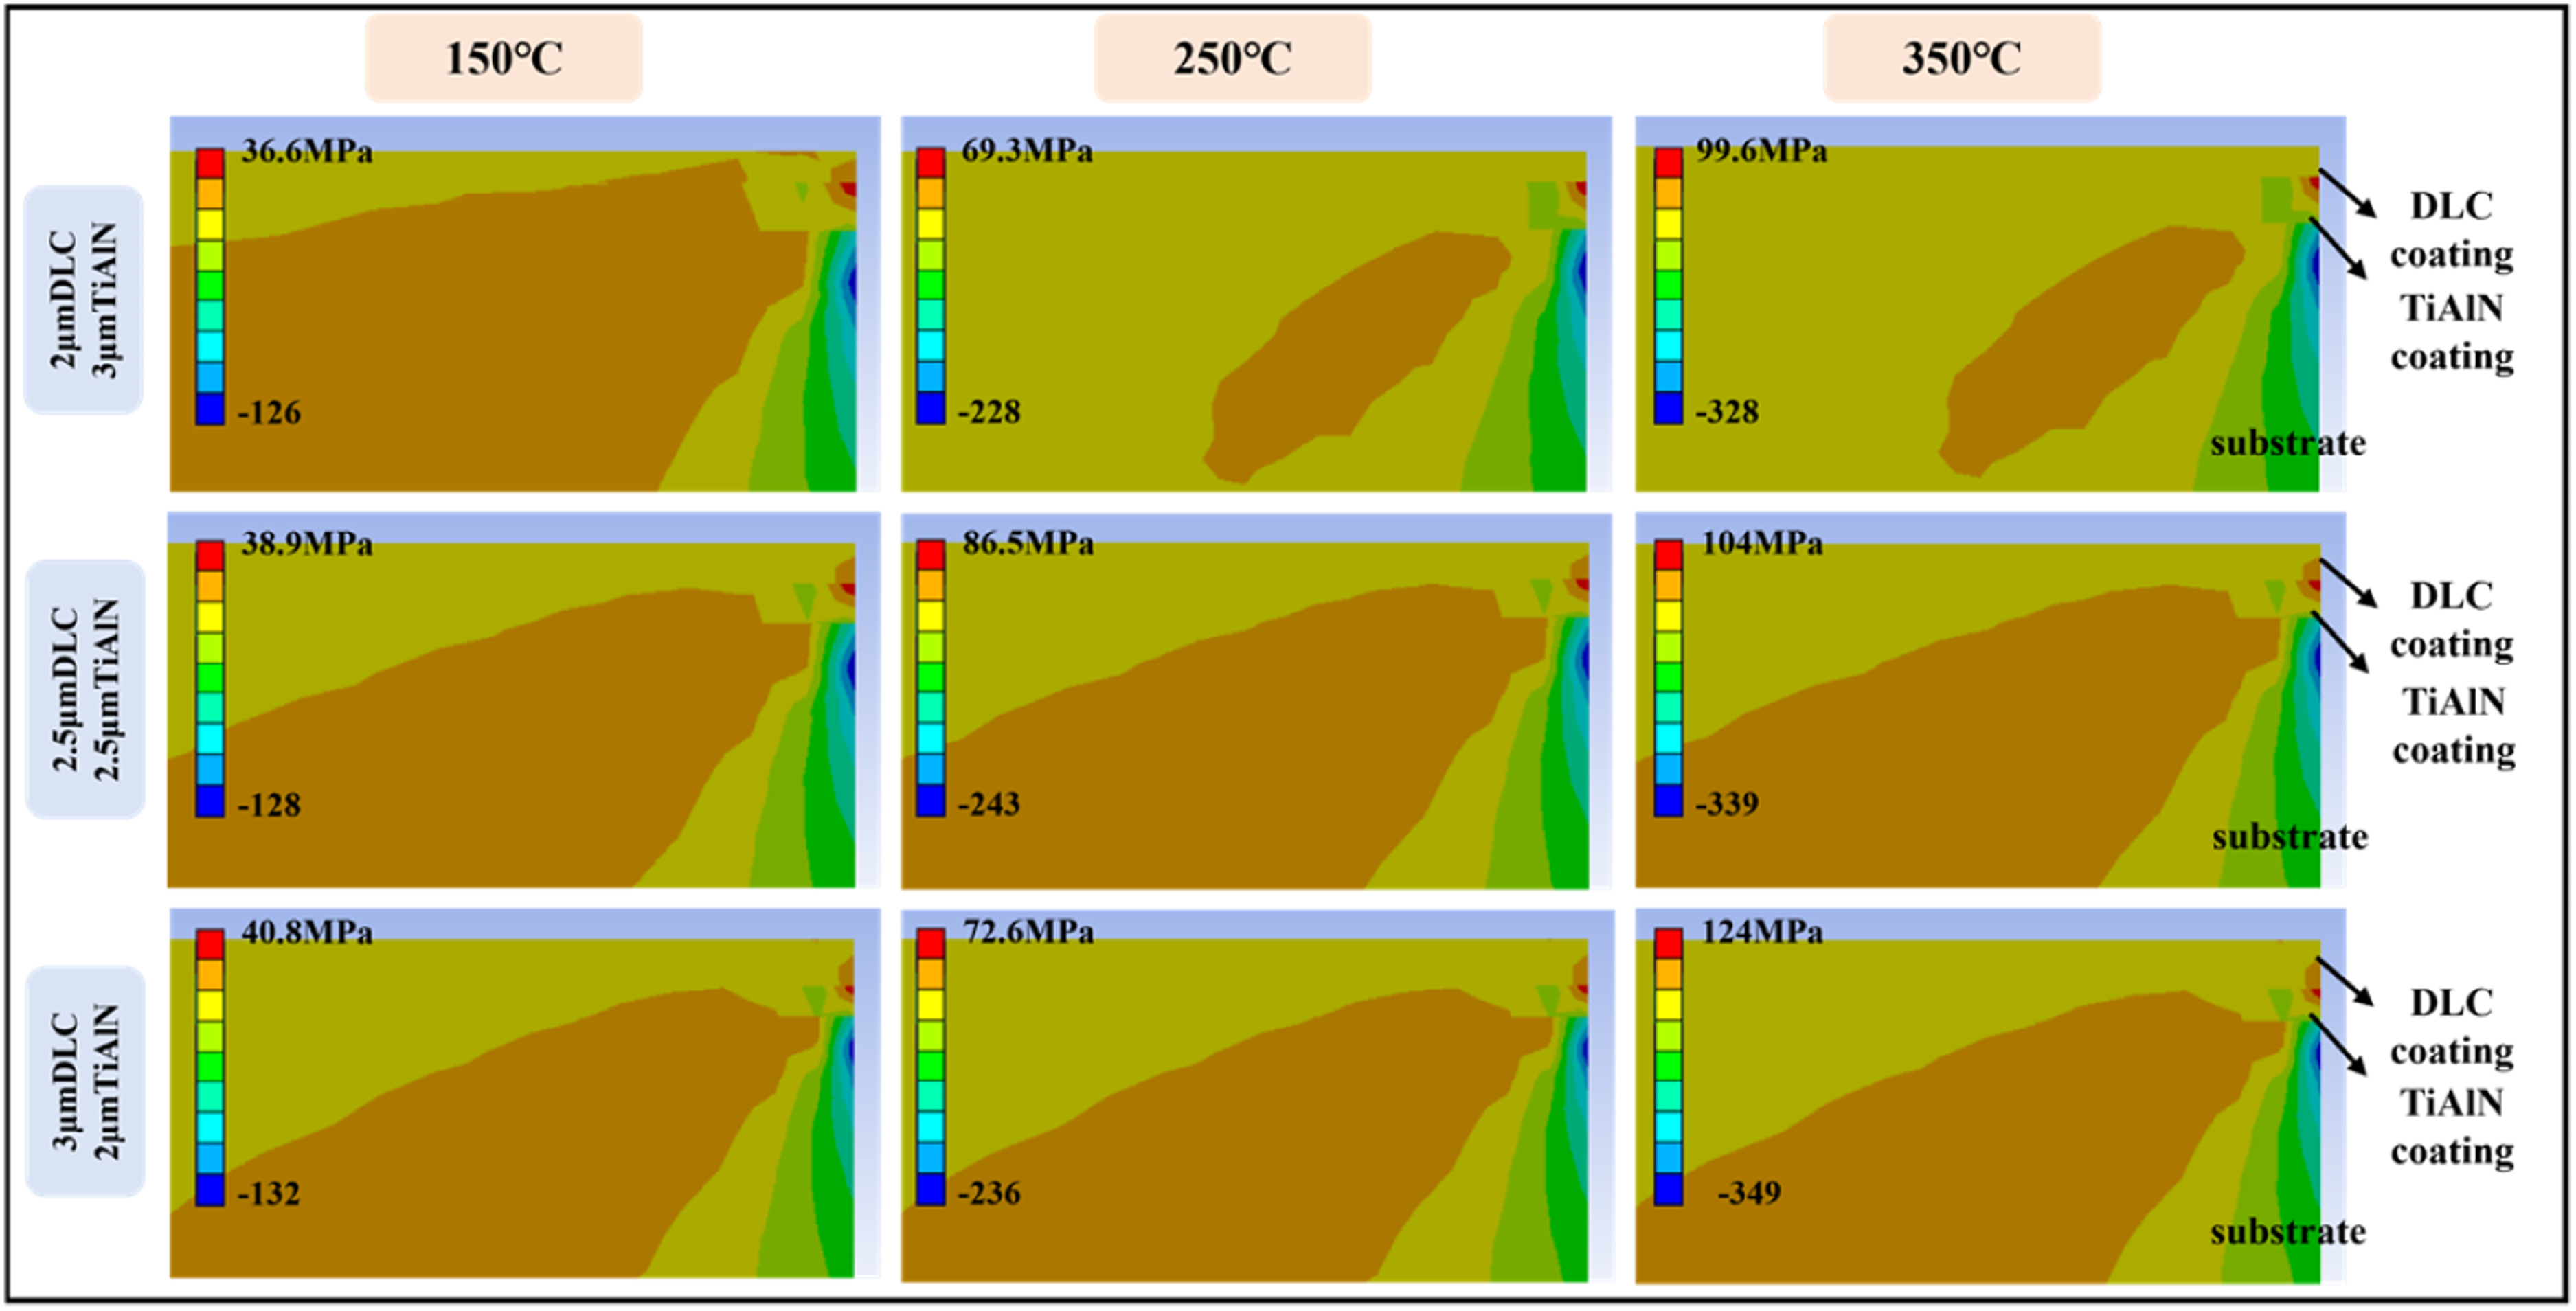
Simulation results for Z-direction stress.
Optimization of structural parameters for DLC/tiAlN composite coatings
Figure 8 shows the radial stress distribution along the thickness at different locations. At 350 °C, the 3 μm DLC coating + 2 μm TiAlN coating exhibits maximum stress at the edge, while at 150 °C, the 2 μm DLC coating + 3 μm TiAlN coating demonstrates minimum edge stress, with the maximum difference in thermal stress effects between 350 °C and 150 °C reaching 290 MPa. Coating failure largely depends on the magnitude of radial and shear stresses. Typically, the model's symmetry axis and edges represent critical stress concentration points. 15
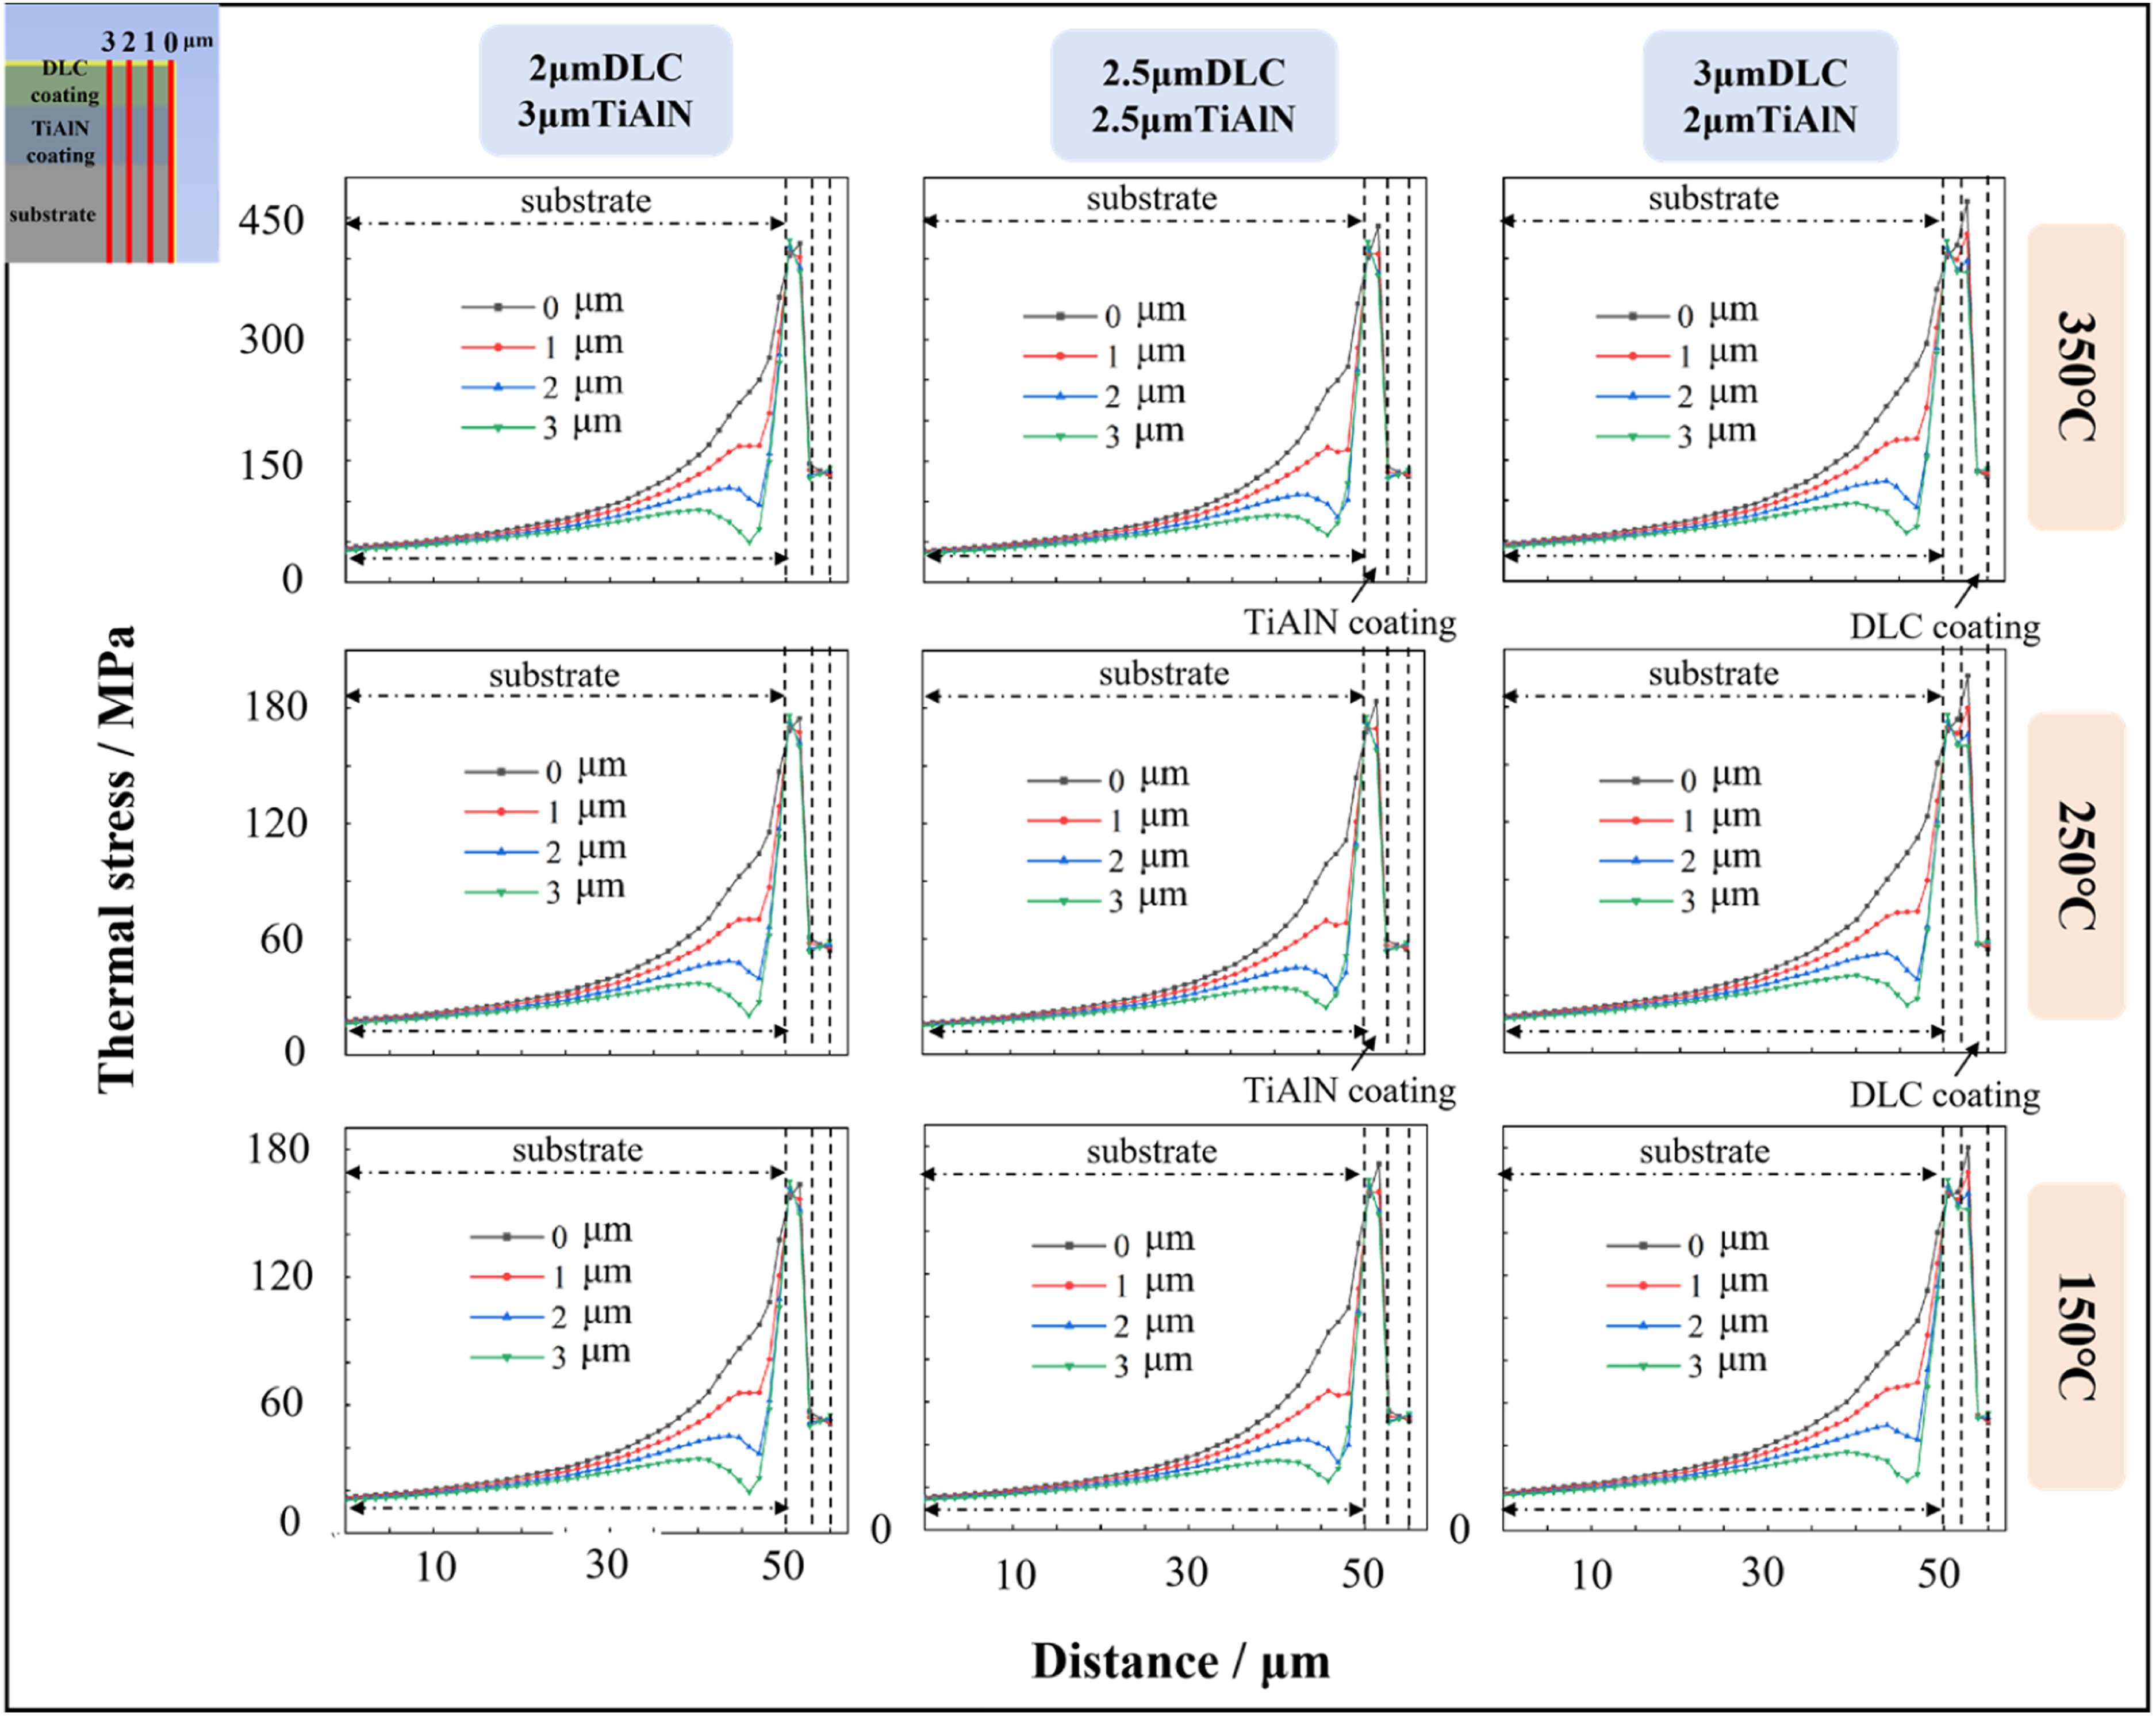
Radial stress distribution diagram along the thickness direction at different positions.
The four curves in Figure 8 represent paths at distances of 0 μm, 1 μm, 2 μm, and 3 μm from the system edge, fully illustrating the complex radial stress variations across the entire thickness. As thickness increases, all evaluated paths display radial tensile stress that eventually levels off in the substrate region. However, an acute stress spike occurs at the 50 μm interface boundary. This concentration is driven by differing material properties across the junction, followed by a gradual stress reduction throughout the coating layer. The coating endures higher tensile stress overall due to its relative thinness compared to the massive substrate. Spatially, the peak radial tensile stress is localized at the system's perimeter, dissipating as the distance from the edge increases. Ultimately, this intense localized stress at the margin is responsible for triggering microcrack formation.
The depth-dependent shear stress profiles at various positions are illustrated in Figure 9. Although all four paths share a consistent general trajectory, higher deposition temperatures consistently lead to an amplification in the absolute stress values. Interestingly, a stress inversion occurs within the substrate: the shear stress transitions from a tensile state near the lower boundary of the interface to a compressive state at the upper boundary. However, at the TiAlN coating-substrate interface, not only a stress discontinuity but also a stress reversal is observed. Substrate stress undergoes a sharp change near the interface (at a depth of 50 μm), while stress within the TiAlN coating exhibits tensile characteristics. Vertically, the stress gradient shifts from tensile to compressive in the vicinity of the DLC/TiAlN boundary, peaking adjacent to the coating-substrate junction. Horizontally, the most severe compressive shear stress is localized at the margins of the coating. This localized stress accumulation is a primary driver of interfacial delamination; experimentally, this is confirmed by the premature delamination and spalling initiating predominantly at the coating boundaries during scratch and wear testing.
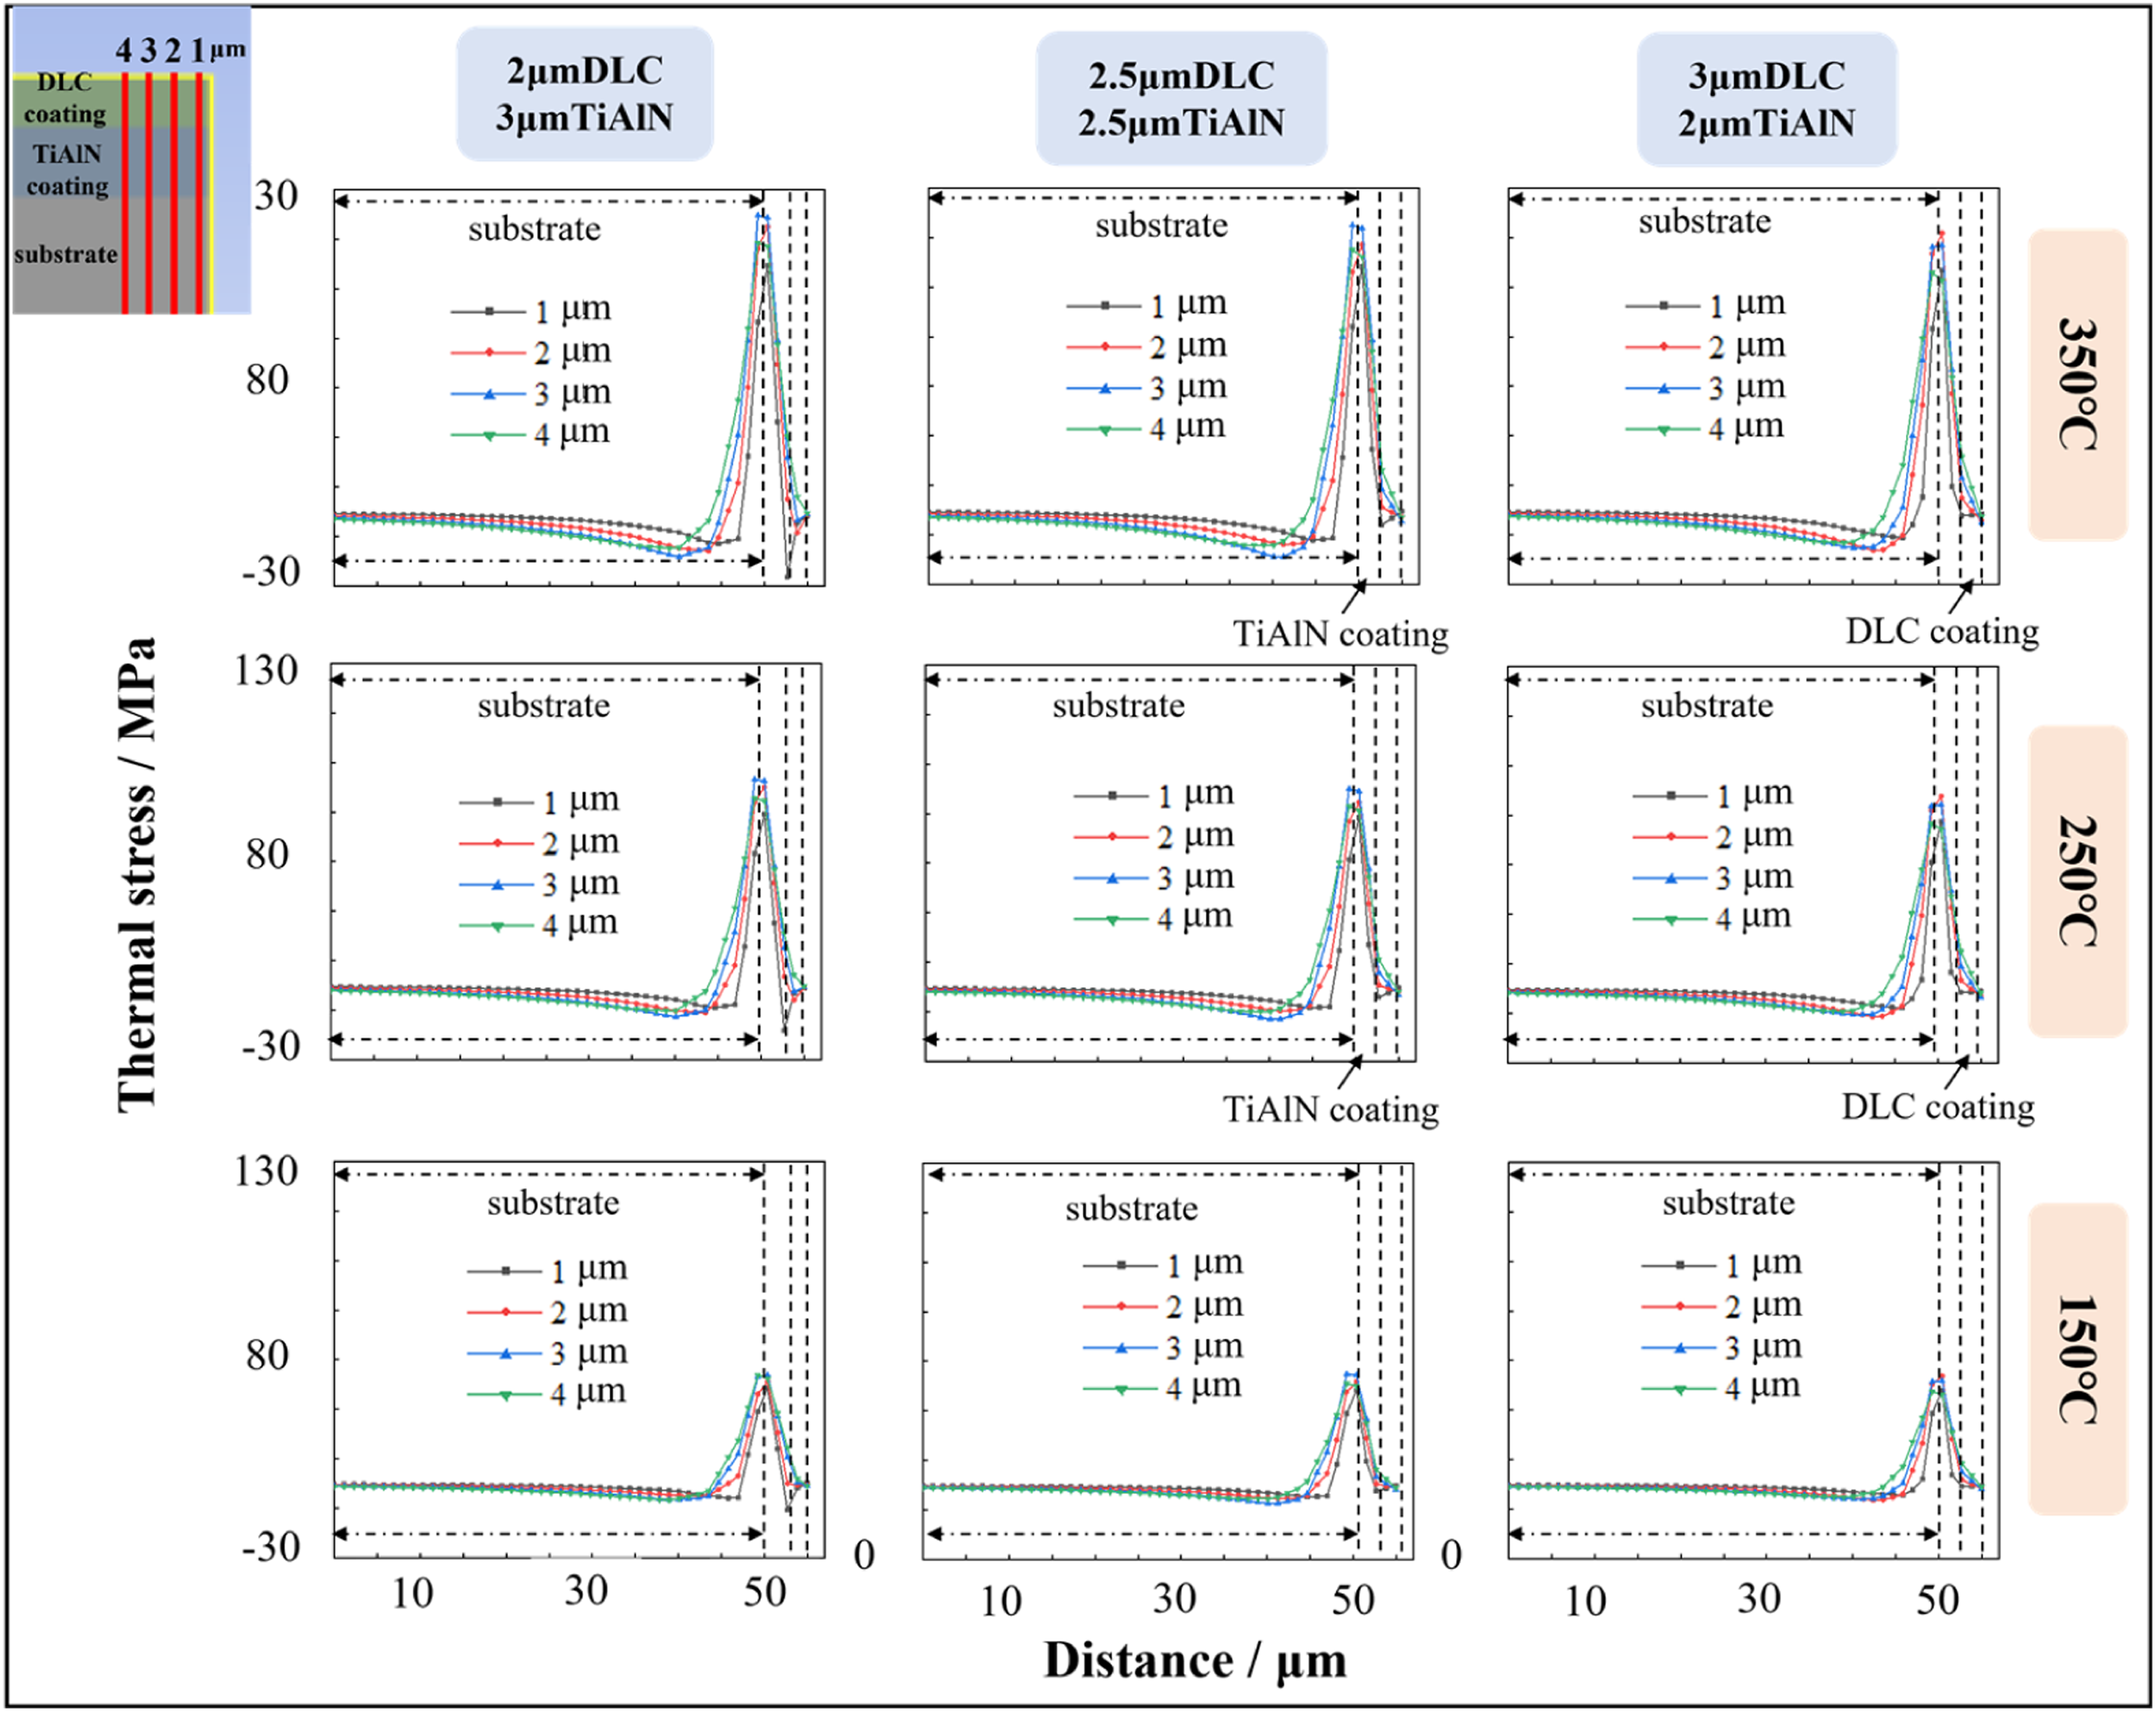
Shear stress distribution diagram along the thickness direction at different positions.
To more intuitively observe the variation in thermal stress, the maximum thermal stress simulation results for the different coating structures and temperatures were plotted on a single graph. This reveals the trend of thermal stress variation with respect to parameter changes. Figure 10 shows (a) the thermal stresses of three coatings with different thicknesses at 150°C and (b) the thermal stresses of a 2 μm DLC coating + 3 μm TiAlN coating at three temperatures. It can be observed that thermal stress increases as the TiAlN coating thickness decreases. During the thermal expansion process, the mechanical confinement imposed by the substrate actively induces thermal stress within the deposited film. Thicker coatings result in greater stress per unit area, thus yielding lower thermal stress. The variation in thermal stress with temperature is also evident: thermal stress increases with rising temperature. Higher deposition temperatures lead to non-uniform temperature distribution within the coating, creating larger temperature gradients that consequently increase thermal stress.
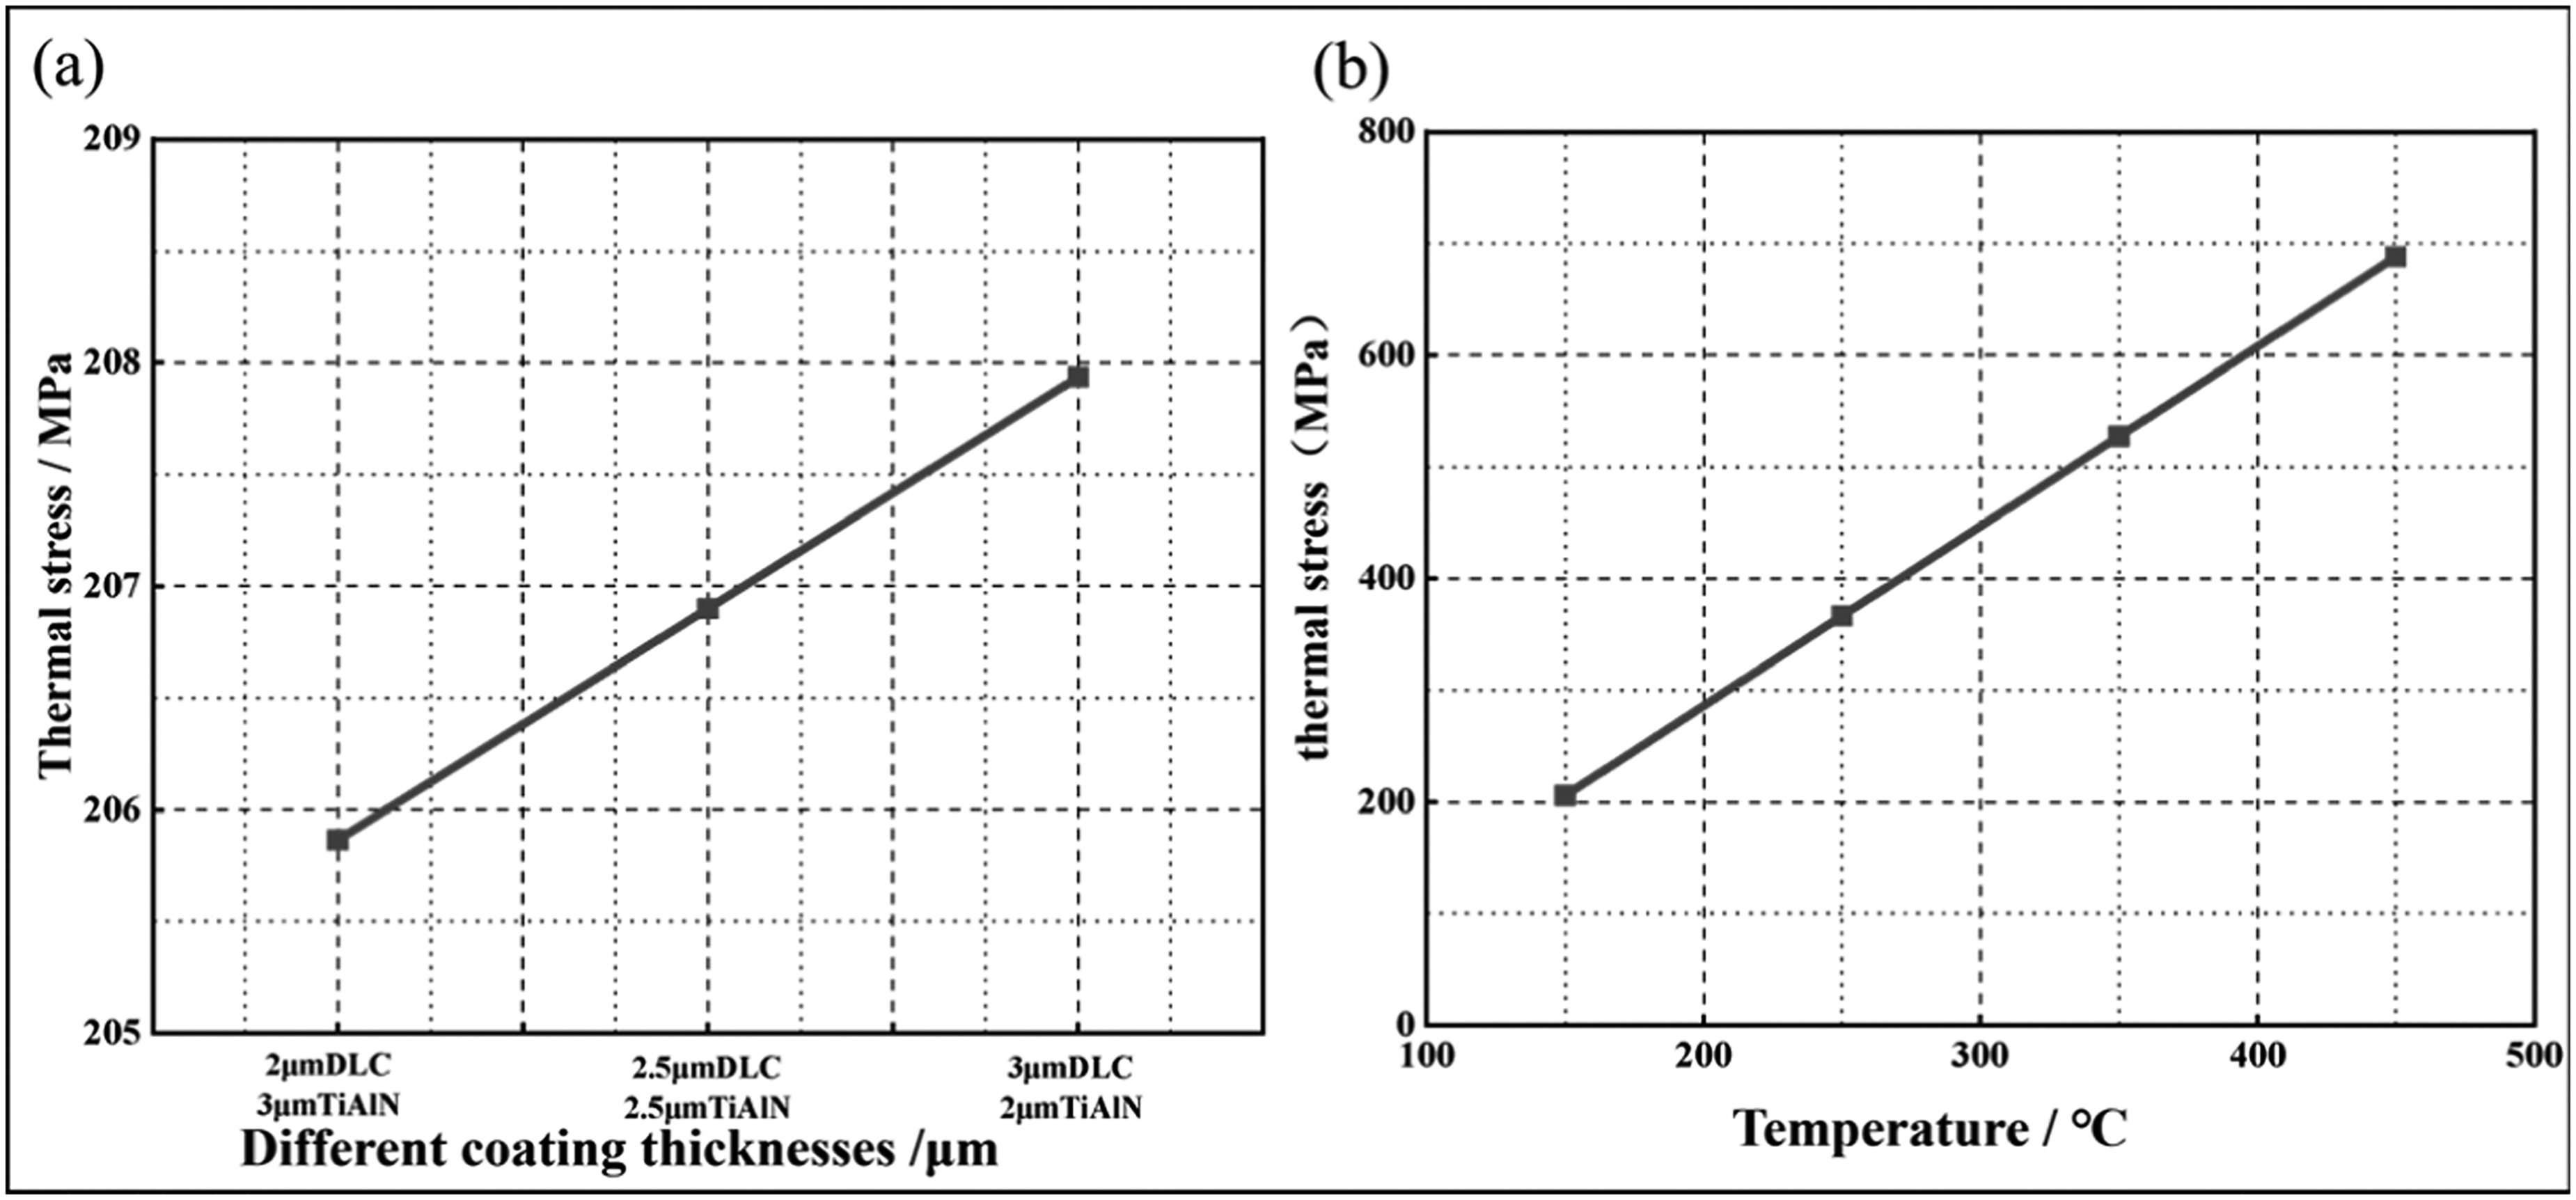
(A) thermal stress of coatings with different thicknesses at 150 °C; (b) thermal stress of a 2 μm DLC coating + 3 μm tiAlN coating at different temperatures.
During the simulation process, this study considered the influence of a single variable on thermal stress by altering only one parameter while fixing all others. With coating thickness and substrate thickness held constant, variations in temperature cause Von Mises stress to follow the fourth-order theory, commonly used to evaluate stress levels in materials under complex thermal stress conditions. Therefore, thermal stresses derived from finite element analysis can be represented by Von Mises stress. 20 However, when simulation results exhibit uncertainty, error analysis is necessary to better demonstrate the reliability and accuracy of the simulation outcomes. Figure 11 presents the calculated and simulated thermal stress error analysis results as a function of temperature. The magnitude of thermal stress scales linearly as the temperature rises. The simulation results show an error range of 1%-4% compared to calculations. The finite element analysis results align with analytical formulas, confirming the reliability of the simulation outcomes. Therefore, during coating design and preparation, residual stresses within the coating must be carefully controlled to enhance coating performance and service life. Based on these theoretical findings, a 2-μm DLC / 3-μm TiAlN bilayer is established as the preferred structural design, a result that necessitates further validation via actual experimental testing.
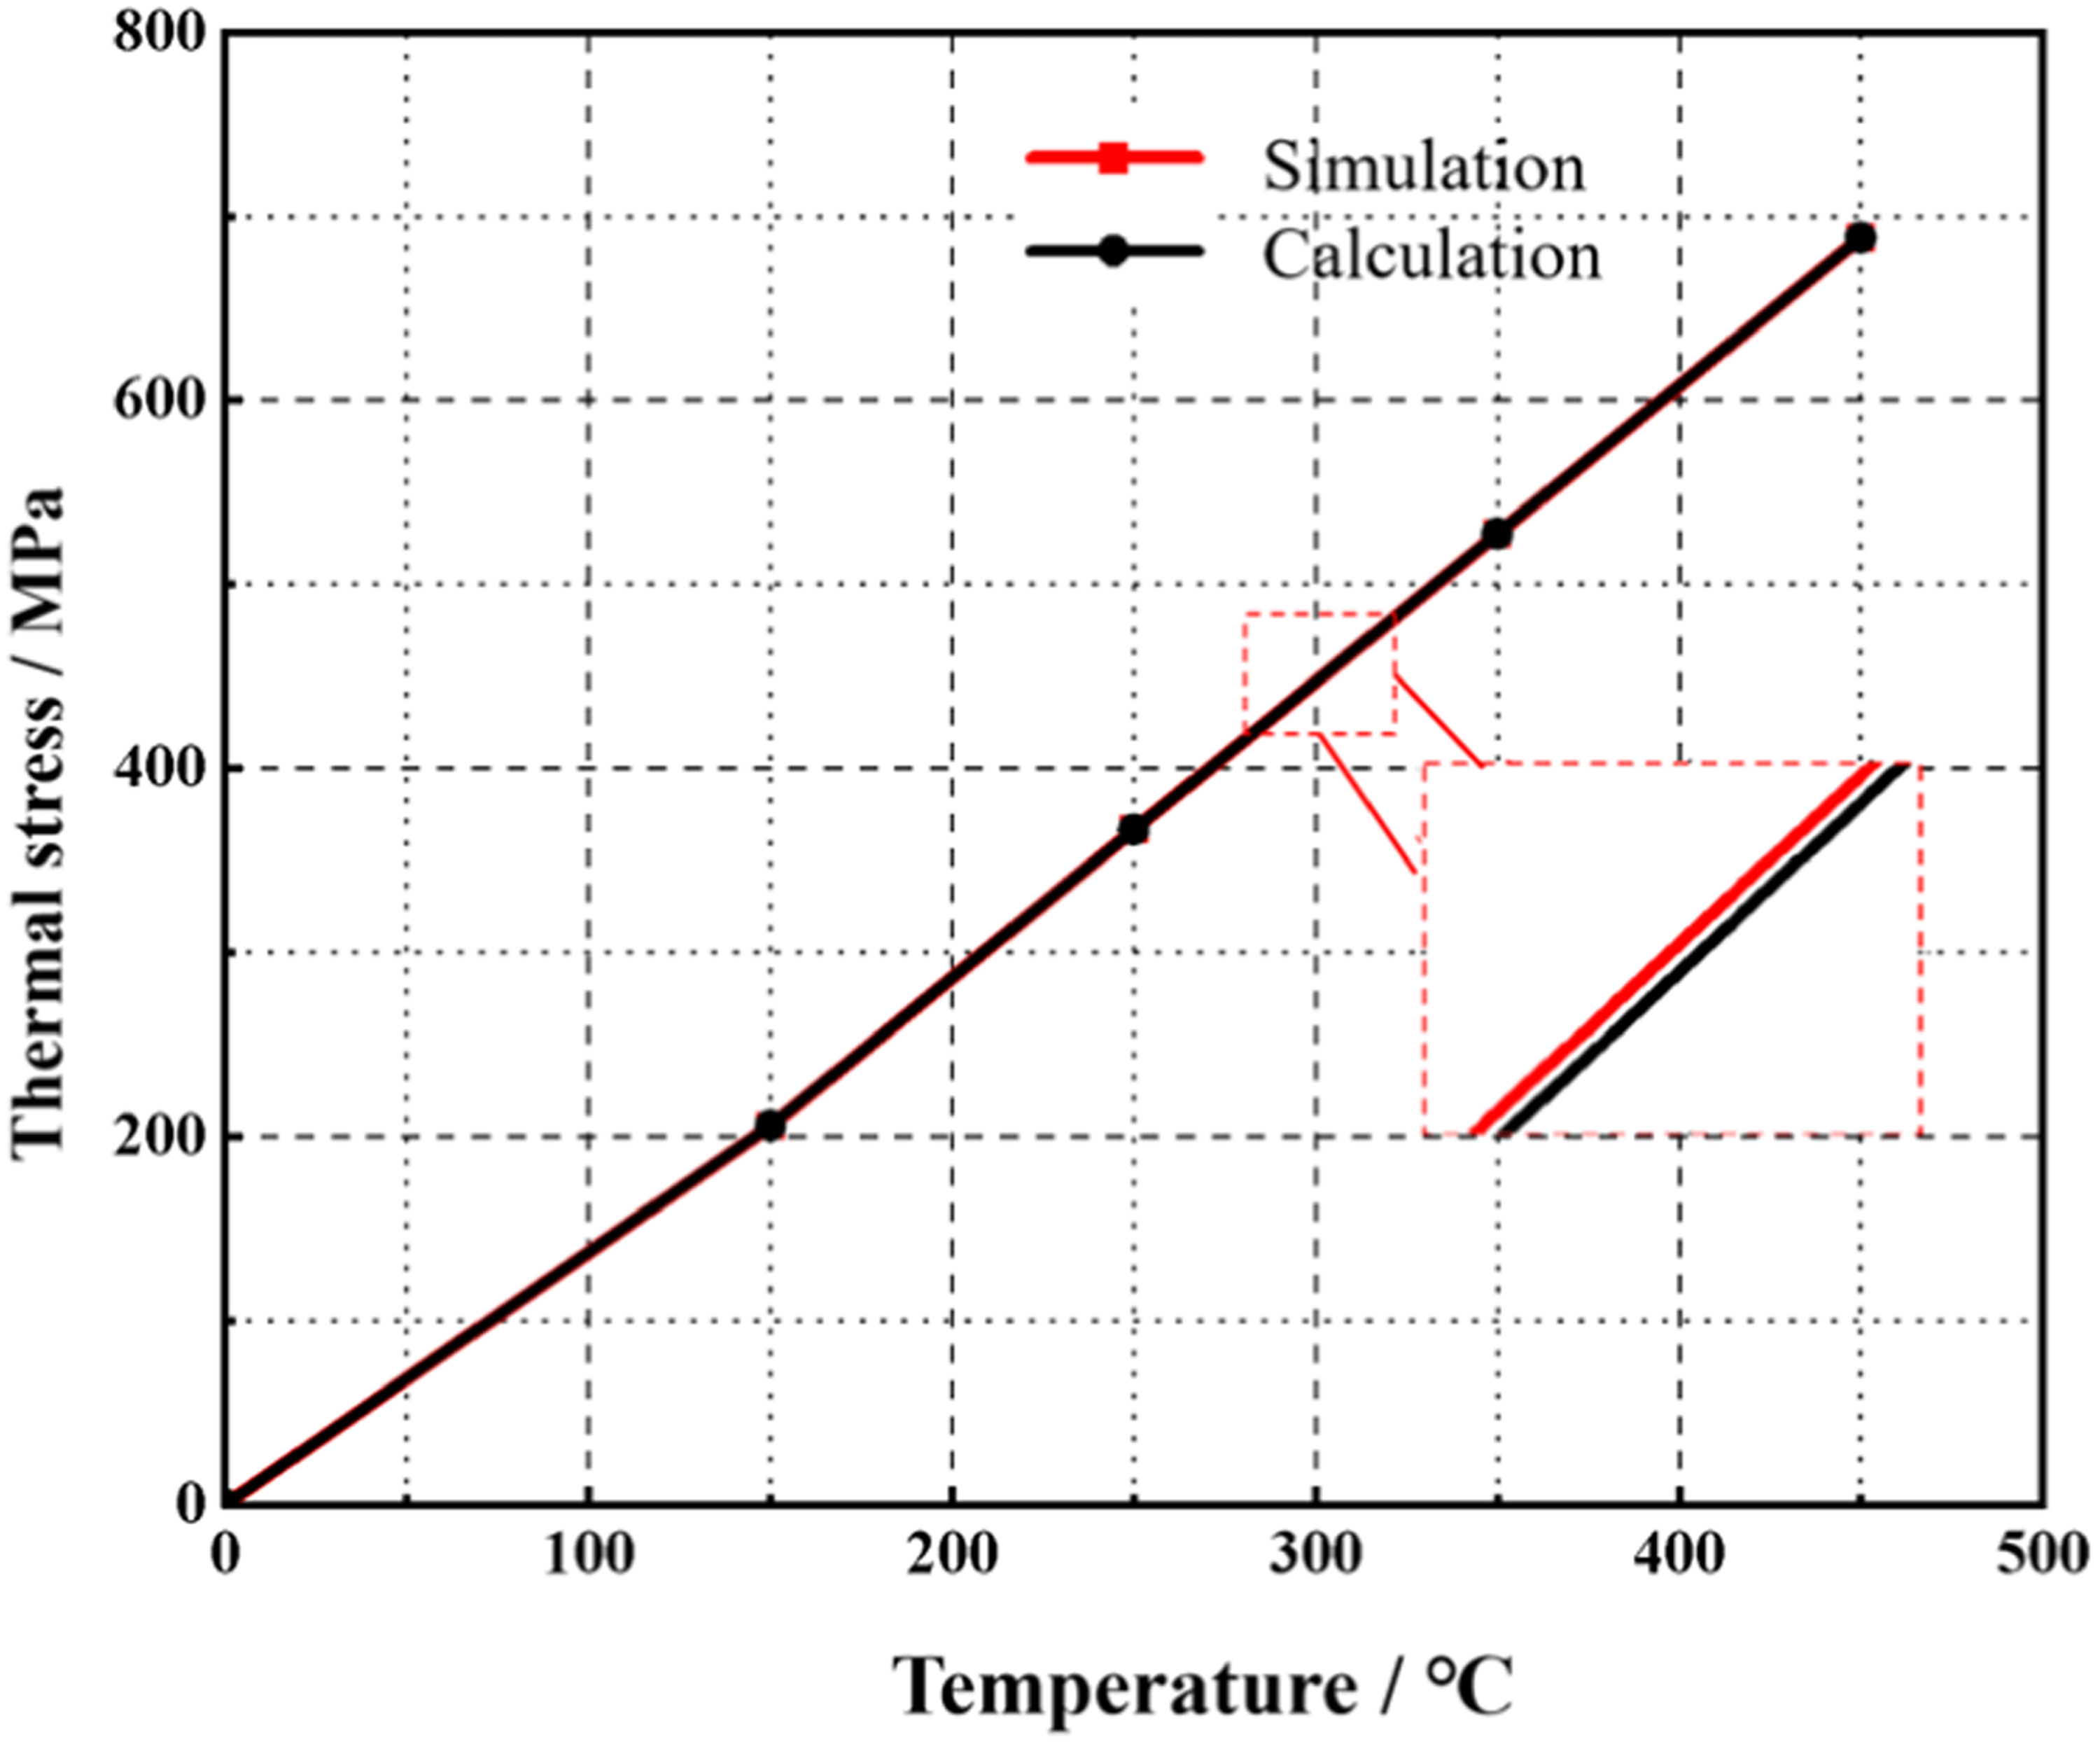
Calculation and simulation error analysis chart.
To verify model reliability, the simulated stress magnitudes were cross-verified with classical analytical solutions. The numerical stress values scale linearly with temperature, exhibiting a minimal deviation of 1%–4% from the analytical Stoney equation integrated with the Clyne–Tsui framework (Figure 11). This mathematical alignment confirms that the finite element model accurately captures the thermo-elastic stress fields driven by thermal expansion mismatches. Dynamically, high residual stress preloads the microstructure, drastically lowering the external mechanical threshold required to trigger cracking or spalling. Decreasing the TiAlN interlayer thickness causes severe interfacial shear stress concentrations, driving premature brittle delamination under sliding or scratching forces. Optimizing the architecture to a 2-μm DLC / 3-μm TiAlN configuration reduces the simulated interfacial shear stress concentration by 42% (Figure 11). This structural mitigation directly suppresses the mechanical driving force for crack propagation, theoretically underpinning the enhanced critical load and superior wear resistance observed in subsequent experimental validation.
Analysis of friction and wear tests
Figure 12 displays the friction wear traces and corresponding track height analysis diagrams of the test ball wear morphology on three different coating thickness samples: (a) 3 μm DLC + 2 μm TiAlN, (b) 2.5 μm DLC + 2.5 μm TiAlN, and (c) 2 μm DLC + 3 μm TiAlN. The figure reveals severe wear on the 3 μm DLC + 2 μm TiAlN coated sample, exhibiting the largest wear track and deepest wear depth reaching 5 μm, as shown in Figure 12(a). The wear morphology of the 2 μm DLC + 3 μm TiAlN coated sample showed improvement, with reduced wear track width and a wear depth around 3 μm. This can be attributed to residual stresses within the coating. Simulation results indicate that stress increases as the TiAlN coating thickness decreases. High residual stresses induce stress concentration, reducing coating adhesion and increasing brittleness. This makes the coating prone to cracking or spalling under load, diminishing its durability and stability. It also adversely affects mechanical properties like strength and hardness, leading to reduced wear resistance and compressive strength. Ultimately, this degrades coating performance and cause coating failure. Friction and wear test results reveal that peak performance is achieved by the composite architecture comprising 2 μm of DLC and 3 μm of TiAlN.
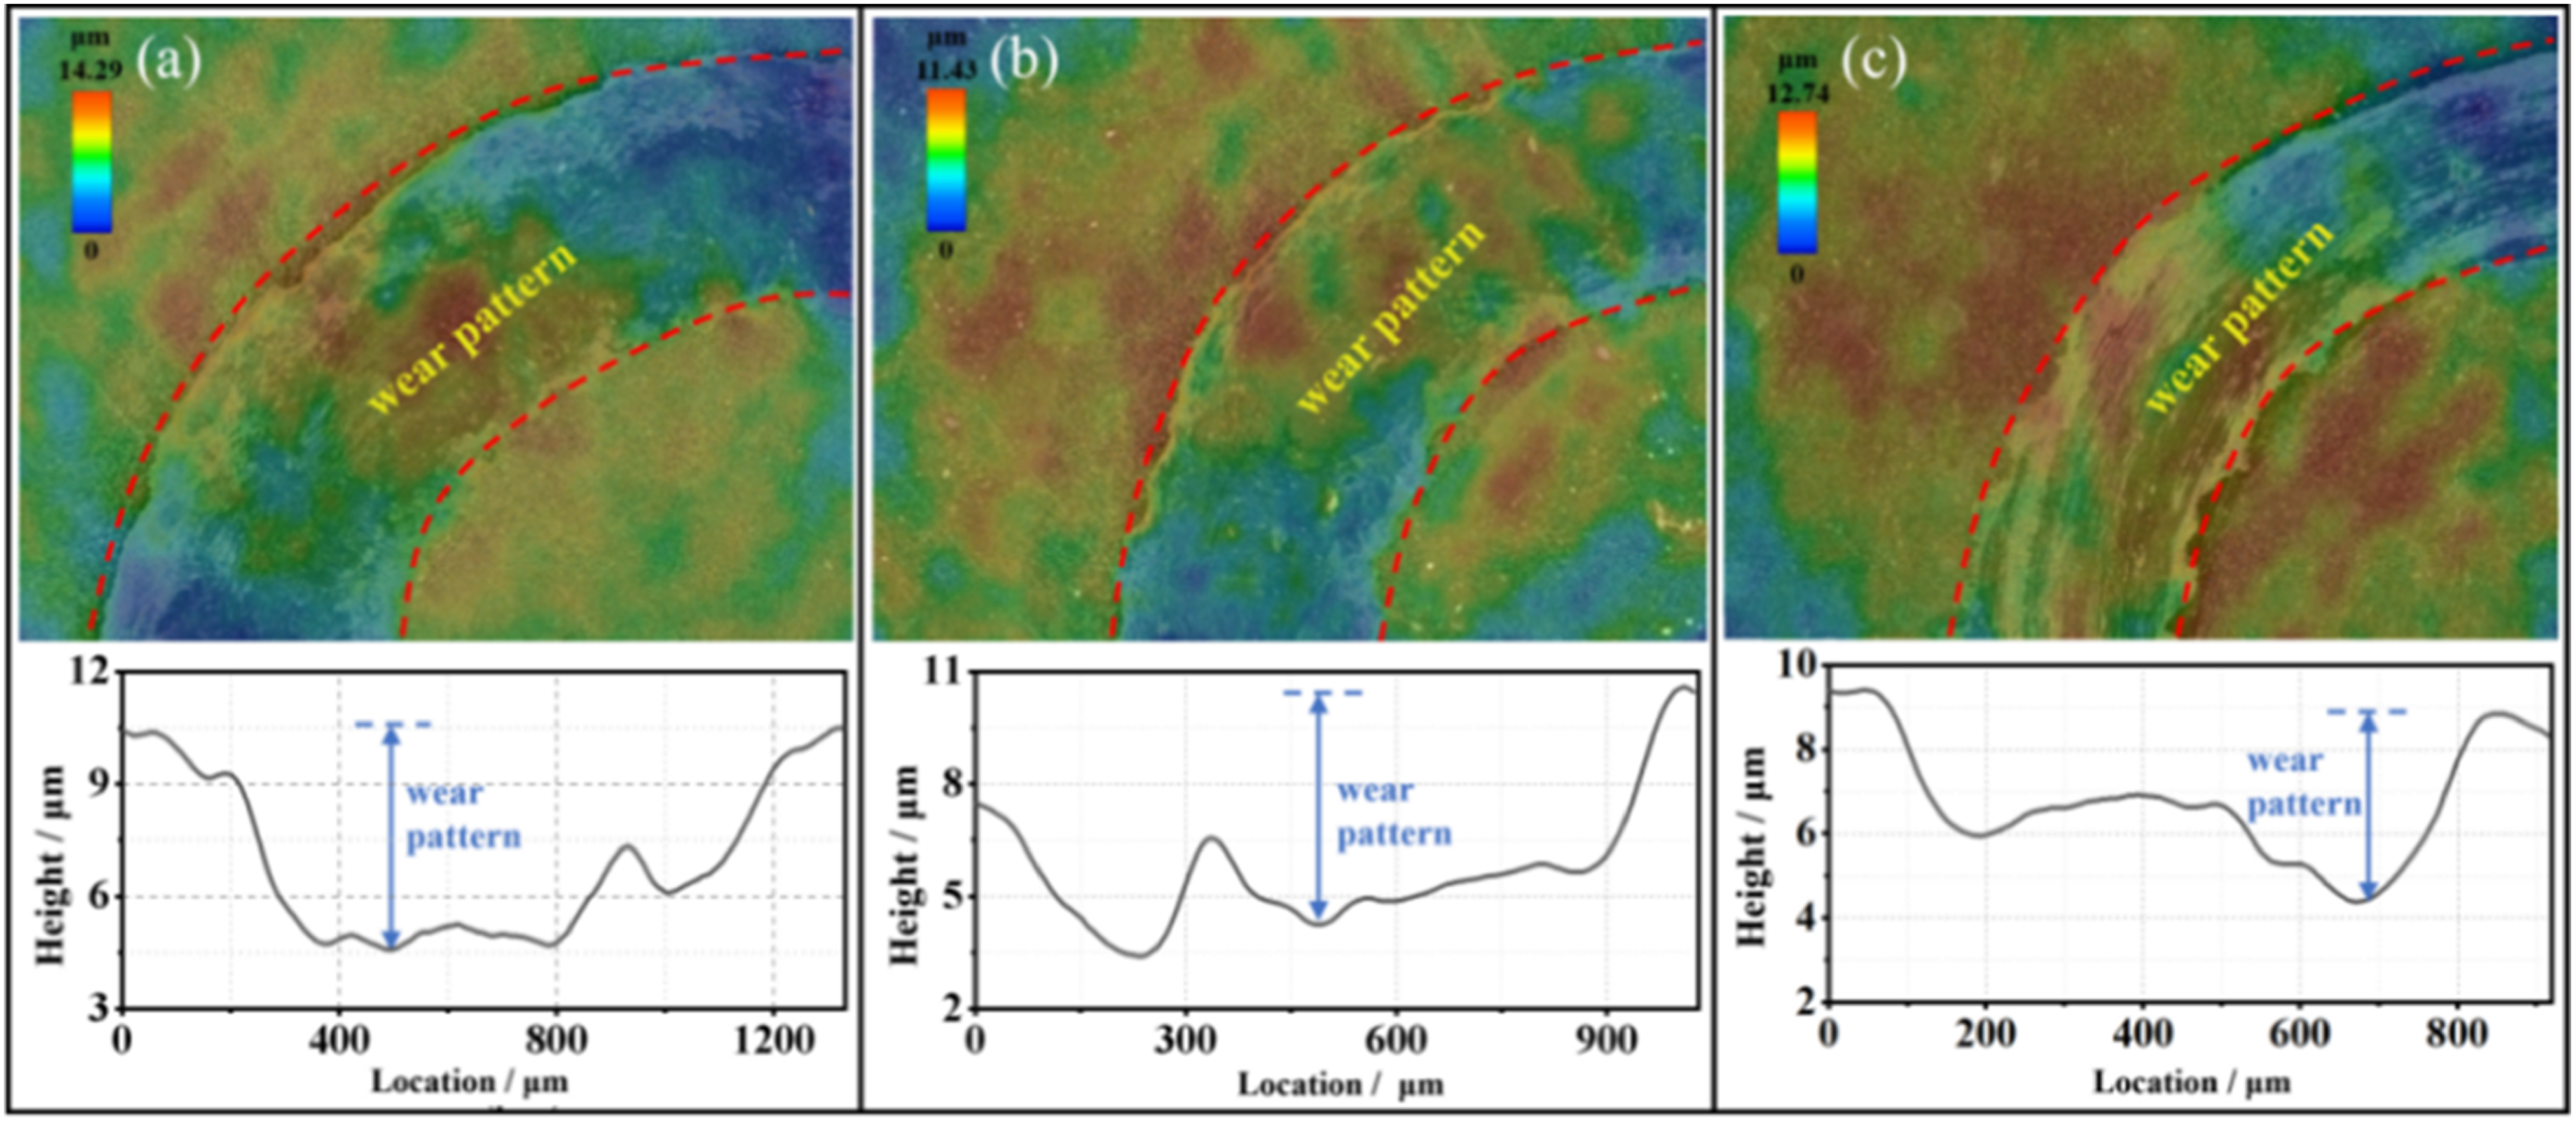
Analysis of friction and wear traces and corresponding track height for three samples with different coating thicknesses.
SEM/EDS analysis of the wear morphology of test balls on the above samples with different coating thicknesses is shown in Figure 13: (a) 3 μm DLC + 2 μm TiAlN, (b) 2.5 μm DLC + 2.5 μm TiAlN, and (c) 2 μm DLC + 3 μm TiAlN. It reveals that under identical conditions, the 3 μm DLC + 2 μm TiAlN coated specimen exhibited the most severe wear morphology, with the largest wear zone diameter reaching 1317.3 μm, as shown in Figure 13(a). For the 2 μm DLC + 3 μm TiAlN coated specimen, the wear morphology was mitigated, with the wear area diameter reduced to 982.2 μm. However, some wear debris remained on the surface, as shown in Figure 13(c). This corresponds to the wear traces observed on the coated specimens above, indicating that the lower residual stress in the coating positively influences the wear behavior between the ball and the coated specimen. In summary, the composite coating structure of 2 μm DLC + 3 μm TiAlN delivers the most favorable performance.
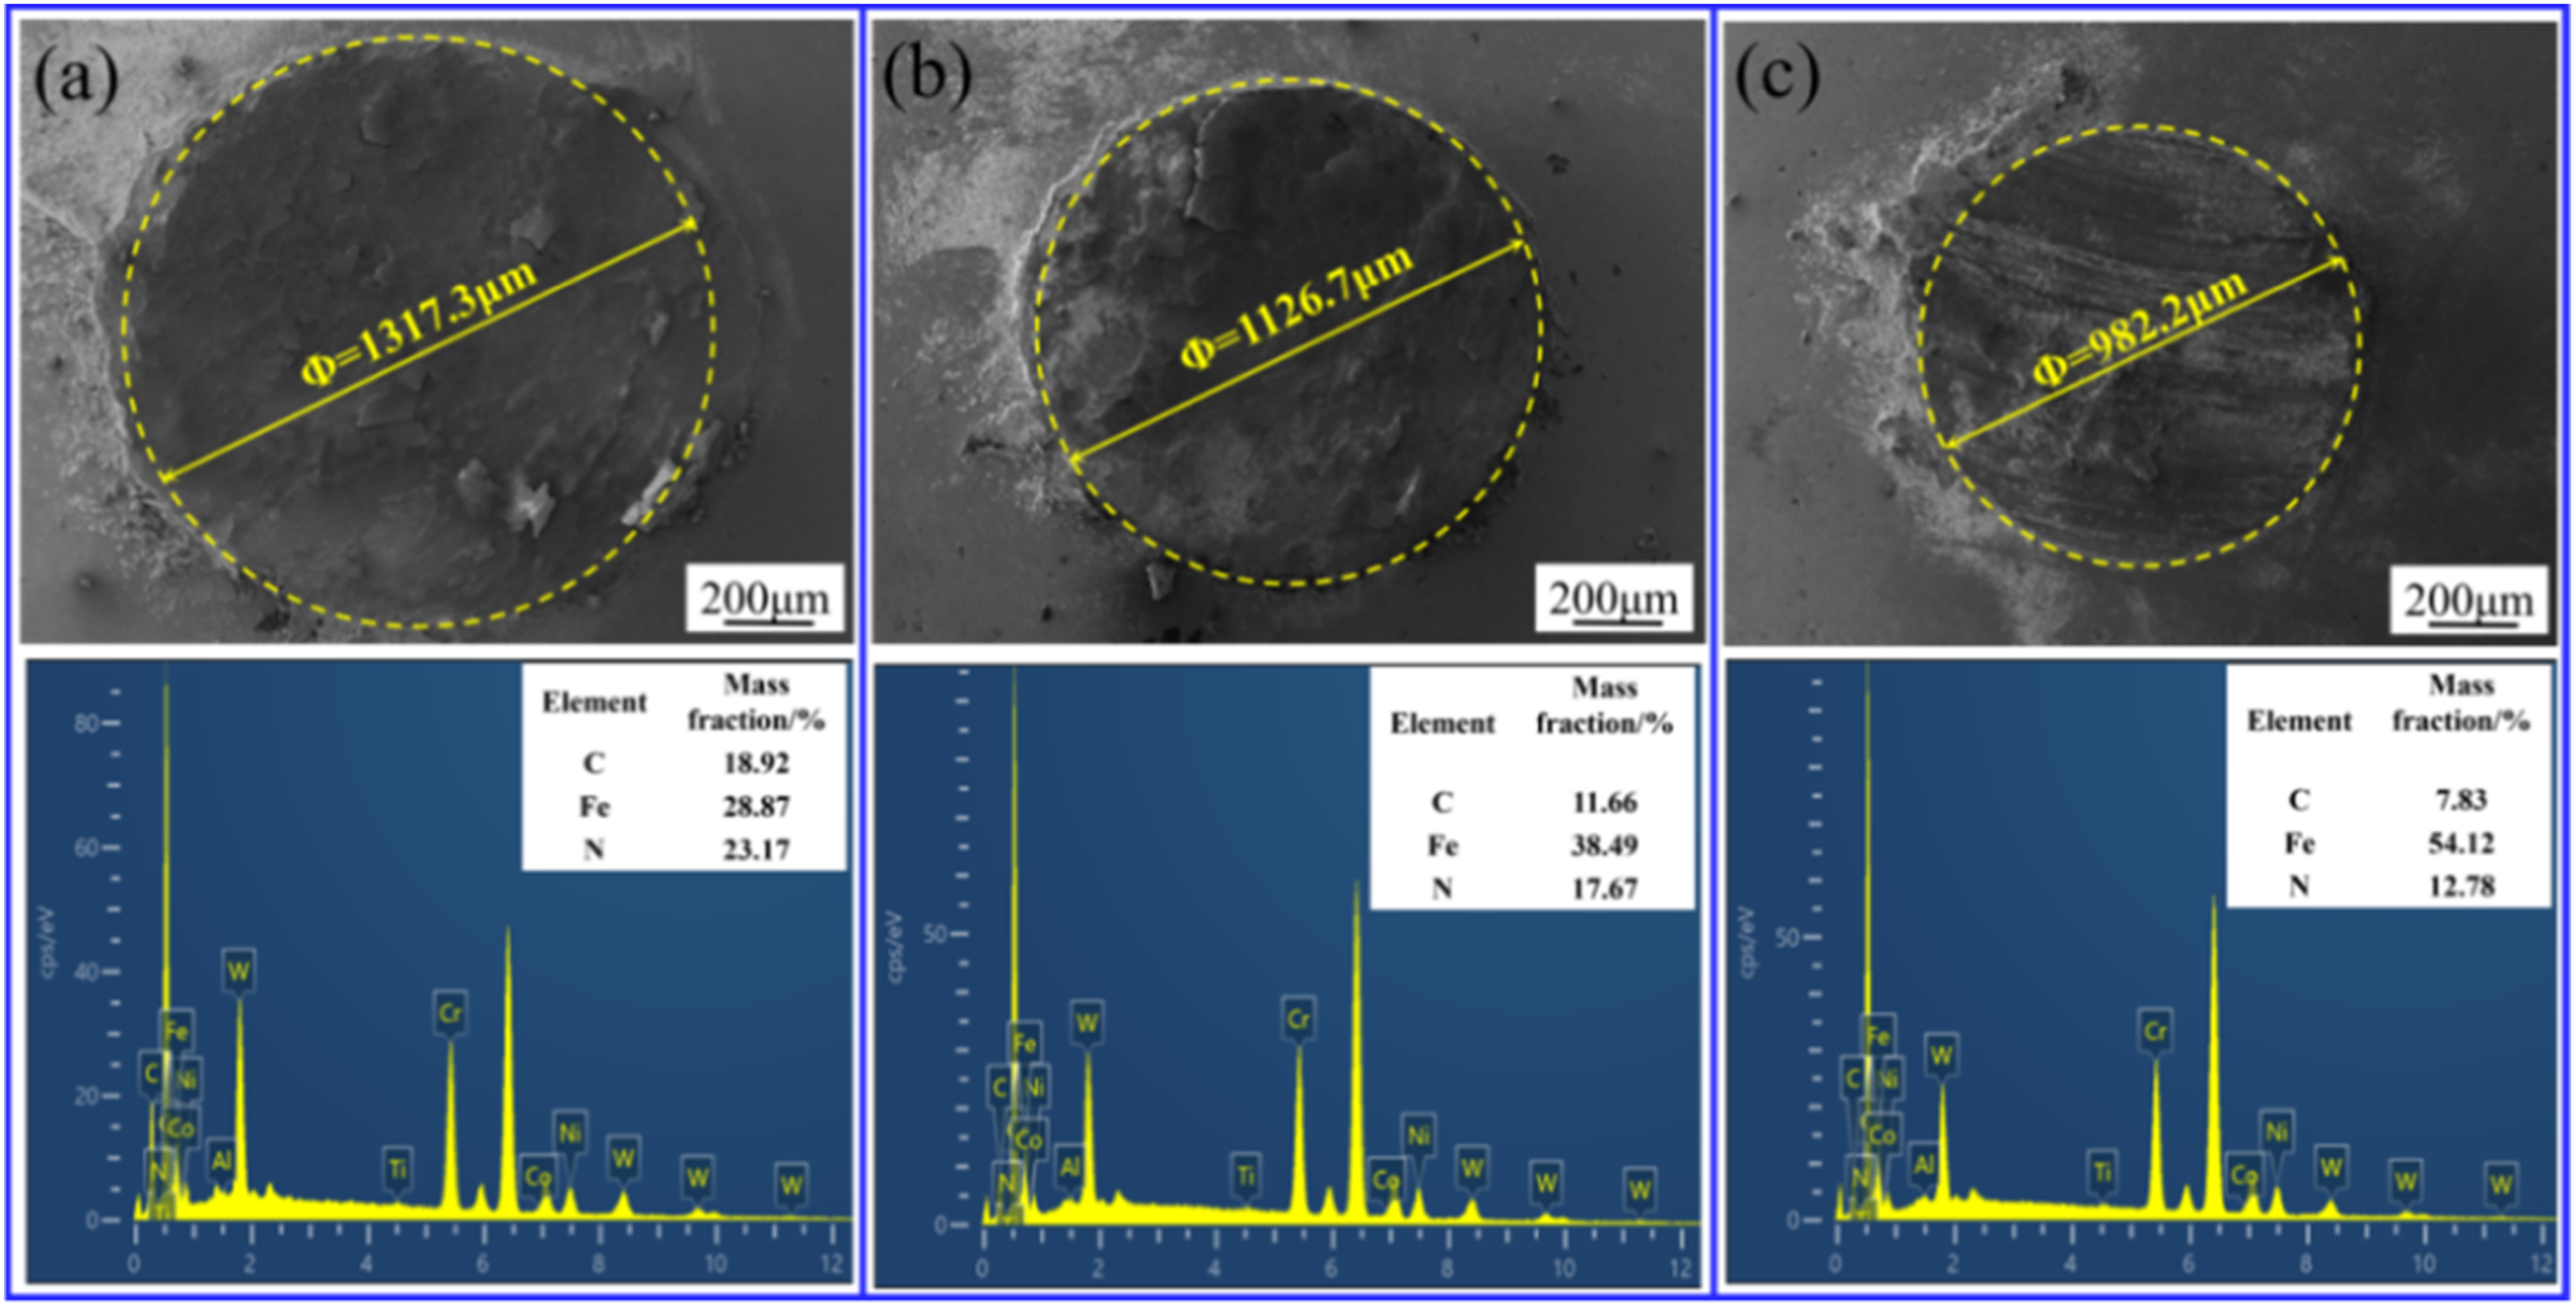
SEM/EDS analysis of wear morphology on sample grinding balls.
Micro-scratch failure analysis
The post-scratch SEM micrographs, alongside their respective EDS elemental maps, are presented in Figure 14 for three DLC/TiAlN composite configurations with varying thickness proportions but a constant overall thickness of 5 μm. Notably, the scratch assay serves as a critical technique to assess the interfacial bonding strength and to characterize the predominant wear failure mechanisms of the coating-substrate system. 21
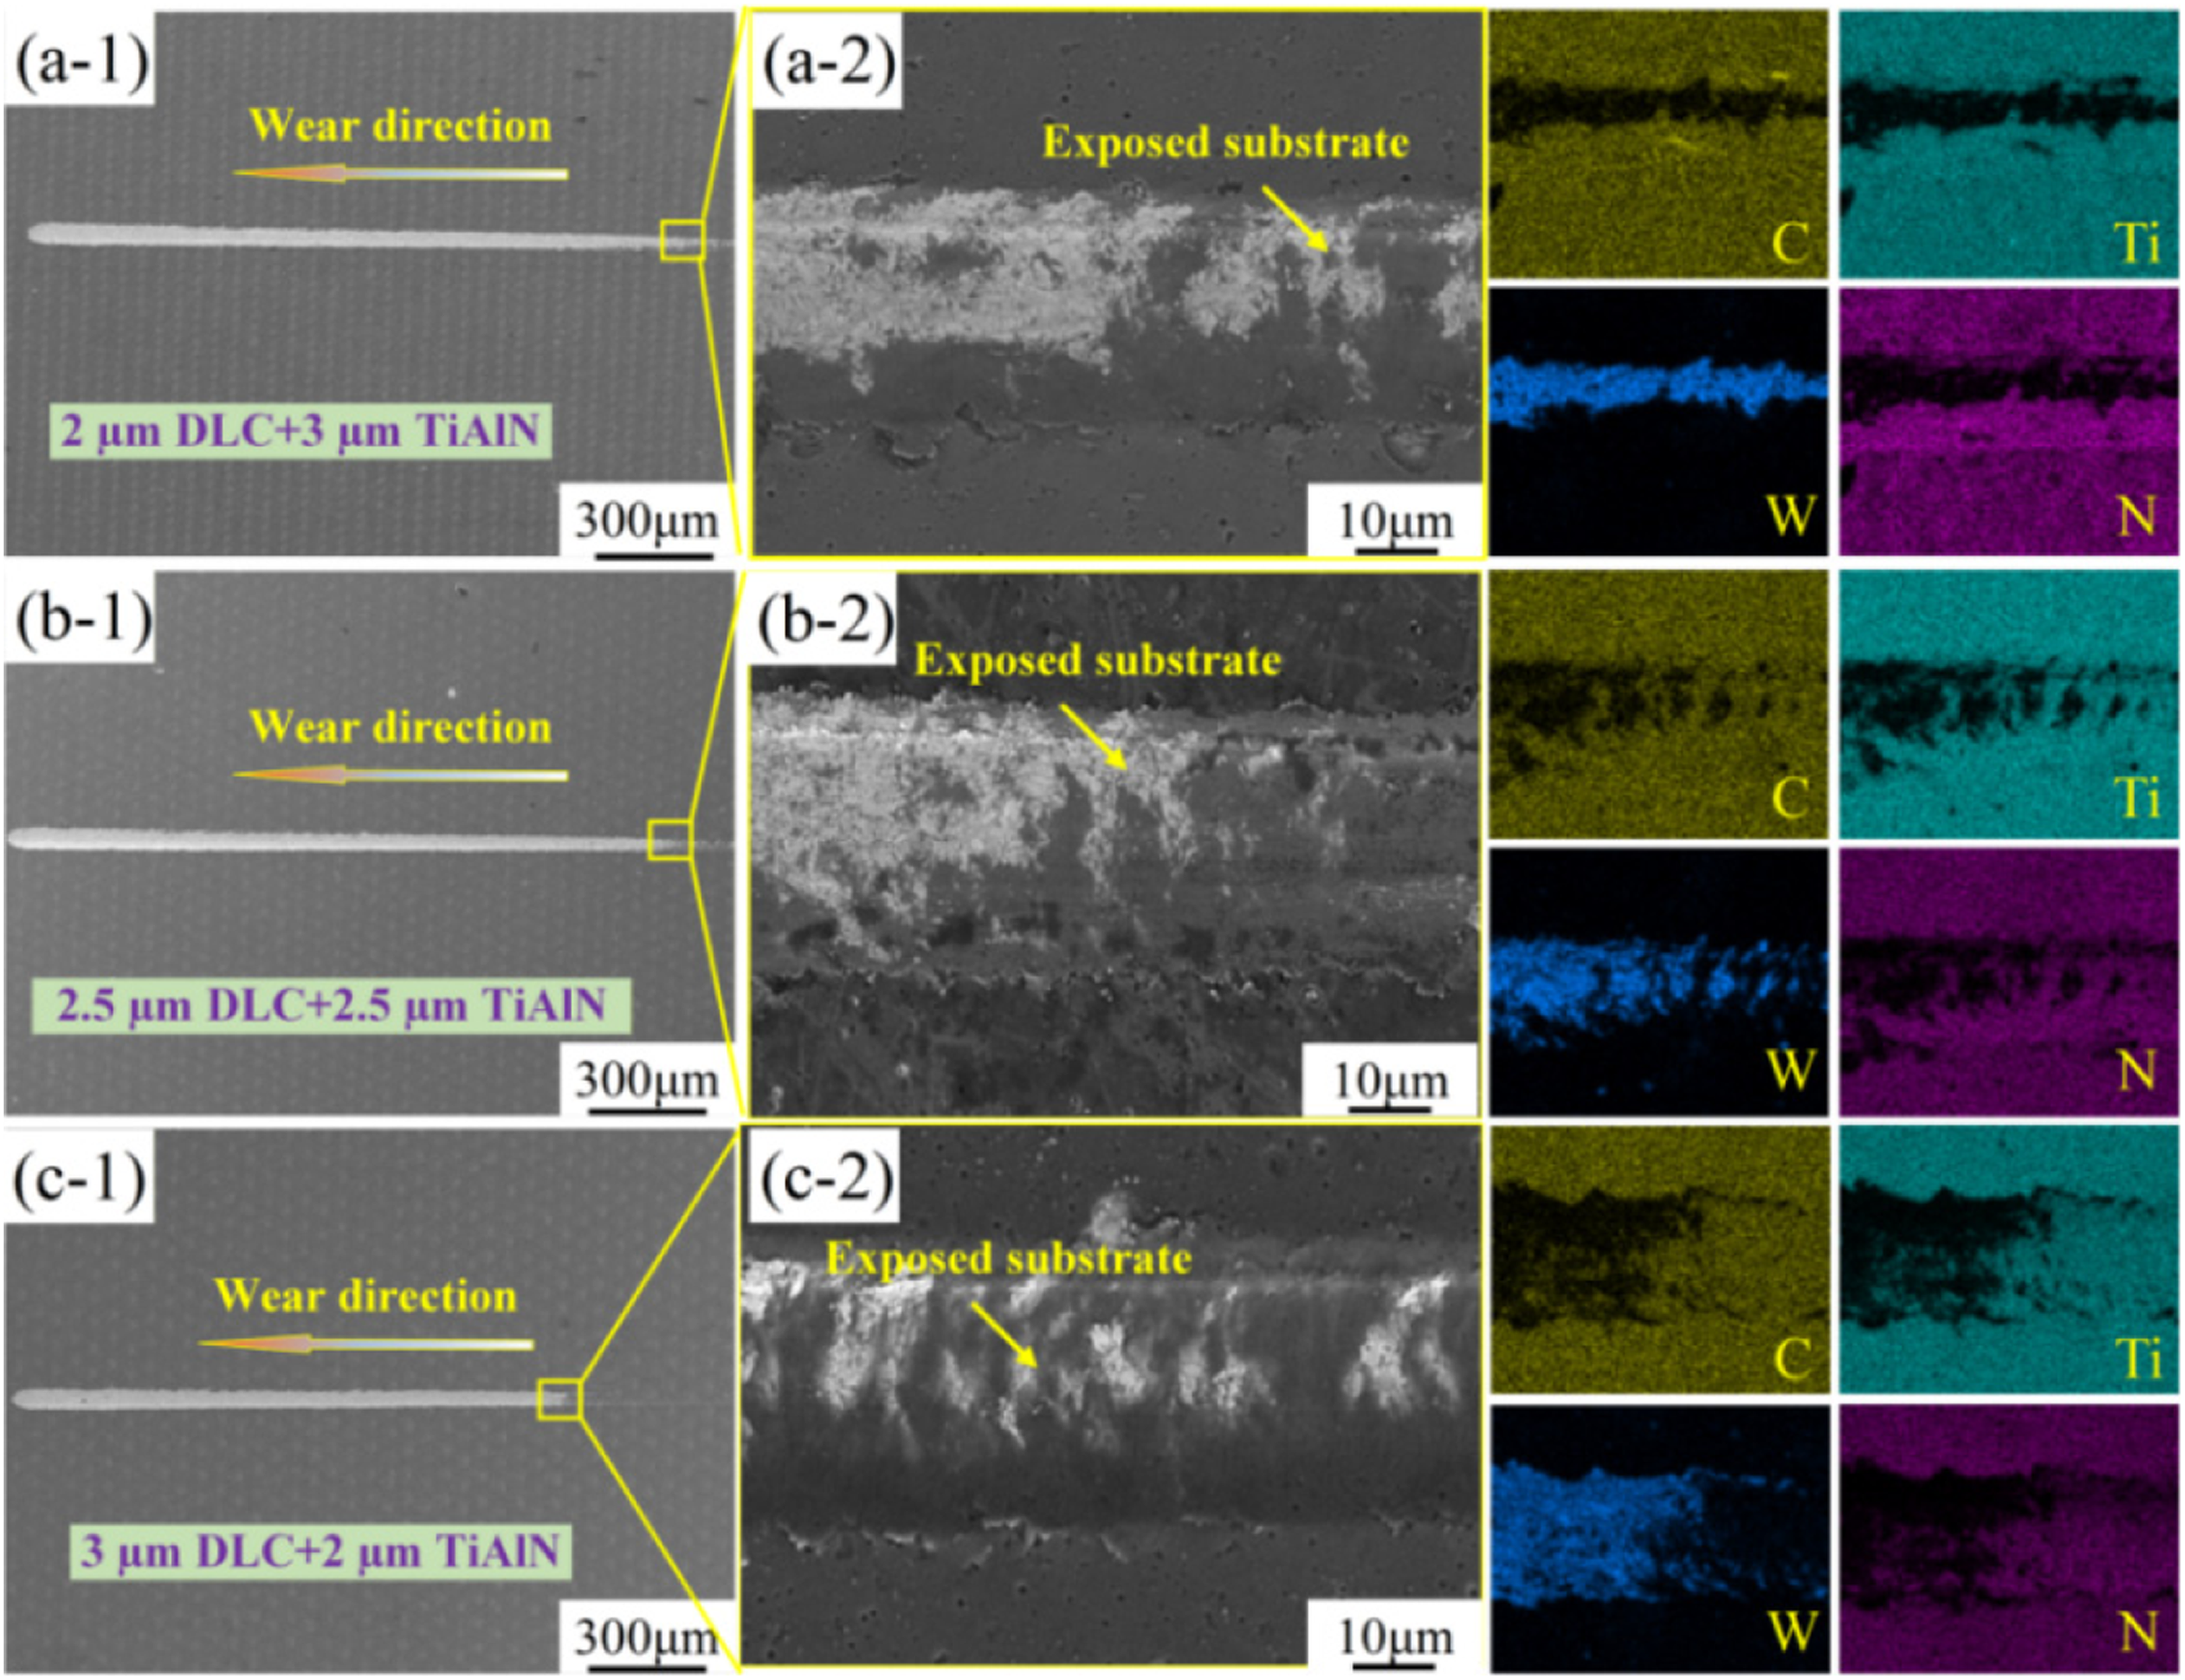
Scratch test morphology SEM/EDS analysis of three samples with different coating thicknesses.
As shown in (a-1, a-2) of Figure 14, when the underlying TiAlN layer was 3 μm thick and the top DLC layer is 2 μm thick, although substrate exposure occurs at the scratch tip, the delaminated coating area remained relatively narrow with neat edges, indicating good peel resistance of this structure. The presence of W elements in the EDS map confirms substrate exposure, while the absence of C, Ti, and N elements at the scratch center further verifies the penetrating damage to the coating.
As the thickness of the top DLC layer increased (samples b and c), the failure mode of the coating underwent significant changes. In Figure 14(b), when both layers had equal thickness, the area of coating spalling increased, accompanied by substantial accumulation of abrasive particles within the grooves. In Figure 14(c), when the DLC layer thickness increased to 3 μm (with TiAlN reduced to 2 μm), the coating exhibited the most severe failure behavior. Figure 14(c-2) clearly shows extensive brittle spalling and flaking, with EDS results indicating the widest exposure of W elements.
The aforementioned phenomenon can be attributed to the competing mechanism between internal stresses and load-bearing capacity within the coating system. DLC coatings accumulate significant internal compressive stresses as film thickness increases, raising the total internal stress substantially.This accumulation reduces the interfacial bonding energy, increasing the probability of brittle fracture under load.Thus, a thicker TiAlN underlayer indicates load-bearing capacity improves through hardness support. However, findings show substrate plastic deformation is constrained effectively. In light of these results, the thinner support layer shows it fails to counteract high internal stress from thick DLC, suggesting bonding strength diminishes and scratch resistance reaches its lowest observed level. Furthermore, the important experimental evidence indicate that the composite coating structure demonstrates that optimal performance results emerge specifically from the 2μm DLC + 3μm TiAlN configuration.
Conclusion
Through finite element simulation and experiments, this study analyzed the thermal stress and potential failure mechanisms of DLC/TiAlN composite coatings. The established finite element model showed reasonably good agreement with theoretical calculations (deviation within 10%) when considering temperature-related effects. This suggests the model is a potential tool for estimating stress tendencies within the coating.
Simulations imply that thermal stress generally increases with higher deposition temperatures, while low-temperature deposition at 150°C was observed to reduce thermal mismatch stress. Further simulation results suggest that increasing the TiAlN interlayer thickness to 3 μm might help mitigate the substrate's thermal drag effect on the DLC layer, which is associated with reductions in simulated interfacial stress under the conditions studied.
Friction-wear and scratch tests provided preliminary supportive evidence. Specimens with optimized structural parameters tended to exhibit relatively low wear rates and higher critical loads within the tested scope. They also showed a mitigated brittle cracking mode in scratch testing compared to other investigated thickness ratios. These observed trends imply that a lower residual stress state potentially contributes to suppressing brittle crack propagation and improving apparent film-substrate bonding strength.
Footnotes
Acknowledgments
This work is supported by the National Natural Science Foundation of China (No.52375197).

Author contribution(s)
Funding
The authors disclosed receipt of the following financial support for the research, authorship, and/or publication of this article: This work was supported by the National Natural Science Foundation of China, (grant number 52375197).
Credit authorship contribution statement
Declaration of competing interest
The authors declare that they have no known competing financial interests or personal relationships that could have appeared to influence the work reported in this paper.
Declaration of conflicting interests
The authors declared no potential conflicts of interest with respect to the research, authorship, and/or publication of this article.