






Abstract
Objectives
The aim of this study was to compare metabolic status and biochemical indices associated with cardiovascular risk, including the triglyceride–glucose (TyG) index, triglyceride–glucose–body mass index (TyG-BMI), and atherogenic lipid indices, between obese individuals with and without lipedema, and to evaluate the potential effect of lipedema on these parameters.
Materials and Methods
This cross-sectional study included 70 obese patients diagnosed with lipedema and 70 obese control individuals without lipedema. Fasting glucose, total cholesterol, LDL-cholesterol, HDL-cholesterol, and triglyceride levels were recorded. Based on these parameters, the TyG index, TyG-BMI, atherogenic index of plasma (AIP), atherogenic coefficient (AC), and Castelli risk indices I (CRI-I) and II (CRI-II) were calculated.
Results
No significant differences were observed between the lipedema and control groups in fasting glucose, total cholesterol, HDL-cholesterol, triglyceride levels, TyG, TyG-BMI, or atherogenic lipid indices (all p > .05). LDL-cholesterol levels were significantly lower in the lipedema group compared with the control group (p = .008). In the lipedema group, TyG-BMI showed a positive correlation with age and BMI, whereas no significant associations were found with symptom duration or pain severity.
Conclusion
Although LDL-cholesterol levels were lower in obese individuals with lipedema, this difference was not reflected in biochemical indices associated with metabolic status and cardiovascular risk. Importantly, metabolic parameters in patients with lipedema accompanied by obesity were comparable to those observed in individuals with obesity alone, suggesting that obesity rather than lipedema may be a more important determinant of metabolic risk in this population. Therefore, metabolic evaluation should not be overlooked in patients with lipedema, and the management of obesity should be considered in treatment planning.
Introduction
Lipedema is a chronic condition characterized by excessive and abnormal adipose tissue accumulation, predominantly affecting the lower extremities. 1 It occurs almost exclusively in women and is frequently associated with overweight and obesity. 2 However, unlike obesity, lipedema shows a poor response to exercise and dietary interventions. 3
Lipedema is associated with several adverse clinical features, including pain, easy bruising, excessive weight gain, impaired cosmetic appearance, and psychological problems. 3 Despite a higher body mass index (BMI), previous studies have suggested that individuals with lipedema may have a lower risk of diabetes, 4 a more favorable lipid profile, 3 and a lower estimated cardiovascular (CV) risk compared with individuals with obesity alone. 5 In obesity, adipose tissue predominantly accumulates in the abdominal region, leading to increased secretion of pro-inflammatory cytokines and subsequent metabolic dysfunction. In contrast, fat accumulation in lipedema mainly affects the extremities and results in a gynoid fat distribution. This gynoid pattern of fat deposition has been hypothesized to contribute to a relatively lower metabolic and CV risk in individuals with lipedema.3,6
In this context, evaluating the metabolic status and CV risk profile of individuals with lipedema using objective and easily applicable indices, independent of obesity, has gained increasing importance. The triglyceride–glucose (TyG) index and the triglyceride–glucose–body mass index (TyG-BMI) have been proposed as alternative markers for screening insulin resistance.7,8 In addition, these markers have been shown to be associated with CV disease risk.9,10 The atherogenic index of plasma (AIP), Castelli risk indices I and II (CRI-I and CRI-II), and the atherogenic coefficient (AC) are lipid-based indices calculated from routine biochemical parameters and are commonly used in the assessment of CV risk.9,11,12 Owing to their practicality and reliance on routinely available laboratory data, these indices offer an advantage for the rapid evaluation of metabolic status and CV risk in clinical settings.
The combined assessment of these indices may help to identify potential differences in metabolic and atherogenic risk profiles between individuals with lipedema and obese individuals without lipedema. To the best of our knowledge, no previous study has comparatively evaluated the metabolic and CV risk profiles of individuals with lipedema independent of obesity using these indices. Therefore, the aim of this study was to compare TyG, TyG-BMI, and atherogenic lipid indices between obese individuals with and without lipedema and to investigate the potential independent effect of lipedema on metabolic status and CV risk–related biochemical indices.
Materials and methods
This study included 70 obese patients diagnosed with lipedema and 70 obese individuals without lipedema who presented to the Physical Medicine and Rehabilitation outpatient clinics of İstanbul Physical Medicine and Rehabilitation Training and Research Hospital between 10 October 2025 and 10 November 2025. Ethical approval was obtained from the Ethics Committee of İstanbul Physical Medicine and Rehabilitation Training and Research Hospital (protocol number: 2025-73). The study was conducted in accordance with the principles of the Declaration of Helsinki.
Written informed consent was obtained from all participants at the beginning of the study. Inclusion criteria were age between 18 and 75 years, body mass index (BMI) ≥30 kg/m2, availability of fasting lipid profile and fasting glucose measurements within the previous 3 months, and willingness to participate in the study. Exclusion criteria included the use of medications affecting lipid and glucose metabolism (statins, fibrates, niacin, ezetimibe, high-dose omega-3 fatty acids; glucagon-like peptide-1 receptor agonists, sodium–glucose cotransporter-2 inhibitors, and systemic corticosteroids), presence of rheumatologic diseases (such as rheumatoid arthritis and systemic lupus erythematosus), active malignancy, neurological diseases (including polyneuropathy, multiple sclerosis, or a history of stroke), pregnancy or lactation, lower extremity surgery or major trauma within the past 6 months, active infection or active dermatological diseases affecting the lower extremities, significant venous insufficiency, or acute deep vein thrombosis.
The diagnosis of lipedema was established by the same clinician experienced in lymphedema and lipedema, based on clinical history and physical examination. Symmetrical and disproportionate adipose tissue accumulation in the lower extremities, a tendency toward easy bruising, presence of pain, a negative Stemmer sign, poor response to exercise and dietary interventions, and a family history of lipedema among female relatives were considered supportive diagnostic features. 13
Sociodemographic data of the participants were recorded. Lipedema-related symptom duration was recorded. Lower extremity pain severity was assessed using the Visual Analog Scale (VAS). Laboratory evaluations were based on fasting blood tests performed within the previous 3 months, including fasting glucose, total cholesterol, LDL-cholesterol, HDL-cholesterol, and triglyceride levels. Cut-off values were defined as LDL ≥115 mg/dL, HDL <45 mg/dL, and triglycerides ≥150 mg/dL. 2 Based on these parameters, metabolic and CV risk–related biochemical indices, including the triglyceride–glucose (TyG) index, TyG–body mass index (TyG-BMI), atherogenic index of plasma (AIP), atherogenic coefficient (AC), Castelli risk index I (CRI-I), and Castelli risk index II (CRI-II), were calculated.
Triglyceride–glucose (TyG) index
The TyG index was calculated using the formula: TyG index = ln [(fasting triglycerides (mg/dL) × fasting glucose (mg/dL))/2]. It was first proposed in 2008 as a better marker than HOMA-IR for identifying insulin resistance in apparently healthy individuals. 14
Triglyceride–glucose–body mass index (TyG-BMI)
The TyG-BMI was introduced in 2016 by Er et al. as a stronger indicator of metabolic risk by combining the TyG index with body mass index. It is calculated by multiplying the TyG index by BMI. 7
Atherogenic index of plasma (AIP)
The atherogenic index of plasma (AIP), first described in 2001, is calculated using the formula AIP = log10 (triglycerides/HDL-cholesterol). AIP is used as an indicator of an atherogenic lipid profile and is associated with CV risk. 15
Castelli risk indices (CRI) I and II
Castelli Risk Index I (CRI-I) is calculated as the ratio of total cholesterol to HDL-cholesterol, whereas Castelli Risk Index II (CRI-II) is calculated as the ratio of LDL-cholesterol to HDL-cholesterol. These indices are commonly used in the assessment of CV risk, with higher values indicating increased risk. 11
Atherogenic coefficient (AC)
The atherogenic coefficient (AC) is calculated using the formula (total cholesterol − HDL-cholesterol)/HDL-cholesterol. AC is used as a marker reflecting the atherogenic lipid burden. 16
Sample size
Sample size was calculated using G*Power software (version 3.1.9.7). Assuming a moderate effect size of Cohen’s d = 0.5 for the difference between two independent groups, a minimum of 64 participants per group was required for an independent samples t-test with an alpha level of 0.05 and a statistical power (1–β) of 80%. To improve estimation precision and compensate for potential dropouts, the final target sample size was set at 70 participants per group. 17
Statistical analysis
Normality of data distribution was assessed using the Shapiro–Wilk and Kolmogorov–Smirnov tests. Quantitative variables were summarized using mean, standard deviation, median, and interquartile range (IQR), while qualitative variables were presented as frequencies and percentages. For comparisons between two groups, the independent samples t-test was used for normally distributed quantitative variables, and the Mann–Whitney U test was applied for non-normally distributed variables. The chi-square test was used to analyze categorical variables. A p value of less than 0.05 was considered statistically significant. Correlation analyses were performed using the Spearman correlation test. All statistical analyses were conducted using IBM SPSS Statistics software, version 21.
Results
Demographic and baseline characteristics of the lipedema and control groups.
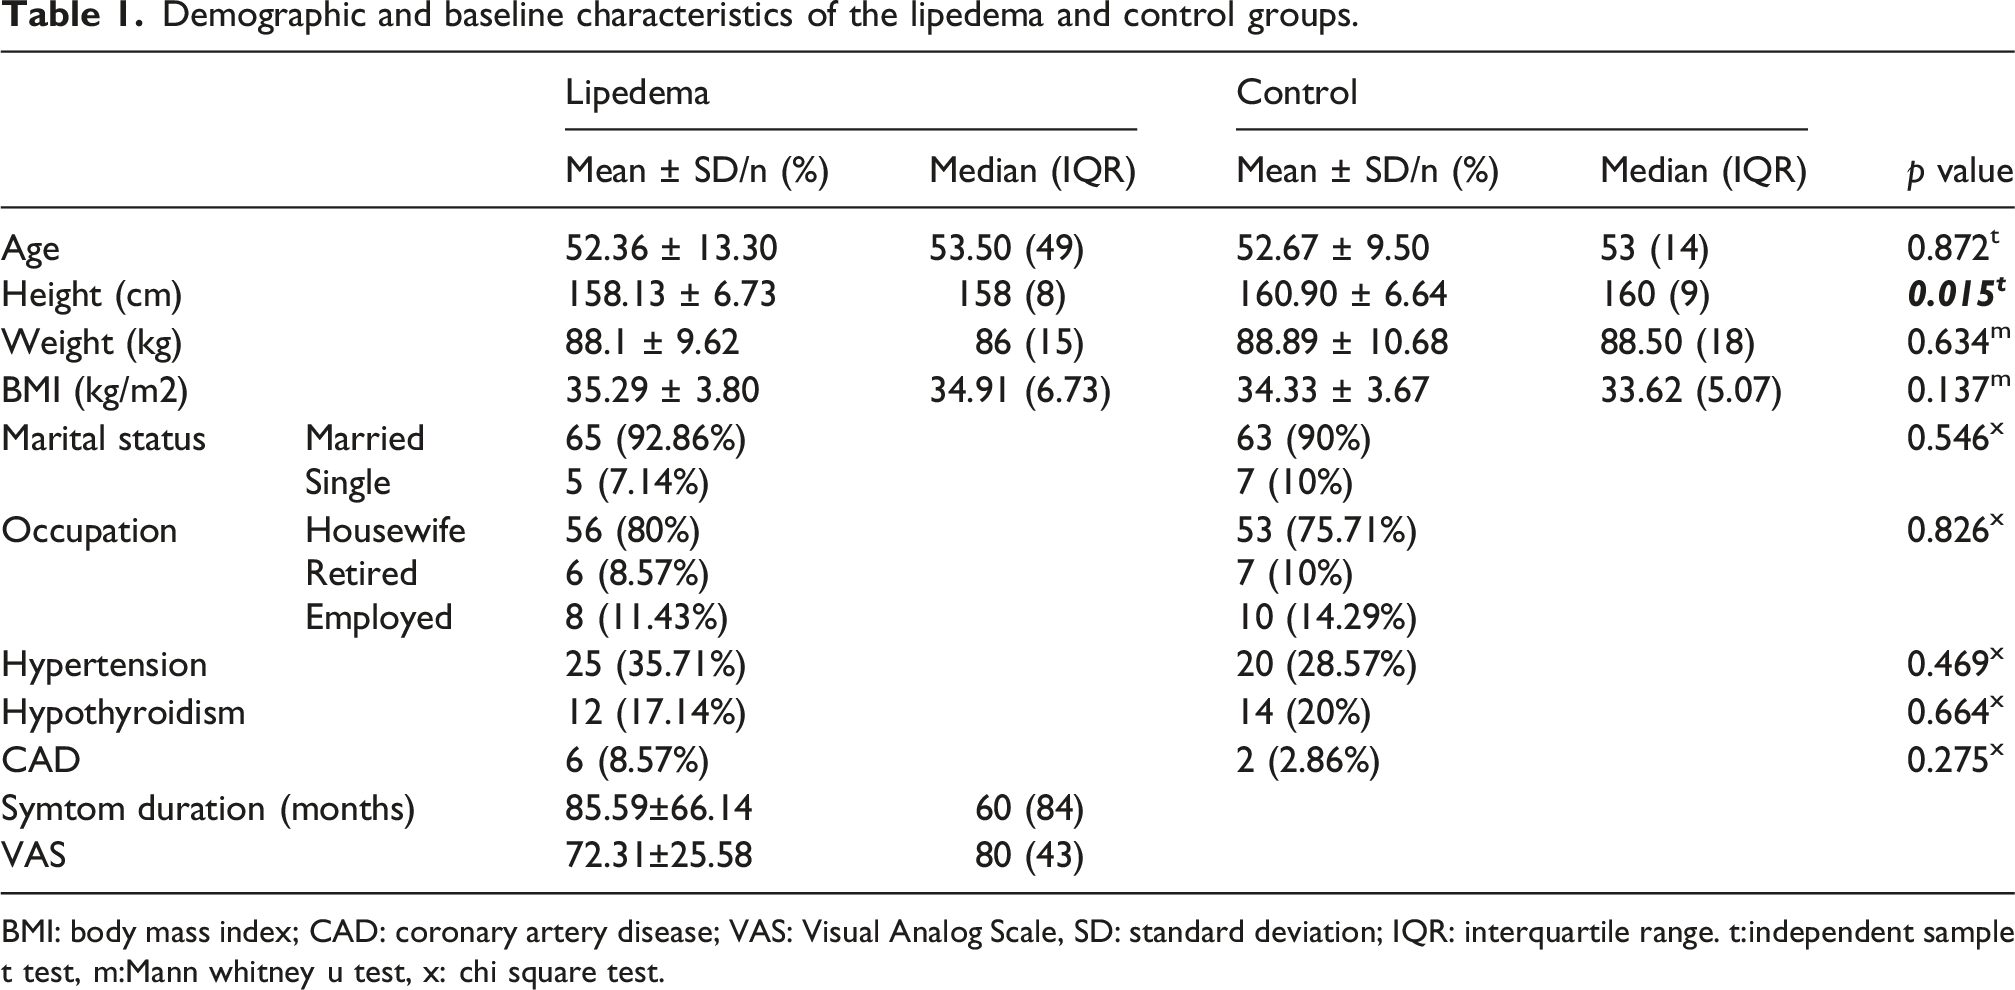
BMI: body mass index; CAD: coronary artery disease; VAS: Visual Analog Scale, SD: standard deviation; IQR: interquartile range. t:independent sample t test, m:Mann whitney u test, x: chi square test.
Comparison of metabolic and atherogenic parameters between the lipedema and control groups.
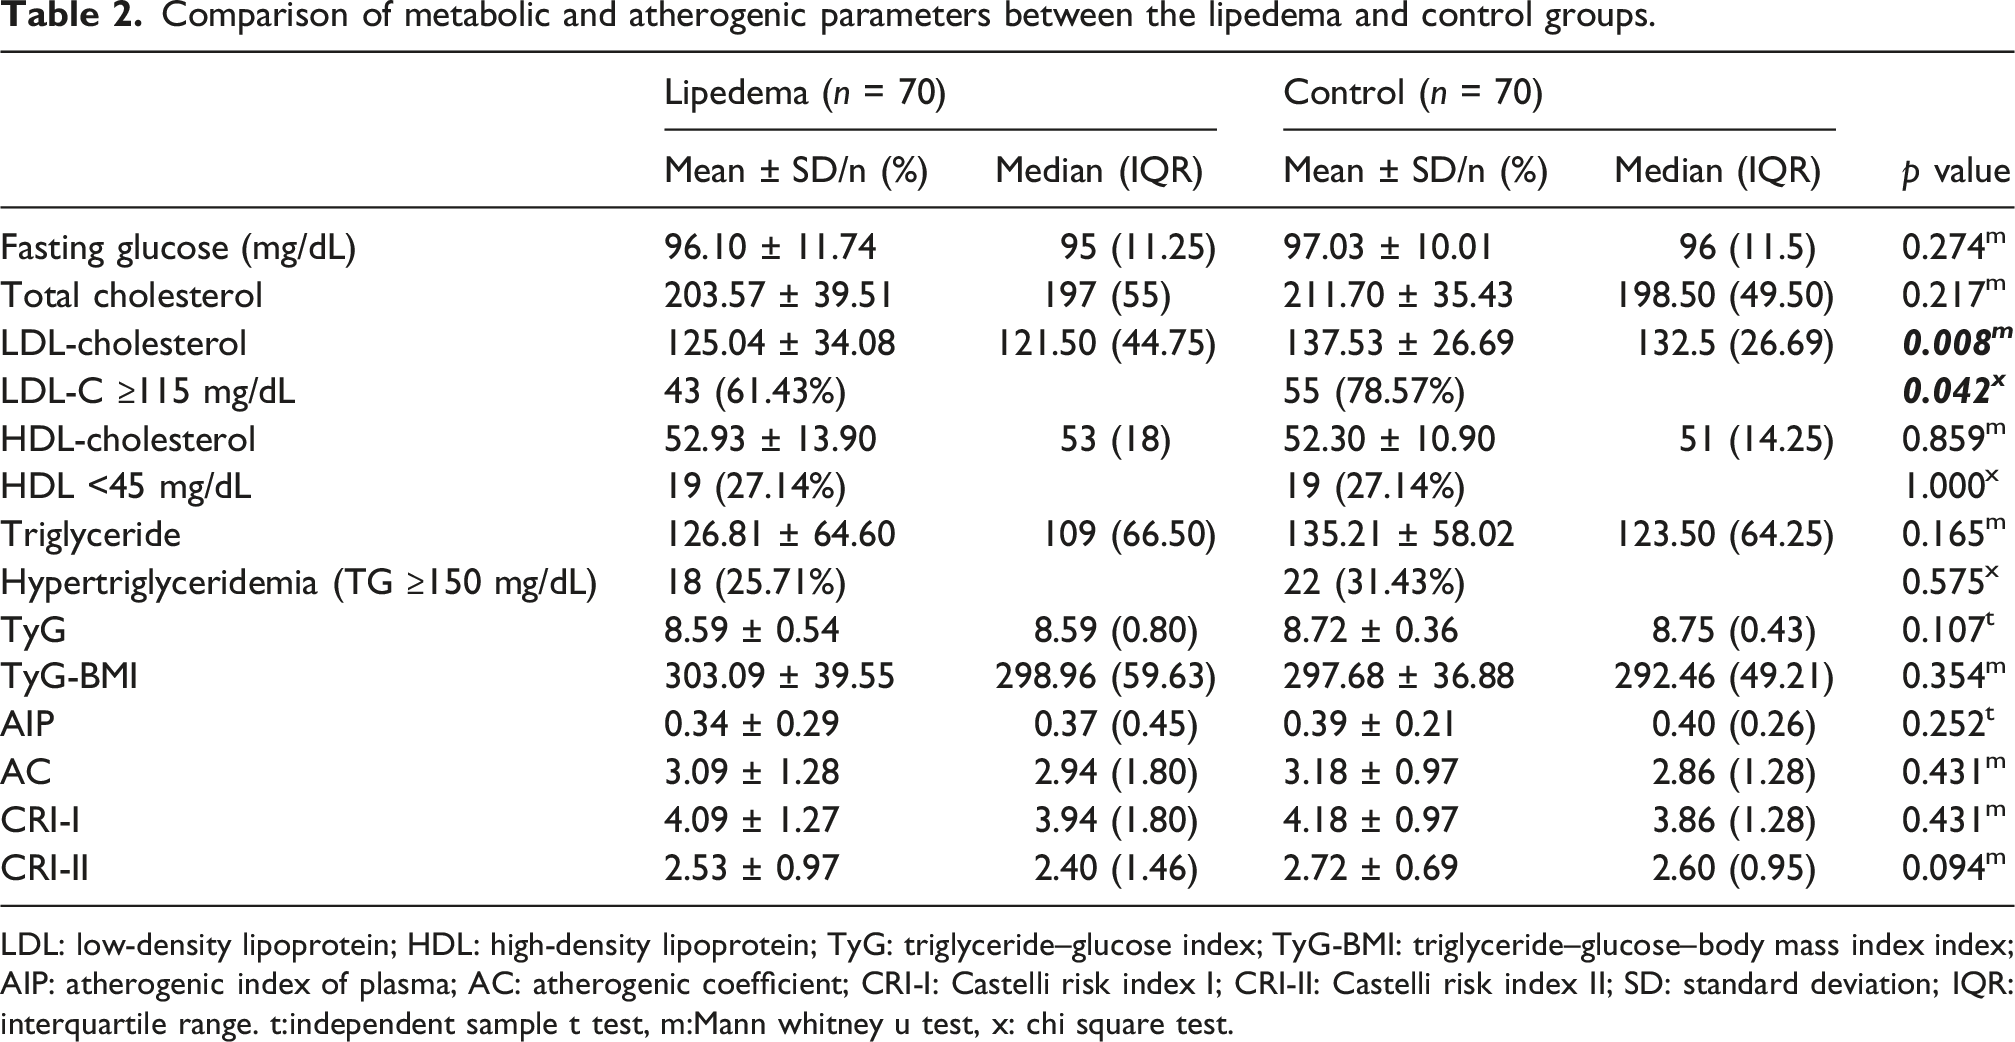
LDL: low-density lipoprotein; HDL: high-density lipoprotein; TyG: triglyceride–glucose index; TyG-BMI: triglyceride–glucose–body mass index index; AIP: atherogenic index of plasma; AC: atherogenic coefficient; CRI-I: Castelli risk index I; CRI-II: Castelli risk index II; SD: standard deviation; IQR: interquartile range. t:independent sample t test, m:Mann whitney u test, x: chi square test.
Correlations between metabolic indices and demographic/clinical variables in individuals with lipedema.
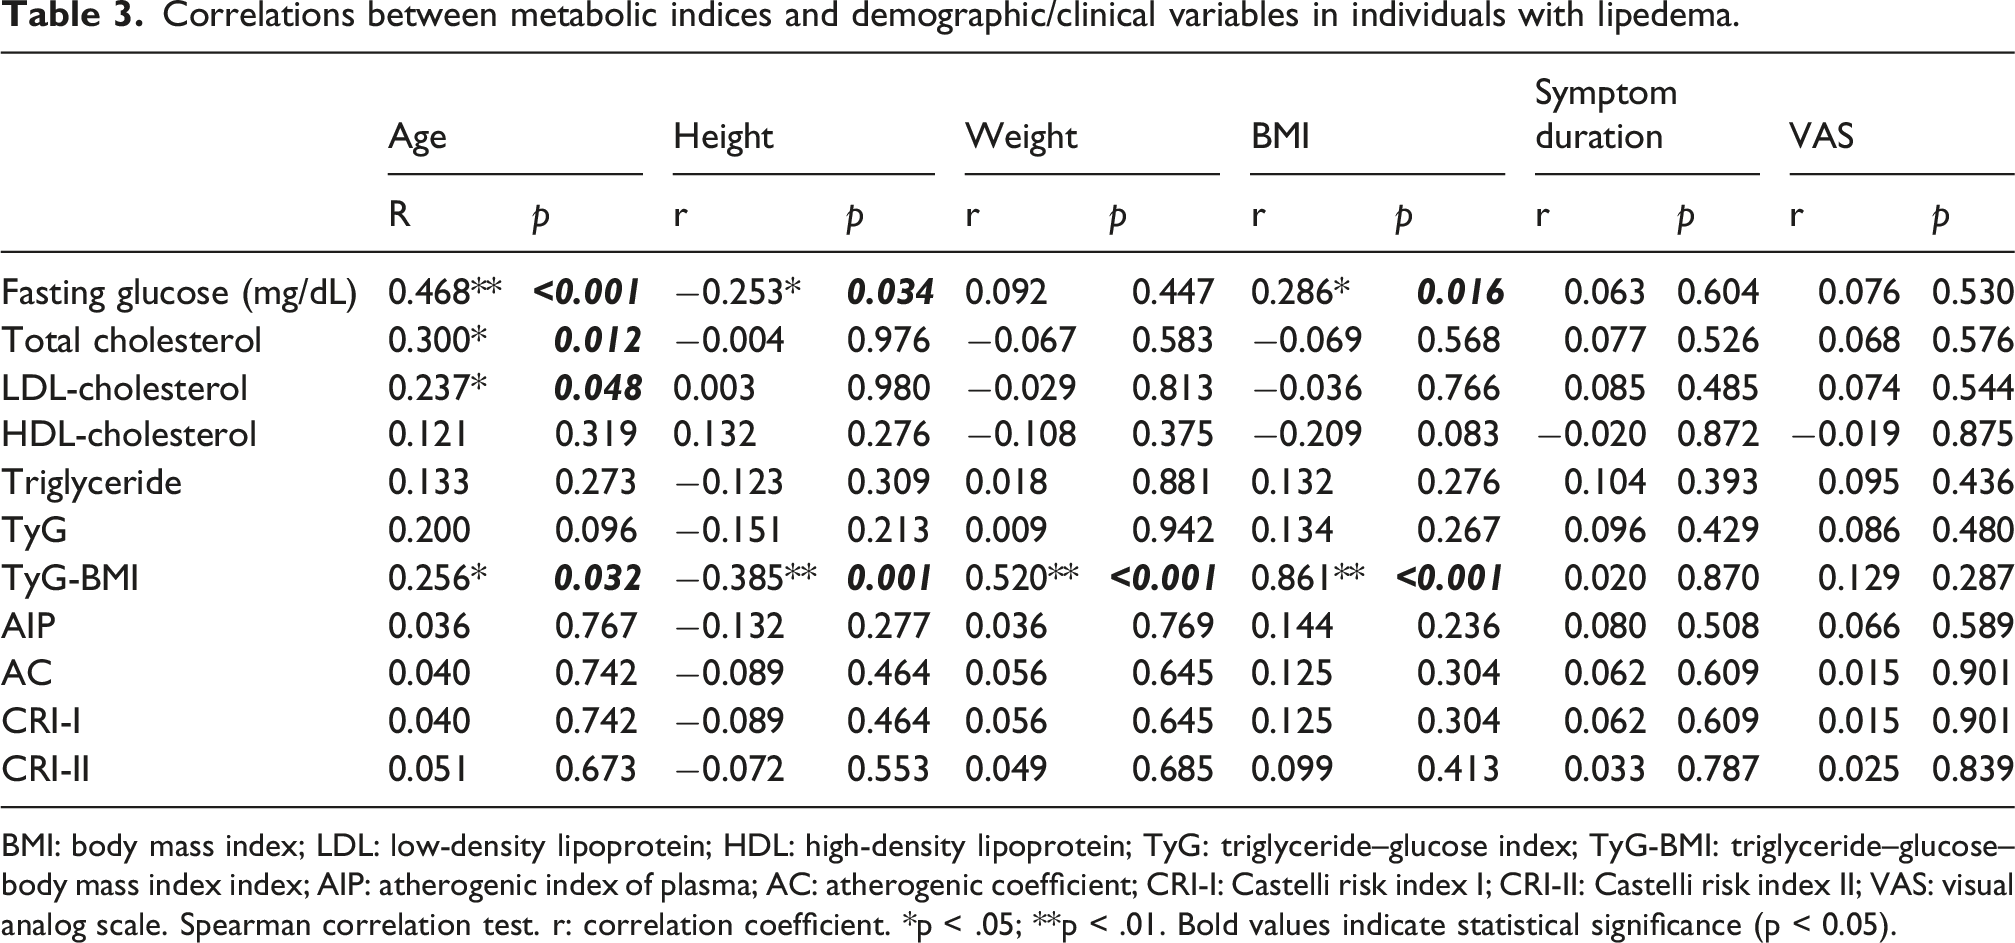
BMI: body mass index; LDL: low-density lipoprotein; HDL: high-density lipoprotein; TyG: triglyceride–glucose index; TyG-BMI: triglyceride–glucose–body mass index index; AIP: atherogenic index of plasma; AC: atherogenic coefficient; CRI-I: Castelli risk index I; CRI-II: Castelli risk index II; VAS: visual analog scale. Spearman correlation test. r: correlation coefficient. *p < .05; **p < .01. Bold values indicate statistical significance (p < 0.05).
Discussion
In this study, metabolic and atherogenic indices were comparable between obese individuals with and without lipedema. Although LDL-cholesterol levels were lower in the lipedema group, this difference did not translate into changes in overall metabolic or CV risk–related indices. Importantly, metabolic parameters in obese individuals with lipedema were similar to those observed in individuals with obesity alone, suggesting that lipedema itself may not be a primary determinant of metabolic status in this population. Accordingly, individuals with lipedema accompanied by obesity do not appear to exhibit a more favorable metabolic profile compared with those with obesity alone.
In a previous study, elevated LDL levels were observed in approximately half of the individuals with lipedema (49.1%) and in 67.3% of the control group. Hypertriglyceridemia was present in 5.7% of the lipedema group and 25.5% of the control group, while low HDL-cholesterol levels were reported in 3.8% and 10.9% of the lipedema and control groups, respectively. Although fasting blood glucose levels were higher in the control group, the difference did not reach statistical significance. 2 In our study, elevated LDL levels were found in 61.43% of individuals with lipedema and in 78.57% of the control group. Hypertriglyceridemia was observed in 25.71% of the lipedema group and in 31.43% of the control group. Low HDL-cholesterol levels were present in 27.14% of participants in both groups. In the study by Jeziorek et al., participants with a BMI greater than 25 kg/m2 were included, whereas in our study the BMI threshold was set at 30 kg/m2. Moreover, the mean BMI of individuals with lipedema in our study was 35.29 ± 3.80, compared with 31.53 ± 7.53 reported by Jeziorek et al. 2 This difference in inclusion criteria may explain the higher proportion of participants with elevated lipid levels in our cohort. In another study, the majority of women with lipedema were reported to have a normal lipid profile. 3 Additionally, Mekki et al. demonstrated that women with a gynoid fat distribution had lower triglyceride levels than those with an android fat distribution. 18 These findings have been interpreted in the literature to suggest that, due to a predominance of gynoid fat distribution, individuals with lipedema may have a lower CV disease risk. 3
The literature suggests that individuals with lipedema may have a lower prevalence of insulin resistance or diabetes compared with obese individuals. 3 In the study by Jeziorek et al., fasting glucose levels were also found to be lower in the lipedema group; however, this difference did not reach statistical significance. 2 In our study, mean fasting blood glucose levels were slightly lower in the lipedema group, but no statistically significant difference was observed between the groups. Because the use of antidiabetic medications may influence the values of metabolic indices, patients receiving pharmacological treatment for diabetes mellitus were excluded from our study. Consequently, our findings are limited to individuals without a diagnosis of diabetes or those not receiving treatment for diabetes, which may account for differences between our results and those reported in the literature.
The TyG index is widely used in the literature as an indirect marker for the assessment of insulin resistance.19,20 The TyG-BMI, which incorporates BMI as an indicator of obesity, has been considered a stronger predictor of insulin resistance. 21 In our study, no significant differences were observed between the lipedema and control groups with respect to the TyG and TyG-BMI indices. The TyG index was not associated with age, BMI, symptom duration, or pain severity. In contrast, TyG-BMI showed a positive correlation with age and BMI but was not correlated with symptom duration or pain severity. These findings suggest that these metabolic risk–related indices have a limited association with lipedema-related clinical parameters.
In the study by Torre et al., it was suggested that individuals with lipedema may have a lower CV disease risk due to a predominance of gynoid fat distribution. 3 The AIP, AC, and CRI indices are commonly used as indirect indicators associated with CV risk.9,11,12,22 In our study, all of these indices were similar between the lipedema and control groups. Moreover, no significant correlations were observed between these indices and age, BMI, symptom duration, or pain severity. These findings indicate that, when assessed using these indices, individuals with lipedema may not exhibit a more favorable CV risk–related biochemical profile compared with obese women without lipedema. From a clinical perspective, these results further support that obesity-related factors may play a more prominent role in determining metabolic risk. Therefore, comprehensive obesity management, including lifestyle-based interventions and, when appropriate, bariatric approaches, should be considered in clinical decision-making, rather than focusing solely on lipedema-specific treatments (e.g., compression or liposuction).
This study has several strengths and limitations. Although some studies in the literature have suggested that insulin resistance and CV disease risk may be higher in individuals with lipedema, to the best of our knowledge, there is no study that has performed a comparative evaluation using risk indices calculated from blood parameters. In this respect, our study represents a novel contribution to the literature. Another important strength of our study is the comparison of obese individuals with and without lipedema using objective, easily applicable metabolic and atherogenic indices that are feasible in routine clinical practice.
However, several limitations should also be acknowledged. The single-center design and the lack of direct measurement of insulin resistance may limit the generalizability of the findings. In addition, the cross-sectional design does not allow for causal inferences regarding the relationships between lipedema and metabolic or atherogenic indices, as the results reflect only cross-sectional associations. The diagnosis of lipedema was based on clinical findings and symptoms, and body fat distribution and gynoid fat pattern were not assessed using objective measurement techniques. Furthermore, potential metabolic risk–related variables such as physical activity levels, family history, and dietary habits were not included in the analysis, which may have led to residual confounding.
Conclusion
In conclusion, metabolic indices associated with metabolic status and CV risk were comparable between obese individuals with lipedema and those with obesity alone. These findings suggest that lipedema itself may not be a primary determinant of metabolic risk in this population. From a clinical perspective, metabolic risk assessment should not be overlooked in patients with lipedema, and appropriate management of obesity should be considered an essential component of treatment planning. In this context, prioritizing evidence-based obesity management, particularly lifestyle interventions, is important to avoid an overemphasis on lipedema-specific interventions without adequately addressing obesity.
Footnotes
Acknowledgments
The authors would like to thank all the participants who contributed to this study.

Ethical considerations
This study was approved by the Istanbul Physical Medicine and Rehabilitation Training and Research Hospital (Approval Number: 2025-73).
Consent to participate
Written informed consent was obtained from all participants before their inclusion in the study
Author contributions
BŞA: Data curation, Investigation, Supervision. EK: Data curation, Investigation, Writing - review & editing, NP: Formal Analysis, Supervision, Methodology. NK: Data curation, Investigation, Supervision SE: Data curation, Investigation, Writing – original draft, Methodology.
Funding
The authors received no financial support for the research, authorship, and/or publication of this article.
Declaration of conflicting interests
The authors declared no potential conflicts of interest with respect to the research, authorship, and/or publication of this article.
Data Availability Statement
The data supporting the findings of this study are available from the corresponding author upon reasonable request
Guarantor
The principal author of this study is Büşra Şirin Ahısha, who is responsible for the study design, data collection, analysis, and manuscript preparation.