
Abstract
Background:
The Family Satisfaction with End-of-Life Care is an internationally used measure of satisfaction with cancer care. However, the Family Satisfaction with End-of-Life Care has not been studied for equivalence of item endorsement across different socio-demographic groups using differential item functioning.
Aims:
The aims of this secondary data analysis were (1) to examine potential differential item functioning in the family satisfaction item set with respect to type of caregiver, race, and patient age, gender, and education and (2) to provide parameters and documentation of differential item functioning for an item bank.
Design:
A mixed qualitative and quantitative analysis was conducted. A priori hypotheses regarding potential group differences in item response were established. Item response theory and Wald tests were used for the analyses of differential item functioning, accompanied by magnitude and impact measures.
Results:
Very little significant differential item functioning was observed for patient’s age and gender. For race, 13 items showed differential item functioning after multiple comparison adjustment, 10 with non-uniform differential item functioning. No items evidenced differential item functioning of high magnitude, and the impact was negligible. For education, 5 items evidenced uniform differential item functioning after adjustment, none of high magnitude. Differential item functioning impact was trivial. One item evidenced differential item functioning for the caregiver relationship variable.
Conclusion:
Differential item functioning was observed primarily for race and education. No differential item functioning of high magnitude was observed for any item, and the overall impact of differential item functioning was negligible. One item, satisfaction with “the patient’s pain relief,” might be singled out for further study, given that this item was both hypothesized and observed to show differential item functioning for race and education.
Keywords
The Family Satisfaction with End-of-Life Care (FAMCARE) is a widely used measure of satisfaction with cancer care.
The psychometric properties of the scale have been examined with cancer patients in diverse samples and settings, internationally; adequate estimates of internal consistency and other reliability statistics were observed in these studies.
However, the FAMCARE has not been studied for equivalence of item endorsement across different socio-demographic groups using differential item functioning (DIF).
This study is the first to examine the FAMCARE for equivalence of item endorsement across different socio-demographic groups.
Examination of DIF using item response theory is important in finalizing item banks and developing short-form measures. These analyses provide information about DIF to place in an item bank on family satisfaction and care transitions that is under development.
DIF was observed primarily for race and education.
No DIF of high magnitude was observed for any item, and the total impact of DIF at the scale level was trivial.
It is recommended that the item, satisfaction with “the patient’s pain relief,” be studied further, given that racial and ethnic disparities on the overall experience of pain have been documented, and that this item was both hypothesized and observed to show DIF for race and education. Clinicians should be alert to potential response bias in reports of satisfaction with pain relief.
Conceptual and psychometric measurement equivalence of scales is a basic requirement for valid cross-cultural and demographic subgroup comparisons. The Family Satisfaction with End-of-Life Care (FAMCARE) scale, developed in Australia to measure satisfaction with cancer care,1,2 has been used extensively to assess satisfaction with palliative care.2,3 The psychometric properties of the scale have been examined with cancer patients in diverse settings internationally (e.g. North America, Australia, and Europe); however, little or no evidence is available about the performance of the measure across ethnically diverse groups. The psychometric analyses performed within samples have resulted in varied recommendations. Principal component and bifactor analyses have supported essential unidimensionality, with one strong factor reflecting a single underlying attribute.4–7 However, the results of one study in Australia identified a four-factor structure. 8 Shortened versions of the scale based on psychometric analyses have been suggested, for example, a 19-item version for terminal cancer victims in Norway. 4 Adaptations of the scale have also been recommended or used in (1) inpatient settings in Australia (FAMCARE-2, 17-item version 8 ), (2) outpatient oncology palliative care settings among family members in Australia (FAMCARE-6, 6 items 5 ) or patients in Canada (FAMCARE-P16, 16-items 9 ), and (3) long-term care settings in the United States (18-item version 6 ). The different versions of FAMCARE have shown adequate estimates of internal consistency using Cronbach’s alpha and other reliability statistics across diverse cancer patient samples and settings.5,7,10
Few studies have examined the relationship of demographic characteristics to satisfaction with care. Johnsen et al., 11 using ordinal logistic regression analyses of individual items, found that age was the only variable associated consistently with dissatisfaction; that is, younger relatives in a Danish sample were more dissatisfied with care than older relatives with respect to 17 of the original 20 items. Another study conducted in Australia found that older, female caregivers and those with no strong ethnic identification reported higher average satisfaction scores than younger, male, ethnically identified individuals. 8 Similarly, Kristjanson, 10 using an Australian sample, reported race, education level, and patient’s age as significant correlates of satisfaction; that is, White caregivers with higher education caring for older patients evidenced higher satisfaction. To our knowledge, no studies have examined the FAMCARE for equivalence of item endorsement across different socio-demographic groups using methods to detect differential item functioning (DIF). Without such studies, the validity of comparison of means across ethnic and socio-demographically different subgroups could be questioned. One goal of these analyses was to obtain information on DIF to place in an item bank on family satisfaction and care transitions that is under development.
Methods
Sample characteristics
The analytic sample was from a multisite study of patients whose family members were interviewed using the FAMCARE instrument, comprising 20 items. After omission of individuals who responded to less than 50% of items, the analytic sample comprised 1983 patients. Among them, 56.2% of patients were female; the mean age was 59.91 years (standard deviation (SD) = 11.8 years), and 35.1% were 65 years of age or older. The mean educational level was 13.6 years (SD = 3.2 years); 20.4% were non-Hispanic Black, and 79.6% were non-Hispanic White people.
The caregivers were family members living with the patient (43.5%), family members not living with the relative (35.1%), friends (10.5%), home health aides (1.4%), and staff or certified nursing aides (0.1%); 1.6% refused to provide their relationship, and 7.9% were missing. The study was approved by the Institutional Review Board at Mount Sinai Medical Center.
Analyses
This article describes the caregiver respondent DIF analyses with respect to type of caregiver and patient race, age, gender, and education.
Qualitative
One of the initial steps in DIF analyses is the establishment of an a priori set of hypotheses regarding potential group differences in item response by combining information gathered via two methods: (1) qualitatively, from ratings by a panel of content experts, and (2) from a review of the literature documenting prior research-based findings.
Panel of experts
DIF Hypotheses
DIF hypotheses were generated by asking a set of clinicians and other content experts to indicate whether or not they expected DIF to be present, and the direction of the DIF with respect to several comparison groups: gender, age, race/ethnicity, language, and education. A definition of DIF was provided, and the following instructions related to hypotheses generation were given:
Differential item functioning means that individuals in groups with the same underlying trait (state) level will have different probabilities of endorsing an item. Put another way, item endorsement should depend only on the level of the trait (state), e.g., satisfaction, and not on membership in a group, e.g., male or female. Very specifically, randomly selected persons from each of two groups (e.g., black and white people) who are at the same (e.g., high) level of satisfaction should have the same likelihood of reporting being very satisfied with the aspects of care provided. If it is hypothesized that this is not the case, it would be hypothesized that the item has DIF with respect to race.
The FAMCARE items were reviewed qualitatively by 12 content experts regarding potential sources of DIF. All the members of the panel of experts were medical doctors, five were geriatricians, one specializes in palliative care, and another was a palliative care geriatrician. The experts were asked to rate individually each of the 20 items with respect to gender, age, race/ethnicity, language, and education. They provided the hypotheses in terms of presence and direction of DIF. The goal was to identify items that might have a different meaning or not be understood well and/or equivalently by individuals of any of the groups referenced. A grid containing a row for each of the 20 items and separate columns for each of the referenced groups was distributed to the experts for completion in order to facilitate the rating.
It was posited that gender, age, race/ethnicity, language, and education were variables that should be investigated because they have been examined in many studies of DIF in other contexts. In hypothesis generation, language was included, even though it was not in the data set, in the event that a data set with a translated version of the items could be obtained for future study. We did not include type of caregiver in the hypotheses generation because this is not a variable that had been examined in previous DIF analyses. However, we decided to include it in the analyses for completeness.
Literature review
A web-based academic library advanced search was conducted on 12 March 2013 via ProQuest (which includes 80 databases) using “FAMCARE” or “Family Satisfaction with the End-of-Life Care scale” and “DIF” or “Differential Item Functioning” or “Factorial Invariance” as key words. No time frame was specified for the search. No article was identified within the parameters specified.
Quantitative analyses and tests of DIF hypotheses
Item Response Theory (IRT)12–14 applying the graded (polytomous, ordered response category) response model 15 was used for the analyses of DIF. The item characteristic curve (ICC) that relates the probability of an item response to the underlying state, for example, satisfaction, measured by the item set can be characterized by two parameters in some forms of the model: a discrimination parameter (denoted a) that is proportional to the slope of the curve and location (also called severity) parameters (denoted b). According to the IRT model, an item shows DIF if people from different subgroups but at the same level of satisfaction have unequal probabilities of endorsement. Put another way, the absence of DIF is demonstrated by ICCs that are the same for each group of interest.
DIF detection
The method used for DIF detection was the Wald test for examination of group differences in IRT item parameters13–16 accompanied by magnitude measures. 17 Because there were three education groups, non-orthogonal contrasts were used. The final p values were adjusted using Bonferroni 18 methods; other methods such as Benjamini–Hochberg (B-H) have been used in sensitivity analyses.19,20 The Bonferroni tests applied here were used to adjust for multiple modeling associated with testing DIF across the entire item set. In this case, the p value was adjusted for examination of 20 items (the adjusted p value was 0.0025).
The first step in the analyses is to link the two groups compared in terms of satisfaction and to estimate the mean and variance for the target groups studied (while setting the reference group mean to 0 and variance to 1). There are several methods for accomplishing this.21–23 Typically, anchor items are specified. Anchor items are assumed to be without DIF (no significant differences in the a or b parameters), and are used to estimate theta (satisfaction), and this process is performed iteratively. The method that was used in these analyses is a modified “all-other” anchor method in which initial DIF estimates can be obtained by treating each item as a “studied” item, while using the remainder as “anchor” items. The procedure described below is performed iteratively in a purification procedure, such that the analyses are repeated using the final subset of items identified as free of DIF as the “purified” anchor set. This procedure is more robust than just relying on the all-other anchor procedure and may take several iterations.
For each studied item, a model is constructed with all parameters constrained to be equal across groups for the anchor items (in this case, all items except the studied item), with the item parameters of the studied item freed to be estimated distinctly for the comparison groups. An overall simultaneous joint test of differences in the a or b parameters is performed followed by step down tests for group differences in the a parameters, followed by conditional tests of the b parameters. Uniform DIF is detected when the b parameters differ and non-uniform DIF when the a parameters differ. Severity (b) parameters are interpreted as uniform DIF only if the tests of the a parameters are not significant because tests of b parameters are performed, constraining the a parameters to be equal.
Evaluation of DIF magnitude and impact
The magnitude of DIF refers to the degree of difference in item performance between or among groups, conditional on the trait or state being examined. Expected item scores can be examined as measures of magnitude. An expected item score is the sum of the weighted (by the response category value) probabilities of scoring in each of the possible categories for the item. A method for quantification of the difference in the average expected item scores is the non-compensatory DIF (NCDIF) index used by Raju et al. 24 Cutoff values established based on simulations25,26 were used in the estimation of the magnitude of item-level DIF. For polytomous items with three response options (after collapsing categories due to sparse data), the recommended cutoff is 0.024. 27
Expected item scores were summed to produce an expected scale score (also referred to as the test or scale response function), which provides evidence regarding the effect of the DIF on the total score. Group differences in these expected scale score (test response) functions provide overall aggregated measures of impact. The expected scale score functions are shown in Figure 1.
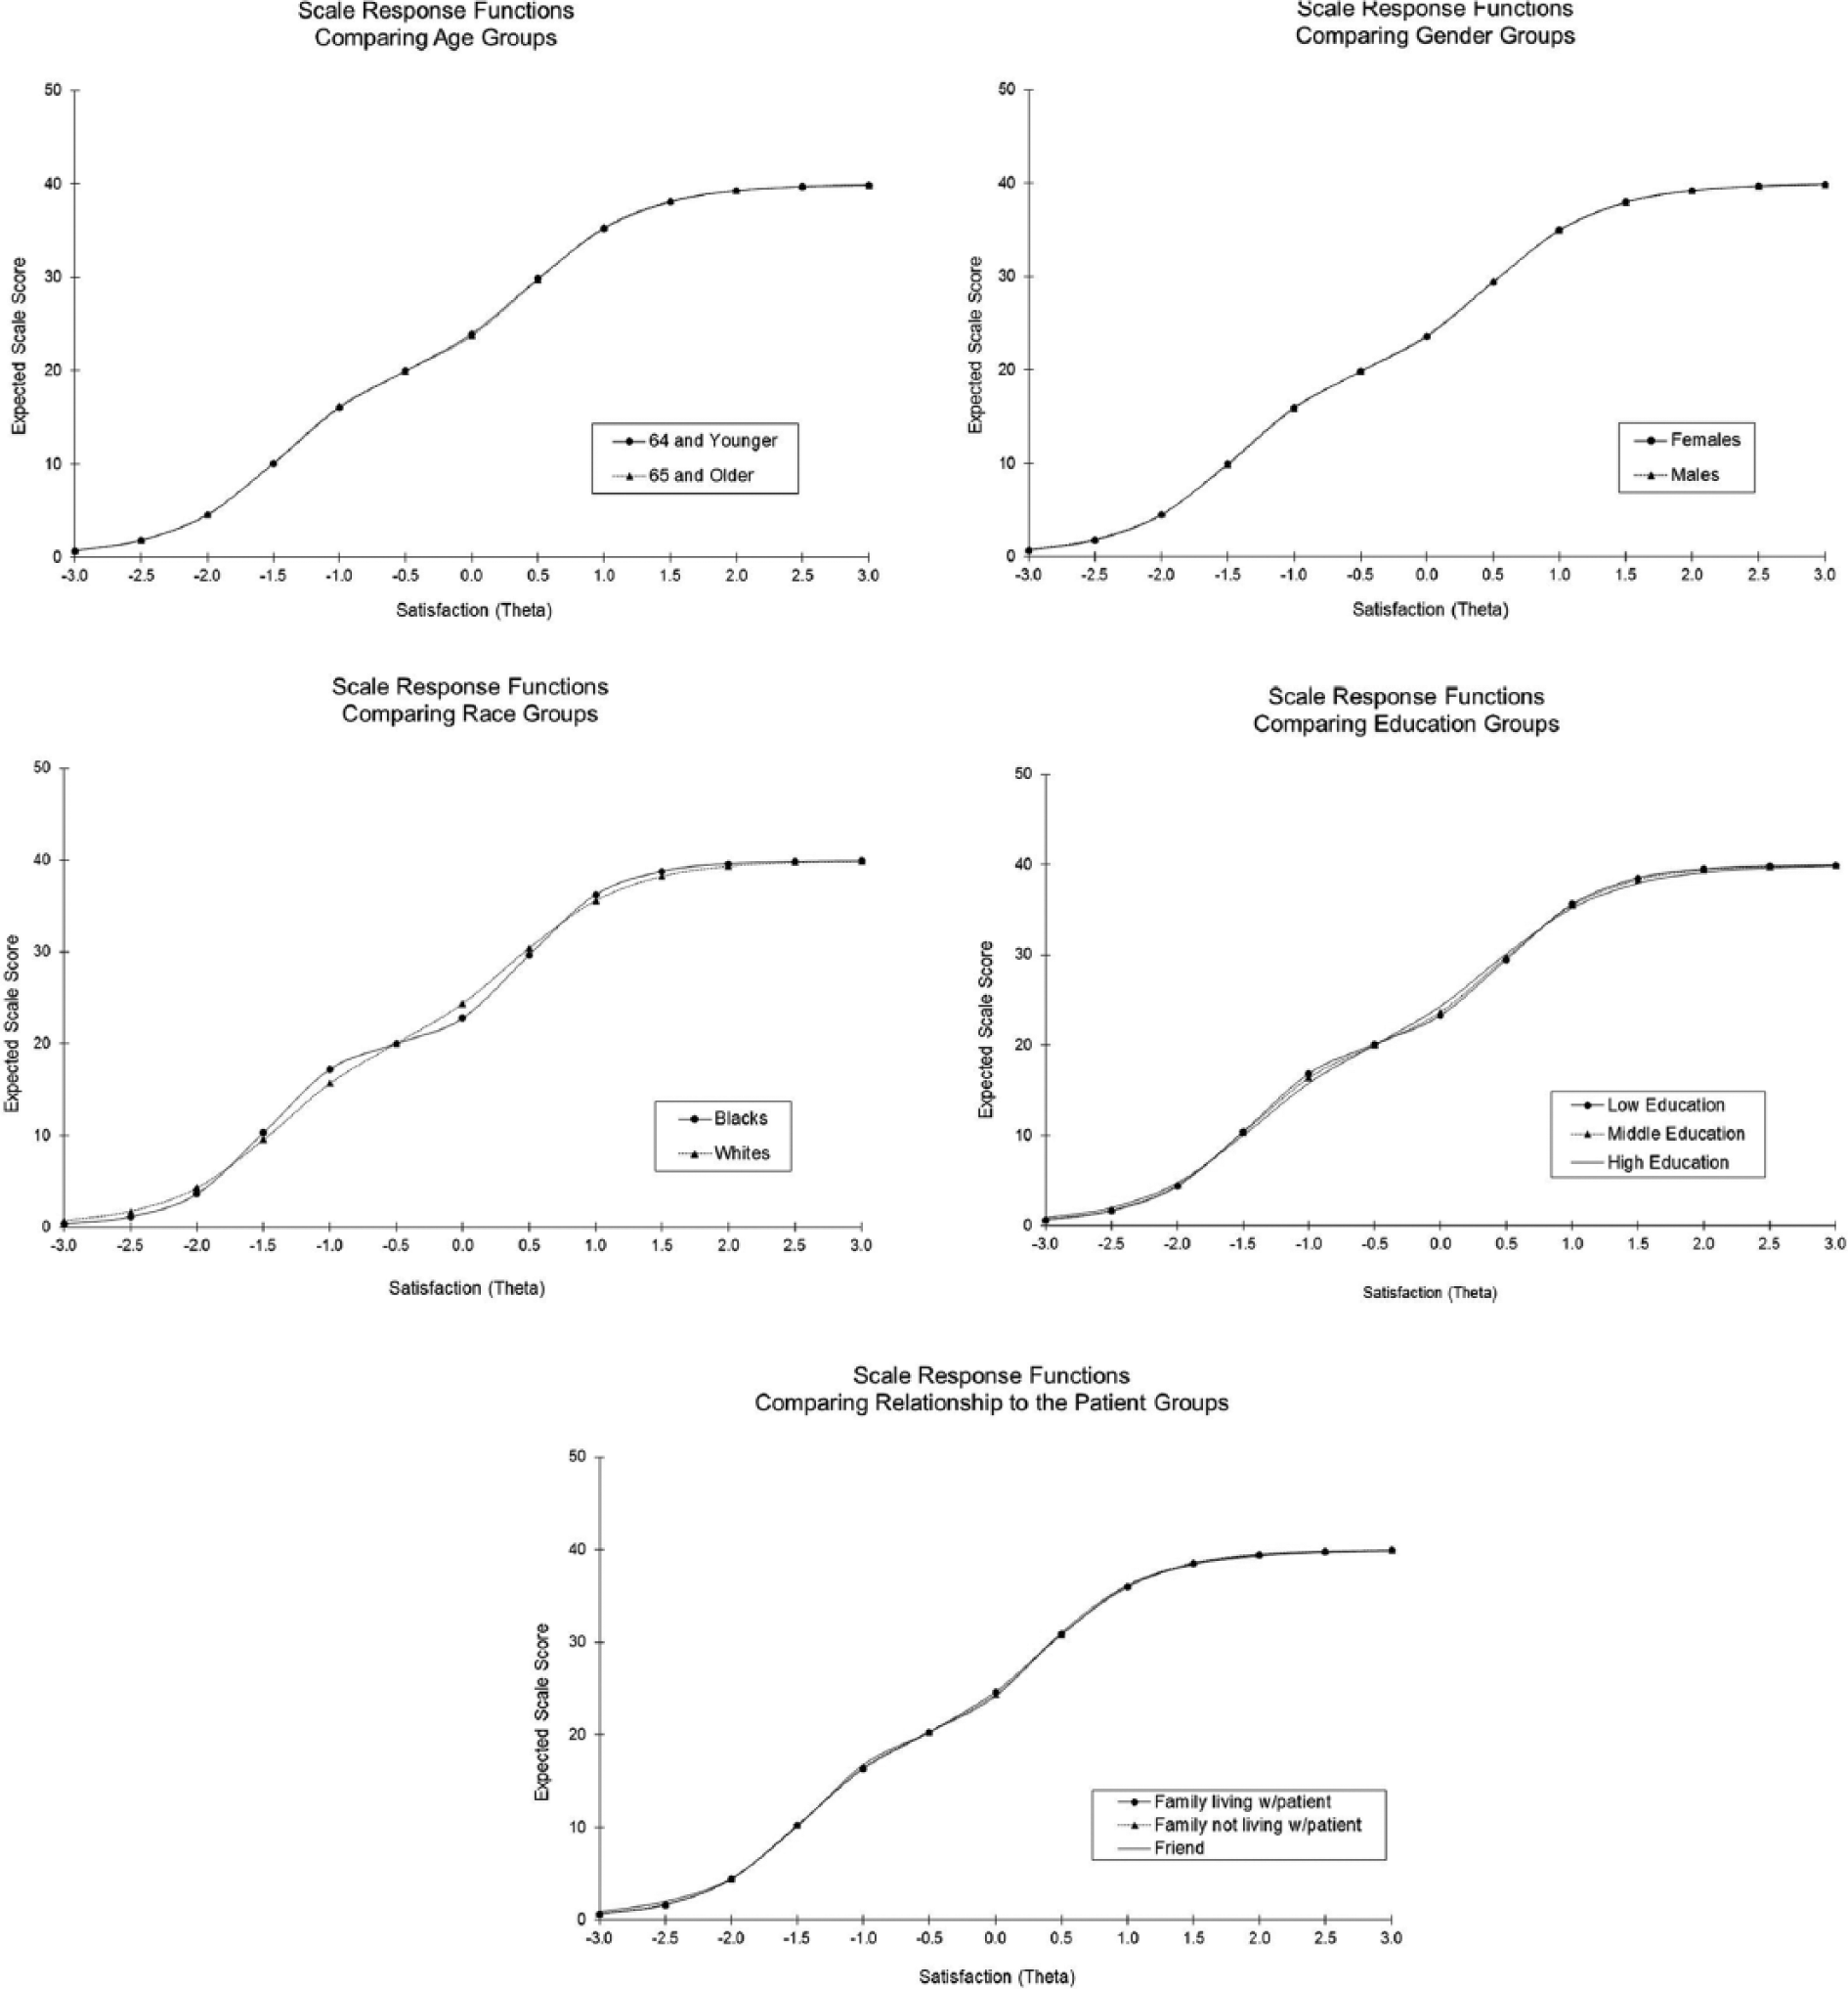
FAMCARE item set: scale response functions by comparison groups.
If salient DIF above the magnitude threshold is observed, and the item was hypothesized to have DIF, actions are considered. These include removal, rewording of the item, based on further qualitative cognitive interviews or separate calibrations for the groups in the context of computerized adaptive tests. In analyses, the parameters would be freed to be estimated separately for the groups involved. As discussed, below, given that items did not evidence salient DIF, these considerations were not relevant. However, we do discuss the relationship of the hypotheses to the findings of significant DIF, even if not of high magnitude.
Model assumptions and fit
IRT assumptions include unidimensionality and local independence. The latter implies that the items are independent, conditional on the trait level. Model assumptions and fit were tested. Traditional methods of examining essential unidimensionality were applied, 28 in which a merged exploratory factor analysis (EFA) and confirmatory factor analysis (CFA) were performed fitting a unidimensional model with polychoric correlations using MPlus. 29 The exploratory analyses used principal components estimation and examined tests of scree with cross-loadings permitted. This was followed by the confirmatory analyses of the unidimensional model. The root mean square error of approximation (RMSEA) was examined for model fit; however, we report the comparative fit index (CFI) in the table. Evidence suggests that the CFI may be more robust in the context of invariance testing.30,31 CFI values > 0.95 generally indicate good model fit;32,33 however, caution has been recommended in the use of such cutoffs. 34
The explained common variance (ECV) provides information about whether the observed variance covariance matrix is close to unidimensionality. 35 The ECV can be estimated as the percent of observed variance explained. It is the ratio of the first eigenvalue to the sum of all eigenvalues extracted. 36 There are no firm guidelines for ECV magnitude; 37 however, values greater than 0.50 are desirable. Under the single common factor model, reliability can be evaluated by decomposing the scale score into the sum of the item scores, and the contribution of the common term (λFj) or communality. Known as McDonald’s 38 omega total (ωt′) this reliability estimate is based on the proportion of total common variance explained. As with most reliability estimates, it is desirable to achieve high values (0.80 or better) because unreliability attenuates estimates of relationships with other variables of interest.
We examined the generalized, standardized local dependency (LD) chi-square statistics 39 provided in IRTPRO. 40 Although it is desirable to have values of less than 10, these statistics are affected by sample size. Thus, we examined the smaller samples (the Black and the low education subsamples). We performed sensitivity analyses removing 1 item each from two pairs of items with higher LD values.
Model fit for the DIF models was examined using the RMSEA from IRTPRO. Although there are no set standards, it is generally desirable to achieve values of 0.06 or less. 40
Software and procedures
The software used was MPlus 29 for factor analyses and IRTPRO Version 2.1 40 for IRT. Additionally, NCDIF24,26 was evaluated using DFITP5. 27 Prior to application of the DFIT software, the estimates of the latent trait (theta) were calculated separately for each group and equated together with the item parameters. Baker’s 41 EQUATE program was used in an iterative fashion in order to equate the theta and item parameter estimates for the two groups and place them on the same metric. If DIF was detected, the item showing DIF was excluded from the equating algorithm, and new DIF-free equating constants were computed and purified iteratively.
Results
Qualitative
The DIF hypotheses are summarized in Table 1. As shown, the majority of raters did not posit gender DIF for most items. Consensus was reached that conditional on satisfaction, women would be more likely to be satisfied than men regarding the patient’s pain relief, information about prognosis, and family conferences. Some raters posited that women would be less satisfied with respect to the speed with which symptoms are tested and availability of nurses to the family. Age DIF was posited for 6 items: pain relief, answers from health professionals, speed with which symptoms are treated, availability of nurses, availability of doctors, and coordination of care. Most of the items were posited to be in the direction of younger subjects expressing less satisfaction than older subjects.
Summary of DIF hypotheses generated by 12 content experts.
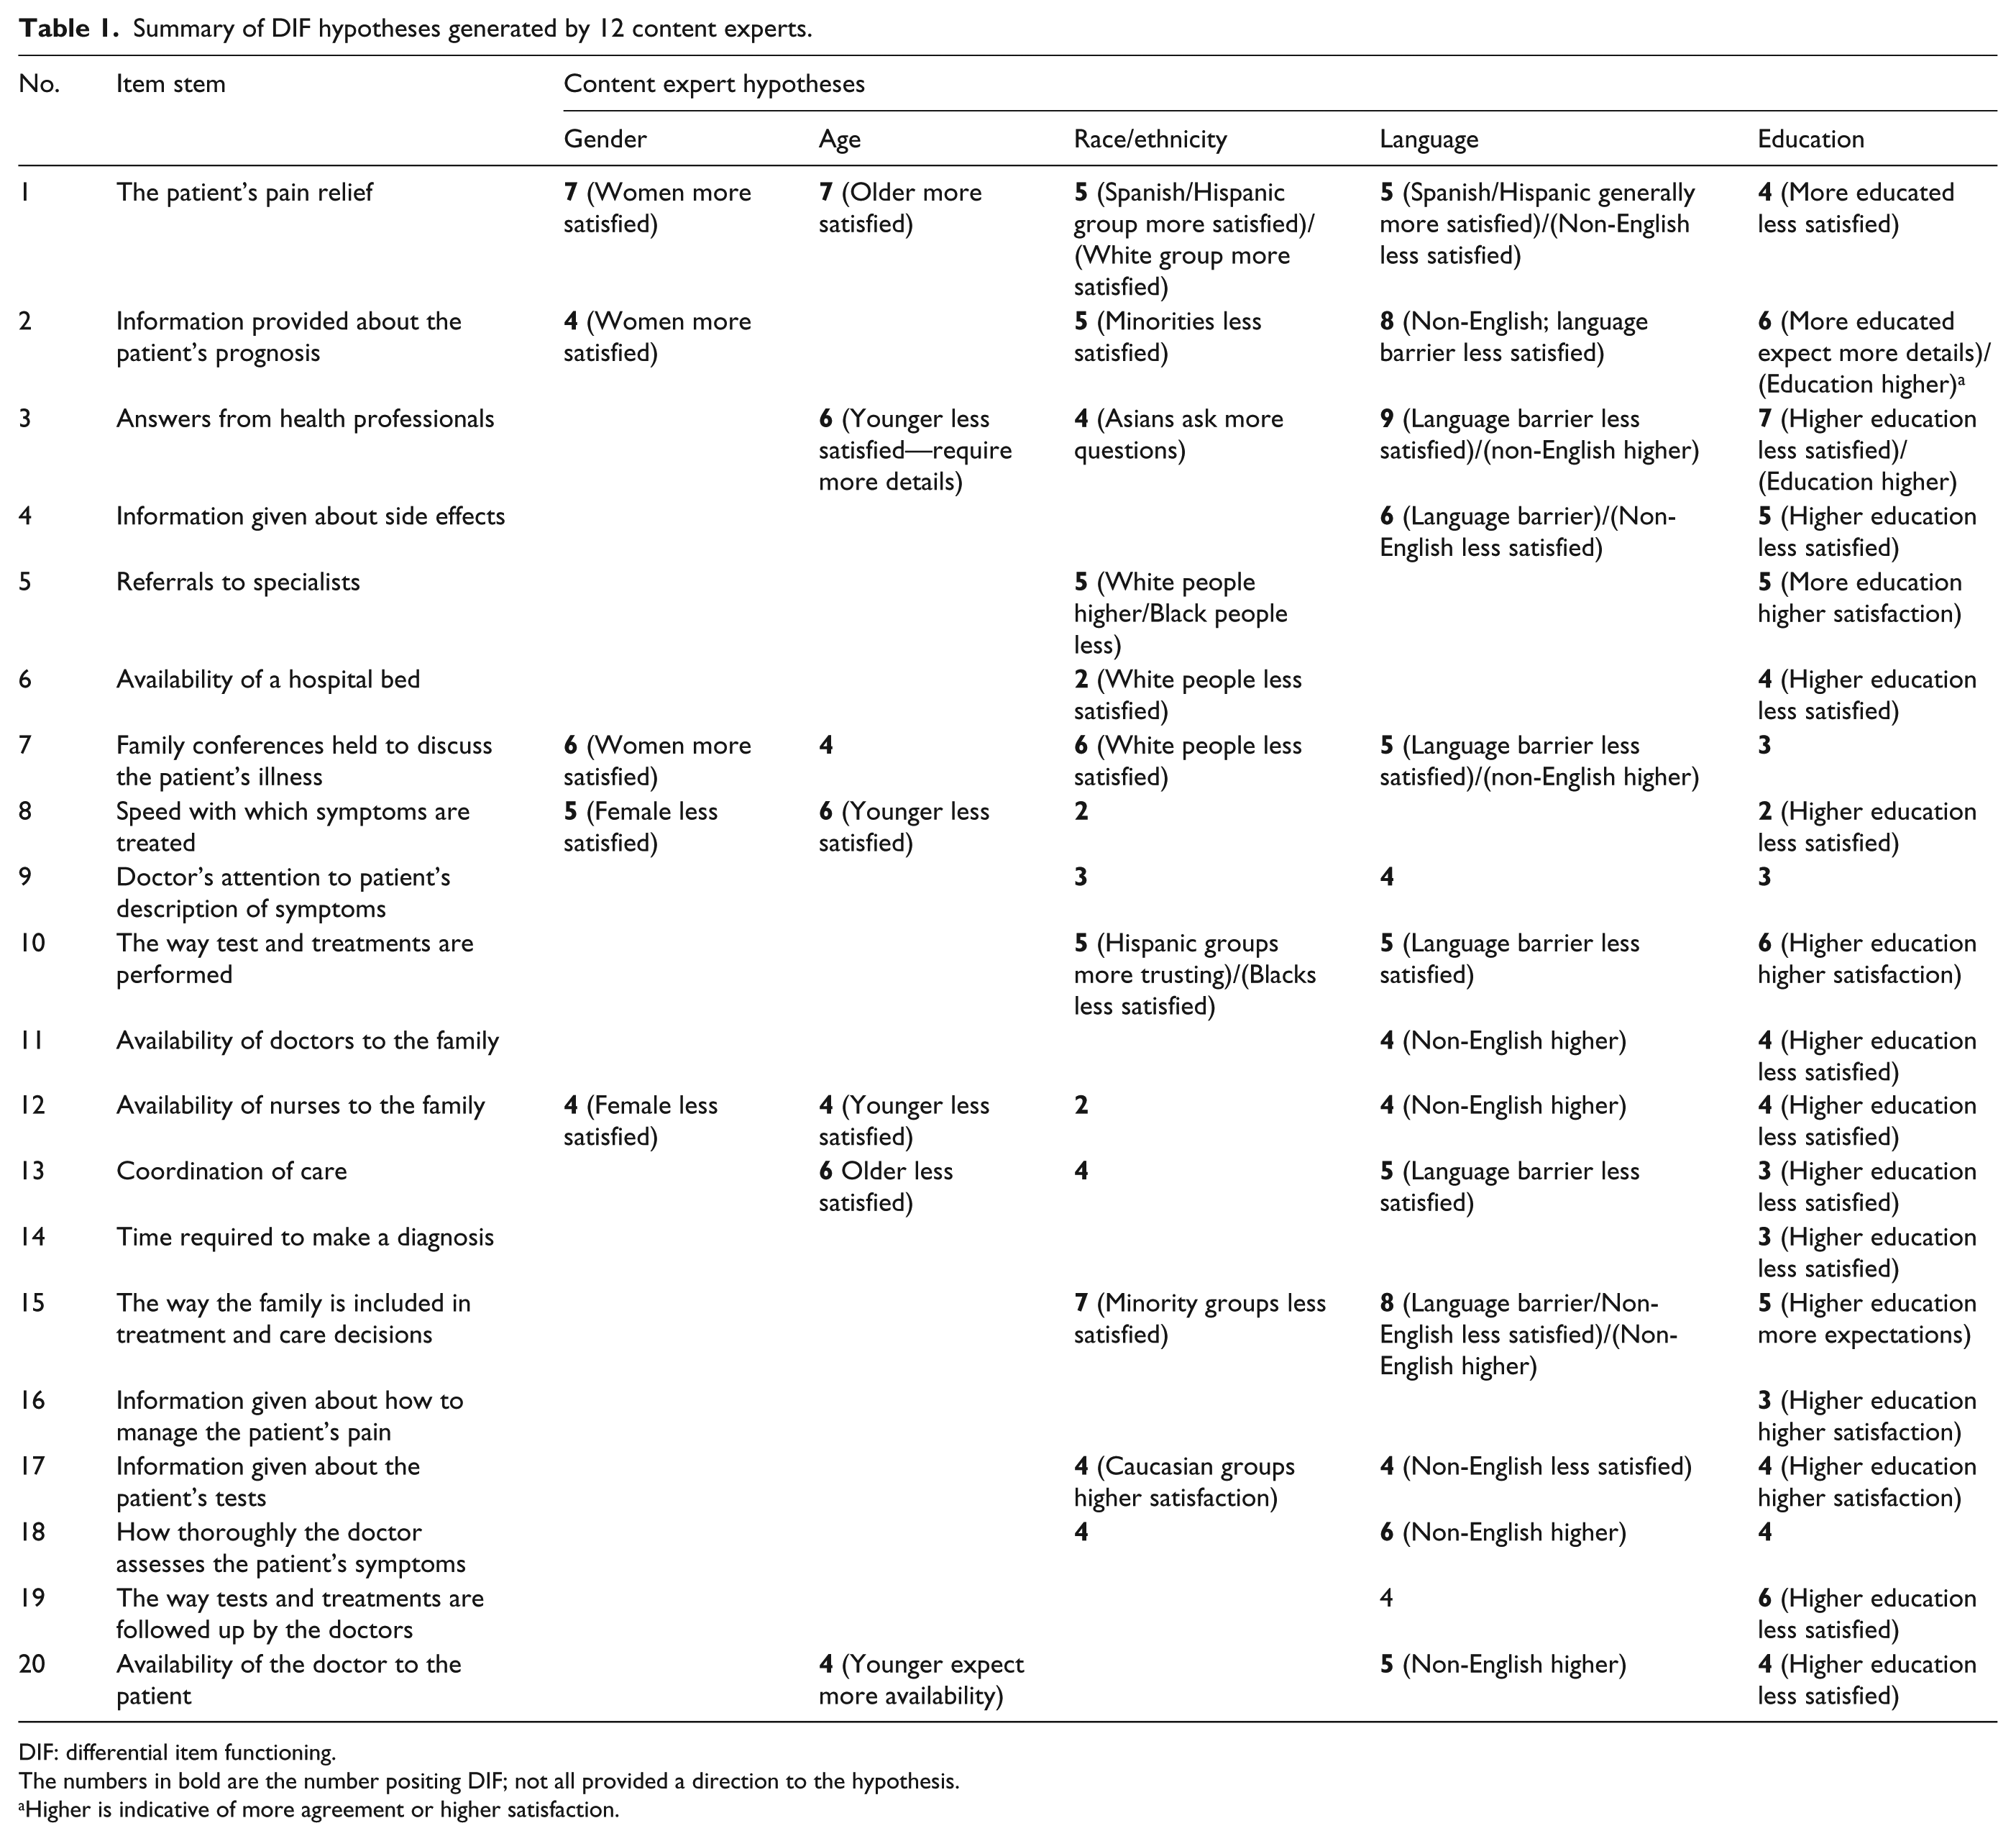
DIF: differential item functioning.
The numbers in bold are the number positing DIF; not all provided a direction to the hypothesis.
Higher is indicative of more agreement or higher satisfaction.
Most DIF was posited with respect to race/ethnicity, language, and education. With respect to race/ethnicity, 8 items were posited to evidence DIF, and a direction given: patient’s pain relief, information provided about prognosis, referrals to specialists, availability of a hospital bed, family conferences, the way treatments are performed, inclusion of the family in treatment decisions, and information given about tests. White respondents were posited to be more satisfied than minority group members with respect to the above items, except for family conferences and availability of a hospital bed. Most items were posited to show DIF with respect to language; however, the direction was mixed, and our data did not permit examination of DIF by language. Finally, all items were posited to show DIF for education, 17 with a direction provided. Most were in the direction of those with more education being less satisfied. DIF hypothesis related to education (with a direction) were pain relief, information about prognosis, answers from a health professional, information about side effects, referrals to specialists, diagnosis speed, availability of a hospital bed, treatment speed, performance of tests and treatments, availability of doctors and nurses, care received, inclusion of family in decisions, pain management, information about patient’s tests, the way tests and treatments are followed up by doctors, and availability of the doctor to the patient.
Quantitative
Our earlier work 7 showed that for the data set analyzed here, only 0.5%–2.3% responded “very dissatisfied,” and for most of the items, 1% or fewer of respondents reported being “very dissatisfied.” Moreover, the results of preliminary IRT analyses 7 using all response categories showed that for all items, the lower categories were overlapping such that the probability of response was similar for the three categories—very dissatisfied, dissatisfied, and undecided—indicating little if any unique information provided by these categories. Thus, due to sparse data in the very dissatisfied categories, equivocal classification in terms of the “undecided” category, and the results of preliminary IRT analyses, items were coded as ordinal and collapsed as follows: “Very satisfied” responses were coded as 2, “satisfied” as 1, and not satisfied (indecision or “dissatisfaction”) as 0. The resulting sum score was from 0 to 40. The analyses were performed using these three collapsed response categories.
As shown in Table 2, there was strong support for essential unidimensionality across all comparison socio-demographic groups. The principal component analyses identified only one subgroup (non-Hispanic Black people) with a second eigenvalue greater than approximately 1. The ratio of component 1 to 2 was large (11.8 to 15.5) for all comparisons, including non-Hispanic Black people (9.7). The first component across comparison groups accounted for between 81% and 85% of the variance for all groups except living arrangement (63% to 66%), supporting the essential unidimensionality of the item set across comparison subgroups. The RMSEA indices (not shown) ranged from 0.05 to 0.09 for all groups except the non-Hispanic Black subsample (RMSEA = 0.11). The CFIs ranged from 0.952 to 0.974 for all groups except the living arrangement variables (0.910, 0.921). The ECVs ranged from 50.383 to 56.469.
Eigenvalues from the exploratory factor analysis using principal component estimation and the model fit statistics for the total sample and subsamples.
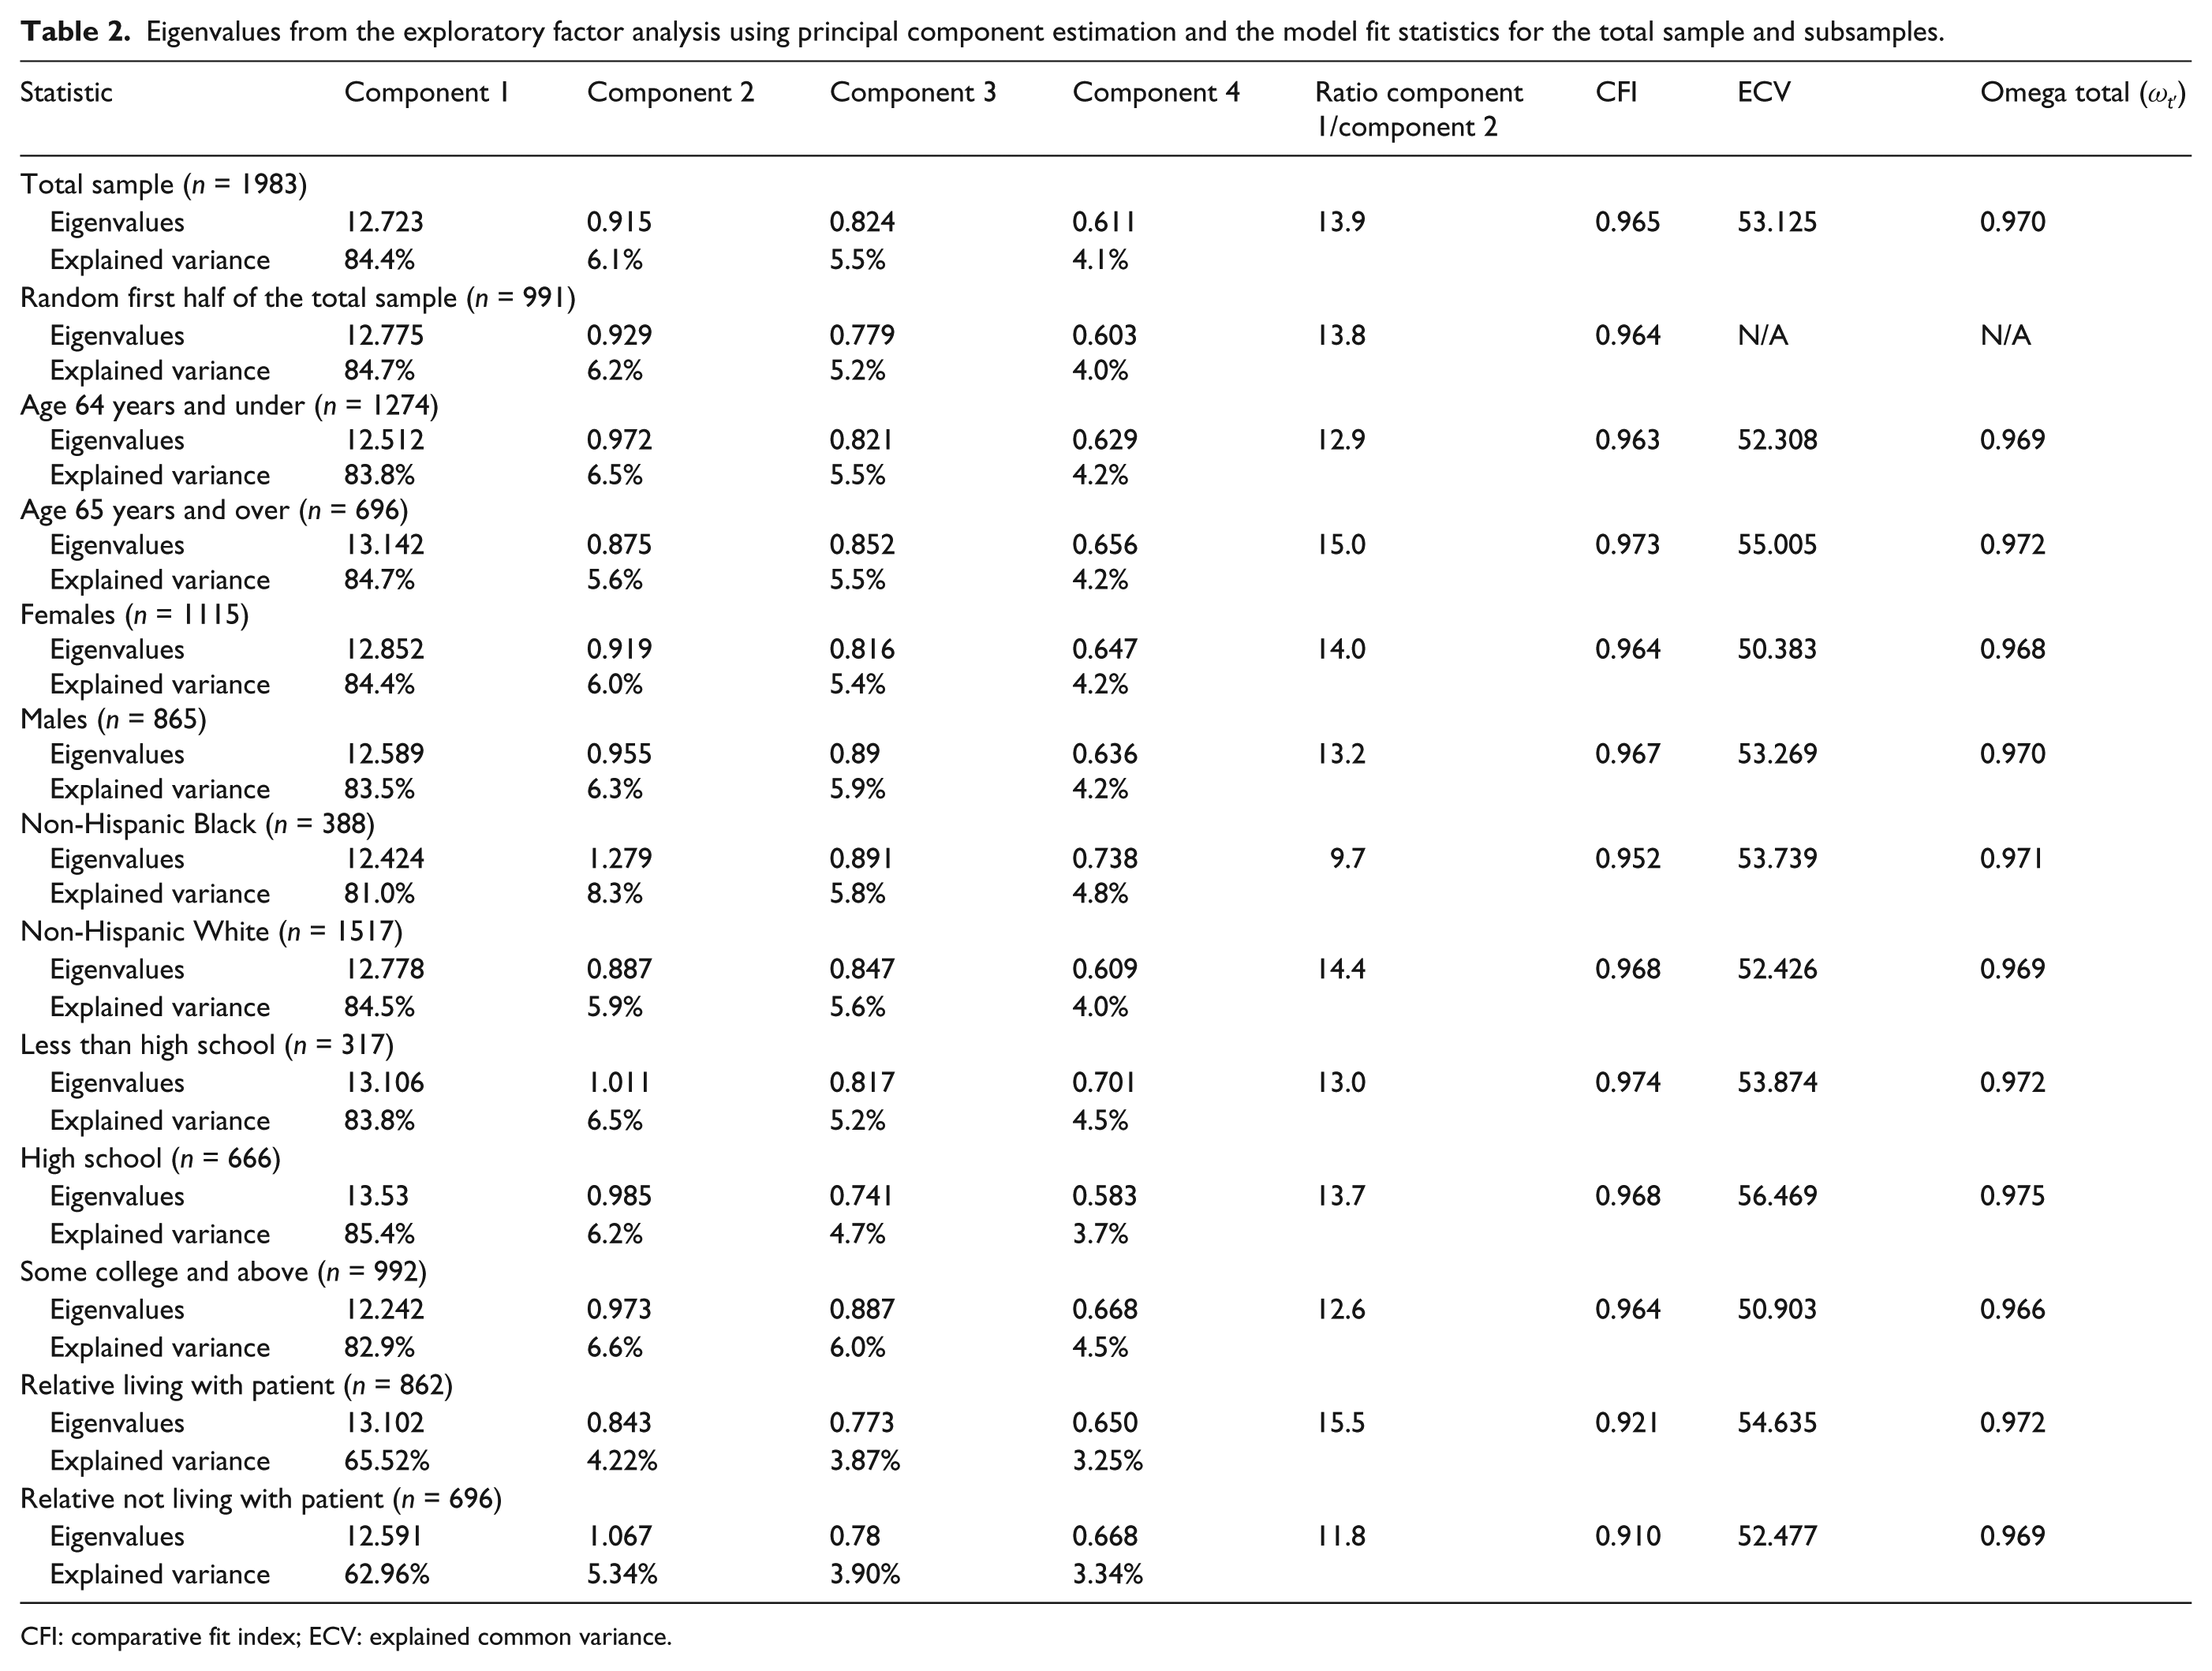
CFI: comparative fit index; ECV: explained common variance.
In general, the LD statistics were in the acceptable range. However, in sensitivity analyses, we removed 2 items that evidenced higher LD values. Among the Black subsample, item 2 (information about prognosis) evidenced the highest LD values with other items, ranging from 20.6 to 35.5. Among the low education group, the highest LD value was observed for item 12 (availability of nurse to the family). Item 7 also evidenced poor fit (p < 0.001) using an additional chi-square diagnostic. The results of the DIF analyses after item removal varied only slightly in terms of the parameter estimates, and the DIF p values were very similar, resulting in no change in DIF designations.
The fit statistics (RMSEAs) from IRTPRO for the IRT models (not shown) ranged from 0.04 to 0.05 across DIF subgroup comparisons models, indicating good fit.
The reliability estimates were high. The Omega total values (Table 2) ranged from 0.966 to 0.975, and the Cronbach’s alphas (not shown) ranged from 0.951 to 0.959.
The analyses of DIF showed that there was very little DIF evident for patient’s age and gender (see Appendix Tables 1 and 2, available online, and Table 3). After Bonferroni adjustment, non-uniform DIF was observed by age for 1 item, “Information given about patients’ tests.” However, the magnitude of DIF was small, and the NCDIF statistic was not significant or large. The impact of DIF was negligible, as shown by the overlapping curves (see Figure 1). For gender, no items showed DIF after Bonferroni adjustment.
Summary of DIF analyses: Age, gender, and race groups.
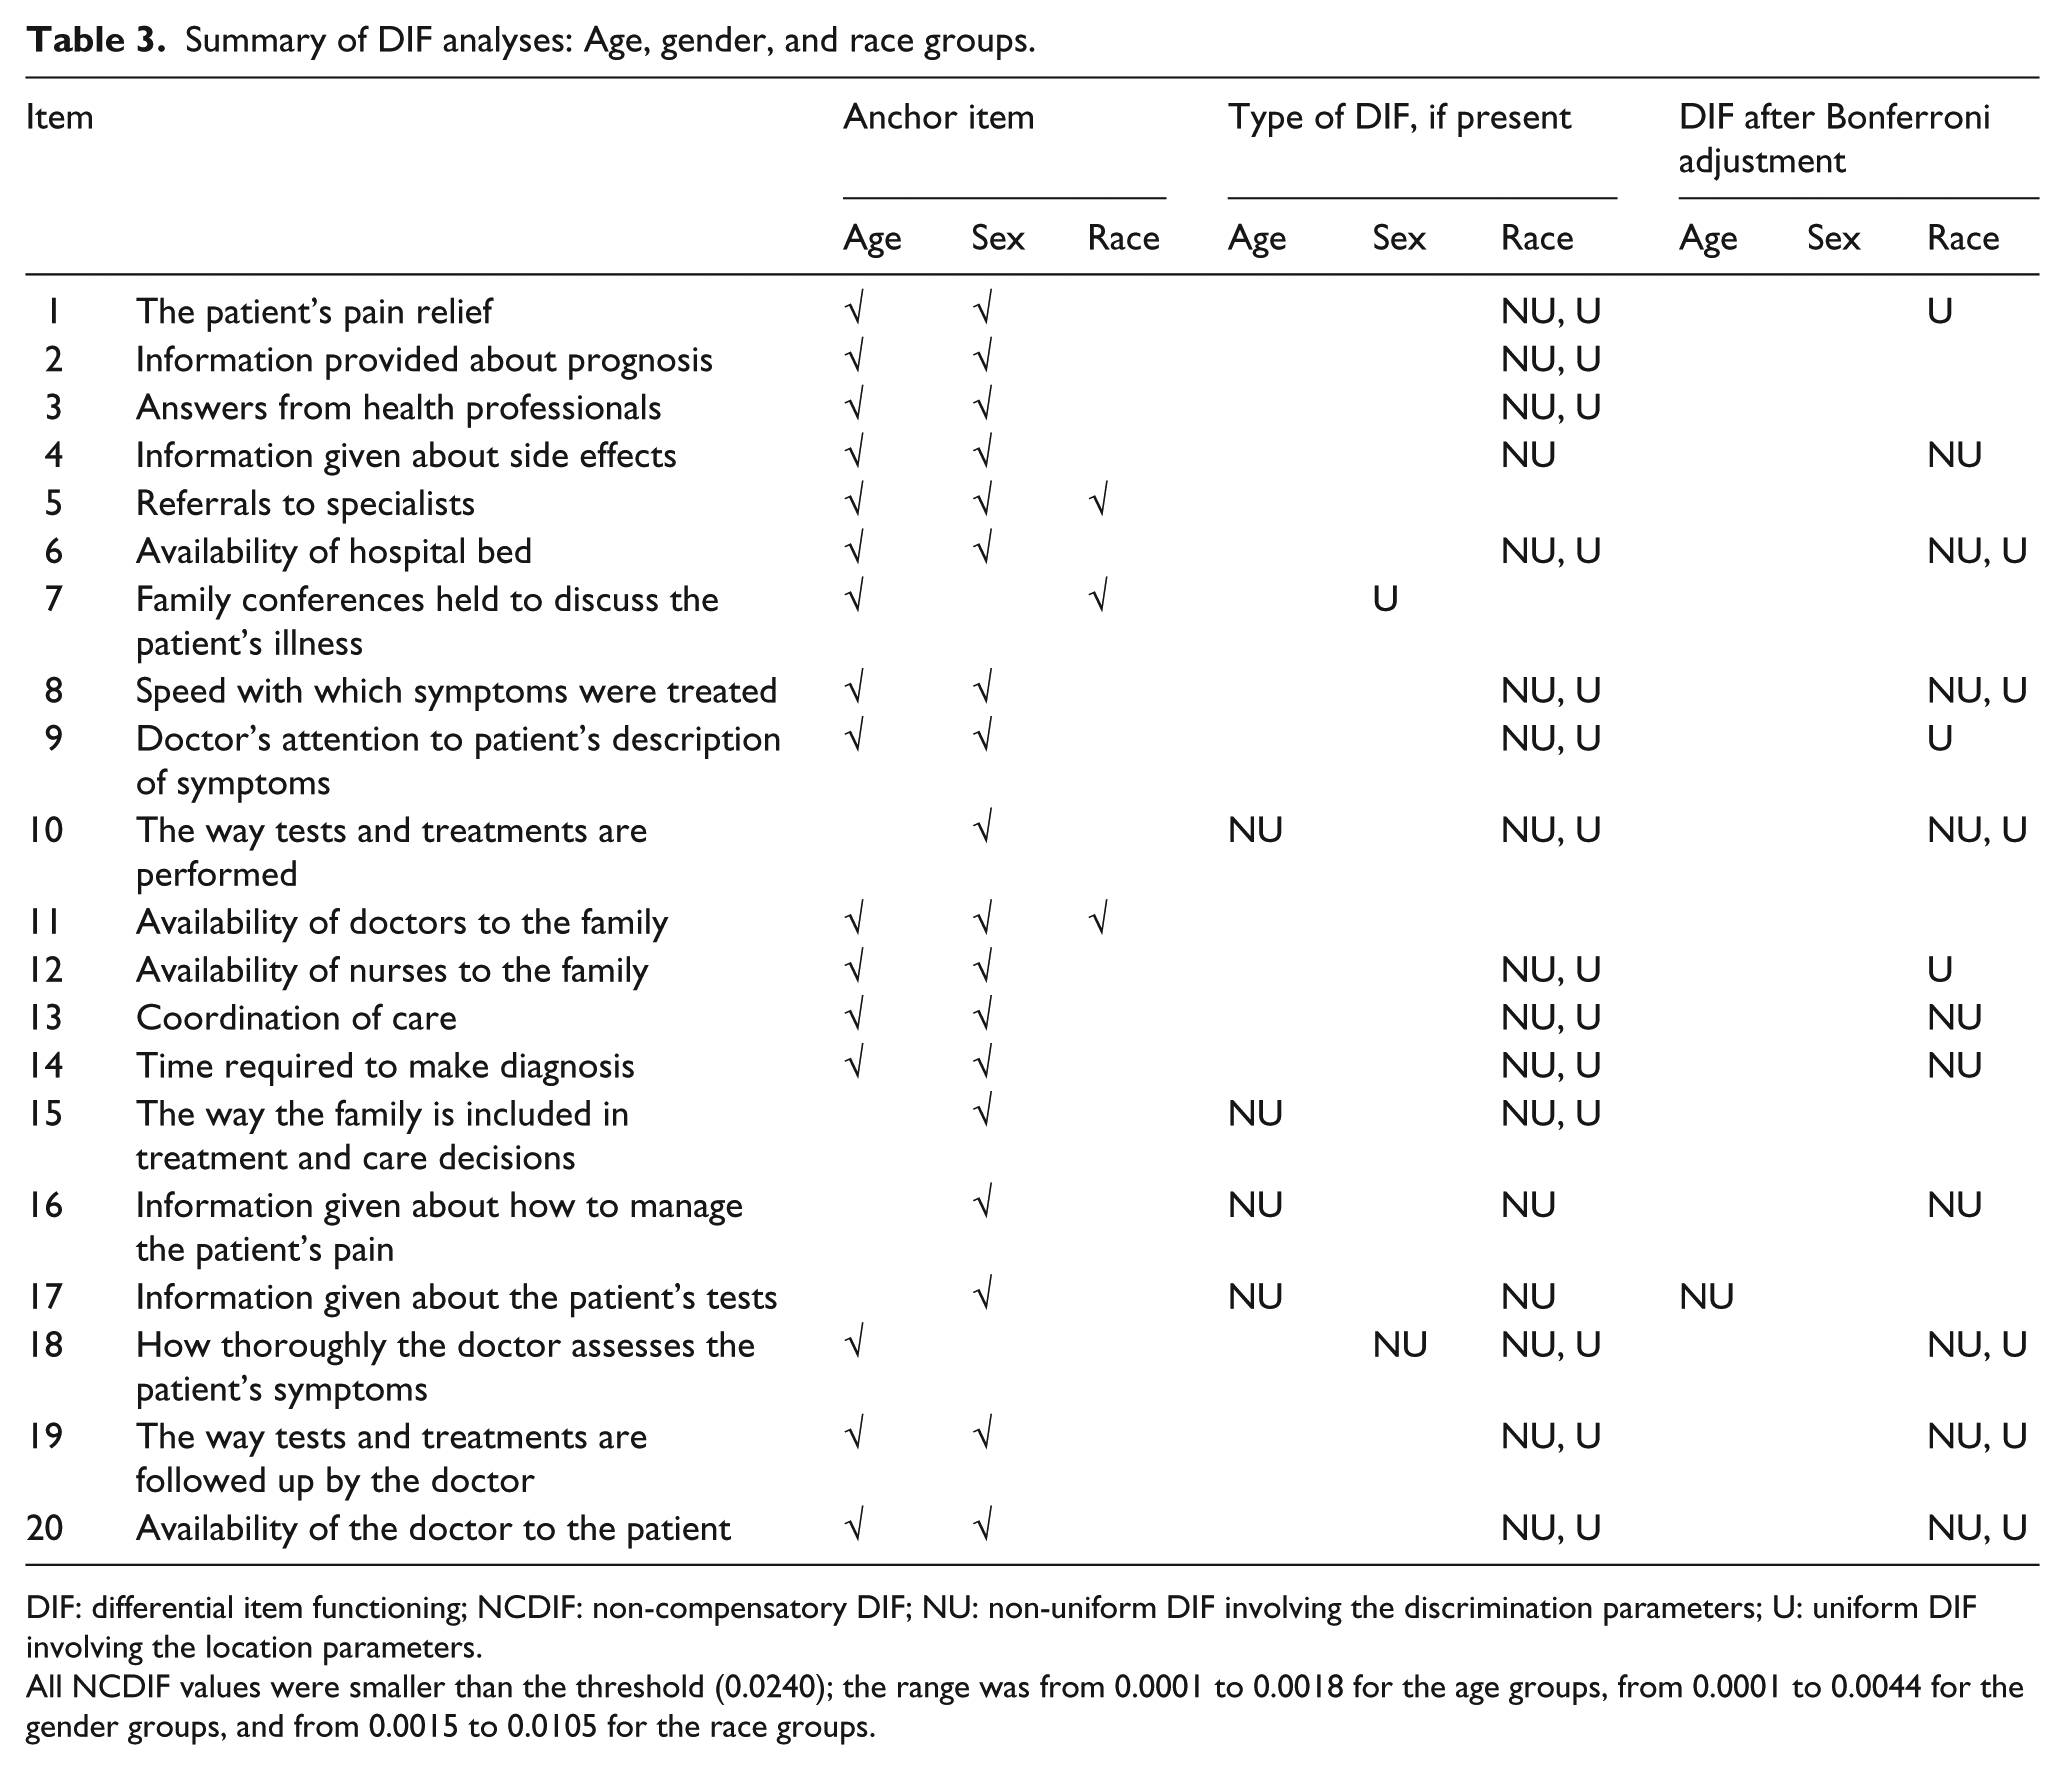
DIF: differential item functioning; NCDIF: non-compensatory DIF; NU: non-uniform DIF involving the discrimination parameters; U: uniform DIF involving the location parameters.
All NCDIF values were smaller than the threshold (0.0240); the range was from 0.0001 to 0.0018 for the age groups, from 0.0001 to 0.0044 for the gender groups, and from 0.0015 to 0.0105 for the race groups.
For race, 13 items showed DIF after Bonferroni adjustment, most with non-uniform DIF (see Appendix Table 3, available online, and Table 3.) The items with uniform DIF were “The patient’s pain relief,” “Doctors attention to patient’s description of symptoms,” and “Availability of nurses to the family.” Conditional on satisfaction, these items were more likely to be endorsed in the satisfied direction by White than by Black people. The discrimination parameter estimates tended to be higher for the Black than for the White group for the 10 items with non-uniform DIF. No items evidenced DIF of high magnitude, and the impact was trivial (see Figure 1).
For education, 5 items evidenced DIF after Bonferroni adjustment, all uniform. Conditional on level of satisfaction, in contrast to caregivers of patients with lower education, caregivers of patients with higher education were likely to report less satisfaction with pain relief, coordination of care, and the way treatments are performed and more satisfaction with specialist referrals and availability of a hospital bed (see Appendix Table 4, available online, and Table 4). No items evidenced DIF of high magnitude or impact (see Figure 1).
Summary of DIF analyses: education and relationship to the patient.
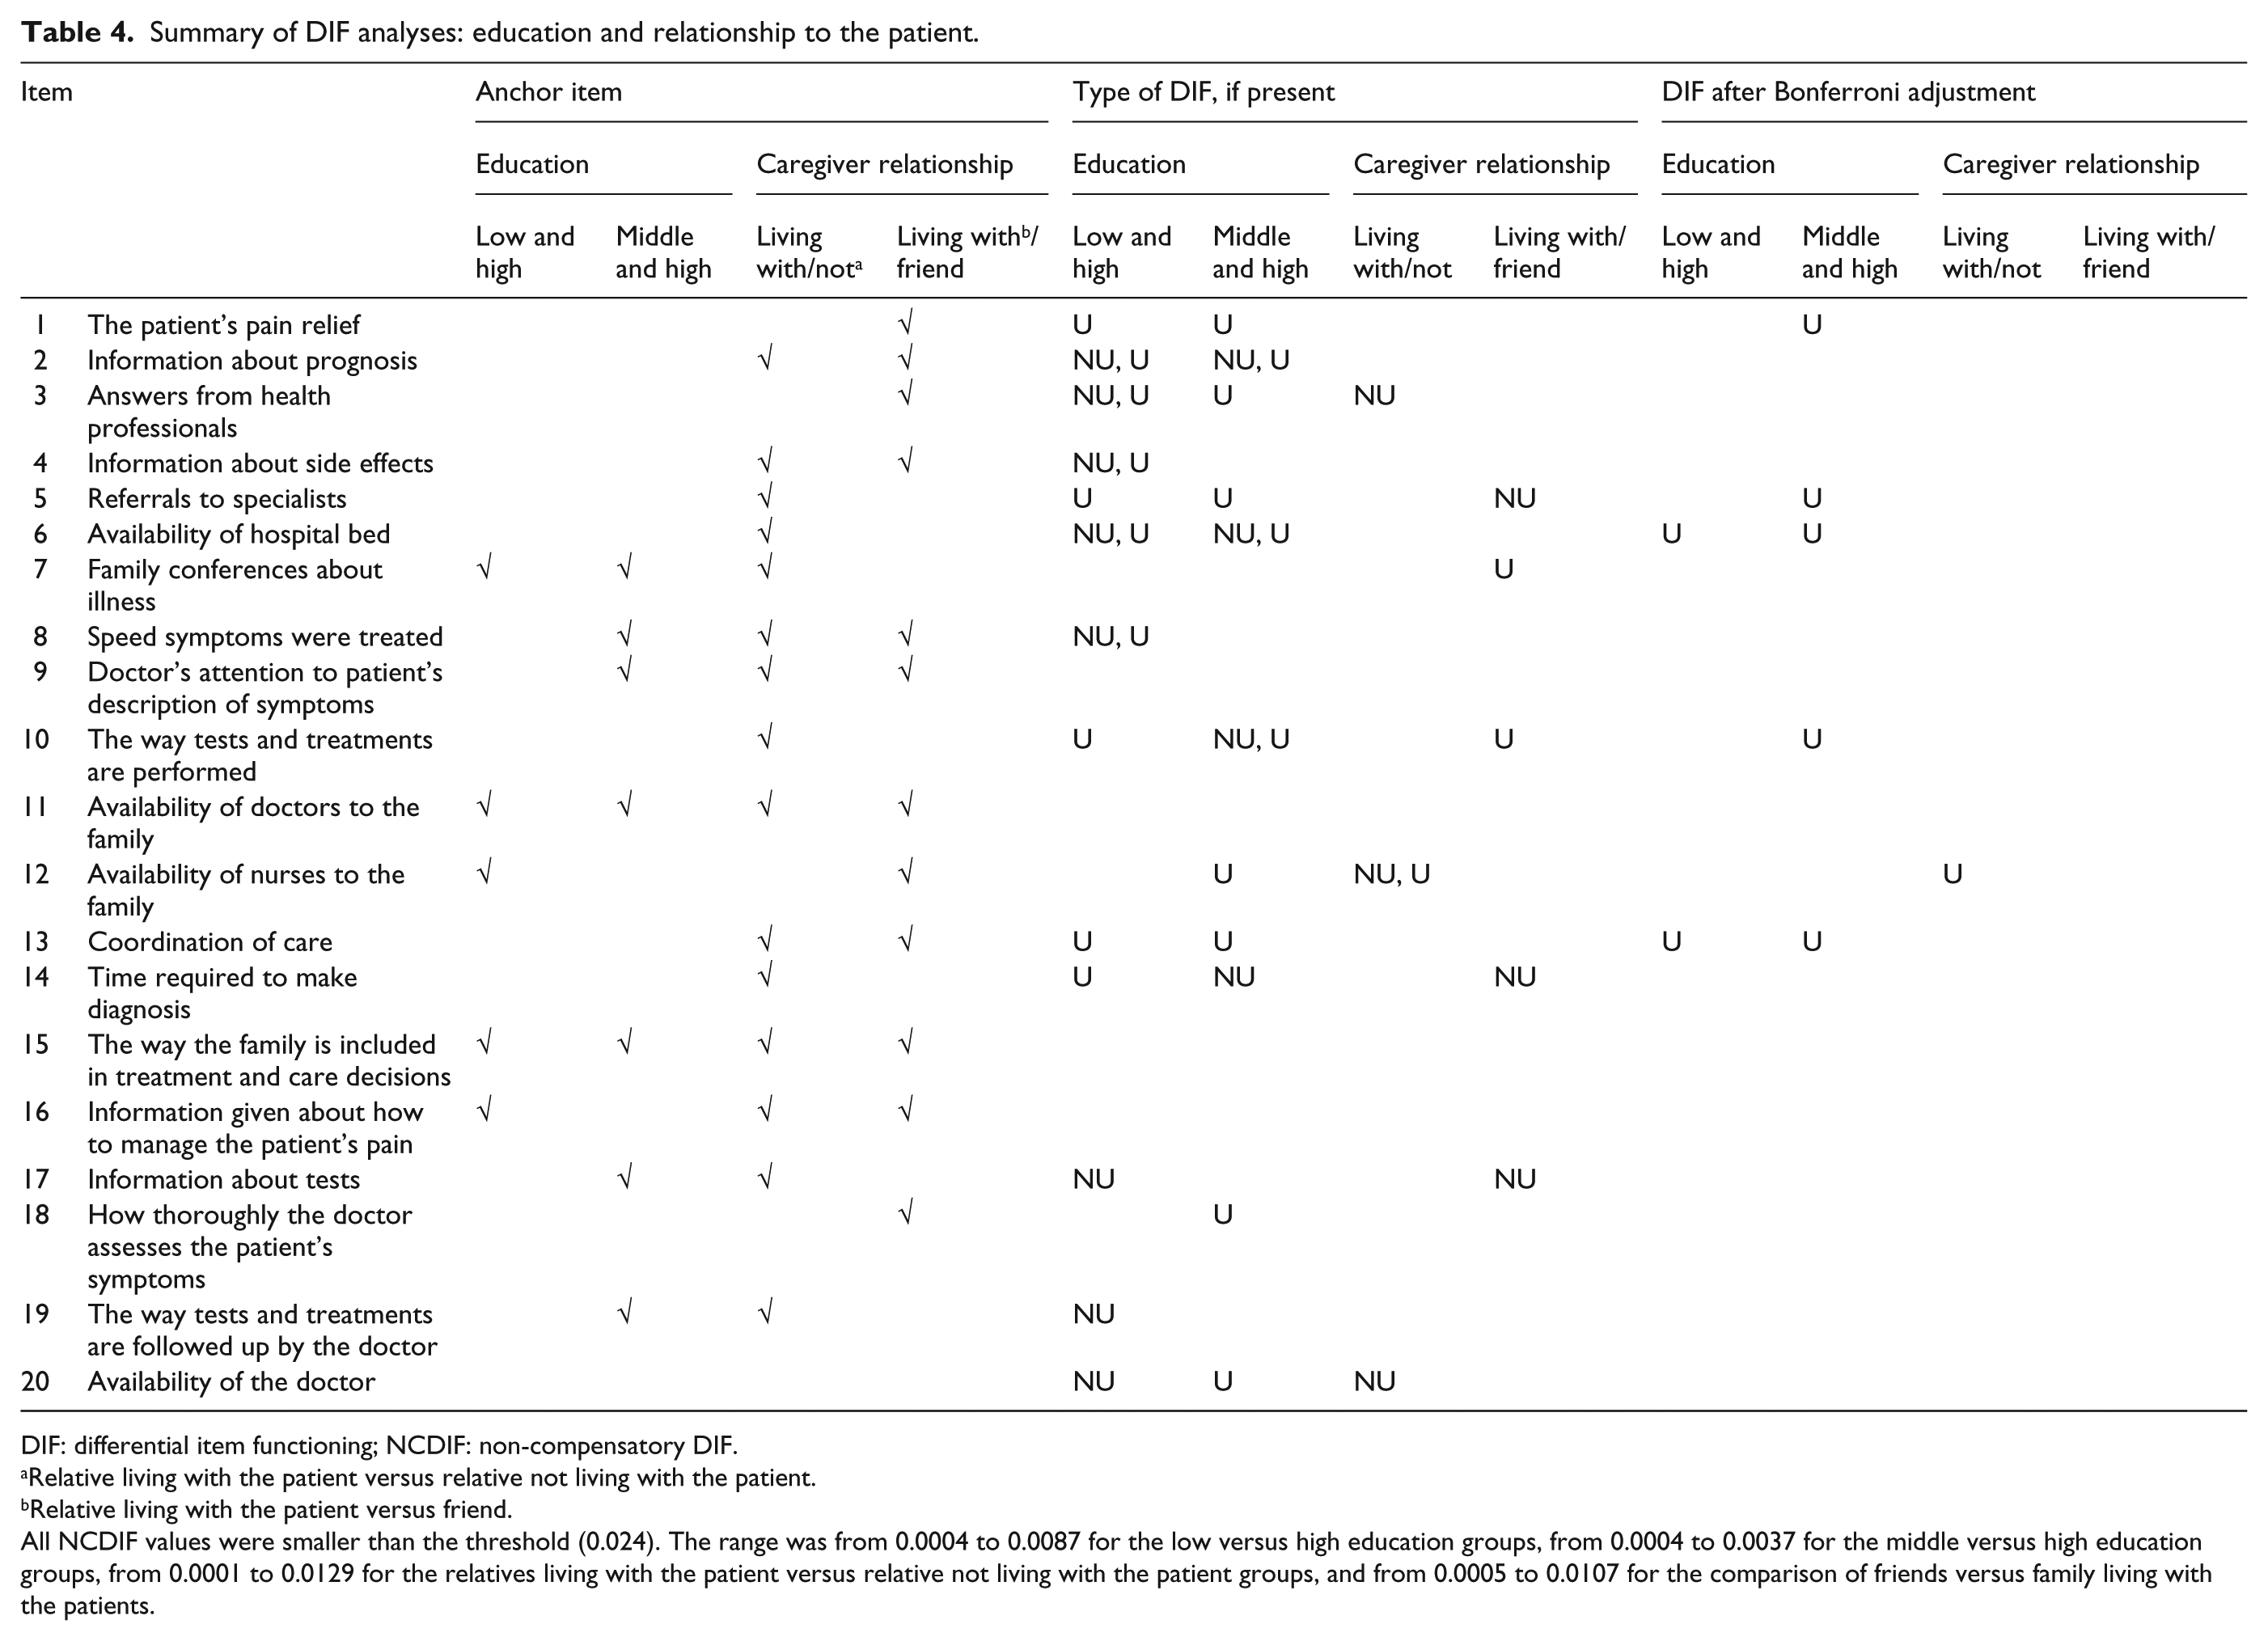
DIF: differential item functioning; NCDIF: non-compensatory DIF.
Relative living with the patient versus relative not living with the patient.
Relative living with the patient versus friend.
All NCDIF values were smaller than the threshold (0.024). The range was from 0.0004 to 0.0087 for the low versus high education groups, from 0.0004 to 0.0037 for the middle versus high education groups, from 0.0001 to 0.0129 for the relatives living with the patient versus relative not living with the patient groups, and from 0.0005 to 0.0107 for the comparison of friends versus family living with the patients.
Only 1 item evidenced DIF for the relationship variable: Family respondents living with the care recipients as contrasted with family members not living with the care recipients were more likely to be dissatisfied with the availability of a nurse, conditional on level of satisfaction (see Appendix Table 5, available online, and Table 4).
Discussion
Examination of the hypotheses for the qualitative analyses in conjunction with the quantitative analyses showed that most items were not hypothesized to show DIF for gender (5 items) or age (6 items) and little or no DIF was observed. For race, many items were posited to evidence DIF. In general, minority groups were hypothesized to express less satisfaction than White groups, conditional on overall satisfaction. For the 3 items with uniform DIF, a directional hypothesis was given for 1 item, and it was confirmatory. It was posited that conditional on satisfaction level, caregivers of Black patients would be less satisfied with pain relief, and this was the direction of the DIF. Two other items with uniform DIF were hypothesized to show DIF, but the direction was not specified (“doctor’s attention to patient’s description of symptoms” and “availability of nurses”). It is noted that while most items evidenced non-uniform DIF, the severity (b) parameters were also significantly different, all in the direction of lower conditional item satisfaction scores among Black as contrasted with White respondents. Except for 2 items, the hypotheses were confirmatory in that most items were hypothesized to show DIF in the direction of less satisfaction for Black people.
For education, 4 out of 5 items evidenced DIF in the direction hypothesized. The uniform DIF observed for “pain relief,” “coordination of care,” and “the way treatments are performed” were in the expected direction with those with higher education posited to be less satisfied, conditional on level of satisfaction. The DIF observed for “referrals to specialists” was also in the direction posited, with higher satisfaction expected for those with higher education. The finding related to hospital bed was in a direction opposite than hypothesized.
Limitations and strengths
Except for relationship of respondent to the patient and most likely race, the variables examined were with respect to the patient for whom the proxy was reporting. The findings for age and gender do not generalize to the population of caregivers; however, given the use of the measure as a proxy for patient response, the findings for gender and age may generalize to proxy reports of patient satisfaction. Although the lack of information about caregiver gender, age, and education is a limitation, to our knowledge, this is the first and only study of DIF in the FAMCARE using a relatively large, ethnically diverse sample.
Another limitation is that the results were mixed with respect to confirmatory evidence for the hypotheses. For example, while items with DIF were generally hypothesized to show DIF, 4 items observed to have non-uniform DIF for race were not hypothesized to show DIF. Additionally, 4 items posited to show DIF in the direction of minorities expressing less satisfaction, conditional on satisfaction, were not found to have DIF. However, most items with differences in the severity (location) parameters were in the posited direction.
Finally, while the fit statistics for the confirmatory factor model were generally acceptable, the fit was slightly poorer among the non-Hispanic Black subsample, which could result in over-identification of DIF in analyses involving that group.
Conclusion
In conclusion, within the limitations of the study, DIF was observed primarily for race and education. No DIF of high magnitude was observed for any item, and the total impact of DIF at the scale level was negligible. One item, satisfaction with “the patient’s pain relief” might be singled out for further study, given that this item was both hypothesized and observed to show DIF for race and education. Racial and ethnic disparities on the overall experience of pain (i.e. perception, assessment management, and treatment) have been documented. 42 Black people have also been found to have less adequate pain care at referral, prior to specialty pain care as compared to non-Hispanic Whites. 43 The literature documents individual (patient and provider) and systemic (health care) factors as explanatory mechanisms for such disparities. 44 Given that Black and White people have been shown to differ in response to pain items45,46 and that there are health disparities regarding pain recognition and treatment, this is an area that requires careful assessment.
Family satisfaction is frequently measured in patients receiving palliative care. As most societies experience greater ethnic and socio-demographic diversity, it is important to provide evidence regarding the performance of these measures among such groups of people. Although socio-economic factors can impact access to quality palliative and end-of-life care for patients and caregivers, it was important to examine to what extent reported dissatisfaction with palliative care by minority groups might be due to a measurement artifact. Because palliative care populations are characterized by individuals who may have serious illness and may be frail, patients and caregivers may experience burden answering questions. One goal of the project was to develop an item bank of parameters that can be used to select items for shorter forms or targeted and tailored assessment. Additionally, a goal might be to use a computerized adaptive test in the future. Such efforts require well-calibrated parameters and evidence of DIF in the item bank. In that fashion, some items may be avoided for administration or deemed satisfactory for inclusion. It can be concluded that the DIF observed in the FAMCARE for this study was of low magnitude and impact. Based on these data, most items can be recommended for further use, with the caveat that more DIF testing may be needed to examine DIF with respect to selected caregiver characteristics.
Footnotes
Declaration of conflict of interests
The authors declare that there is no conflict of interest.
Funding
This project was funded by the United States National Cancer Institute (grant no. 5R01CA116227-05). Support for these analyses was provided by the Claude Pepper Older Americans Independence Center: United States National Institute on Aging, P30, AG028741.
References
Supplementary Material
Please find the following supplemental material available below.
For Open Access articles published under a Creative Commons License, all supplemental material carries the same license as the article it is associated with.
For non-Open Access articles published, all supplemental material carries a non-exclusive license, and permission requests for re-use of supplemental material or any part of supplemental material shall be sent directly to the copyright owner as specified in the copyright notice associated with the article.