
Abstract
Students’ use of learning time both inside and outside of school has been at the core of education debates for many years, although evidence is still mixed. Particularly, in order to analyse the contribution of the time students use for learning to their competences, we use TIMSS 2019 data for a total of 276,512 fourth grade students in 58 countries. Taking advantage of the information by subject provided in this dataset, we go beyond correlation analysis by using student fixed-effects. Our results show that one additional hour of weekly instruction and homework times have a non-significant influence on students’ competences in most of the analysed countries, while they also present a low positive influence in some of them. This may suggest the need of re-orienting school instruction and homework times following the education curriculum model of those countries in which the influence is positive, so students can improve their skills.
Introduction
Learning Time in the Education Debate
The use that students make of their learning time has been at the core of education debates for many years. This, together with the increasing relevance of international large-scale tests (such as e.g. PISA 1 or TIMSS 2 ) to measure students’ competences and skills, has led to questioning whether students and schools are making the most of the time students spend on their educational activities. However, research on this subject is far from conclusive.
In particular, there are two main types of learning time that students have to develop their competences: weekly instruction time, i.e. learning time at school, and homework time, i.e. out-of-school learning time, both of which are the focus of the present research study. Some international assessments have explored the relationship of these learning times with students’ competences. For instance, according to Mullis et al. (2020), in TIMSS 2019 some countries scored well, such as Singapore. It presented the highest scores in mathematics and science, with 625 and 595 points, respectively, and had average annual instruction time of 1,053 hours. However, other countries contrasted with this reality: for instance, although students in Philippines devoted 1,225 annual hours to instruction time, their scores were 297 and 249 points, respectively, in the two competences. On the other hand, students in Korea, for instance, have 694 annual hours of instruction time, but their scores were 600 and 588 points, respectively. Therefore, the relationship between students’ competences and learning time may not be so evident.
School Learning Time and Students’ Competences
Evidence is mixed regarding school learning time (weekly instruction time). There is a strand of the literature which indicates that it has no influence on students’ academic performance. This was the conclusion reached by authors such as Woessmann (2010), who studied 16 states in Germany, Lopez-Agudo and Marcenaro-Gutierrez (2018), who analysed PISA 2015 data for Spain, and Connolly (2021) for England. Even the meta-analysis by Hendriks et al. (2014) of 46 research works indicated an almost non-existent influence. Nevertheless, another strand of the literature indicates that there is a positive relationship between weekly instruction time and students’ academic performance. This includes the research studies by Lavy (2015) for 50 countries in PISA 2006, Rivkin and Schiman (2015) for 72 countries in PISA 2009, Cattaneo et al. (2017) for Switzerland in PISA 2009, Andersen et al. (2016) for students in Denmark, OECD (2011) for PISA 2006 participating countries, Mullis et al. (2012) for TIMSS 2011 participating countries, and Meroni and Abbiati (2016) for sixth grade Italian students, among others. Furthermore, some meta-analyses have also shown this positive relationship; for instance, Patall et al. (2010), who analysed the influence of weekly instruction time in 15 studies since 1985.
Out-of-School Learning Time and Students’ Competences
Regarding the out-of-school use of students’ learning time (weekly homework time), it has been usually perceived by educators as the main form of learning for students when they are not at school. This homework has been defined by authors like Corno and Xu (2004) as the “job of childhood”, to the extent that it develops students’ responsibility and attitude, preparing them for their future jobs. Nevertheless, schools and parents usually disagree on the homework issue, given that parents perceive their children have large amounts of homework, whereas teachers consider it to be normal (Cooper, 2001). This has reached the point in which parents think their children could be “wasting their childhood” due to this amount of homework, 3 a situation which has even provoked “homework strikes” in some countries. 4
As with weekly instruction time, previous research studies on this issue have shown somewhat mixed results. One strand of the literature points towards the positive influence of weekly homework time on students’ academic performance. For instance, Cooper et al. (2006) performed a meta-analysis in the United States, finding a positive correlation of 0.60 standard deviations (SDs) of weekly homework time on students’ achievement, while Guo et al. (2022) found an effect size of 0.45 SDs. Both the meta-analysis by Hattie (2009) and Scheerens and Hendriks (2014) found an effect size of 0.29 SDs, followed by the results of Ozyildirim (2022) for eighth grade students (0.26 SDs), although they found a negative influence for fourth grade students of −0.06 SDs – and 0.20 SDs obtained by the meta-analysis of Baş et al. (2017). Lower positive influences of about 0.073 SDs were found by Scheerens et al. (2007), about 0.05 SDs by Hendriks et al. (2014), and about 0.008 SDs (which is almost zero) by Stevenson (2021).
These positive-association results of the meta-analyses are consistent with the few cross-national analyses conducted to date. For instance, OECD (2011) indicated that students in developed countries who did more homework performed better in science. Similarly, Falch and Rønning (2012) carried out a cross-national analysis of 16 countries and also found a positive association of about 0.20 SDs, while Murillo and Martinez-Garrido (2014) used data from Latin American students and found that weekly homework time presented a positive influence on students’ academic achievement. However, Jerrim et al. (2019) found a non-significant influence of homework on fifth and eighth grade Spanish students’ competences.
On the other hand, Dettmers et al. (2009) found mixed results for 40 countries participating in PISA 2003, indicating a positive relationship between weekly homework time and academic achievement in some countries, but a negative relationship in other countries. Baker and LeTendre (2005) also analysed the correlation between weekly homework time and academic performance in mathematics for many countries that participated in TIMSS 1999, finding a negative association.
Therefore, it seems that there are no conclusive results regarding the influence of weekly homework time on students’ academic performance, and further research is required. Indeed, Trautwein and Köller (2003) performed a review of 20th century homework research and found that the empirical evidence regarding the benefits of homework is rather weak. These conclusions have also been supported by an analysis of the aforementioned international literature published by the Education Endowment Foundation in the UK, which indicated, in respect to the influence of weekly homework time on students’ academic performance, that “A number of reviews and meta-analyses have explored this issue. There is stronger evidence that it is helpful at secondary level, but there is much less evidence of benefit at primary level” (Education Endowment Foundation, 2017, p. 1). This was also supported by Kohn (2006), who highlighted many limitations of the existing empirical studies regarding the influence of primary school homework on students’ academic performance. These limitations ranged from the fact that most existing evidence was purely correlational to low reliance on available homework measures, as they were solely based on students’ self-reports.
The Contribution of the Present Study to the Debate on Time Spent Learning in the School and out of School
In this context, in spite of the large amount of literature on instruction and homework time, clear conclusions have not been obtained regarding their influence on students’ competences. As indicated, the influence of these variables may change by grade and/or country, and also depending on the methodology that has been employed for their analysis. Therefore, to overcome this issue, the present study aims to determine the influence of one additional hour of both instruction and homework times on fourth grade students’ competences in 58 countries. For this purpose, we use the same methodology for each one to make results comparable (in contrast to other studies and meta-analyses, as e.g. Lopez-Agudo & Marcenaro-Gutierrez, 2022, which only focuses on 24 countries with TIMSS, 2011 data and solely on instruction time, or Jerrim et al., 2019, only for the Spanish region of Andalusia, solely homework time and using twin fixed-effects). Thus, we can clearly discern potential differences in influences of one additional hour of instruction and homework times from differences due to the applied methodologies, the analysed grades or countries. In order to go beyond correlation and obtain causal results as much as possible, we apply a quasi-experimental methodology, namely student fixed-effects within-students between-subjects. This methodology has been found to be useful for this purpose in many research papers (e.g. Woessman, 2010, for Germany; Lavy, 2015, for 50 countries; Rivkin & Schiman, 2015, for 72 countries; Cattaneo et al., 2017, for Switzerland; and Jerrim et al., 2019, for Spain, among others). Thus we believe that, although with its limitations, it is the best methodology that we can apply to perform our analysis given this dataset that presents between-subjects information.
In particular, the present study employs data from the Trends in International Mathematics and Science Study (TIMSS) 2019 for fourth grade students in 58 countries to delve into the relationship between one additional hour of weekly instruction and homework time and students’ competences. Although TIMSS provides information for students in fourth and eighth grades, the focus has been placed on fourth grade students because, as previously indicated, there is less evidence that homework can benefit students’ competences at primary level (Education Endowment Foundation, 2017). Fourth grade students are found to be more malleable because at this age they are starting to develop their competences (Thompson-Schill et al., 2009), while eighth grade students are adolescents and their development is more advanced. As previously indicated, it is not yet clear whether students in fourth grade should be spending so much time at school and doing homework or, alternatively, in other developmental activities (Cooper, 2001; Cosden et al., 2004). Therefore, our hypothesis is that one additional hour of both instruction and homework times may not have a linear relationship with improvements in students’ competences in general, but heterogeneous influences may be possible, as suggested by previous literature, conditioned on the region. However, due to the mixed results obtained in this previous literature for many countries, we are cautious and do not anticipate which influence we will find before the analysis. The research question that we want to answer is the following:
Does one additional hour of instruction and homework time have a linear relationship with the development of students’ competences?
This research study is novel in at least three ways: (a) First, in the analysis of the influence of one additional hour of weekly instruction and homework time on students’ competences, we intend to go beyond correlation by using the student fixed-effects within-students between-subjects methodology. (b) Second, we explore this issue for fourth grade students in 58 countries, which enhances the external validity of our results. (c) Alternative cognitive scores were created using students’ actual responses and were used instead of TIMSS imputed scores, which allows obtaining more precise results (Jerrim et al., 2017), as described in the Data section.
Methodology
Data
The present study employs recent TIMSS data for 2019. This international large-scale assessment test was conducted by the International Association for the Evaluation of Educational Achievement (IEA) and intends to provide a measure of fourth and eighth grade student competences in mathematics and science for the 58 participating countries. 5 For this purpose, students take mathematics and science cognitive tests, together with a student questionnaire, a household questionnaire completed by the parents, and one taken by teachers about their teaching. A two-stage cluster sample design is employed in TIMSS (Martin et al., 2020): in the first stage, schools are sampled with probabilities proportional to their size, whereas all students in one or more classes within the school are chosen to participate in the second stage.
In the present study we focus on fourth grade students (i.e. primary education students). We take advantage of the information provided by teachers about the weekly minutes of instruction time received by students and the weekly minutes of assigned homework time. Both variables were converted into hours to facilitate the interpretation of our results. These variables are separately reported for mathematics and science, which enables us to apply our identification strategy, as we will see in the following subsection.
Moreover, in order to reduce the burden and time of taking the whole set of questions, the IEA created a booklet structure so that students who participated in TIMSS only had to answer a set of mathematics and science questions that were included in 22 booklets. Therefore, students did not answer all questions, so their scores were imputed for those questions that they did not answer using an Item Response Theory (IRT) model. More information on the model can be found in Martin et al. (2020). However, according to Jerrim et al. (2017), student fixed-effects would not be correctly applied if imputed values were used. As students’ scores are created by using questions that they did not answer and are therefore imputed, the between-subject variability (the basis of the student fixed-effects model) would be artificially created. Consequently, the results obtained would be biased and based mostly on an imputation error. To solve this issue, alternative cognitive scores were created using students’ actual responses. In order to do this, we have employed the information of all the questions that students actually answered (which present the values “Correct response,” “Partially correct response” and “Incorrect response”) and assigned a value of 1 to “Correct response,” 0.5 to “Partially correct response” and 0 to “Incorrect response” (as suggested by Jerrim et al. 2017). Then, the scores of all the questions answered by the student have been added to create cognitive scores, which have been standardised by country. This is also novelty of the paper, which allows obtaining more precise estimations.
Analysis Plan
The methodology employed in this research study is student fixed-effects within-students between-subjects (mathematics and science). In particular, the initial model that has been specified is:

In the following equation, we take differences between-subjects to apply student fixed-effects, reaching the base model:

The rationale in the use of this methodology is based on the assumption that, besides students’ instruction and homework time, other determinants of students’ cognitive scores are similar within-students between-subjects, and are thus implicitly controlled for. This means that variables that are not in our database are accounted for, as well as many unobservables that are similar within-student between-subjects. The use of within-student variation between-subjects as a valid identification strategy for the influence of one additional hour of education time has been supported by other research studies (e.g. Woessmann, 2010, for Germany; Lavy, 2015, for 50 countries; Rivkin & Schiman, 2015, for 72 countries; Cattaneo et al., 2017 for Switzerland; and Jerrim et al., 2017, for Spain). In this sense,

In these estimations, TIMSS recommended practices have been used (student sampling weights and Jackknife replication weights) in order to account for TIMSS sample design and to correct standard errors. 10
Results
Preliminary Analysis
As a preliminary analysis, a two-way scatterplot reflecting the relationship of students’ competences
11
with, alternatively, weekly instruction time and weekly homework time has been plotted for all the countries under analysis in Figures 1 and 2, respectively. Relationship Between Students’ Competence Scores and Weekly Instruction time. Source: Authors’ Own Calculations Relationship Between Students’ Competence Scores and Weekly Homework Time. Source: Authors’ Own Calculations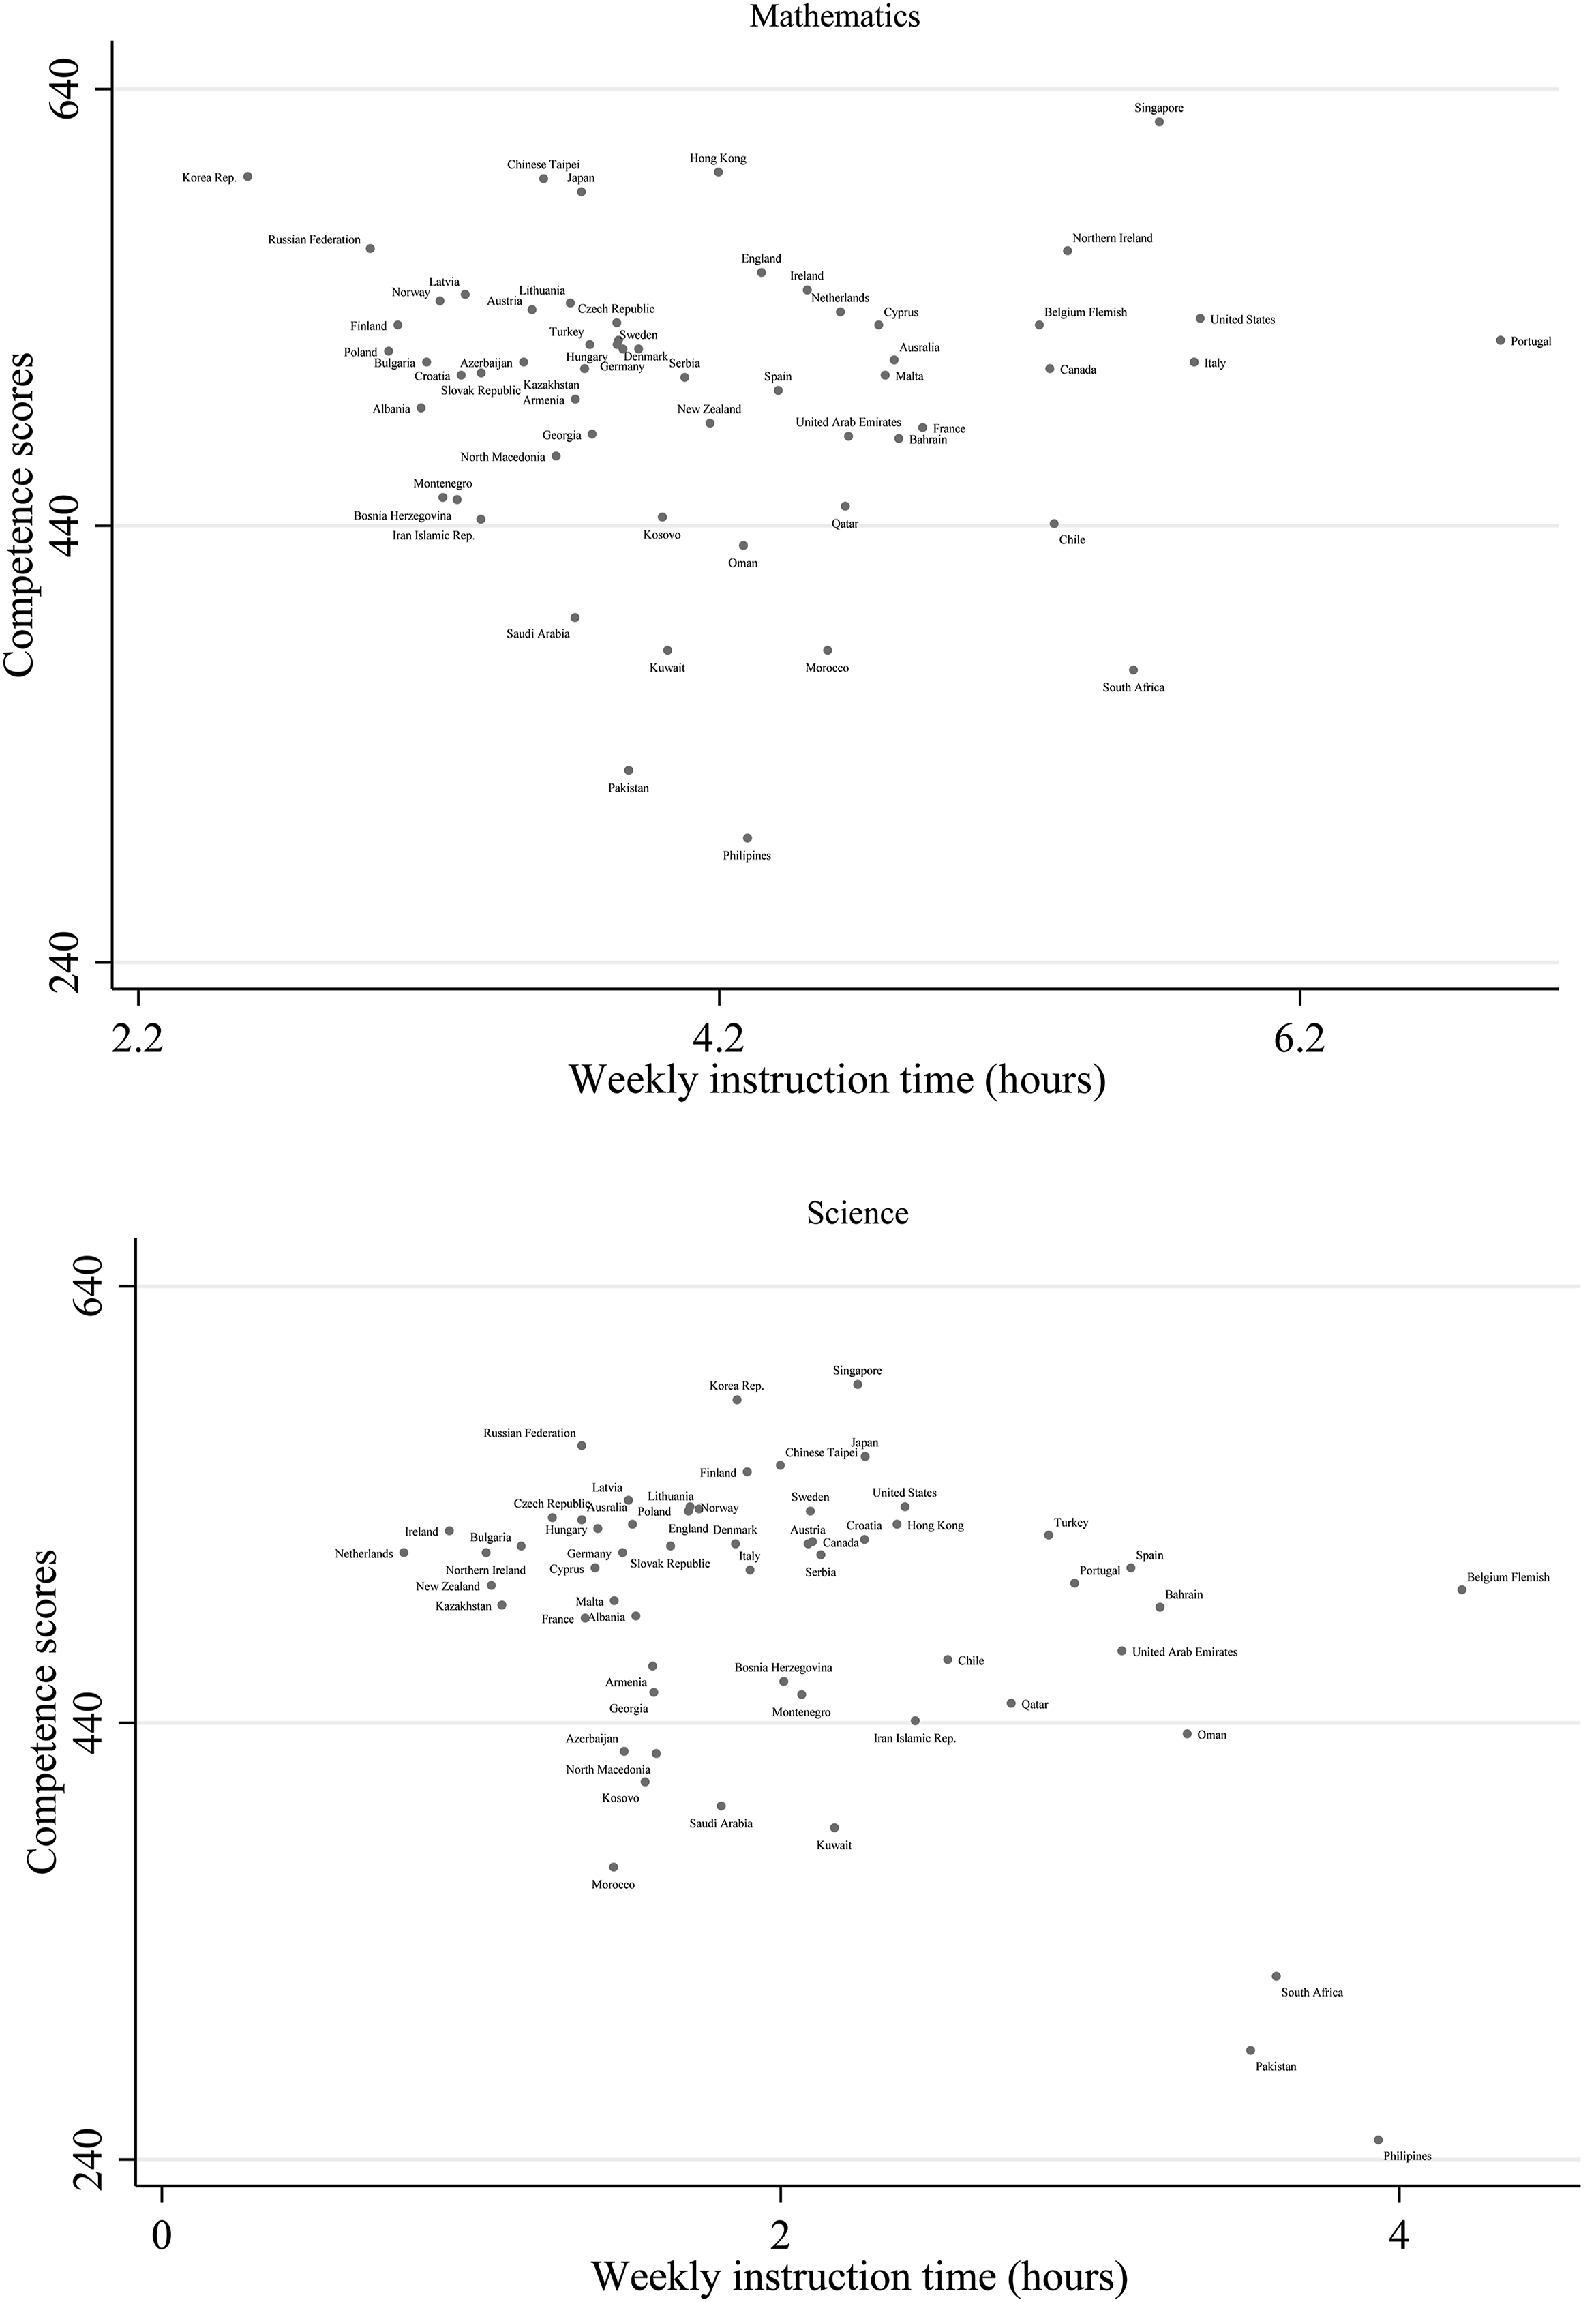
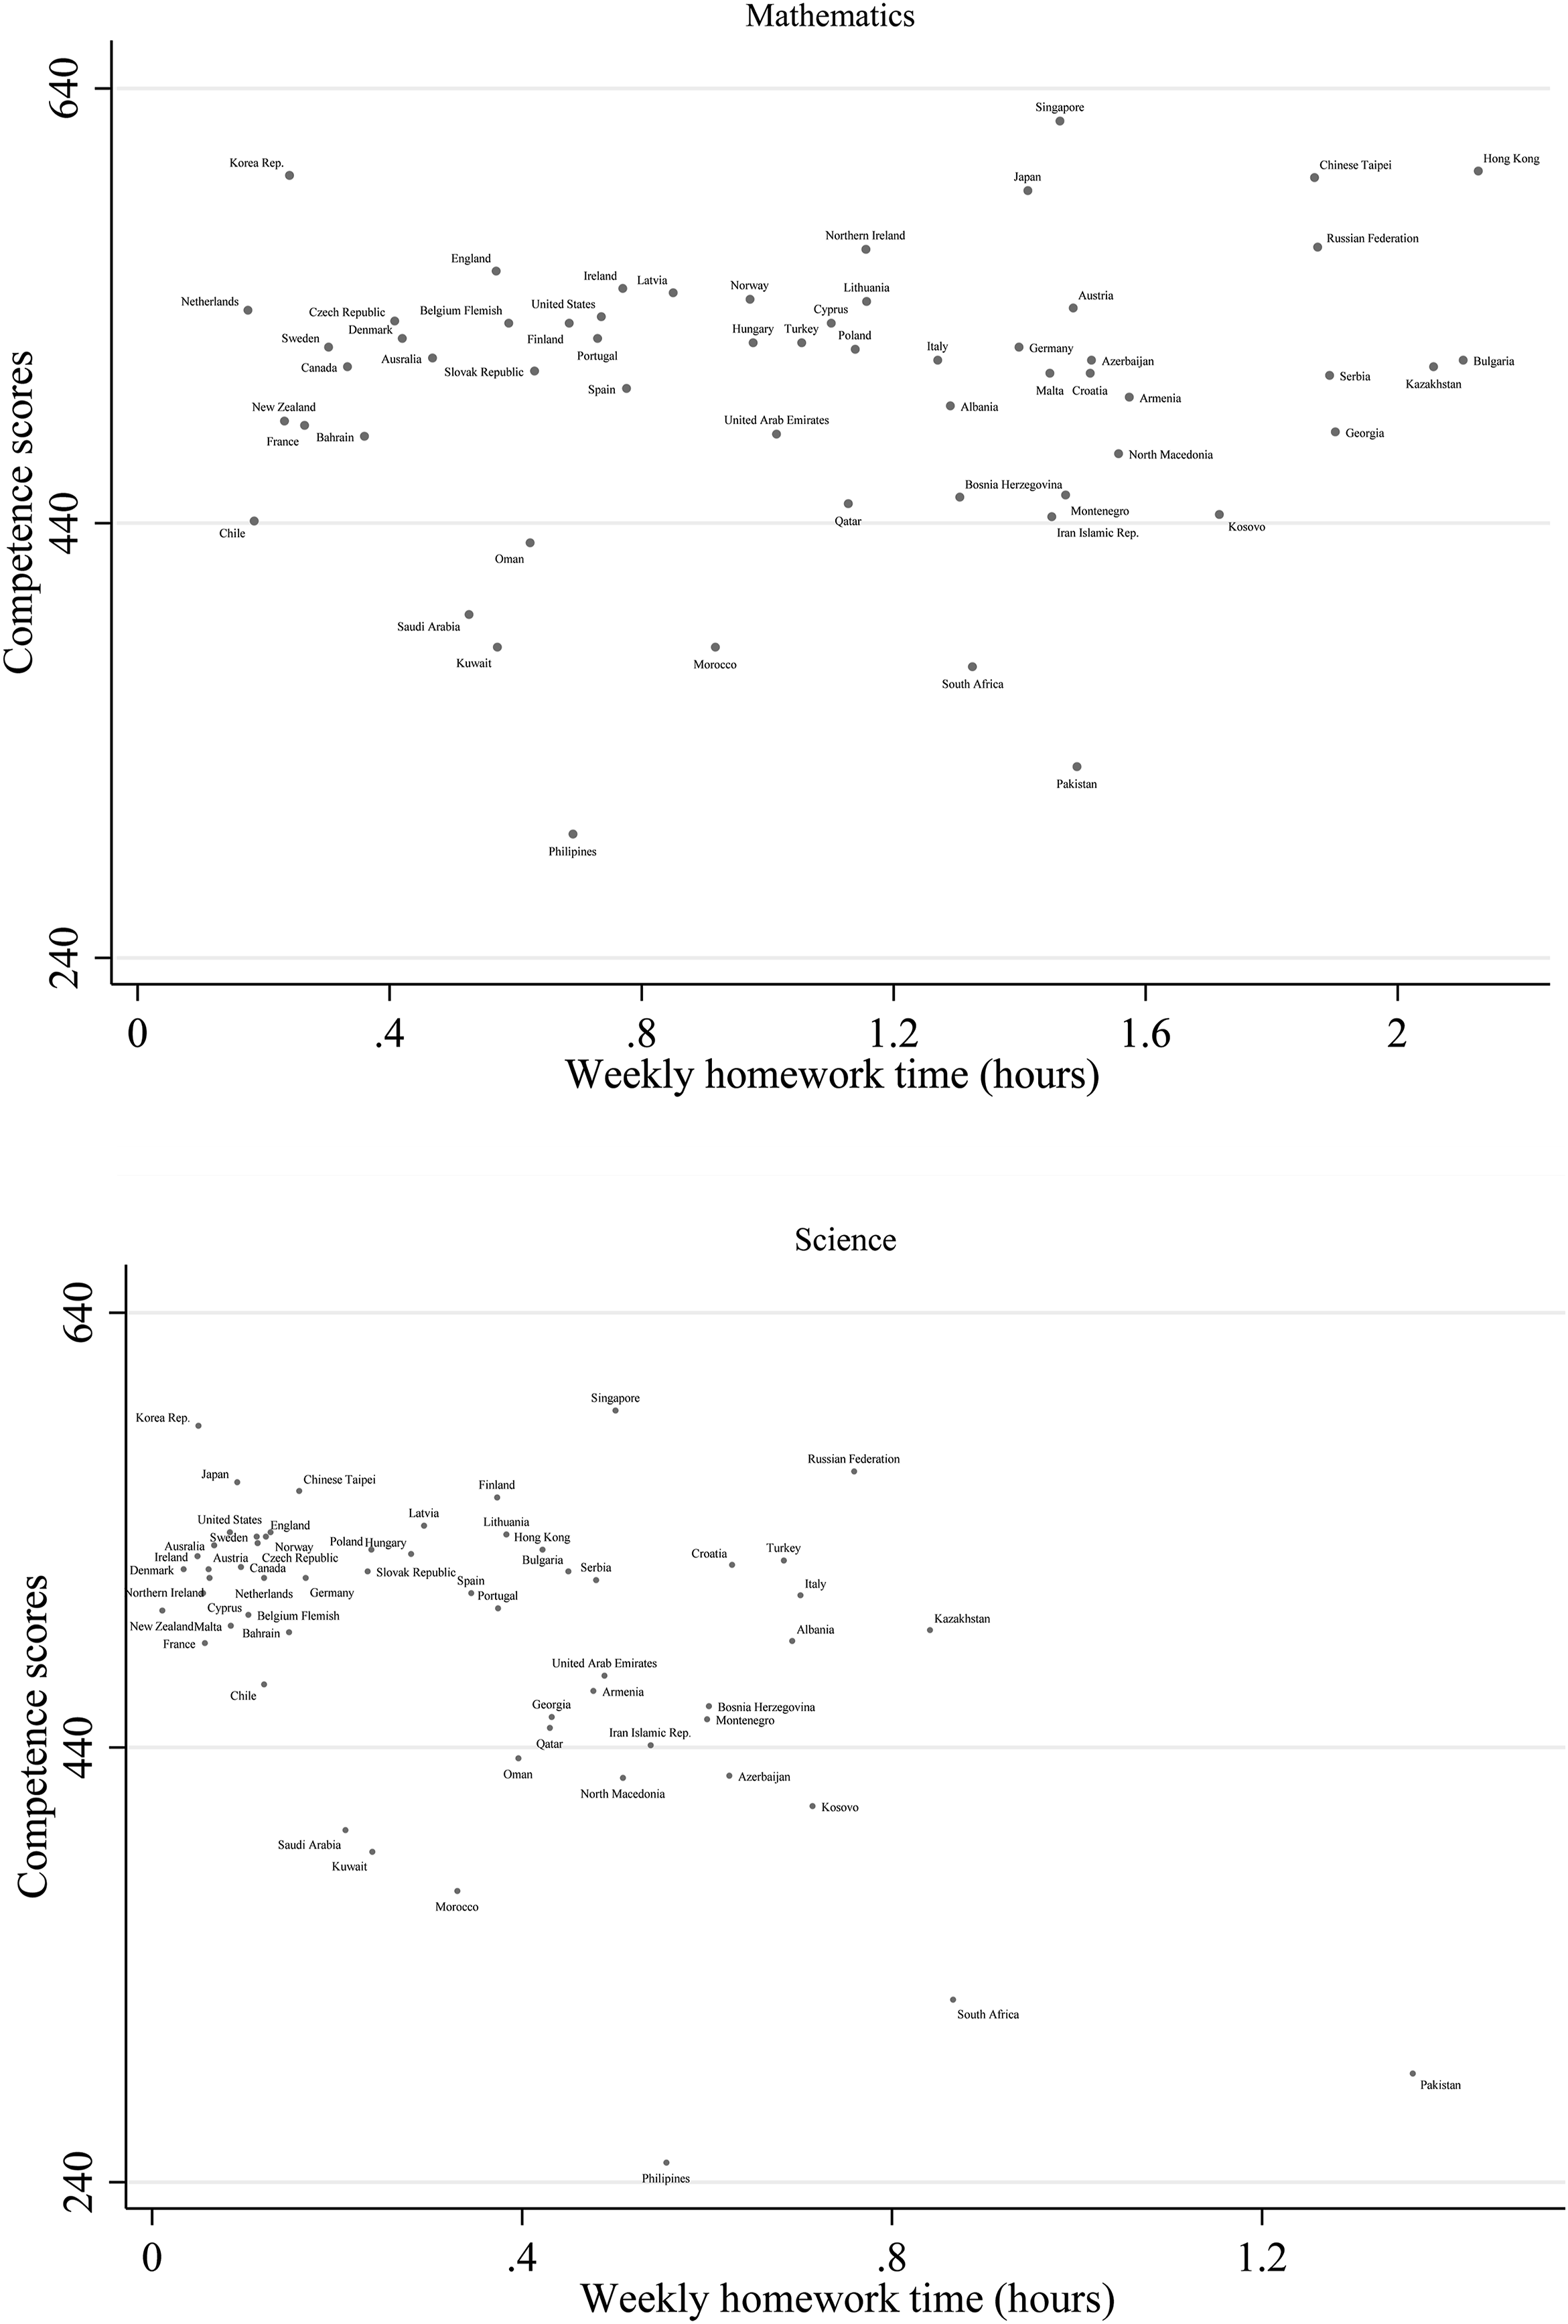
As can be seen, there are some countries in which the amount of weekly instruction time is low but the competence scores are high (e.g. Korea in mathematics and science), and others in which this weekly instruction time is high but the competence scores are low (e.g. Portugal in mathematics and Philippines in science). The same applies to weekly homework time, with cases in which weekly homework time is low but competence scores are high (e.g. Korea in mathematics and science) and others in which this weekly homework time is high but the competence scores are low (e.g. Kazakhstan in mathematics and Pakistan in science).
In addition, correlations between competence scores and – alternatively – instruction and homework times can be found in Table A1 (Appendix) for both separate subjects (i.e. mathematics and science). As can be seen, there are many significant correlations, ranging from positive and negative signs, with varying intensities. Although these results are indicative, further analyses using student fixed-effects are needed in order to go beyond them, as described in the Methodology section.
Moreover, a test of mean differences in socio-economic characteristics between the included sample and the one with missing information (i.e. those students whose teachers do not provide information about weekly instruction or homework time) has been performed. The results of these tests are presented in Table S1 (Online Supplemental Material) and it seems that there is no selection bias, to the extent that most differences between missing and no missing information are not significant. In addition, as we will see, the estimation methodology employed – i.e. student fixed-effects – would allow us to control by all the variables that are similar within-student between-subjects, hence reducing the influence of these differences in our results.
Main Results
The Influence of Instruction and Homework Time, Base Model
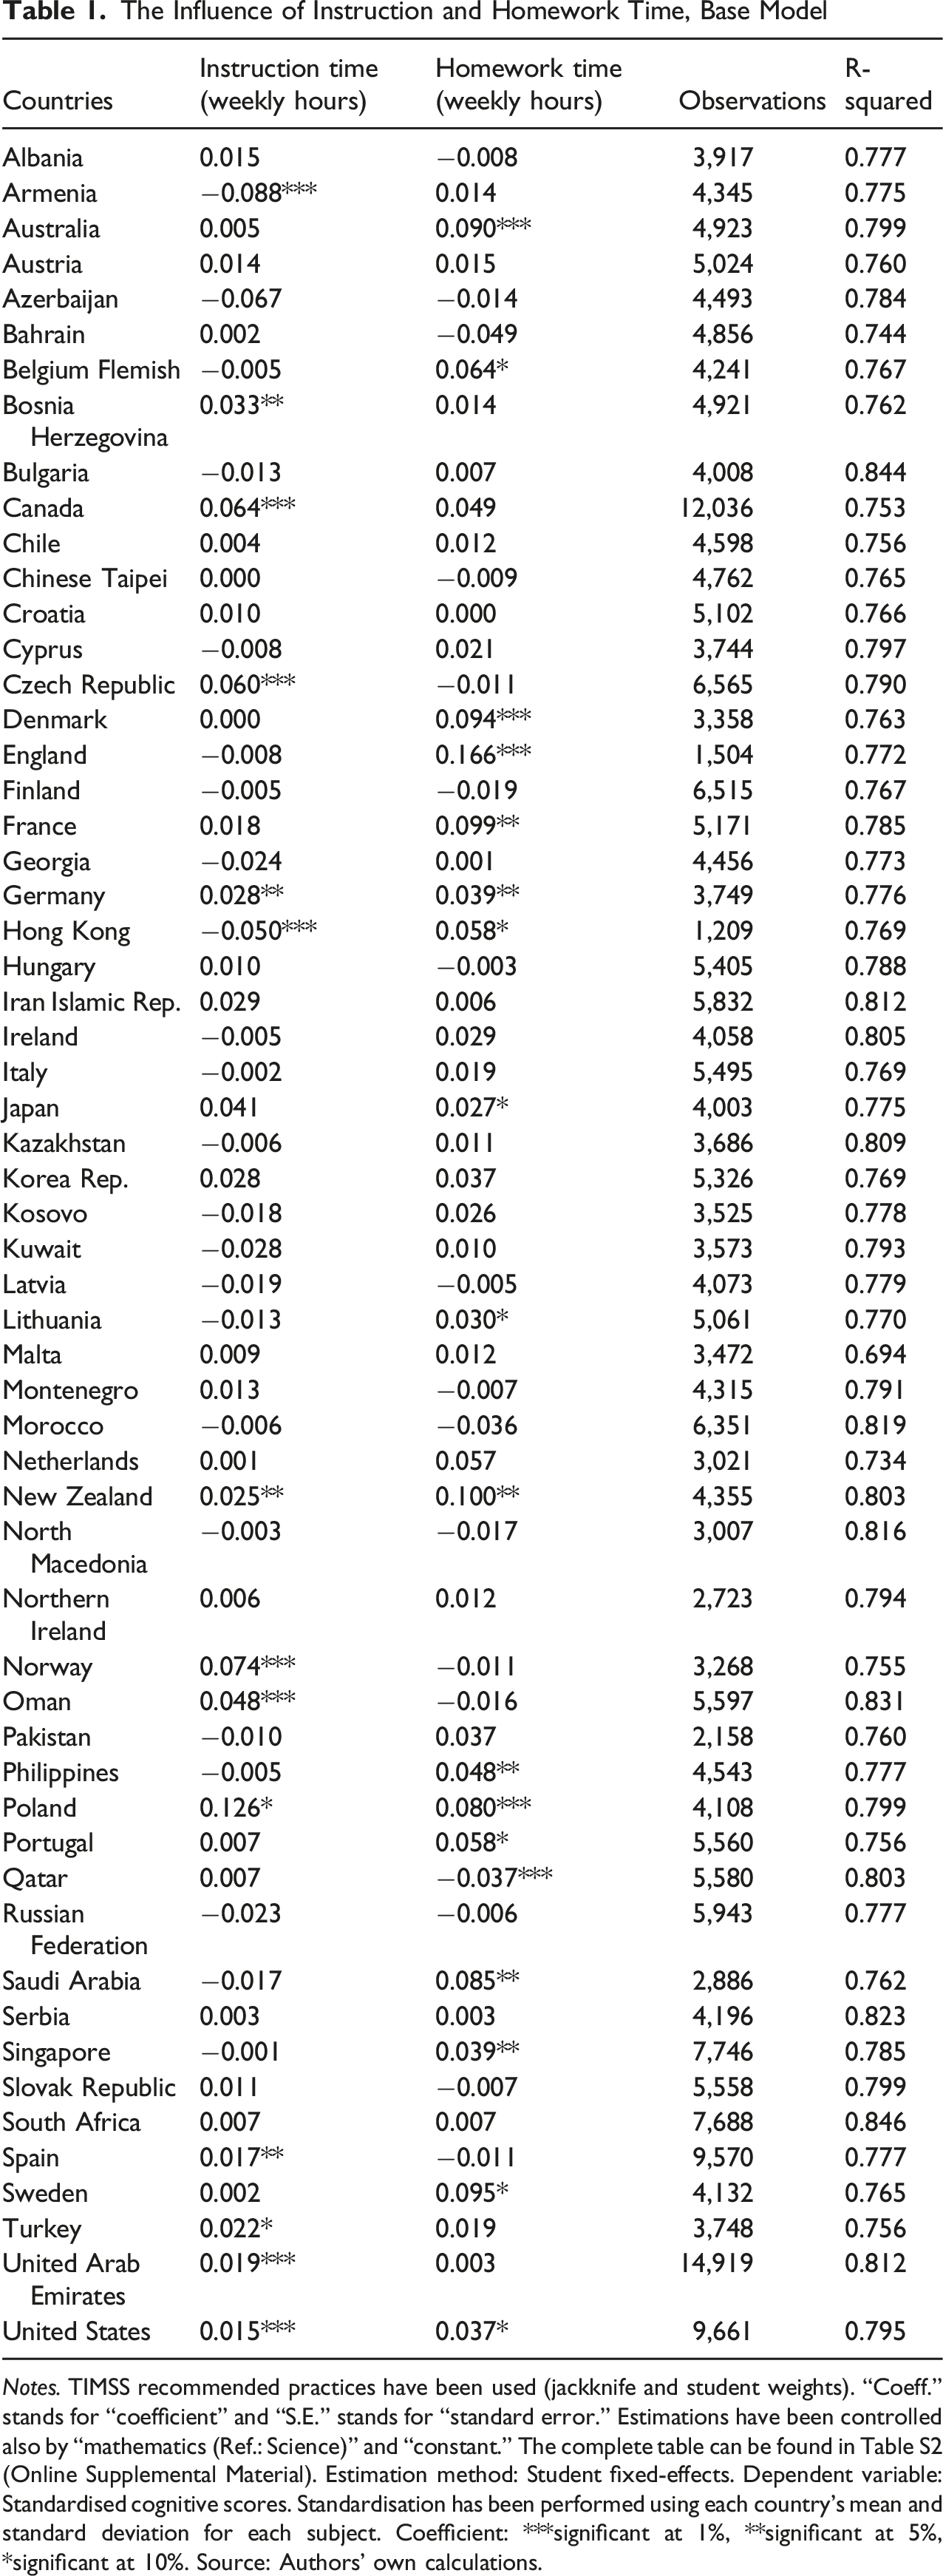
Notes. TIMSS recommended practices have been used (jackknife and student weights). “Coeff.” stands for “coefficient” and “S.E.” stands for “standard error.” Estimations have been controlled also by “mathematics (Ref.: Science)” and “constant.” The complete table can be found in Table S2 (Online Supplemental Material). Estimation method: Student fixed-effects. Dependent variable: Standardised cognitive scores. Standardisation has been performed using each country’s mean and standard deviation for each subject. Coefficient: ***significant at 1%, **significant at 5%, *significant at 10%. Source: Authors’ own calculations.
Regarding weekly homework time, it seems that most countries also present a non-significant influence of one additional hour (40 countries, more than two-thirds of the total of countries), while countries such as Australia, Belgium Flemish, Denmark, England, France, Germany, Hong Kong, Japan, Lithuania, New Zealand, Philippines, Poland, Portugal, Saudi Arabia, Singapore, Sweden and the United States present a low positive influence. However, for Qatar, one additional hour of weekly homework time presents a low negative influence. As can be seen, and as expected, results differ from the pure correlations that were previously presented in Table A1 (Appendix).
Some patterns can be found in the results according to continent and regions: Oceania and North American countries show an almost positive influence of one additional hour of both instruction and homework times. The countries in the sample from Africa, South America and Russian Federation present a non-significant influence for both types of time. The evidence found for European countries is mixed, oscillating between positive and non-significant influences, with many countries presenting a positive influence of one additional hour of homework time in Western Europe. Regarding Asia, the evidence is also mixed, and negative coefficients can even be found for instruction time in Armenia, Hong Kong and Qatar for homework time. 12
The effect size shown by the instruction time coefficient ranges from −0.088 (Armenia) to 0.126 SDs (Poland), whereas the homework time coefficient ranges from −0.037 (Qatar) to 0.166 SDs (England). According to IEA, about 0.35 to 0.4 SDs indicates a complete grade difference in terms of competences, showing that in the most extreme cases students could present one-third of a grade difference.
The Influence of Instruction and Homework Time, Controlling by Confidence in the Subject Index
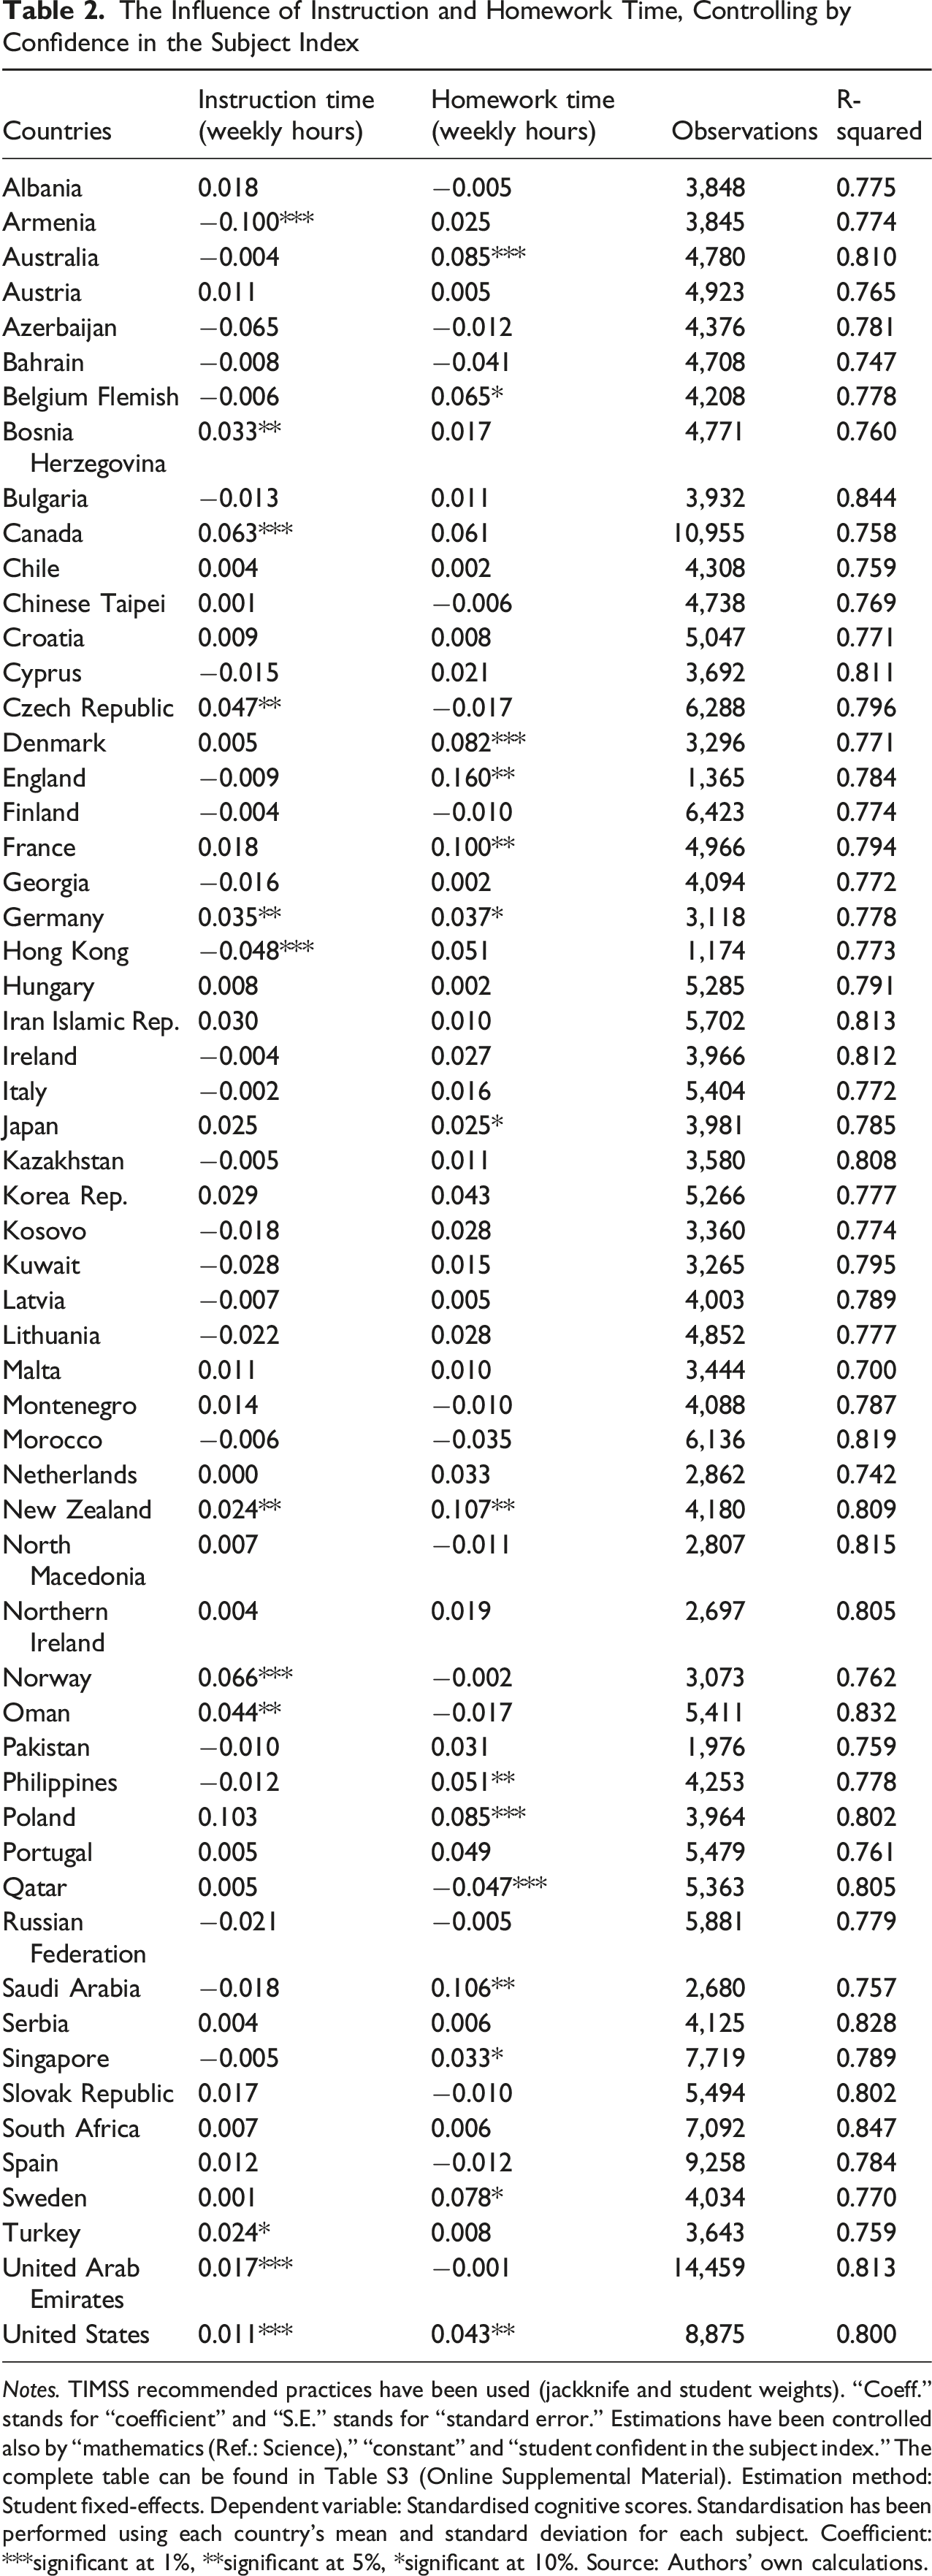
Notes. TIMSS recommended practices have been used (jackknife and student weights). “Coeff.” stands for “coefficient” and “S.E.” stands for “standard error.” Estimations have been controlled also by “mathematics (Ref.: Science),” “constant” and “student confident in the subject index.” The complete table can be found in Table S3 (Online Supplemental Material). Estimation method: Student fixed-effects. Dependent variable: Standardised cognitive scores. Standardisation has been performed using each country’s mean and standard deviation for each subject. Coefficient: ***significant at 1%, **significant at 5%, *significant at 10%. Source: Authors’ own calculations.
The Influence of Instruction and Homework Time, Controlling by Student Likes Learning Index
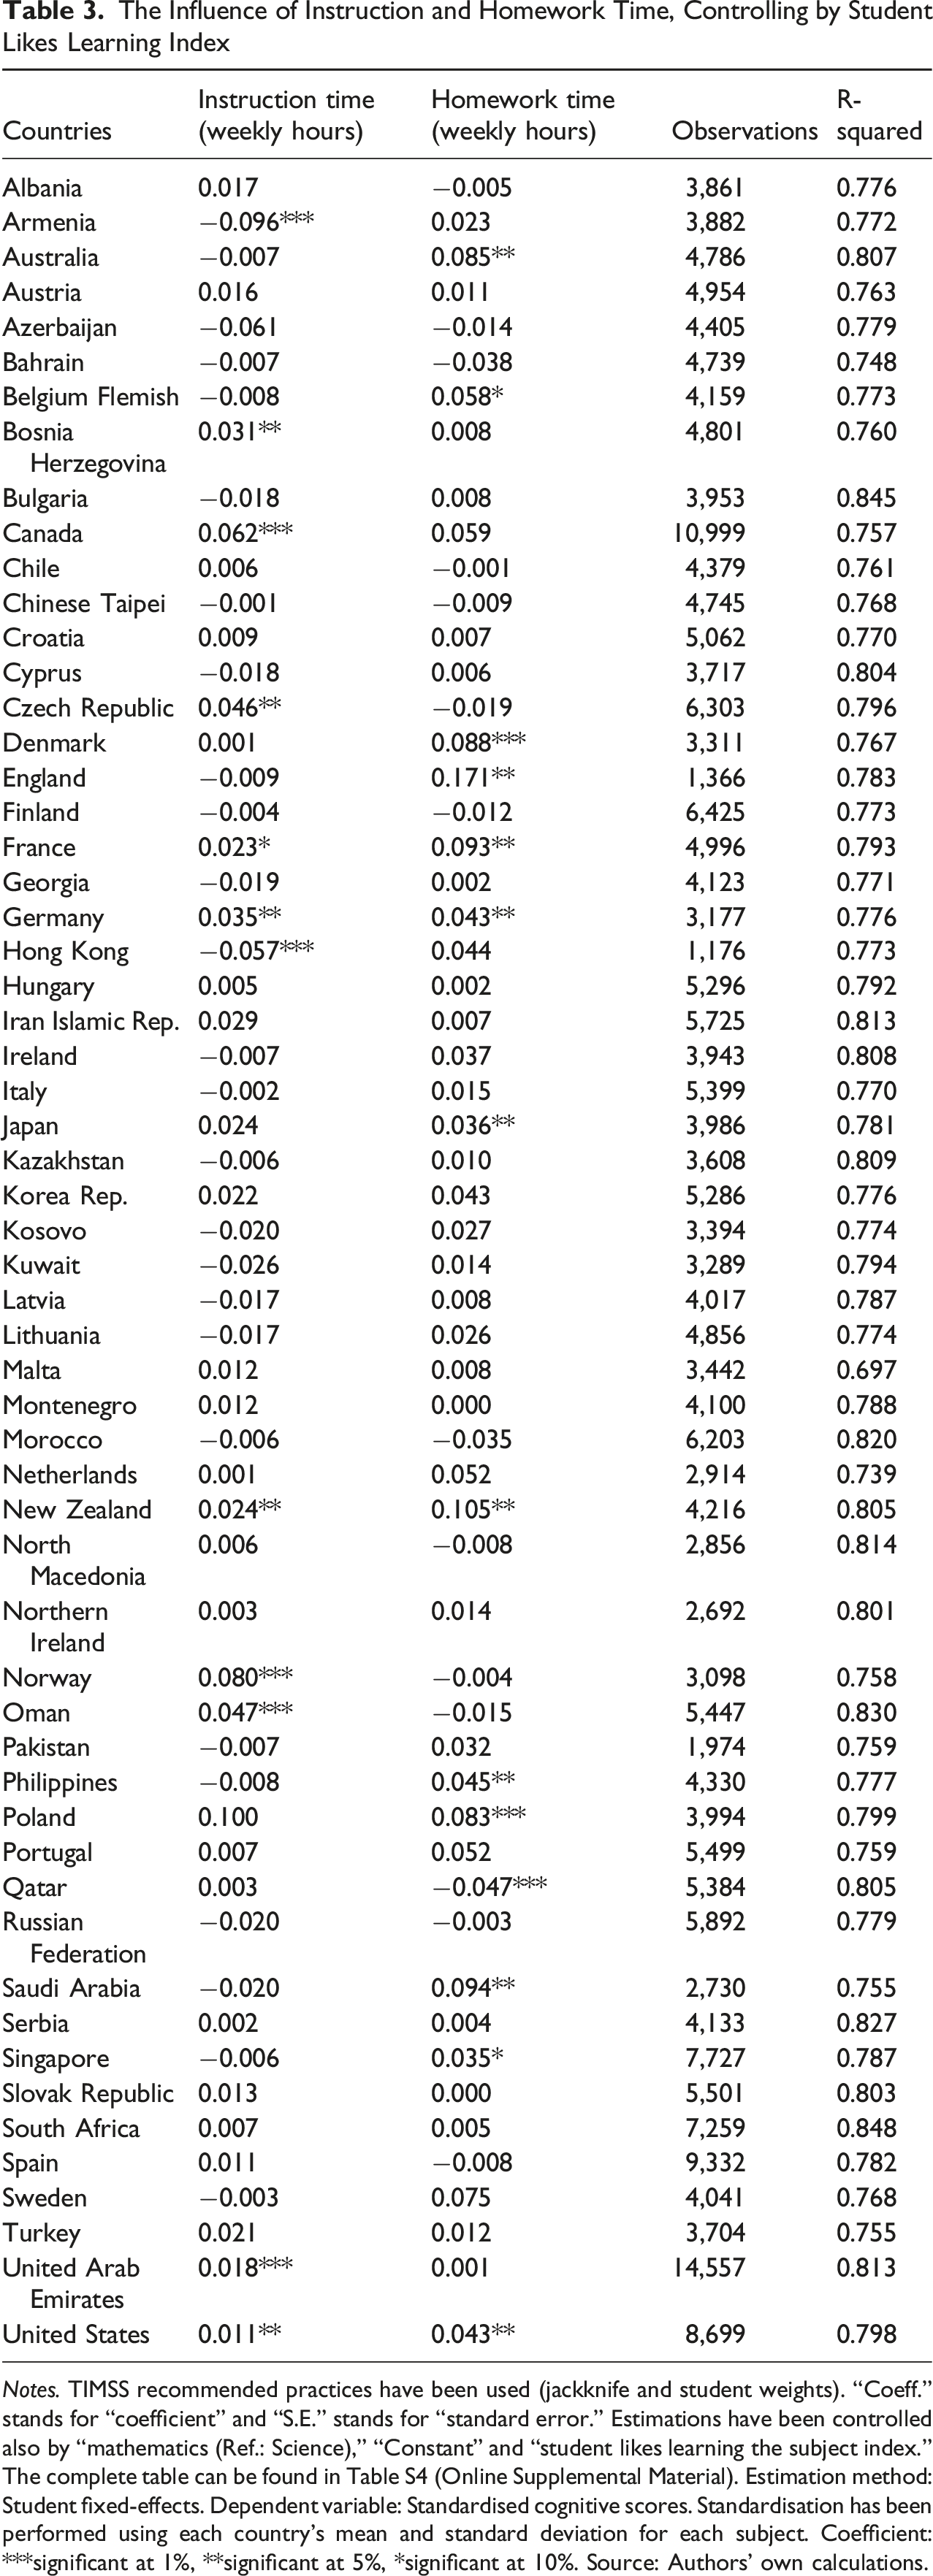
Notes. TIMSS recommended practices have been used (jackknife and student weights). “Coeff.” stands for “coefficient” and “S.E.” stands for “standard error.” Estimations have been controlled also by “mathematics (Ref.: Science),” “Constant” and “student likes learning the subject index.” The complete table can be found in Table S4 (Online Supplemental Material). Estimation method: Student fixed-effects. Dependent variable: Standardised cognitive scores. Standardisation has been performed using each country’s mean and standard deviation for each subject. Coefficient: ***significant at 1%, **significant at 5%, *significant at 10%. Source: Authors’ own calculations.
Discussion
In the present study the relationship of one additional hour of weekly instruction and homework time with students’ competences has been analysed for fourth grade students in 58 countries. In particular: (a) We went beyond correlation by using student fixed-effects within-students between-subjects to analyse this influence. (b) We explored this issue for 58 countries, which enhances the external validity of our results. (c) Alternative cognitive scores were created using students’ actual responses and were used instead of TIMSS imputed scores, which allows obtaining more precise results (Jerrim et al., 2017).
With this approach, we intend to overcome the limitations of the existing empirical studies described by Kohn (2006), as the fact that most existing evidence was purely correlational. We have found that in most of the countries, one additional hour of weekly instruction and homework time do not have an influence on students’ competences, 13 although there are some countries in which they present a low but positive influence. 14 In particular, Oceania and North American countries show an almost positive influence of one additional hour of instruction and homework time, whereas countries in Africa, South America and Russian Federation present a non-significant influence for both times. The evidence found for Asian countries is mixed (positive, negative and non-significant influences), as it is for European countries (positive and non-significant influences), Western Europe presenting more positive influences of one additional hour of homework time. These results may explain why previous research studies could present differences on this influence (as found by authors such as e.g. Dettmers et al., 2009), as their results might be conditioned on the region and education system of the country under analysis. As indicated by authors such as Gromada and Shewbridge (2016), non-significant and negative results may imply higher monetary costs of education and higher time costs, 15 which may translate into a waste of resources. In this context, these differences could be considered enough to trigger education policy measures in many countries.
Implications
First, it is important to highlight that TIMSS measures students’ skills or competences (like other international large-scale assessment tests such as PISA), which are related to the abilities that students use in their daily life. However, this means that these measures are not related to content-based knowledge, which refers to memorisation or to mechanical tasks (as indicated by authors such as Ananiadou & Claro, 2009; INEM, 2009; Kohn, 2006; Pamies et al., 2015). Therefore, although the TIMSS data do not allow us to determine the causes of the non-significant influence, it seems that one additional hour of weekly instruction time received by students in most countries may not improve their competences. This may suggest the need of re-orienting school instruction in some countries into a competence-oriented approach, so students can improve their skills. To the extent that there are regions in which the influence of one additional hour of instruction time is positive, a potential approach could be the analysis of the curriculum that is being applied in the education systems that present this influence. In this sense, according to the OECD (2025), a competency-based curriculum should integrate knowledge, skills, attitudes and values. It is also concept-driven, skill-oriented and rooted in real-world experience and relevance, ensuring that subject knowledge is not static, but that it fosters human capacities to solve complex problems. For instance, the OECD Learning Compass 2030 (OECD, 2019) could be a useful guide to implement this competence-oriented curriculum, which highlights that such conversion may require teachers to be open to changes, their adequate preparation and formation (OECD, 2020). Therefore, this may entail a change in students’ curriculum and also in teacher training, enabling the latter to learn how to design their lessons to improve students’ skills.
Regarding weekly homework time, a non-significant influence of one additional hour has been mostly found, which may support the vision that students are receiving a high amount of homework that does not contribute to improve their skills. Therefore, competence-oriented homework should be fostered, taking as an example those countries that present a positive influence, which can be found in Oceania, North America and Occidental Europe. Thus, for those countries in which one additional hour of homework does not help to improve students’ skills, it should be reduced until a positive influence is achieved to ensure that they can have more out-of-school time to devote to developing other competences in extra-activities. In this sense, as indicated by Cosden et al. (2004, p. 220), it is necessary to “balance homework with other aspects of the child’s home life to promote positive developmental outcomes”.
Limitations
The present research study has some limitations: first, weekly instruction and homework times are reported by the teacher, so they might be subject to report or measurement error, due to difficulties in remembering or differences with the actual time that students take to do their homework. Second, there may be some unobservables which cannot be controlled by the student fixed-effects methodology (e.g. students’ actual ability in each subject), causing an omitted variables bias. Although confidence and enjoyment indexes have been controlled for and used as proxies of students’ ability, there are still many unobservables regarding student ability that must be controlled for. For that reason, we are cautious when interpreting our results as causal ones, and instead interpret them as correlations. Third, these results are only applicable to fourth grade students, so students from other grades should be analysed in order to evaluate potential differences. Fourth, the analysis is based on a sample and not on a census, so they are subject to sampling errors.
Future Directions
Thus, based on these limitations, future research work could explore whether teacher, parental or student reports of instruction and homework times present differences in their influences on students’ scores. In addition, the use of these measures may help find potential report biases in them. Furthermore, the use of student ability measures (such as e.g. IQ tests and, if possible, by cognitive area) may help remove potential biases that could be due to the omission of this control variable on the influence of one additional hour of instruction and homework times. In addition, besides the student fixed-effects models, other quasi-experimental methodologies could be explored, such as e.g. longitudinal analyses. Moreover, future research could delve deeper into the particular mechanisms of each education system that condition the mixed results that are found. Finally, potential heterogeneous effects by grade could be explored by using information from different grades (in particular eighth grade, which is available for TIMSS data) and, if possible, from census data.
Conclusion
This research study has explored the relationship of one additional hour of weekly instruction and homework time with students’ competences for fourth grade students in 58 countries. As previously hypothesised, it was found that one additional hour of these school and out-of-school learning times do not have an influence on students’ competences in most of the countries under analysis. This may suggest the need of re-orienting school instruction and homework times following the education curriculum model of those countries in which the influence is positive, so students can improve their skills.
Supplemental Material
Supplemental material - The Relationship Between Weekly Instruction, Homework Time and Students’ Competences
Supplemental material for The Relationship Between Weekly Instruction, Homework Time and Students’ Competences by Luis Alejandro Lopez-Agudo and Oscar David Marcenaro-Gutierrez in The Journal of Early Adolescence
Footnotes
Appendix
Correlation Between Mathematics and Science Scores With Instruction and Homework time Notes. TIMSS recommended practices have been used (Jackknife and student weights). Column “mathematics” indicates correlations with mathematics’ competence scores, whereas “science” indicates correlations with science’ competence scores. Coefficient: Correlation ***significant at 1%, **significant at 5%, *significant at 10%. Source: authors’ own calculations.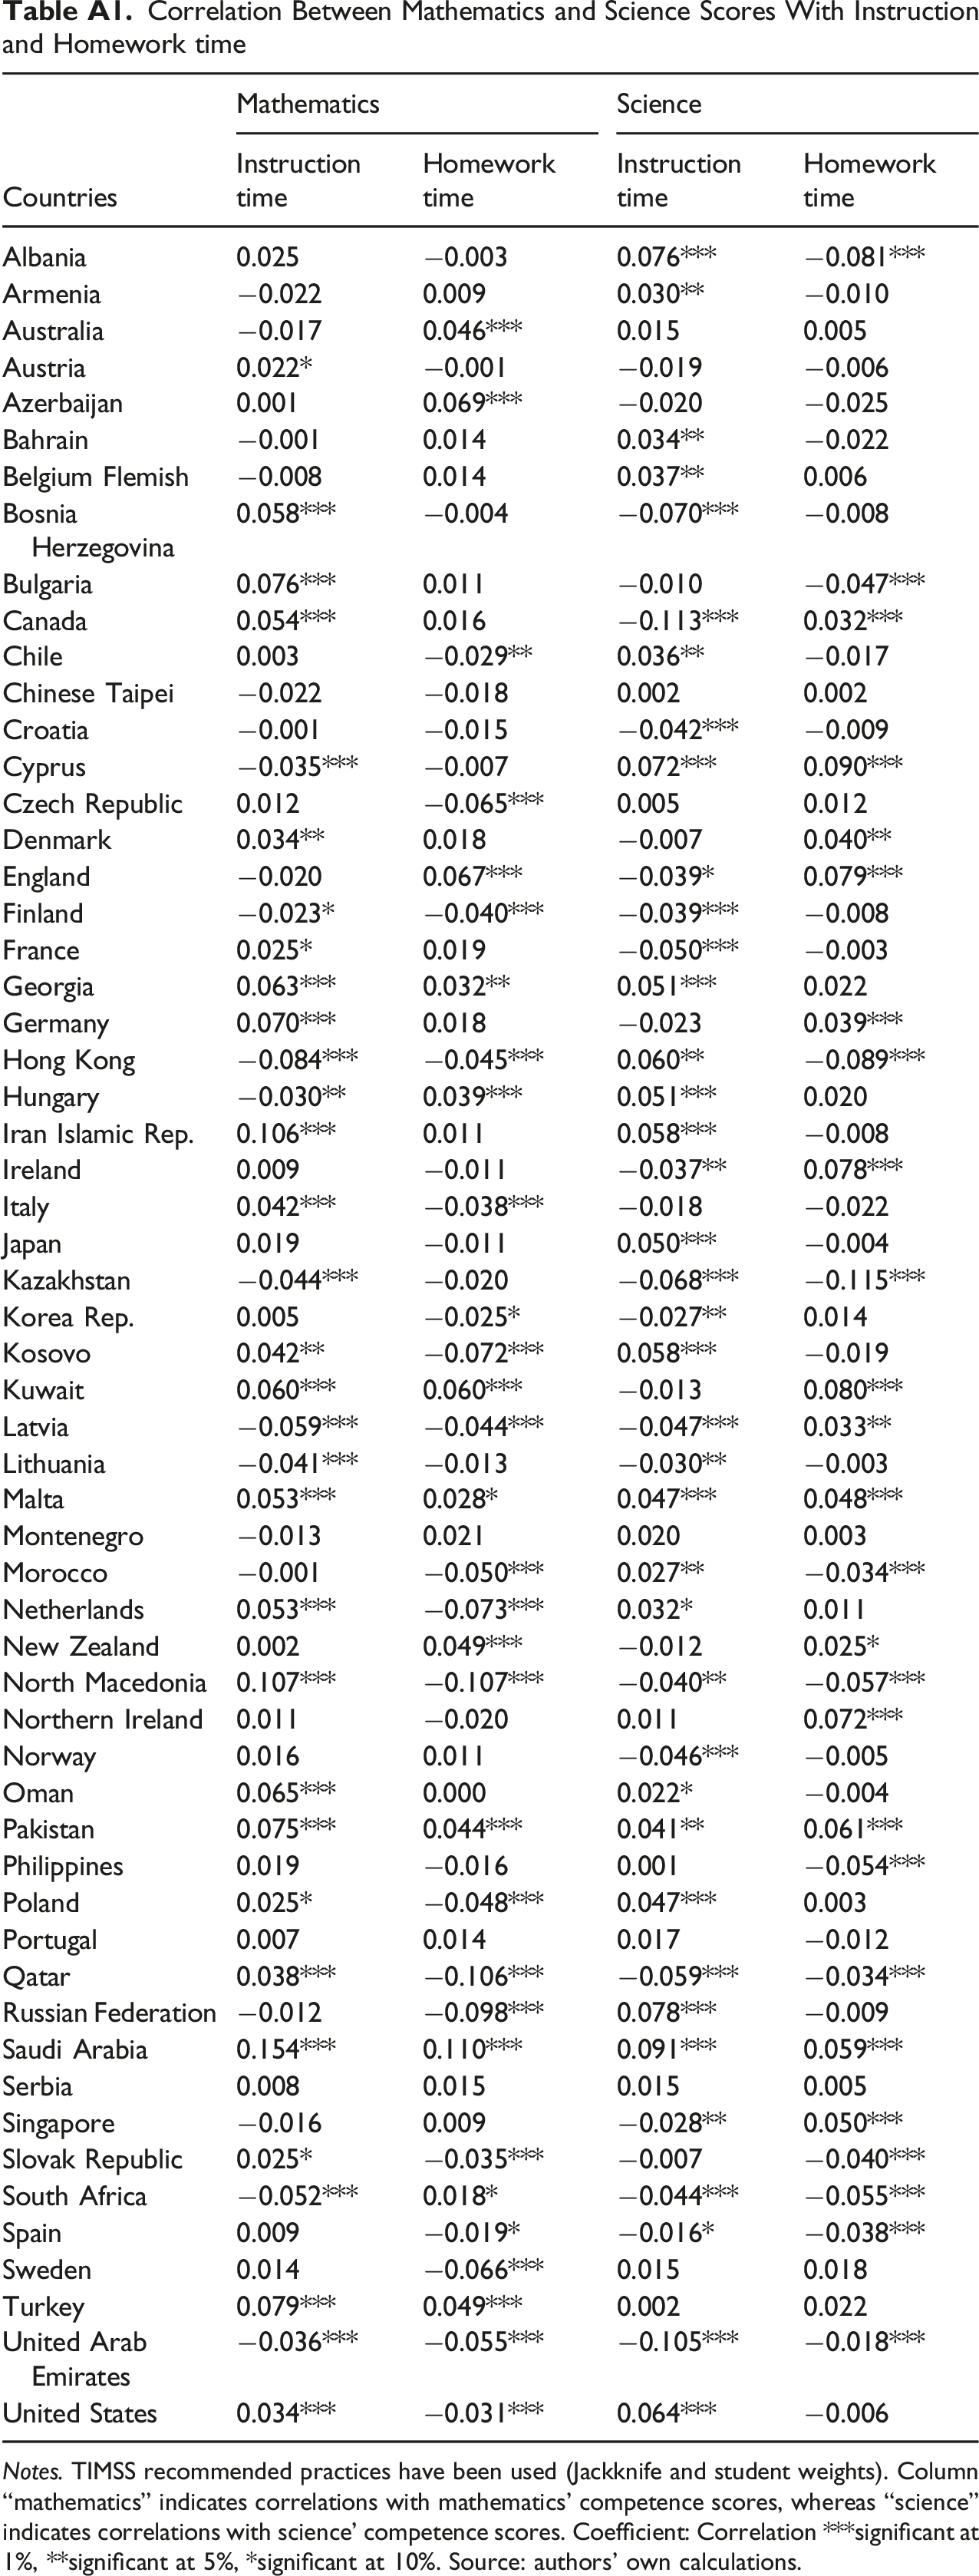
Countries
Mathematics
Science
Instruction time
Homework time
Instruction time
Homework time
Albania
0.025
−0.003
0.076***
−0.081***
Armenia
−0.022
0.009
0.030**
−0.010
Australia
−0.017
0.046***
0.015
0.005
Austria
0.022*
−0.001
−0.019
−0.006
Azerbaijan
0.001
0.069***
−0.020
−0.025
Bahrain
−0.001
0.014
0.034**
−0.022
Belgium Flemish
−0.008
0.014
0.037**
0.006
Bosnia Herzegovina
0.058***
−0.004
−0.070***
−0.008
Bulgaria
0.076***
0.011
−0.010
−0.047***
Canada
0.054***
0.016
−0.113***
0.032***
Chile
0.003
−0.029**
0.036**
−0.017
Chinese Taipei
−0.022
−0.018
0.002
0.002
Croatia
−0.001
−0.015
−0.042***
−0.009
Cyprus
−0.035***
−0.007
0.072***
0.090***
Czech Republic
0.012
−0.065***
0.005
0.012
Denmark
0.034**
0.018
−0.007
0.040**
England
−0.020
0.067***
−0.039*
0.079***
Finland
−0.023*
−0.040***
−0.039***
−0.008
France
0.025*
0.019
−0.050***
−0.003
Georgia
0.063***
0.032**
0.051***
0.022
Germany
0.070***
0.018
−0.023
0.039***
Hong Kong
−0.084***
−0.045***
0.060**
−0.089***
Hungary
−0.030**
0.039***
0.051***
0.020
Iran Islamic Rep.
0.106***
0.011
0.058***
−0.008
Ireland
0.009
−0.011
−0.037**
0.078***
Italy
0.042***
−0.038***
−0.018
−0.022
Japan
0.019
−0.011
0.050***
−0.004
Kazakhstan
−0.044***
−0.020
−0.068***
−0.115***
Korea Rep.
0.005
−0.025*
−0.027**
0.014
Kosovo
0.042**
−0.072***
0.058***
−0.019
Kuwait
0.060***
0.060***
−0.013
0.080***
Latvia
−0.059***
−0.044***
−0.047***
0.033**
Lithuania
−0.041***
−0.013
−0.030**
−0.003
Malta
0.053***
0.028*
0.047***
0.048***
Montenegro
−0.013
0.021
0.020
0.003
Morocco
−0.001
−0.050***
0.027**
−0.034***
Netherlands
0.053***
−0.073***
0.032*
0.011
New Zealand
0.002
0.049***
−0.012
0.025*
North Macedonia
0.107***
−0.107***
−0.040**
−0.057***
Northern Ireland
0.011
−0.020
0.011
0.072***
Norway
0.016
0.011
−0.046***
−0.005
Oman
0.065***
0.000
0.022*
−0.004
Pakistan
0.075***
0.044***
0.041**
0.061***
Philippines
0.019
−0.016
0.001
−0.054***
Poland
0.025*
−0.048***
0.047***
0.003
Portugal
0.007
0.014
0.017
−0.012
Qatar
0.038***
−0.106***
−0.059***
−0.034***
Russian Federation
−0.012
−0.098***
0.078***
−0.009
Saudi Arabia
0.154***
0.110***
0.091***
0.059***
Serbia
0.008
0.015
0.015
0.005
Singapore
−0.016
0.009
−0.028**
0.050***
Slovak Republic
0.025*
−0.035***
−0.007
−0.040***
South Africa
−0.052***
0.018*
−0.044***
−0.055***
Spain
0.009
−0.019*
−0.016*
−0.038***
Sweden
0.014
−0.066***
0.015
0.018
Turkey
0.079***
0.049***
0.002
0.022
United Arab Emirates
−0.036***
−0.055***
−0.105***
−0.018***
United States
0.034***
−0.031***
0.064***
−0.006
Funding
The authors disclosed receipt of the following financial support for the research, authorship, and/or publication of this article: This work has been partly supported by Fundación Bancaria BBVA - Programa Prismas y Problemas 2023 - (“La inequidad socioeconómica derivada de la ineficiencia de los sistemas educativos (INESOCEF)”), by the Fundación Ramón Areces and by the Andalusian Regional Government (SEJ-645-FEDER).
Declaration of Conflicting Interests
The authors declared no potential conflicts of interest with respect to the research, authorship, and/or publication of this article.
Educational Relevance Statement
This research explores the effectiveness of one additional hour of the instruction students receive and of the time they devote to homework, finding a non-significant influence on students’ competences in most of the countries under analysis, while some other countries present a low positive influence. These results show that a more competence-oriented focus may be needed in some education systems.
Supplemental Material
Supplemental material for this article is available online.
Notes
Author Biographies
References
Supplementary Material
Please find the following supplemental material available below.
For Open Access articles published under a Creative Commons License, all supplemental material carries the same license as the article it is associated with.
For non-Open Access articles published, all supplemental material carries a non-exclusive license, and permission requests for re-use of supplemental material or any part of supplemental material shall be sent directly to the copyright owner as specified in the copyright notice associated with the article.