
Abstract
The value of hypothetical health states defined by formal descriptive classification systems such as the Quality of Well-Being (QWB) scale,1,2 SF-6D,3,4 and EQ-5D5,6 is generally unknown, and the task of eliciting value estimates is correspondingly daunting in scale. Many studies have been conducted to obtain values for selected subsets of such health states, sometimes being designed to investigate the choice of elicitation methods or the type of respondent. While it is generally accepted that the choice of elicitation method has a bearing on the type of values generated, other aspects of valuation study design are less well understood, and the size and composition of health states used in valuation studies are rarely examined.
Among existing health status measures, there is great variability in terms of their valuation study designs. For instance, the value set for the SF-6D was based on values modeled from 249 of 18,000 health states (1.4% of the full set of possible health states defined by the system). 4 Each health state selected was valued by around 15 participants. For the EQ-5D, 43 of 243 health states (17.70%) were valued, and each health state selected was valued by around 800 participants in the United Kingdom (UK). 7 For the QWB, the number of health states investigated was 42 of 945 states (4.4%), and 866 participants were asked to value those states. 8 Given this degree of variability, there emerges as yet unresolved issues: is there an optimal number of directly valued health states required in any valuation study, and how many observations are needed for each health state?
For the EQ-5D, the Measurement and Valuation of Health (MVH) project in 1993 investigated 43 EQ-5D health states, selected by a factorial design, plus state death and unconscious (the MVH set), and this has been the de facto standard over the last decade as seen in several studies.9-12 However, the number of health states and sample size involved in the MVH study have been a concern. Several studies have tried to reduce the number of health states required for developing a reliable value set,11,13-15 but all of these have taken a subset of those health states that were selected in the MVH study.
One of the current trends in valuation studies for developing country-specific value sets for EQ-5D is to increase the number of health states that are valued directly in order to reduce the number of health states for which values must be imputed. This is useful as there are many assumptions that underlie the imputation methods used for generating health state values. Several valuation studies are underway in which a larger number of health states are being valued, for example, Singapore and South Korea, each valuing more than 43 health states. While it might be ideal to expand the number of health states that are valued directly, doing so might not always be feasible due to resource constraints and limited time. The same issue applies to sample size per state. The bigger the sample size, the more robust the value becomes, but again, it is not always possible to increase the sample size. Thus, the question remains: what is the optimal number of health states to value directly and the number of observations per health state if enlarging the study scale is not feasible? In addition to these 2 principal design variables, there remains a further consideration that is concerned with the choice of health states themselves.
The current study conducts an empirical investigation on the impact of the selection of a set of EQ-5D health states in generating a visual analog scale (VAS)–based value set. There are 3 main aims: first, to investigate the optimal number of health states; second, to investigate the sample size per health state required; and third, to investigate which combination of health states is required to establish a EQ-5D VAS value set.
Methods
Data
Different from previous studies with the restriction to the MVH set,11,13-15 a unique dataset offers the current study the opportunity to re-examine the above issues based on all of the 243 health states defined by the EQ-5D descriptive system. The data were drawn from a UK general population postal survey in 2003 in which values for all EQ-5D health states have been collected using VAS (known as the saturation study). 16 So far, it is the only dataset available containing such EQ-5D valuation information from a general population.
The saturation study was designed for multiple purposes, including testing the feasibility of eliciting all EQ-5D health states, examining the stability of values across time, testing the effect of prior experience on the valuation task, and studying the effects of the choice of health states on the results of modeling procedures. 16 This paper is mainly concerned with addressing the last objective.
In the saturation study, all 243 EQ-5D health states were distributed into 21 different questionnaires through a factorial block design, and each version contained a sample of 12 EQ-5D health states, plus both states 11111 and 33333. The presentation of health states in a questionnaire was similar to the design of the EQ-5D standard valuation questionnaire in that there were 8 health states in each of 2 separate pages. In the middle of each page, there was a 20-cm thermometer-like VAS and 4 boxes listed on each side, which contained the description of each health state. In total, 16 values were obtained per questionnaire; states 11111 and 33333 were repeated in each page and were thus measured twice along with 12 other measure once–only health states. However, one aspect in which the questionnaire differed from the standard form was that VAS technique was modified in the current study. Participants were asked to give a number to reflect their value rather than being asked to draw a line on the thermometer to indicate their value. While collecting participants’ values for health states, participants’ demographic variables were also recorded. The standard version of the EQ-5D valuation questionnaire was also included in the study.
A total of 1100 questionnaires were distributed by post to a sample of respondents selected from the electoral register of England and Wales. The data were collected during the second quarter of 2003, and 685 (62.2%) valid questionnaires were obtained out of 1100 questionnaires, which were sent to the general population. All values were collected through 21 versions of the questionnaire, and these were pooled into one analytic sample.
Analysis
Comparability of data
Different participants valued different subsets of health states, depending on the version of the questionnaire they received. It is not known whether the heterogeneity of respondents between versions might hamper the comparability of the health state valuations across versions. To test this, values for states 11111 and 33333 across versions were examined using ANOVA. A further 10 health states were also valued twice, and the mean values for each exposure were checked using a t test.
Optimal number of health states
A simulation approach was adopted in order to test the effect of varying the number of health states included in the estimation model. Fifteen subsets of EQ-5D health states were defined on the basis of their size, varying from 100% to 6% of the total 243 states. a For each subset, health states were selected at random with a total of 100 samples being drawn for each category. Note that for the category with 100% of health states, only one sample was possible. Random effects (RE) regression, an account of possible individual effects, was adopted to estimate values for all 243 health states using sample data for each subset in turn. The evaluation criterion used to assess the performance of each estimation model was the average value of the mean absolute errors (MAEs). The MAE was the average of the absolute difference between mean observed value and estimated values for all 243 states. Given the purpose of the study and the unknown “true” value of each health state, minimizing MAE might be the best pragmatic choice of criterion. The optimal category was defined as the category that minimized the size of MAE and, simultaneously, the number of health states used.
The number of participants valuing each health state was not evenly distributed. For instance, the number of values for health states 11111 and 33333 was greater than the number of values for other health states. Thus, for a given category, the number of values involved in each analytic sample varied depending on the health states that were selected. If state 11111 or 33333 was selected, for example, the number of values involved would simply outweigh other samples, which did not include either of these health states. To alleviate this effect, a separate simulation was conducted. The simulation was based on a modified dataset in which values for states 11111 and 33333 were limited to those of 100 randomly selected participants in the original dataset while keeping values for other health states intact. In other words, there were only 200 values for each state 11111 and 33333 in the modified dataset. Thus, in this modified dataset, the impact of an imbalance in the number of values for state 11111 or 33333 was greatly decreased.
Both simulations based on the original and modified datasets have the same model specification, 10 dummy variables representing 5 dimensions and 3 levels of the EQ-5D descriptive system. The model also included a constant term. For comparison purposes, the simulation based on the aggregate level data that consisted of mean observed score for each health state was also examined using ordinary least square (OLS) regression.
Sample size per state
A quasidataset with 1000 simulated observations per health state was also created. The simulations were based on the observed mean and standard deviation of each health state in the saturation study dataset, and normal distributions were assumed for each state. Values greater than 100 and less than 0 were truncated, anchored at 100 and 0, respectively. The assumption of normality adopted here was based on the observation from the MVH dataset in which each health state had around 800 values and in which VAS distributions, 37 of 43 health states, can be regarded as normal based on the skewness and kurtosis statistics. 17 To examine the effect of sample size per state, a sample size of 1000 respondents per state was initially used then, being reduced in successive iterations from 500 to 25. b A simultaneous consideration was the size of the subset of EQ-5D health states used, and this was varied as a percentage, with 25%, 18%, 12%, and 6% of health states being included. A total of 100 samples were randomly drawn from this quasidataset for each combination of percentage of states and the number of respondents per state. The performance of each combination was again judged in terms of the average MAE. Note that there was only one sample with 1000 observations for each state.
Combinations of health states
Once the optimal number of health states for valuation is identified (n opt < 243), the logical next issue becomes that of the choice of health states to populate that subset. Combination of n opt health states from 243 is potentially very large (C n 243); for example, the minimum combination of 2 health states of 243 would be 29,603. To avoid testing an excessively large number of possible combinations, an alternative method was pursued. First, the health states were ranked according to the UK MVH VAS-based value set 18 from high to low. Second, health states were selected using a modulus approach with states being separated by a given gap; for instance, using 8, this would select 1st, 9th, 17th … until a total of n opt health states were reached. If an insufficient number of health states were collected after going through all the 243 health states in the first round, the selection would continue in a second round and so on until the target number is met. Different values of the modulus are tested. The reason for choosing the UK MVH VAS-based value set to rank the health states was that it was the only available VAS-based value set that was derived from a representative sample of the UK general population. All modulus subsets were used to estimate values for the full set of 243 EQ-5D health states. The values were compared to those obtained when the choice of health states was constrained using 3 other study designs, namely the MVH, Macran and Kind (M&K), 14 and the standard EuroQoL postal questionnaire. 19 The latter set consists of 13 EQ-5D health states including both states 11111 and 33333, while the M&K set contains 17 EQ-5D health states including state 33333 only. To make the sets more comparable, state 11111 was included (here referred to as M&K with 11111). All analyses were performed using STATA 9 software (StataCorp, College Station, TX).
Results
Comparability of Data
Table 1 shows the mean values of those states with repeated observations
Number of Cases and Mean Scores in Repeated State Test Results
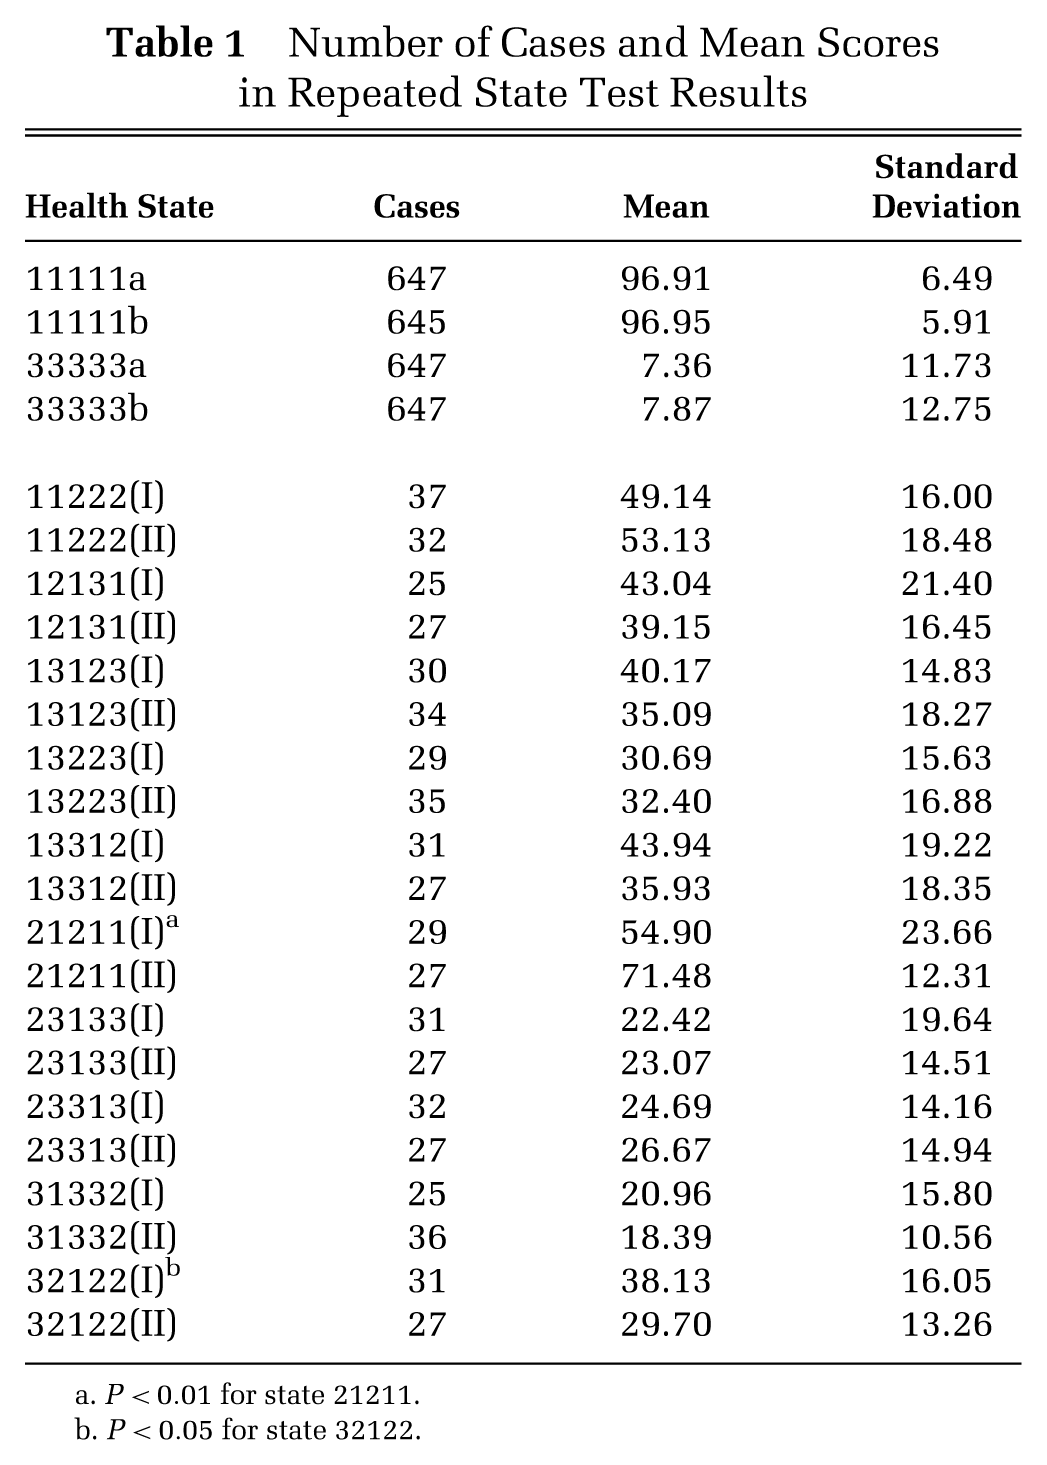
P < 0.01 for state 21211.
P < 0.05 for state 32122.
Optimal Number of Health States
Table 2 shows the average MAEs, standard deviations, and minimums and maximums for each of the 15 subset categories representing different percentages of the total 243 health states. The results suggest that above 18%, the average MAE was fairly constant ranging from 5.33 to 5.43. However, below this level, there is a trend towards increased MAE as the proportion of health states used in the model falls.
Simulation Results from 243 Health States with Random Effects Model
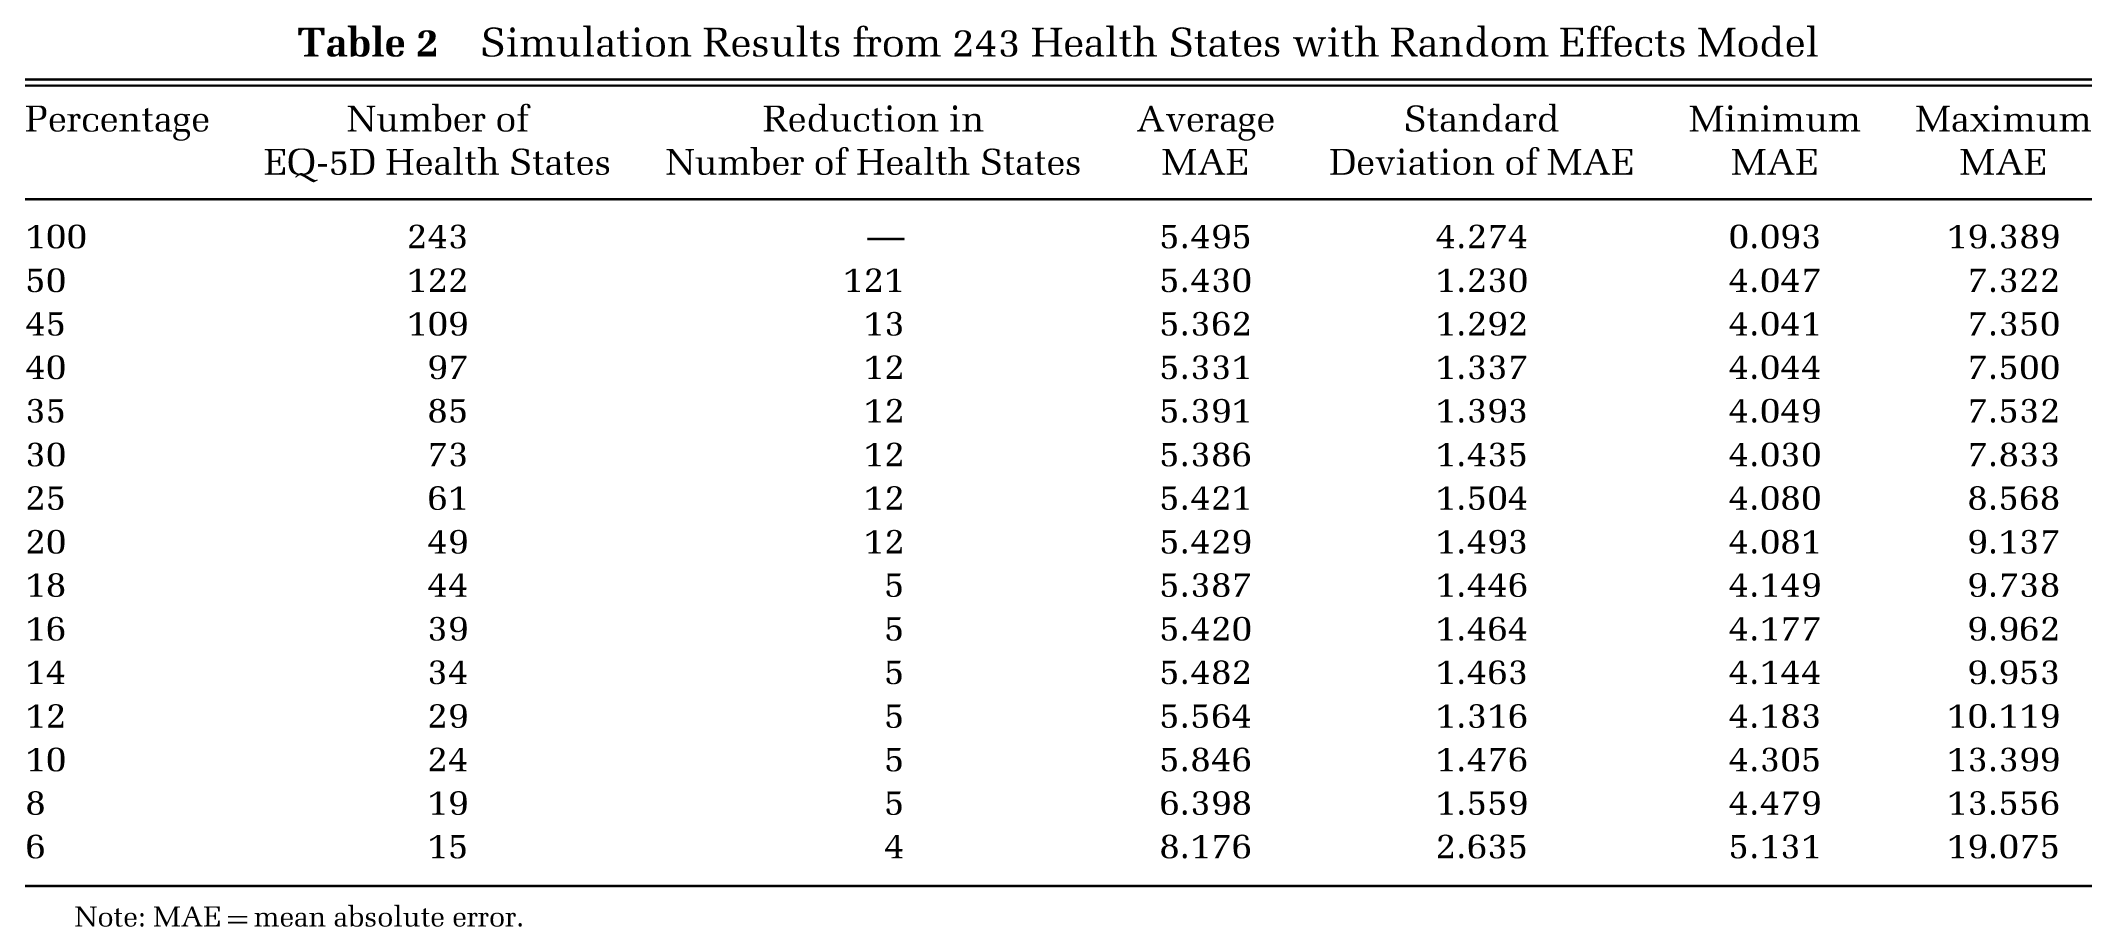
Note: MAE = mean absolute error.
Table 3 shows the results of the identical simulation but based on the modified dataset, which limits the number of observations for 11111 and 33333 to reduce their influence compared to other health states for which there were fewer observations. The results demonstrate a consistent trend in which the size of the average MAE increases as the percentage of health states decreases. The size of the average MAE resulting in the modified dataset was smaller than in the original, reflecting the lower level of variance in the logically best and worst states. These simulations were repeated using aggregated level data, resulting in a similar pattern but with somewhat lower MAE values to those produced in the analysis of the modified dataset (not shown).
Simulation Results from Modified Dataset with Random Effects Model
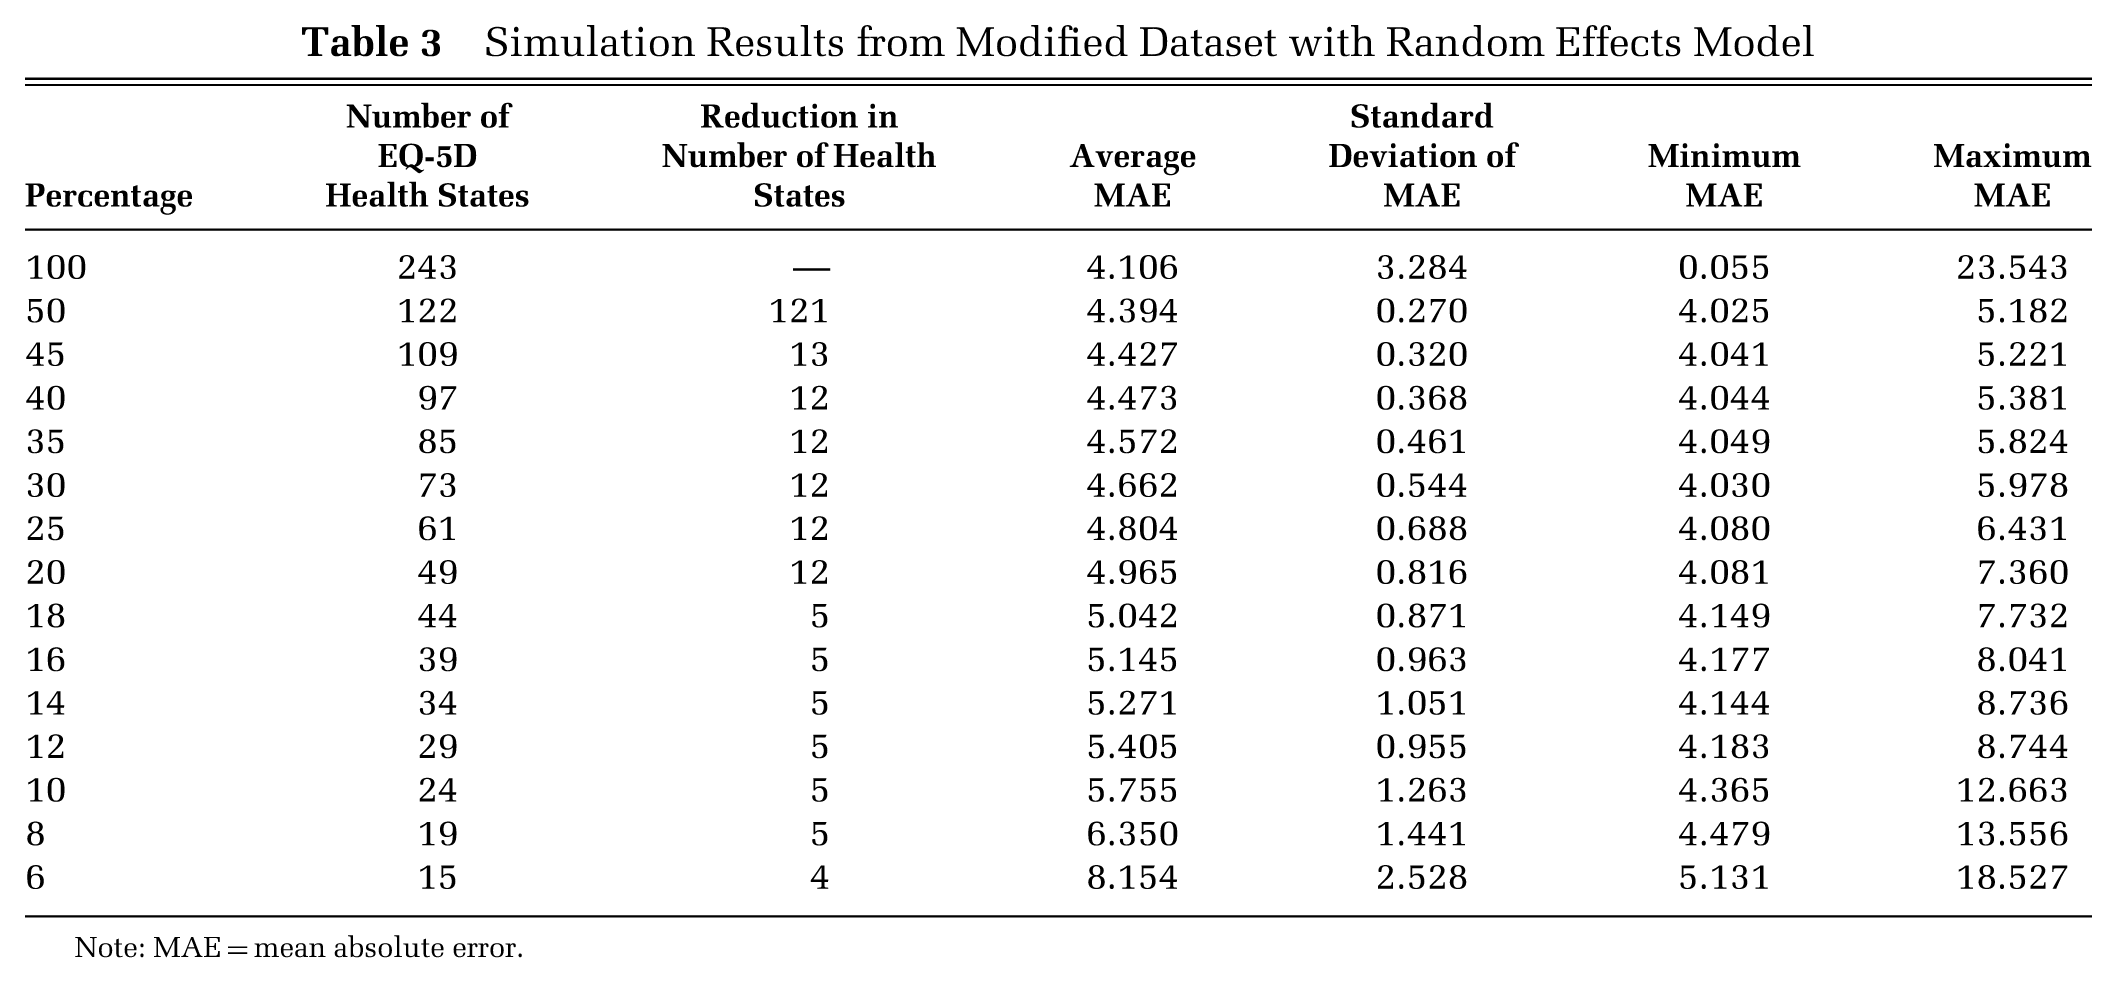
Note: MAE = mean absolute error.
As clearly illustrated in Figure 1, where the mean MAE is plotted against the size of the health state subsets, all 3 simulations suggest 14% to 12% as being the elbow/turning point, above which the average MAE is relatively stable, and below this point, MAE increases. Thus, 13% could be regarded as an optimal category, minimizing the number of health states and keeping the size of average MAEs small, based on the current results.
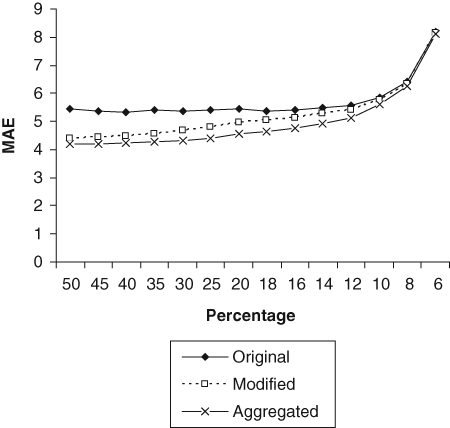
Average mean absolute errors (MAEs) as a function of the size of a health state subset. “Original” refers to the simulation based on 243 health states, “modified” refers to the simulation based on the modified dataset (states 11111 and 33333 have only 200 randomly selected values), and “aggregated” refers to the simulation in aggregated data.
To test the robustness of the findings with regard to the choice of model specification, all these analyses were replicated using an alternative model specification that included the N3 term, a dummy variable normally set to 0 but set to 1 in the presence of a health state with a severe (level 3) problem in any dimension. All the results obtained from this reanalysis confirmed the original findings.
Sample Size per Health State
Figure 2 shows the effect of sample size per state on the MAE based on the analysis of a simulated dataset created using the mean and variance observed in the original dataset. As expected, a greater sample size produced a smaller average MAE. The size of MAE was relatively stable until the number of respondents per state fell to below 100. The acceleration in increased MAE was only observed when fewer than 100 respondents per state were considered. Figure 2 also shows the MAE produced by jointly varying the number of observations per state and the size of the health state subset. The results suggest that changes in the number of states have a greater impact than changes in the sample size per state.
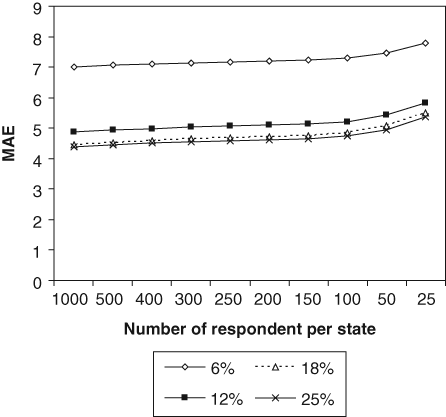
The average mean absolute error (MAE) as a function of both subset size and the number of observations per state.
Combination of Health States
Following the finding in the previous section, the optimal number of 32 was used to examine the issue of combination of health states here. Thirty-two health states were selected from the modified dataset using the modulus method described above. Nine sets of 32 health states were identified using a modulus ranging from 8 to 16; all 9 sets included the state 11111. RE modeling was then applied, and the results are shown in Table 4 along with corresponding results obtained from the analysis of health states in other valuation studies including the MVH, M&K, M&K with 11111, and the EuroQoL standard postal set. It can be seen that the MVH health states produced better results than the M&K, M&K with 11111, and the standard postal set and were the only set providing consistent coefficient estimates (with expected sign and magnitude) among these. In contrast, all modulus sets selected from the full set of 243 health states produced consistent coefficient estimates, and their MAEs were comparable with that based on the MVH set.
Results of Testing Combinations of Health States
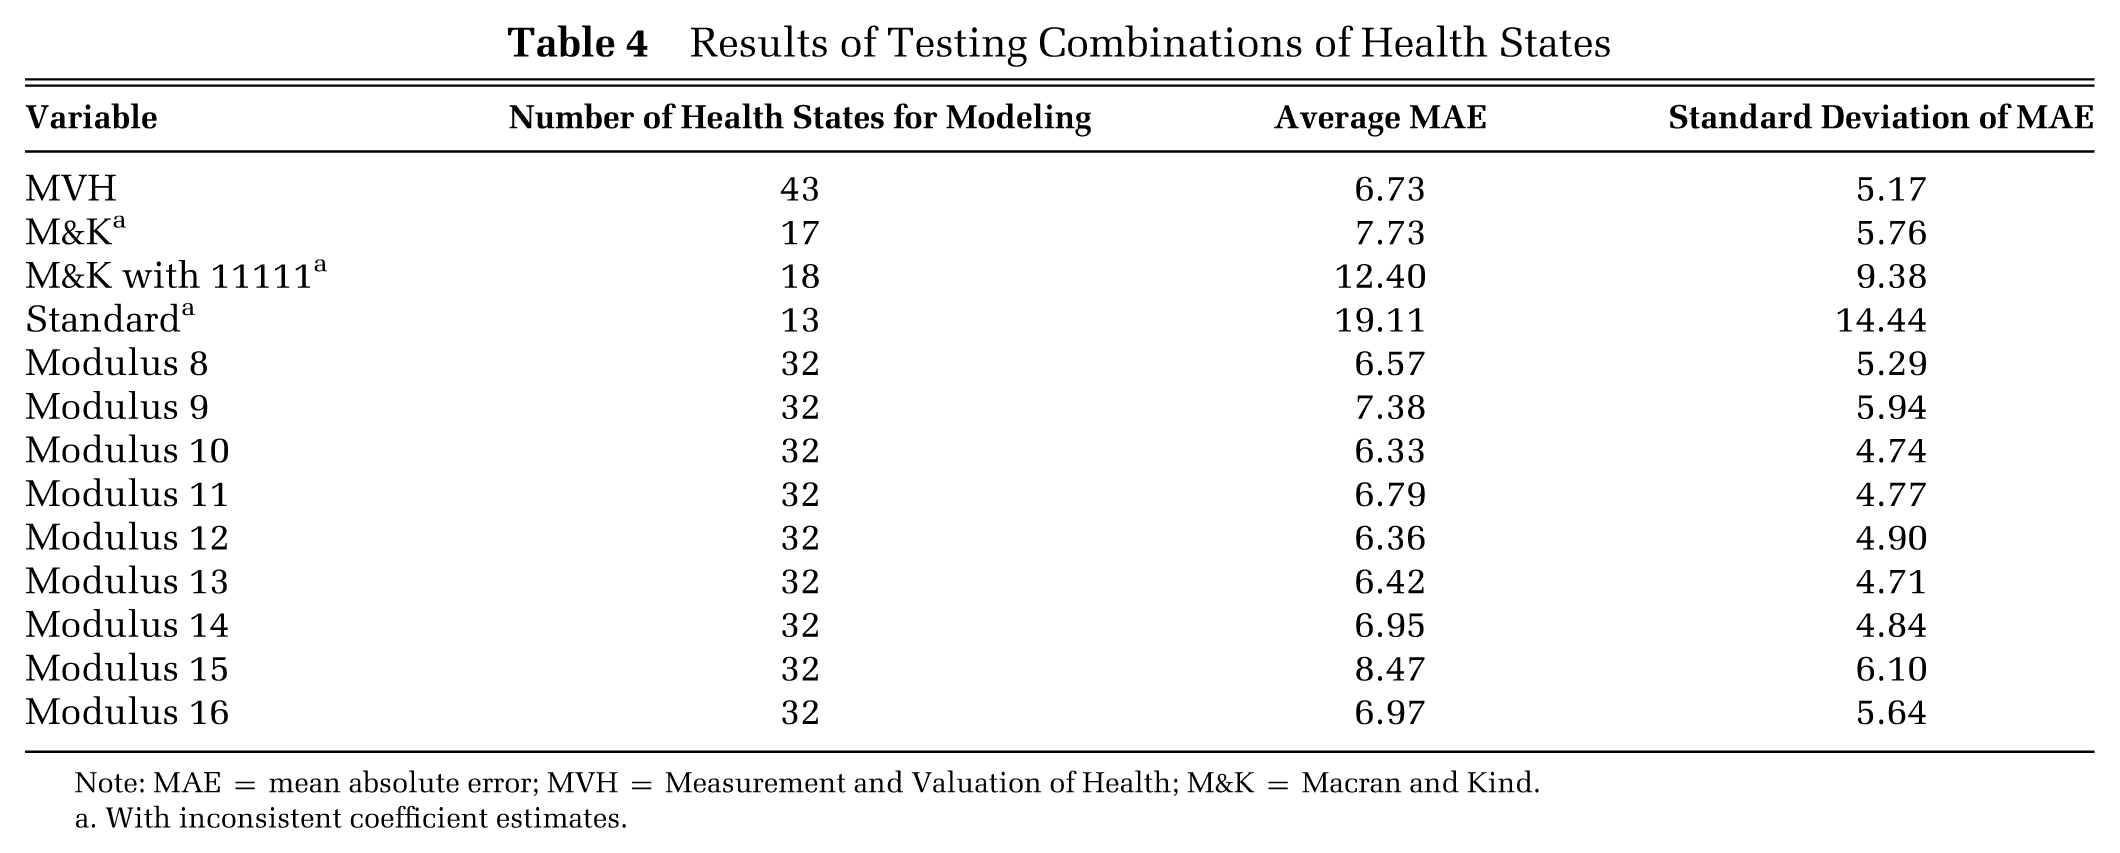
Note: MAE = mean absolute error; MVH = Measurement and Valuation of Health; M&K = Macran and Kind.
With inconsistent coefficient estimates.
Discussion
The design of any valuation study involves several simultaneous tradeoffs: sufficient health states must be involved so as to provide information about value across the full range of possible health states; the volume of information should be great enough to support appropriate statistical testing and model construction; in an ideal world, there should be capacity to permit out-of-sample validation of any such models. The reality of limited research budgets places a constraint, which means that there is always likely to be conflict between the desirable and the practical. When considering alternative study designs, we must be able to identify the preferred option on the basis of some empirical evidence. Our problem therefore becomes that of determining which of 2 or more study designs yields the “better” locally optimal solution.
Only one study claims to have systematically investigated both the number of health states and the number of observations per health state required to estimate a reliable value set. 15 That study, based on the results of simulations using the MVH dataset, suggests that the M&K set is the most effective subset and that 200 observations per state are required for estimating the full value set. The study acknowledged that it was entirely possible to draw different conclusions regarding the number and combination of health states and sample size if analyses were based on other health states not restricted to those used in the MVH study. In the study reported here, no such restrictions are imposed as valuation data were available for all 243 health states.
Choosing the number of health states for an optimal design rests heavily on the criterion used to measure the performance of estimation models. There is no absolute standard against which a reported MAE can be judged so as to safely infer that an estimation model is performing efficiently, so that the interpretation of MAE results varies from study to study. A conventional approach would be to plot the mean MAE against the number of states as shown in Figure 1. The interpretation of this graphic typically examines such a plot to locate an elbow or turning point, which in this case occurs between the 14% and 12% points, corresponding to 32 health states.
The average number of observations for each health state in the MVH dataset is about 800 so that we can be reasonably certain about the mean and variance of the observed values for those states. The findings in the current study, based on the simulated dataset, suggest that 100 observations per state are sufficient for reliable estimation. This finding is at odds with a similar study, which indicated that 200 observations would be sufficient. 15 In a further simulated dataset (not reported here), using a beta distribution to avoid the arbitrary truncation points (0 and 1) under the normal distribution also supports a design based on 100 observations per state. Our results are further supported in at least one other study demonstrating that 100 observations are a sufficiently large sample size to generate reliable mean values. 20 Juxtaposed against a design of 800 observations per state, this evidence can only reasonably be interpreted as demonstrating the inherent inefficiency of the MVH study, strongly suggesting the need for caution in any replication studies. Allowing for a margin of error, it could therefore be considered that, as a rule of thumb, 150 observations per health state would be sufficient in modeling the standard 3-level EQ-5D health state classification.
However, both current and previous studies agreed with the finding that reducing the number of health states has a greater impact on the average MAE compared to reducing the number of respondents. This might provide some suggestions in the scenarios in which the tradeoff has to be made between the number of health states and the number of observations per state.
In addition to the 2 principal design variables, namely, the number of health states and observations per state, there remains a further consideration that is concerned with the choice of health states themselves. In order to test for the effect of different combinations of health states, the modulus approach was adopted that, in this particular case, takes account of the likely ordering of EQ-5D health states as indicated by their estimated VAS values as reported in the MVH study. Using the modulus method ensures that a wide range of health states are covered from very mild to severe. A number of modulus sets produced results that were comparable to those of the MVH set, even though the number of states in that study was 11 greater. M&K’s set generated close enough result as those of some of the modulus sets. However, the results were only comparable after adding in state 11111 into M&K’s set as all module sets included state 11111. This M&K with 11111 produced much bigger errors than all the modulus sets and had inconsistent coefficients as well.
The findings here suggest that more than multiple combinations of health states produce comparable results. For instance, the sets based on every 10, 12, and 13 health states (referred to as modulus 10, modulus 12, and modulus 13 in Table 4) generate almost identical MAE values with similar means and variances. Within the current study, it is not possible to judge the superiority of one set over the others, but in principle, it is clearly desirable that the choice of 32 health states selected as the subset for any valuation study should be taken from the full set of 243 EQ-5D health states.
This study was based on analysis of all data recorded for the saturation study. No participants were excluded due to logical inconsistencies in their values for EQ-5D health states. It might be that those values that are logically inconsistent indicate a respondent’s failure to understand the valuation task, or simply, they reflect the variation in the perception of the individual over different health states. A sensitivity check was undertaken in which all analyses were repeated after excluding values displaying logical inconsistency. All findings were confirmed.
In discussing the findings reported here, there are a number of caveats that should be noted. First, the mode of administration in the saturation study (which is a postal self-completed survey) differs from the MVH study (which is an interview-administered survey). Additionally, the saturation study only captured VAS values, whereas most related studies reporting analysis of the MVH set focus on time tradeoff (TTO) values. It is known that values elicited through interview-based surveys are significantly different from those obtained through other forms of administration. 21 Values elicited through different preference measurement techniques also produce different results. Thus, the discrepancies between the conclusions of this study and others considering valuation study design might be attributed to the number of health states as well as to the difference in elicitation methods and mode of administration. The sample size of the saturation dataset is a major concern in that most of the health states only have 25 to 38 observations. Thus, the validity of the values obtained for most of the states in the saturation study might be questioned. Nevertheless, the saturation study demonstrated values that are remarkably similar when compared with results from the MVH study. 16 If the variance of the scores is considered, the standard deviation of the score of each health state is mostly lower in the saturation data than that of the corresponding health state in the MVH data. However, given the small sample size, the robustness and generalizability of findings in the current study should be handled with caution. Finally, in the current study, each design variable is addressed independently, and it is arguable that these design variables are related to each other. The possible interdependencies should be investigated through techniques such as responses surface analysis in future researches.
Conclusion
This paper explores the effect of the selection of health states on the estimation of a VAS value set for EQ-5D. Unlike previous studies that were limited to 43 health states, this study included all 243 health states defined by EQ-5D. Despite the constraint of the small sample size in the saturation study dataset, the results here suggest that the optimal number of states for a valuation study is 32 and that multiple choices of health state were feasible. Selecting health states not included in the MVH set in valuation studies is quite specifically encouraged. However, it remains prudent to ensure that the selection of health states covers as wide a range of severity as possible. The results here also suggest that 100 observations per health state provide sufficient information for such a task, although this figure could be set higher at 150 to allow for any errors in data collection or processing. However, the extent to which the results of this study based on VAS valuation data can be safely generalized to the design of TTO valuation studies remains an open question.
Footnotes
Acknowledgements
An earlier version of this paper was accepted as a discussion paper at the 24th EuroQoL Plenary Meeting, The Hague, the Netherlands, 13–15 September 2007. Source of financial support: None. Conflict of interest: None.
a.
The following sets of health states were selected: 100%, 50%, 45%, 40%, 35%, 30%, 25%, 20%, 18%, 16%, 14%, 12%, 10%, 8%, and 6% of the 243 health states.
b.
500, 400, 300, 250, 200, 150, 100, 50, and 25.