
Abstract
Health economic evaluations are an accepted norm in many high-income countries and are used, inter alia, to guide allocation of resources for health care. 1 The popular method of economic evaluation, cost utility analysis (CUA), uses quality-adjusted life-years (QALYs) as the outcome measure. 2 The concept of QALYs encompasses quality-weighted length of life in a single measure. Utility weights assigned to health states make possible the measurement of quality increment or decrement in health economic evaluation. Development of multiattribute utility instruments (MAUIs), based on multiattribute utility theory, 3 has enabled utility algorithms to be developed for assigning values to health states. Popular generic MAUIs include the EQ-5D family, the Health Utilities Index (HUI), and the Assessment of Quality of Life (AQoL) family.3-5 The most popular MAUI with the greatest number of published national valuations is EQ-5D-3L.6–9 Criticisms of EQ-5D-3L and other generic MAUIs include their lack of sensitivity for specific health conditions, including cancer.10–12 It is believed that the 243 health states of EQ-5D-3L are not capable of discriminating between the health states associated with malignant neoplasms. 11 As a result, trials of cancer treatments rarely incorporate MAUIs to discern the utility increment of new interventions.
Cancer research often includes quality of life measures such as the EORTC-QLQ-C3010 and FACT-G 13 to quantify the outcomes of interventions. The EORTC-QLQ-C30 and similar quality of life measures have great clinical use in measuring changes in health-related quality of life. However, these disease-specific instruments do not provide valuations of health states through a utility algorithm and are only able to describe changes in quality of life numerically or qualitatively. Recently, there has been interest in developing disease-specific preference-based measures from widely accepted and validated disease-specific quality of life instruments.10,14 The EORTC-8D is such a measure, developed from the EORTC-QLQ-C30 as a cancer-specific preference-based instrument. 10 It provides a potential solution to the insensitivity of generic MAUIs in measuring quality of life in patients with cancer. 15 Use of the EORTC-8D algorithm with the EORTC-QLQ-C30 will serve 2 purposes. First, the EORTC-QLQ-C30 can measure quality of life differences in cancer patients. Second, the QLQ-C30 scores can be converted to utility weights using the EORTC-8D algorithm. 15
Usually, country-specific utility values are needed for a preference-based measure to be used in a CUA intended for country-specific decision making. 16 A health state valuation needs to be undertaken to derive utility weights for each health state described by the preference-based measure using the population of a given country. 16 The first EORTC-8D valuation study reported provided values for the population of the UK. 10 However, utility weights vary with cultural and economic backgrounds of the people providing the valuations. 17 Thus, there are several reasons why utility values of high-income countries may not be appropriate for use in low- and middle-income countries. Sri Lanka, a South Asian lower-middle-income country (i.e., a middle-income country at the lower end of the middle-income group) with a limited health budget and constrained cancer rehabilitation services may have different utility weights than those derived from a UK population. For example, we have shown that EQ-5D utility weights for Sri Lanka are substantially different from those derived from high-income countries. 18 Thus, utility weights for the EORTC-8D for use in low- and middle-income countries should be valued from the populations of these countries. In a recent comprehensive literature review, we found a scarcity of health state valuations using either generic or disease-specific preference-based measures in these countries and demonstrated a need for validated health state valuation methods for low- and middle-income countries. 16 In low- and middle-income countries, disability-adjusted life-years (DALYs) can also be used for economic evaluations. However, the preference-based methods of DALYs are obscure and are not country specific. The different socioeconomic scenarios experienced in different countries necessitate country-specific utility weights.16,17 Developing utility weights for the EORTC-8D in low- and middle-income countries would facilitate economic evaluations of the impacts of cancer and of cancer-related diseases and dysfunctions.
The purpose of the present study was to estimate utility weights for the EORTC-8D health states using a representative population sample from Sri Lanka.
Methods
The study was undertaken alongside the Sri Lankan EQ-5D-3L health state valuation study using the same respondents. 19 The method is described in detail elsewhere. 19 Health state valuation was carried out by individuals drawn from the general population (who are tax payers and voters) of Sri Lanka using a stratified cluster sampling method. 19 To avoid possible bias, we did not use patients or health professionals.
The EORTC-8D has 8 dimensions. The first, physical functioning, has 5 levels. The remaining 7 dimensions (role functioning, pain, emotional functioning, social functioning, fatigue and sleep disturbance, nausea, constipation and diarrhea) have 4 levels each. In total, 81,920 health states are described by the EORTC-8D. 10 This study used the same EORTC-8D health states valued by Rowen and others 10 in the UK. As it is clearly not feasible to directly value all 81,920 states, 81 were selected using an orthogonal array, and a further 4 were chosen to make a total of 85. 20 These included the worst health state 54444444. The 84 selected health states (minus the worst) were randomly divided into 12 sets, each containing 7. Health state sets were randomly allocated to participants who valued the 7 allocated states as well as the worst health state.
The time-tradeoff (TTO) method was used to elicit the preferences of the participants. Health states were valued using a 2-sided TTO board in face-to-face interviews at the respondents’ household. 21 Eight trained data collectors conducted the interviews and guided respondents through the TTO exercise. A given health state (health state B) was compared with full health (11111111). Full health was presented as no problems in all 8 dimensions and was assigned a measure-specific value of 1. If a respondent preferred living in a health state for 10 years followed by death, rather than immediate death, he or she was asked the length of time (x) he or she preferred to stay in full health. The length of time was determined using side 1 of the TTO board with 5 years as the starting point and outward titration according to the respondent’s preference. If the point of indifference between the health state B and full health was achieved at 7 years (x), the utility value was calculated as 0.7 as the calculation was x/10. However, when there is agreement and refusal between 2 adjacent choices (e.g., the respondent preferred 10 years in health state B to 7.5 years in full health but refused 8 years in full health over 10 years in health state B), the midpoint of the 2 choices was used (i.e., 0.775 in this example). If the respondent preferred immediate death over 10 years in the given health state, side 2 of the TTO board was used, as the health state was considered worse than death. In this case the preference task was different, as the choice was between y years in the given health state followed by 10 – y years in full health followed by immediate death. Again, the task was started with 5 years for y and outward titration was used to determine the final point at which the respondent was indifferent. The utility score for health states worse than death was calculated as (y/10) − 1. This method was used to limit the lower boundary of utility valuation to −1, thus containing the values between +1 and −1. 22
The sample size was 786, based on the determination for the EQ-5D health state valuation conducted in parallel with the present study. 19 This is more than double the size of the sample used for the valuation of EORTC-8D health states in the UK. Participants were selected from 4 districts of Sri Lanka. 19 Within these, Public Health Midwife (PHM) areas were selected using a probability proportionate to size method, and from which 30 households were randomly chosen. 23 One adult from each household was then systematically selected using the Kish grid method. 19
The interview procedure is described in detail elsewhere. 19 Briefly, a trained data collector described the purpose of the study and obtained informed consent. Participants responded first to a questionnaire eliciting demographic information and their current and past medical history. They then responded to the EQ-5D visual analogue scale to mark their current health status. Next, they completed the EQ-5D-3L questionnaire for their current health state. Subsequently, the EQ-5D-3L health state valuation was carried out. Following a short break, the EORTC-8D health state valuation was carried out. The cards that described the selected 7 EORTC-8D health states and the worst health states were given to the participant, who was asked to rank these in ascending order of preference. This order was recorded by the data collector. The cards were then shuffled and represented for the health state valuation in a random order.
Analysis
Data were analyzed using Stata12 software. 24 A statistical model was constructed to predict utility weights for all health states based on the directly valued states. The dependent variable was the utility value, and dummy variables were constructed for the main effects for each domain level, representing movement away from full health. Dimension 1, physical functioning (PF), had 4 main effects. Movement from level 1 to level 2 was PF2, from level 1 to level 3 was PF3, from level 1 to level 4 was PF4, and from level 1 to level 5 was PF5.The other 7 dimensions of role functioning (RF), pain (PN), emotional functioning (EF), social functioning (SF), fatigue and sleep disturbance (FS), nausea (NS), and constipation and diarrhea (CD) each had 3 main effects, and the movements were coded in a similar fashion.
Ordinary least squares (OLS) regression was estimated using utility as the dependent variable and the main effects as independent variables. The results were then compared with generalized least squares with random effects (GLSRE) models, which take into account correlations both within and between respondents (i.e., clustering effects).
A set of health states valued by a participant has a finite number of pairs that could be defined as logically inconsistent. According to Dolan and Kind, 25 health state A can be considered logically better than health state B if at least one dimension is better and no other dimension is worse. Health state A, therefore, should have a larger utility value: Were A to be given a lower value than B, both values are considered logically inconsistent. In addition, when health state A has some dimensions better and others worse than B, logical inconsistency cannot be determined. Moreover, the difference between utility values should be more than 0.05 for them to be identified as a logical inconsistency (LI), as argued by Lamers and others. 26 The present analysis considers LIs according to Lamers’ criteria. 26 After removing all individuals with at least one LI, and using GLSRE, we included the remaining observations to estimate main effects on utility.
In addition to main effects, all possible first-order pairwise interactions among the dimensions were initially included. Alternative interaction terms were also developed. An N3 dummy recorded whether any dimension had at least one level 3. An N4 dummy recorded whether any dimension had at least one level 4. An N4/N5 dummy was created to record any dimension at its worst level (level 5 for PF and level 4 for others).27,28
Main effects were combined with pairwise interactions; N3, N4, and N4/N5 terms separately; and in various combinations. Only the best fitting models were selected, based on consistency, parsimony, and goodness of fit. Goodness-of-fit values considered were log likelihood, Akaike information criterion (AIC), and Bayesian information criterion (BIC).29,30 The models were exhaustively examined in a stepwise process to achieve the parsimonious model with elimination of nonsignificant coefficients. In each step the coefficient with the highest P value was excluded. When a model was obtained where all main effects and interaction terms were significant, the model was examined for consistency. If a coefficient representing a worse level has a lower value than one representing a better level, it is regarded as a consistent state. Thus, any inconsistent coefficient was combined with its immediate upper level. The final model was specified when all coefficients were significant and consistent.
Results
Of the original 780 participants, 736 (94%) enrolled in the valuation experiment. The remaining 44 were nonrespondents. As each respondent valued 8 health states (7 randomly selected health states and the worst health state), the expected total number of observations was 5888. We recorded 4816 (82%) observations: Some participants declined to complete all 8 exercises, although no one withdrew overall consent. There were 110 (2.3%) LI observations according to Lamers’ criteria, estimated from 43 (6%) respondents with at least one LI observation.18,31 LI responses were included in the first part of the analysis. However, we excluded them from the final analysis as we believed that LI observations reflect participants’ confusion or lack of understanding with the preference task given to them rather than their actual preference for the health state. Ultimately, from the total expected observations, 4520 (76.7%) were included in analysis of the preferred model.
The sample was compared with national demographic values. It had a slightly larger proportion of females. As the interview was carried out mainly in Sinhalese, the sample is predominantly Sinhalese. Ethnicity and the district the participants lived in had significant effects on the number of LI responses (Table 1).
Demographic Distribution of the Sample
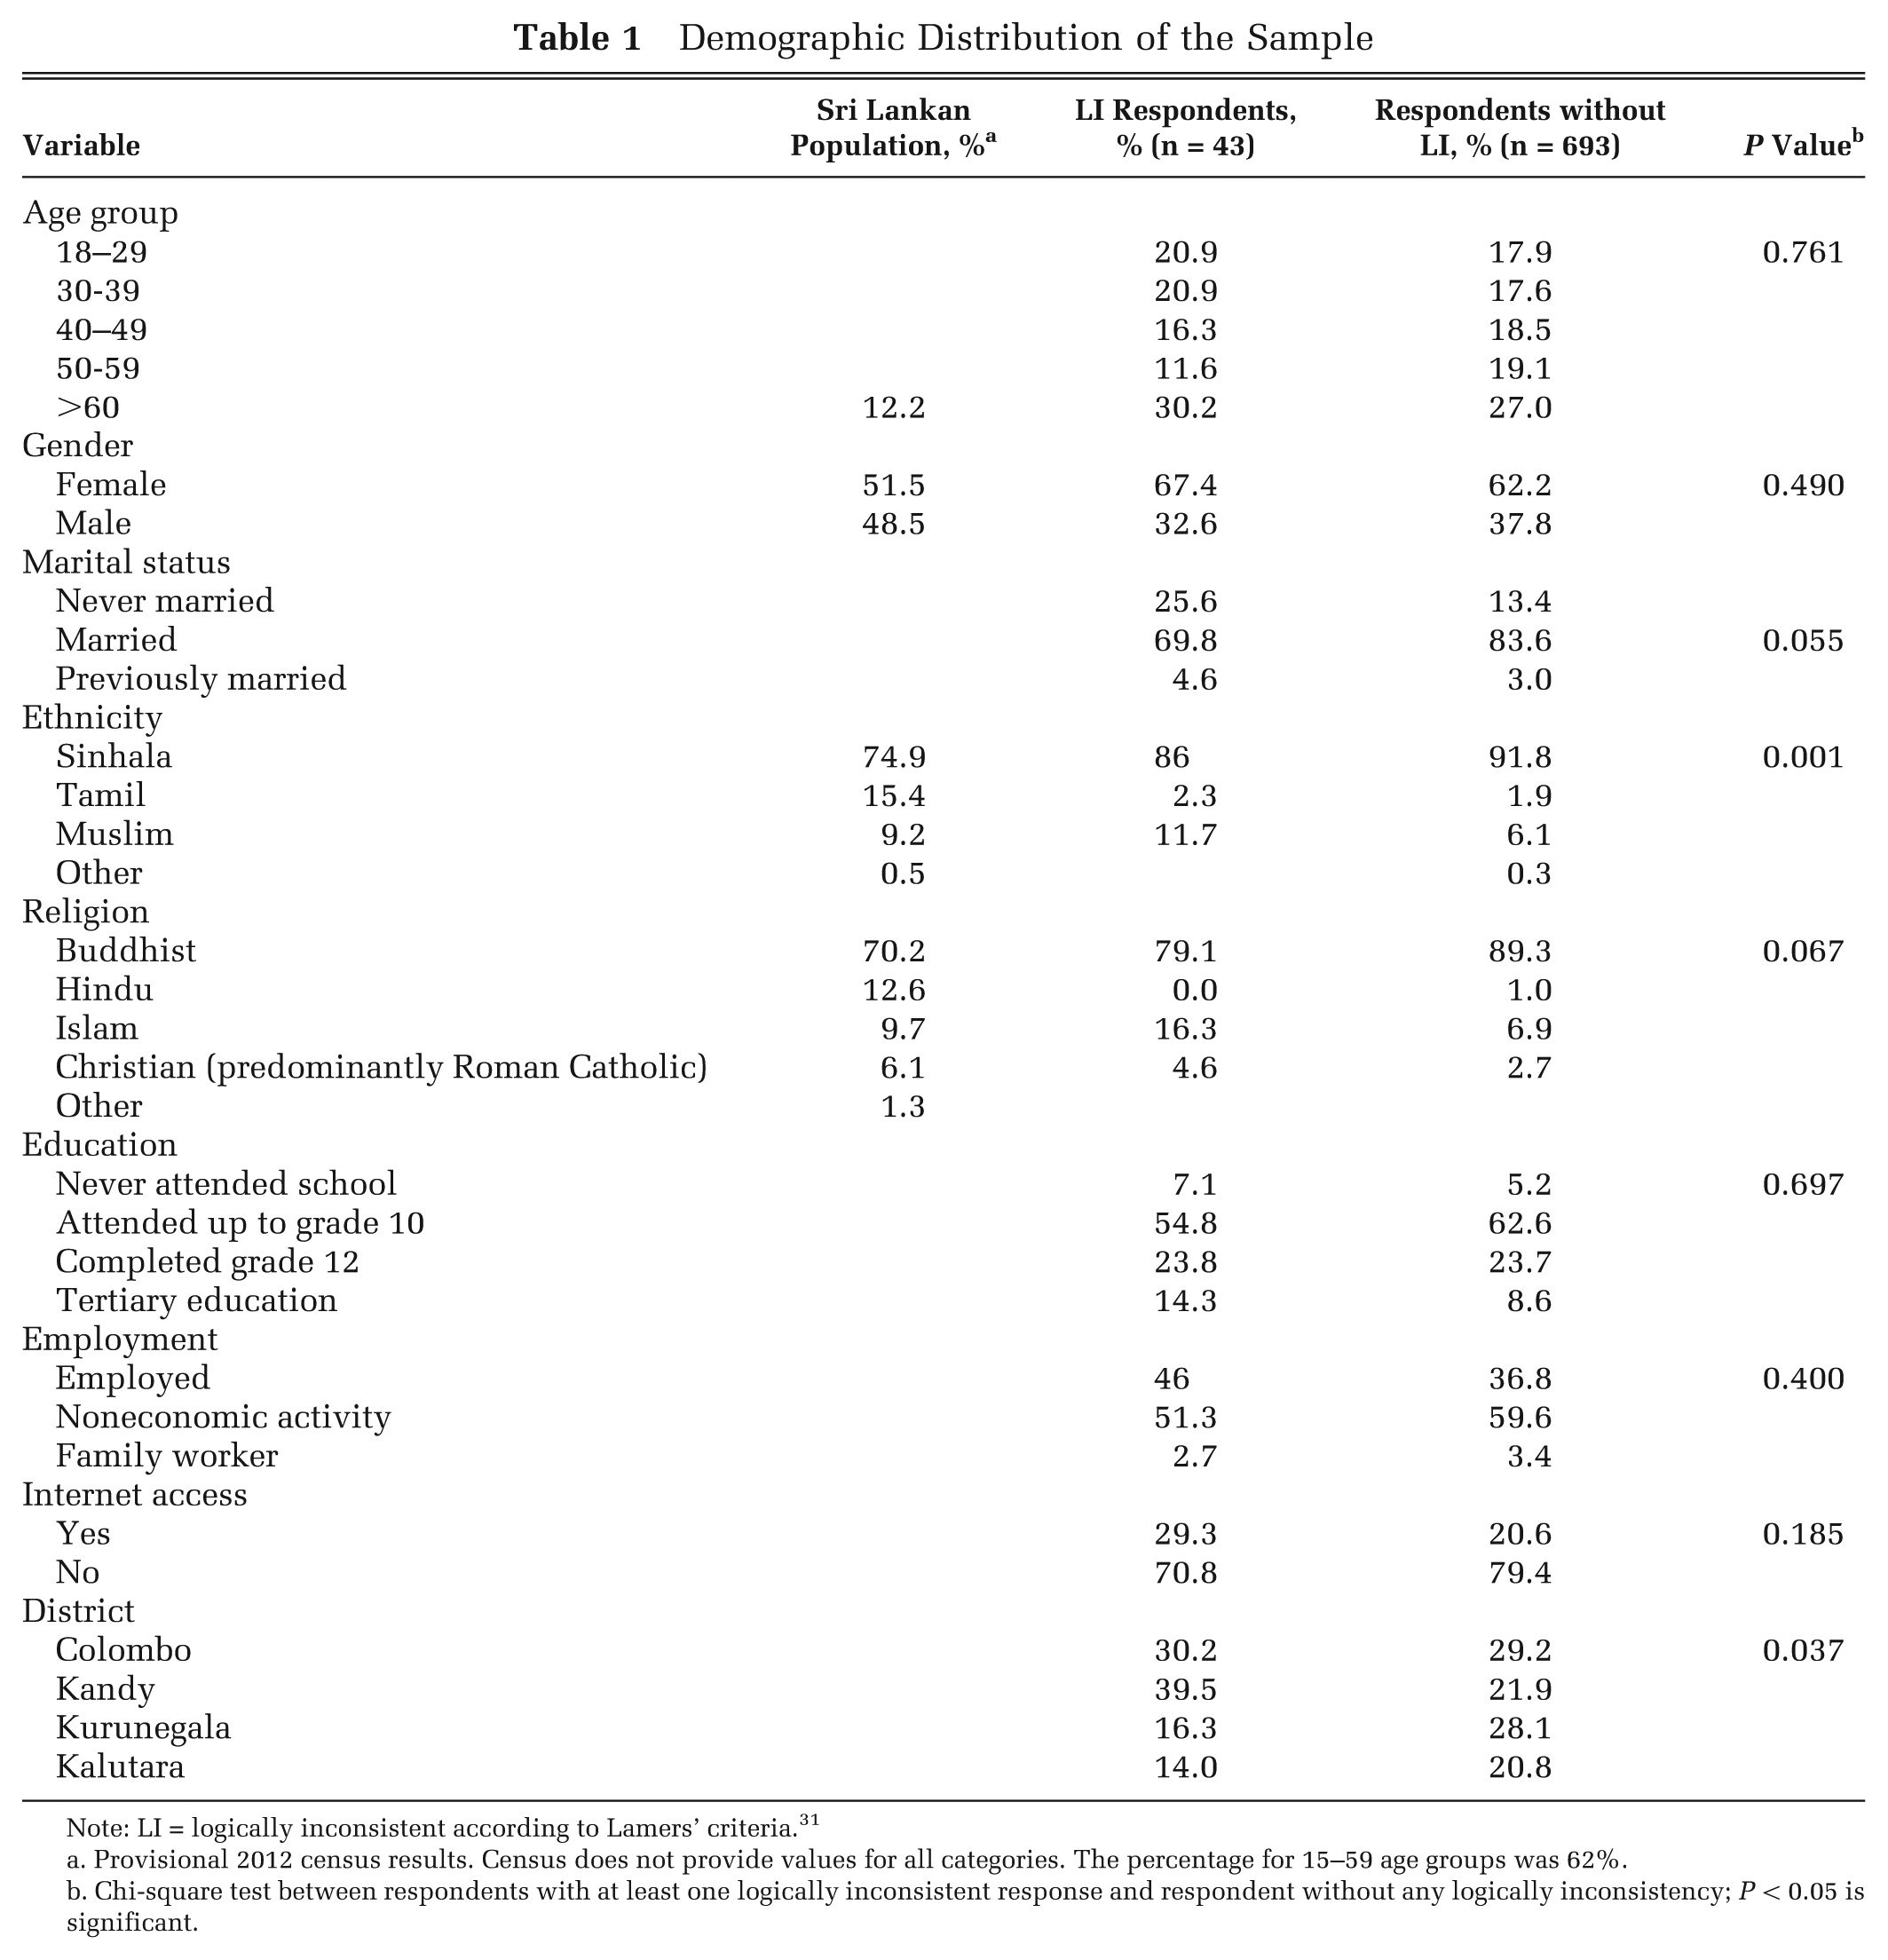
Note: LI = logically inconsistent according to Lamers’ criteria. 31
Provisional 2012 census results. Census does not provide values for all categories. The percentage for 15–59 age groups was 62%.
Chi-square test between respondents with at least one logically inconsistent response and respondent without any logically inconsistency; P < 0.05 is significant.
The TTO values ranged from +1 to −1. In contrast to the UK study, some of the Sri Lankan EORTC-8D health states were valued as worse than death states. The mean TTO value across all health states was 0.238 with a standard deviation of 0.679. Of the 4816 direct valuation observations, 1503 (31.2%) were less than zero, 3280 (68.1%) were greater than zero, and 33 (0.6%) were equal to zero.
Table 2 compares the main effects with different model specifications using OLS (model A) and GLSRE (model B): The latter exhibited superior fit (AIC and BIC, 6390 and 6571). All further analyses were carried out with GLSRE for variations of model B. Model C (without LI respondents) is better than model B in terms of consistency and goodness of fit. Moreover, model C has a best health state utility of 0.72 compared with 0.67 in model B. However, when interaction terms N3 and N4 were included (model D), model fit values improved slightly while the consistency decreased slightly. The models with pairwise interactions and N4/N5 terms were excluded as these models did not provide good model fit.
Estimated Coefficients from the Different Model Specifications
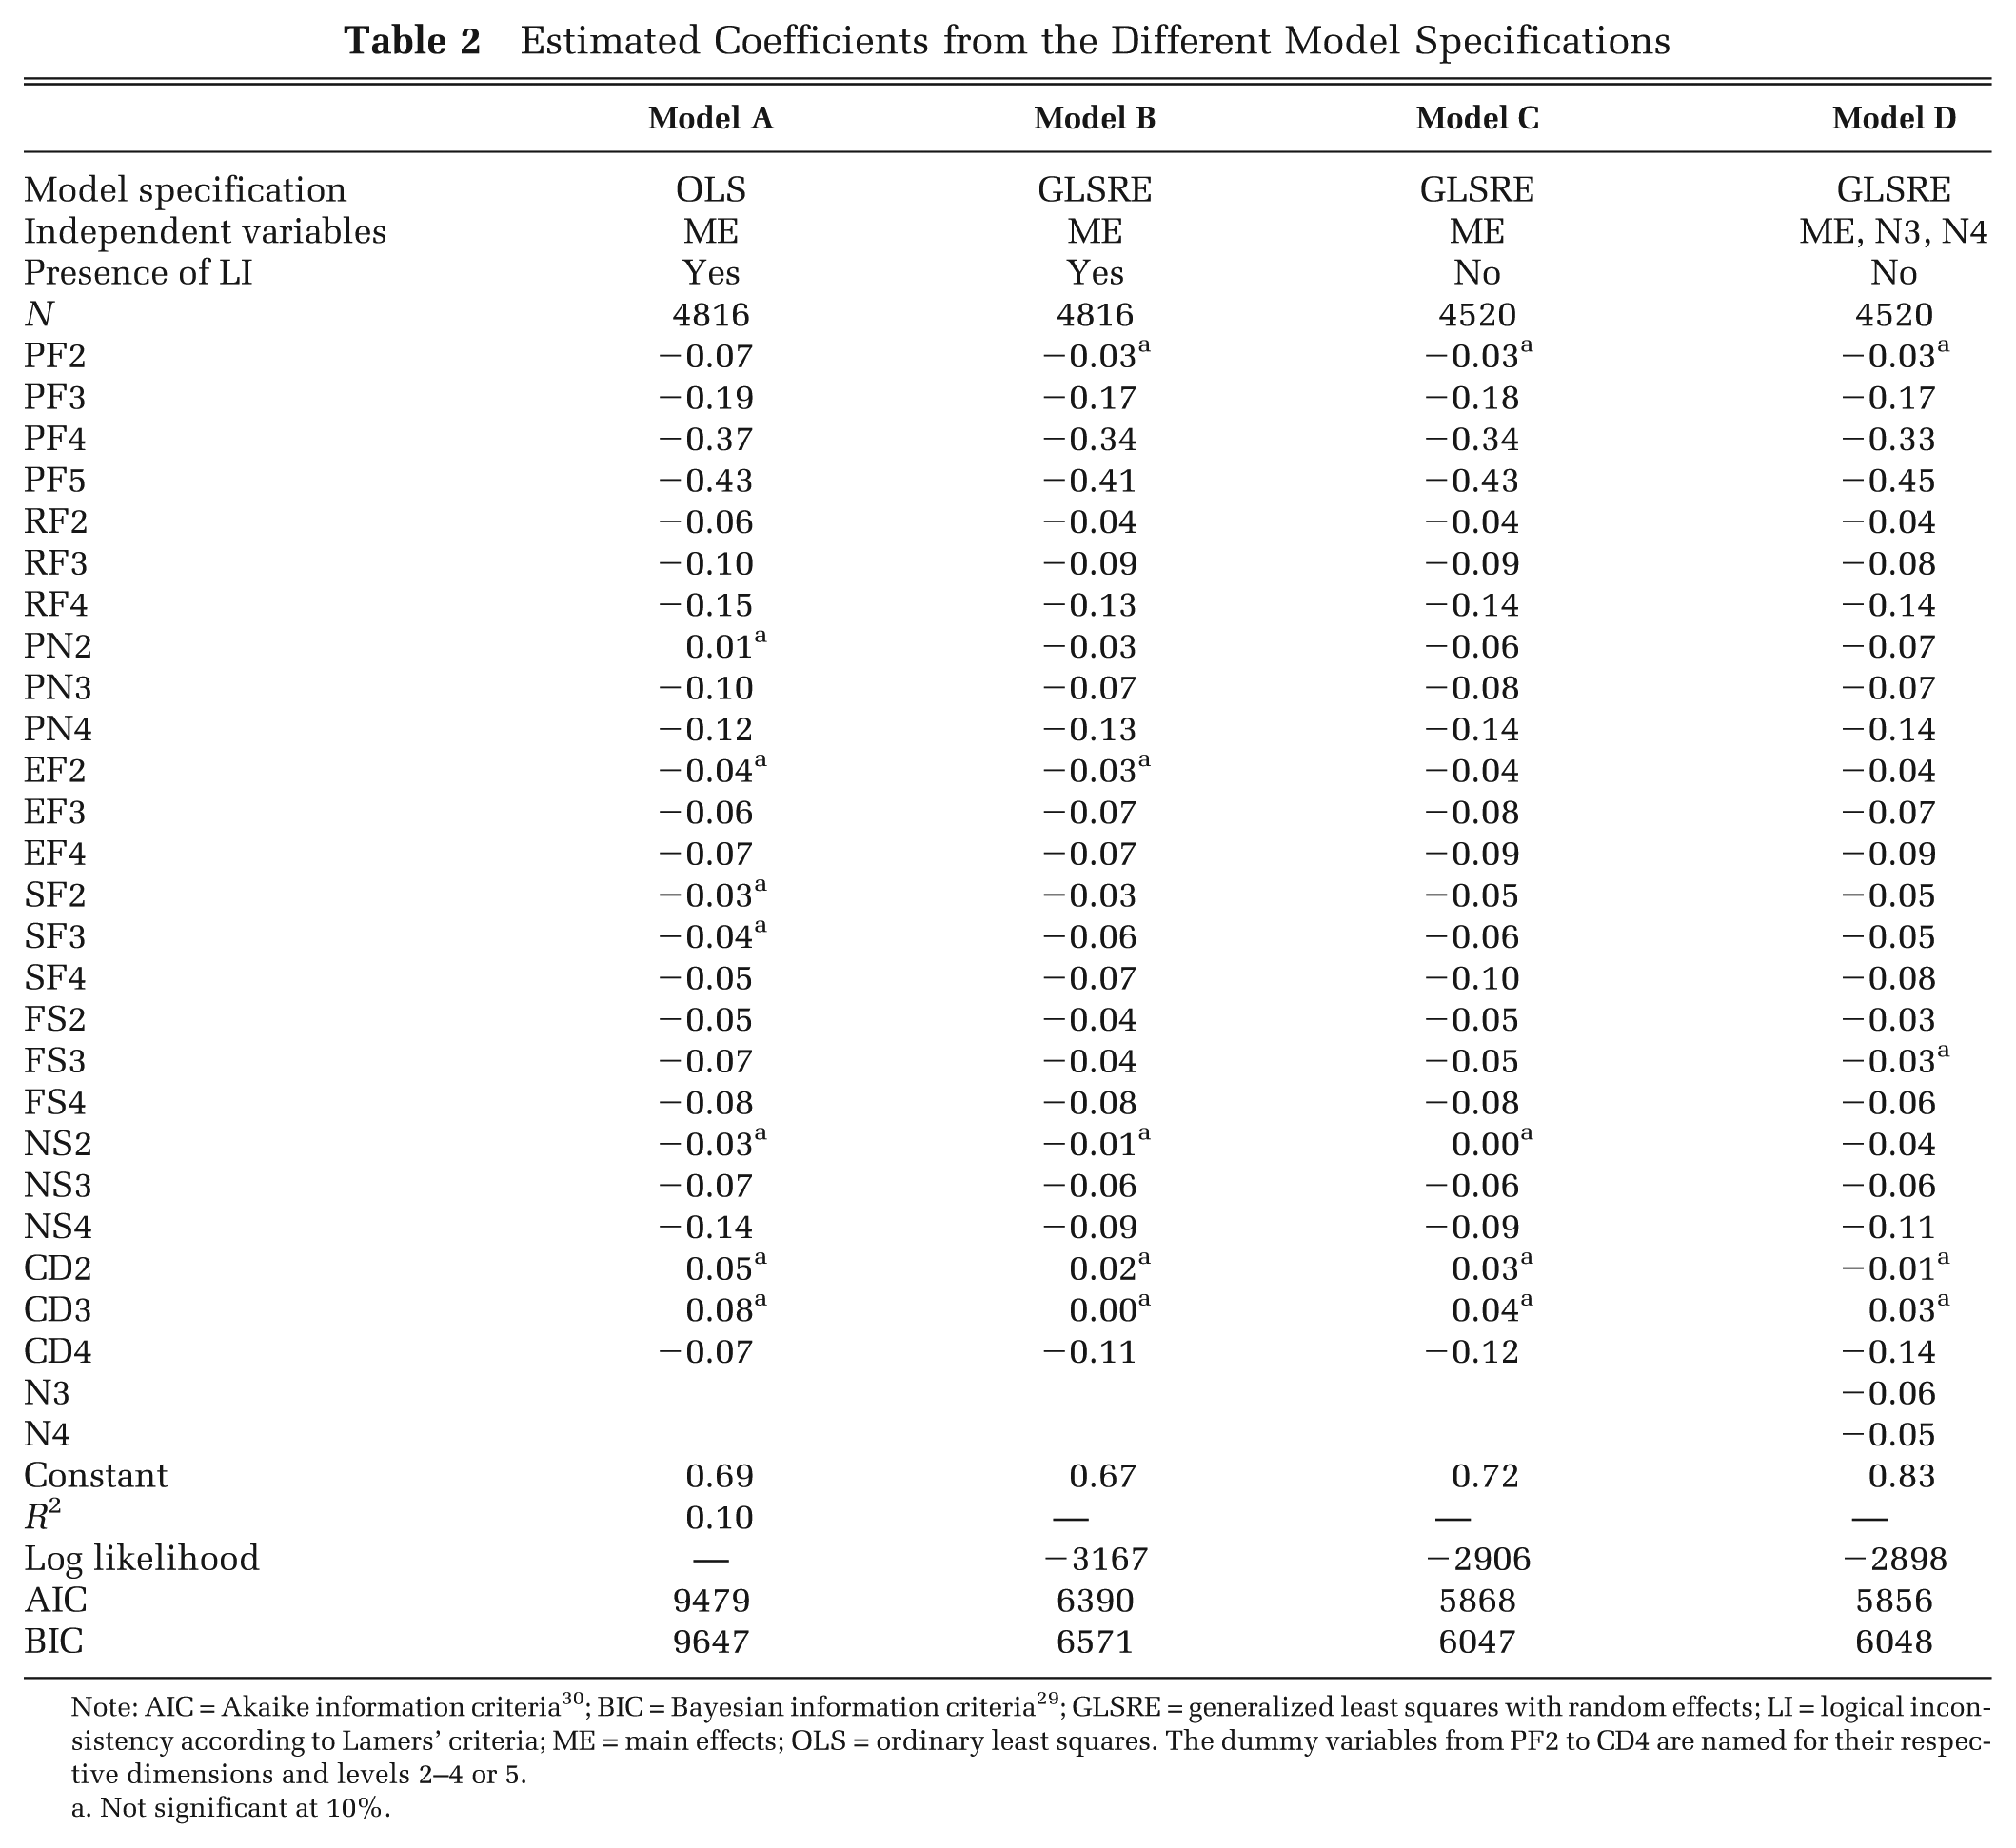
Note: AIC = Akaike information criteria 30 ; BIC = Bayesian information criteria 29 ; GLSRE = generalized least squares with random effects; LI = logical inconsistency according to Lamers’ criteria; ME = main effects; OLS = ordinary least squares. The dummy variables from PF2 to CD4 are named for their respective dimensions and levels 2–4 or 5.
Not significant at 10%.
The models with main effects only (model C) and main effects with N3 and N4 (model D) were selected for further analysis (Table 3) due to having a better constant, better model fit, and better consistency. In Table 3, model E is the parsimonious model for model C, and model F is the parsimonious model for model D.
Estimated Coefficients for Parsimonious Models for Models C and D
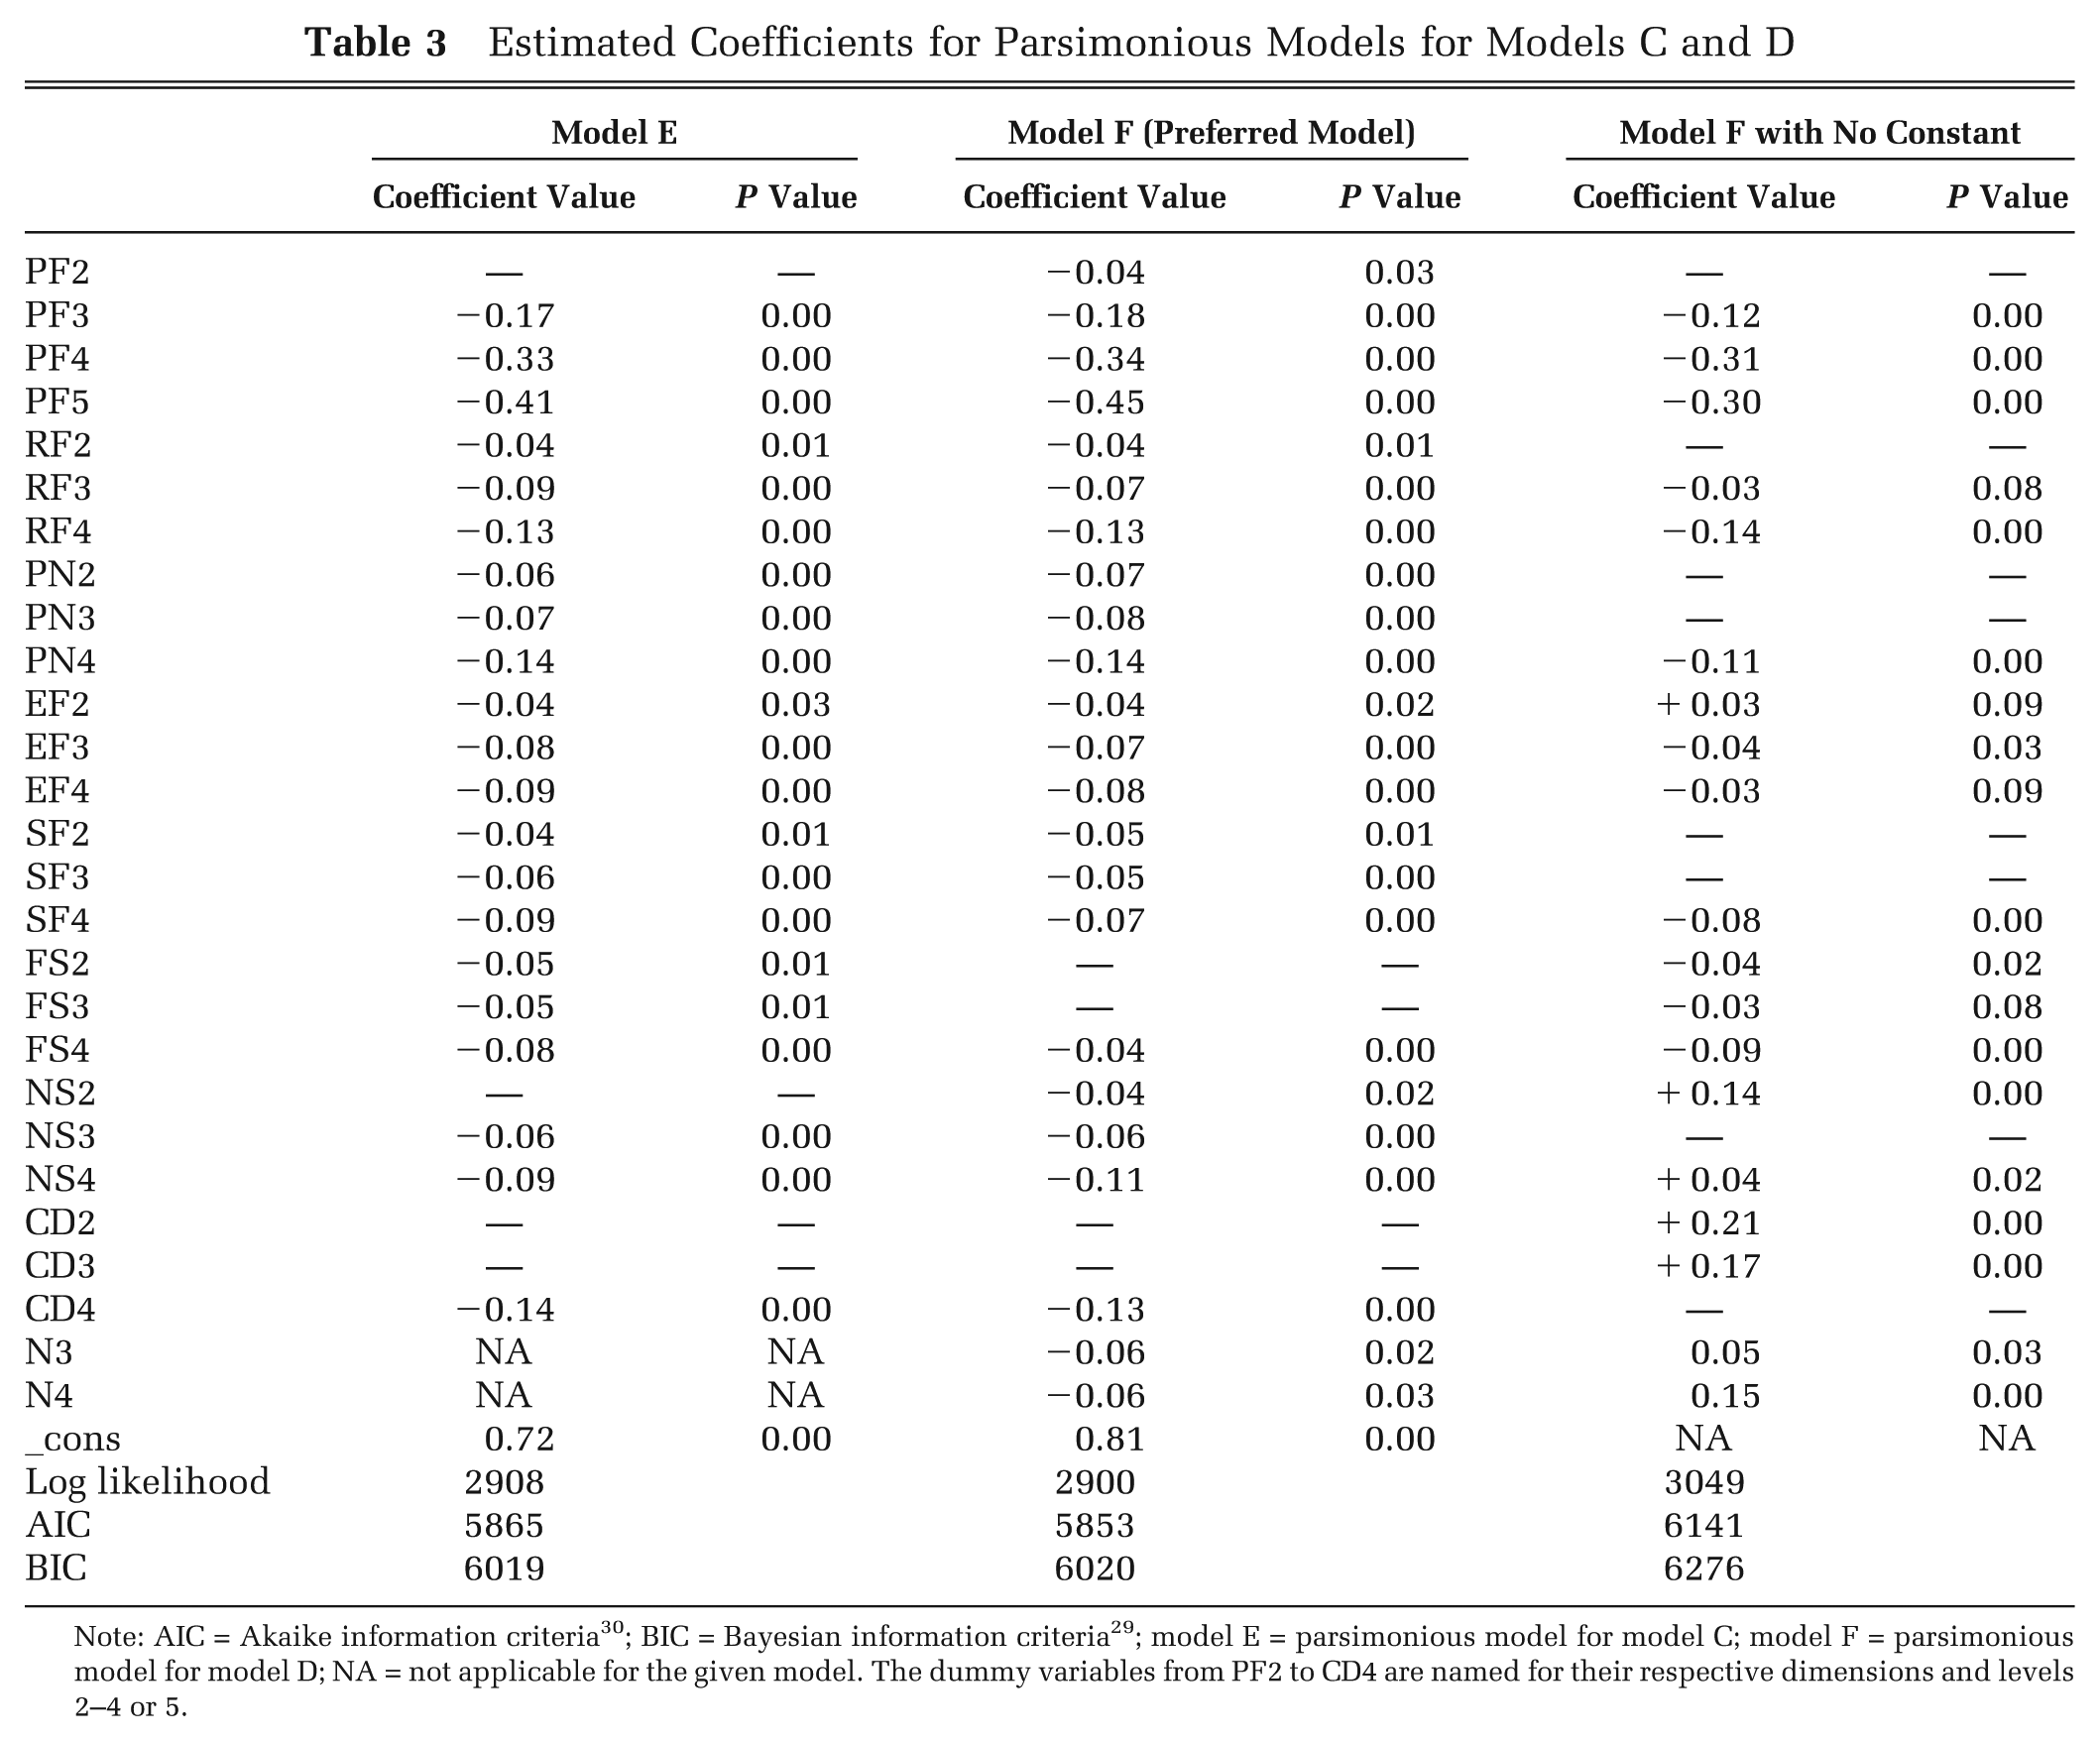
Note: AIC = Akaike information criteria 30 ; BIC = Bayesian information criteria 29 ; model E = parsimonious model for model C; model F = parsimonious model for model D; NA = not applicable for the given model. The dummy variables from PF2 to CD4 are named for their respective dimensions and levels 2–4 or 5.
In model E, due to nonsignificance, NS2 and CD2 and CD3 were excluded. The remaining coefficients are all consistent and are significant at the 10% level or better. Between C and E, the model fit values remained relatively stable. In E, which is the parsimonious model for C, all the coefficients are significant and consistent. The F model was also reduced via a stepwise process. The coefficients FS2, FS3, CD2, and CD3 were dropped due to having the highest P value in relevant steps. Both N3 and N4 coefficients were significant in the F model. Moreover, the F model was specified with no constant and presented in Table 3. The final E and F parsimonious models had 21 and 24 coefficients, respectively. The preferred model was chosen as F in terms of better model fit, more realistic constant (lesser disutility), and inclusion of at least one interaction term.
Consistent with prior expectations, in the preferred model (F) the entire main effects as well as N3 and N4 are negative. 32 The highest negative values were observed for physical functioning. The PF5, which was described as “very much trouble taking a short walk outside the house,” had the highest absolute value for any coefficient. Similarly, severe levels in role functioning (you were limited very much in pursuing your hobbies or other leisure time activities), pain (pain interfered very much with your daily activities), and nausea (you felt nauseated very much) recorded high absolute values.
Utility weight calculation was illustrated using health state 12333443 and using coefficients of the preferred model F. Utility weight = 0.81 – (0 + 0.04 + 0.08 + 0.07 + 0.05 + 0.04 + 0.11 + 0 + 0.06 + 0.06) ) = 0.30. All the values for the 8 dimensions are added together and subtracted from the constant. Finally, as the health state contained at least one level 4 and level 3, a further 0.12 was subtracted.
Figure 1 compares the coefficients from the Sri Lankan EORTC-8D preferred model (model F) with the coefficients from the preferred UK model. 10 The values from the episodic random utility model were the preferred model for the UK study. The absolute values for severe levels in physical functioning are much larger for the Sri Lankan than the UK sample. The UK values appear to have a larger absolute value than Sri Lankan values in emotional functioning and in fatigue and sleep disturbance. Nevertheless, social functioning had a much larger value in the UK than in Sri Lanka.
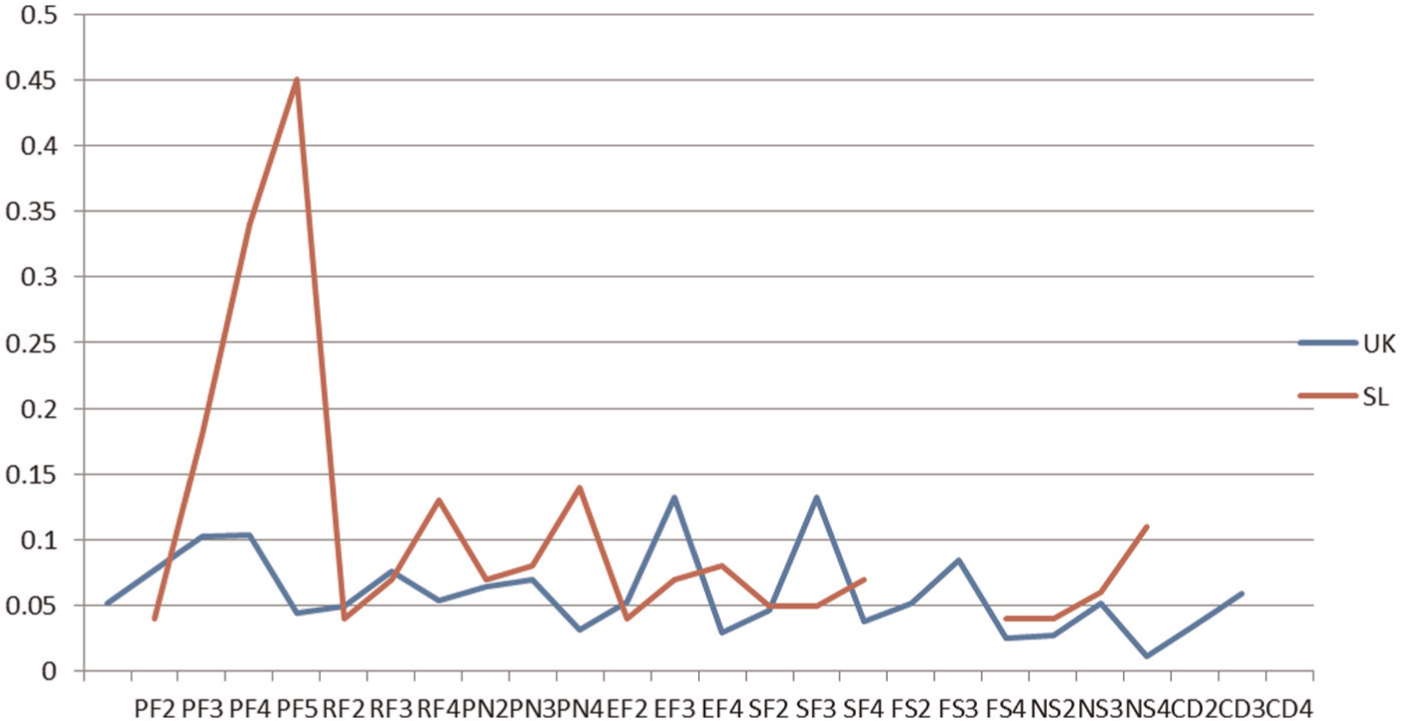
Comparison between the preferred model coefficients for Sri Lanka (SL) and the UK population.
Discussion
The present study developed a utility algorithm for EORTC-8D health states for Sri Lanka. It is the first health state valuation in Sri Lanka using a validated disease-specific, preference-based measure. The EORTC-8D utility weight valuation (preferred model F) used 4520 individual observations. The selected sample ensured that the preferences of tax payers and voters of Sri Lanka were used for the valuation. The final analysis excluded all participants with logically inconsistent valuations based on theoretical grounds. The ensuing coefficients were found to be substantially different from the UK model in some dimensions. 10
In the preferred model, worsening of physical functioning carried a larger value than worsening of other dimensions. The description of physical functioning in a health state was on “the ability to take a long walk.” This is similar to the observation in the EQ-5D-3L health state valuation in Sri Lanka, where the population placed a high value on remaining mobile. 18 The absolute value for PF5 (0.45) was substantially different from the UK value (0.104). 10 These health states were valued by a general population who had not necessarily had experience of cancer: They were also not told that the health states described referred to cancer. Thus, the Sri Lankan general population holds an extreme fear of being immobile or physically disabled. This might reflect the paucity of support for social disability in Sri Lanka, a feared inability to use public transport, a lack of confidence in the health system to provide rehabilitation, and, most of all, the probability that such disablement would render the making a livelihood difficult. This is an aspect of social support that Sri Lankan society needs to consider closely. In contrast, while most other domains had values close to those of the UK, emotional functioning, social functioning, and fatigue and sleep disturbance carried much more weight with the UK population. The ranges of the utility weights were 0.77 to −0.46 and 1 to 0.30 for Sri Lanka and the UK, respectively.
In choosing the preferred model, our approach was to find the parsimonious model, with all coefficients significant at P < 0.10. At the outset, random effect was selected over the OLS as it improved the model fit.; the inclusion of N3 and N4 interaction terms did not. However, the constant term increased with the inclusion of the interaction terms. In choosing between models E and F, we considered several factors including model fit, highest constant, consistency, and the number of significant coefficients. In comparing models E and F, model F showed better constant and lesser AIC and BIC values. In retaining only the significant coefficients, we observed a better model fit and larger constant. Moreover, as the EORTC-8D is a newly made preference-based measure, nonsignificant coefficients might reflect levels in some dimensions that are not important to the respondent valuing the classification system.
We used 11111111 as the comparator in the TTO exercise: This has a value of 1. The intercepts of our models imply the utility loss associated with any movement away from full health.8,33 In the majority of EQ-5D valuations published, the intercept had been allowed to vary from 0, 17 and, as Tsuchiya 8 explained, the intercept implies any deviation from full health. Our preferred model has a constant of 0.81, showing that any health state that deviates from full health starts here. Thus, the highest non–full health value an EORTC-8D health state can have is 0.81. This is significantly lower than the reported highest utility values for non–full health states and can have serious implications on the results of cost utility analysis. 17 This is also substantially lower than the EQ-5D-3L constant (0.848) valued from the same sample of people. 18 Unfortunately, we could not compare the constant of the UK EORTC-8D model as the UK model did not allow a constant. 10 Because of the low constant, utility decrement using the Sri Lankan EORTC-8D algorithm could be more pronounced in a non–full health state than using the UK algorithm. However, there is also a possibility that EORTC-8D utilities would be more sensitive to changes in better health states.
As EORTC-8D health states were valued only once before, it is important to look at the present valuation in a validation perspective. 10 The ability of the participants to distinguish between levels of a dimension in relation to health-related quality of life is important. All models specified CD2 and CD3 (you were constipated and/or had diarrhea a little bit and quite a bit) as insignificant. Both model E and F were required to exclude CD2 and CD3 on the basis of insignificance. The reason could be that the participant did not mind the worsening of constipation and diarrhea of some degree. Having “a little” constipation or diarrhea might not interfere with health-related quality of life. This could be important in the further development of this new preference-based measure (EORTC-8D), as developers might consider having fewer levels in some dimensions than the present number of levels. Another noteworthy point is the only remaining significant interaction term being N4. All other interaction terms, including N4/5, were excluded based on insignificance. It is also important to have consistent values for preference; that is, values should decrease with worsening health. In the present analysis, all significant main effects were consistent. However, the observations were different for the UK study, where inconsistencies were observed for physical functioning and nausea, which could be due to different population having different preferences.
In cancer research, lack of disease-specific, preference-based measures prevents the collection of better cost-effectiveness evidence. Moreover, in low and middle income countries (LMIC), most condition-specific, preference-based measures valued so far did not follow correct protocol in the valuation exercise. 16 Often the preference was estimated for their own disease state, rendering the estimated value unusable for resource allocation decisions. 16 In contrast, agencies like the National Institute for Clinical Excellence advise having general population preferences for health states derived from preference-based instruments. Similarly, the present valuation of EORTC-8D, which was derived from EORTC-QLQ-C30 using valid statistical methods by Rowen and others, 10 followed standard health state valuation methods developed in the measurement and valuation of health study. In fact, the valuation of EORTC-8D health states was conducted parallel to the Sri Lankan EQ-5D health state valuation using the same participants. 19 However, the results of the Sri Lankan preferred model warrant further validation and examination of EORTC-8D in different socioeconomic backgrounds.
Cost-effectiveness studies using QALYs derived from EORTC-8D as outcome measures can provide much-needed evidence for decision makers and aid agencies to use in effectively allocating limited resources in cancer care in Sri Lanka. There are no other reported health state valuations using population samples, validated preference-based measures, and valid methods in South Asia. 16 Thus, neighboring countries can benefit from the present algorithm to objectively evaluate their decisions in health care. Until countries like India, Pakistan, Nepal, and Bangladesh develop their own utility values, Sri Lankan utility values could be more appropriate for health economic evaluation, compared with utility values of higher income countries, due to closer cultural backgrounds and similar socioeconomic and health experiences. 17
Limitations
The data collection was undertaken in 4 randomly selected districts of Sri Lanka. This did not include the north or east of the island, which prevented representation of the Tamil ethnic group in the sample. Logistic constraints prevented the use of trilingual data collectors to conduct interviews in Tamil, which constrained inclusion of Tamil-speaking people even in the western and central parts of the island, where the data collection was centered, thus limiting the sample to Sinhalese and a small proportion of Muslims. As the sample also consisted of rural parts of the island, females formed the major portion of the sample, such that demographics of the sample deviate from national values. Logistic constraints prevented us from determining test-retest reliability of our data. Of the expected 5816 observations, only 4520 preference observations were used in the analysis.
Conclusions
Preference weights for EORTC-8D health states were derived for Sri Lanka. These weights should facilitate economic evaluation of cancer-related interventions in the Sri Lankan health system. In the preferred model, worsening of physical functioning had the highest absolute decrement. The coefficients for main effects generally had larger values than the comparable UK model. The ability to use EORTC-QLQ-C30 and derive utility values for the EORTC-8D preference-based measure will be useful for health service decision makers as well as for clinicians, because a single instrument will allow measurement of health-related quality of life as well as utility. The availability of this instrument and of country-specific utility weights is timely, in that it will enable evaluation of the cost-effectiveness of new cancer interventions currently being introduced in Sri Lanka and thus will inform decisions made by government and aid agencies.
Footnotes
Acknowledgements
The authors thank Dr. Donna Rowen for her advice and permission to use EORTC-8D in Sri Lanka.
This work was funded by a Griffith University Post Graduate Research Scholarship and Griffith University International Postgraduate Research Scholarship. The data collection was partly funded by a research grant from the Population and Social Health Research Programme, Griffith University.
The authors have declared no conflicts of interest.