
Abstract
In many patient encounters, clinicians face the dual challenge of formulating a judgment of patient risk for some adverse outcome and making a yes or no decision regarding a particular risk-reducing treatment option; for example, judging a hospital patient’s risk for acute deterioration and the decision to alert the hospital’s rapid response team. When asked to review the same set of several patient profiles, clinicians may show variation in the degree to which their quantitative judgments of patient risk are correlated with their yes or no decisions to take a specific risk-reducing action. The term “cohesion” is introduced to describe how well these two related cognitive responses (one quantitative judgment, and one dichotomous decision) correlate or hang together within an individual. In this sense, cohesion implies that, for a given clinician, higher likelihoods of taking risk-reducing actions will co-occur with higher judgments of patient risk, whereas lower likelihoods of taking risk-reducing actions will co-occur with lower judgments of risk. Individual differences in cohesion may contribute to practice variation among clinicians, or at least provide insight into the cognitive origins of such variation. In this article, I develop and apply a novel form of Brunswik’s Lens Model and the lens model equation (LME) to decompose these correlations to gain an understanding of such individual differences in the cohesion of clinical risk judgments and treatment-related decisions.
Over the years, the LME has evolved as a useful tool to help researchers understand judgments in various contexts. It has proven particularly useful in studying expert judgment and decision making in health care.1-13
The remainder of this article is laid out as follows: First, Brunswik’s Lens Model and some key developments in the LME over several years are reviewed. Second, the bifocal lens model and equation, a modification that targets the linkage between judgments of risk and related decisions, is introduced. Third, the bifocal lens model equation is applied to data from 2 studies to illustrate how it can provide insight into the cognitive sources underlying individual differences in the cohesion of clinical risk judgments and treatment-related decisions. Finally, how this new approach can be used to reveal performance variation in judgment tasks and the generality of the equation are discussed.
The Lens Model
Brunswik’s Lens Model is a general approach to the analysis of an individual’s judgments made under conditions of uncertainty where outcomes are probabilistically related to perceptible cues in the environment. 14 This model is useful in describing a clinician’s use of clinical variables (cues) in forming judgments and the importance of these cues to their judgment, and facilitates comparison of the relationship of cues to criterion with that of cues to clinical judgment.
Referring to Figure 1, Xk denotes the clinical variables (cues) that vary in the degree to which they relate to an actual clinical outcome (criterion). Y refers either to the criterion of interest (on the left side) or to judgments (on the right side). The subscripts e and s designate respectively the ecology (“real world”) and the subject (i.e., the study participant). The hats (^) denote predicted values of Y (either criterion, or judgments) and are usually obtained from linear regression models of the respective “sides” of the lens. Cues are related to criterion values via some weight (wek) and correspondingly to the subjective judgments (wsk). These weights are typically standardized regression coefficients; thus, the model allows for the cues to be inter-correlated. Clinical prediction or diagnostic rules, derived in epidemiology using multiple regression techniques, correspond to the ecological side of the lens model.
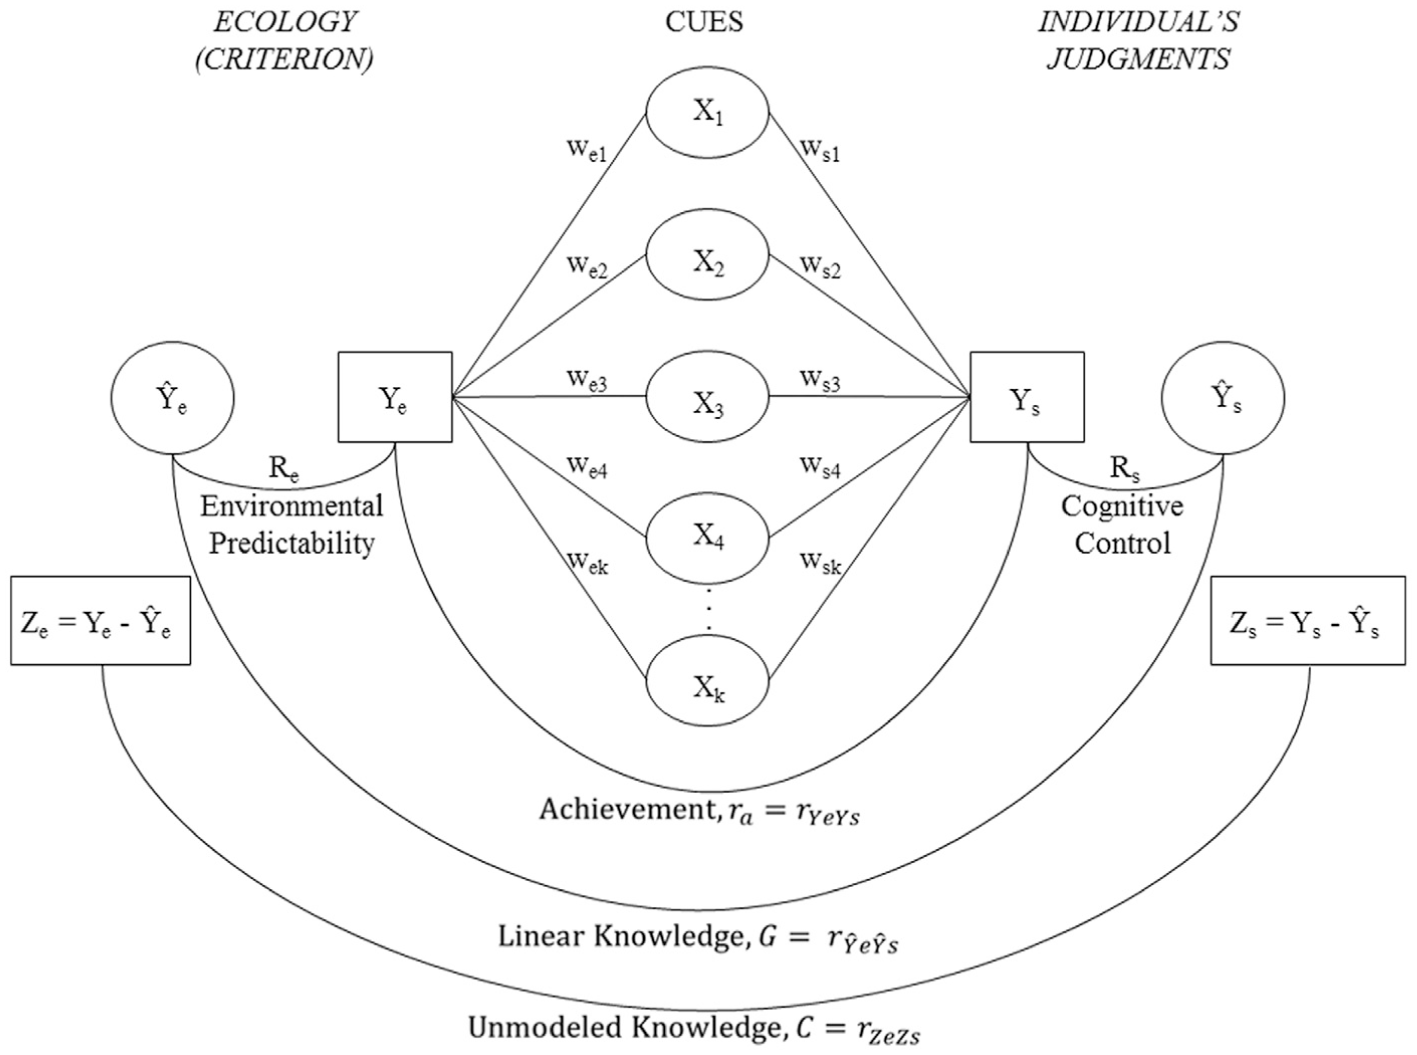
Brunswik’s Lens Model. See text for details.
The term ra is the correlation between the criterion values (Ye) and the individual clinician’s judgments (Ys) and is referred to as “achievement” or accuracy. For example, the risk for coronary heart disease for each of a sample of patients based on the Framingham risk equation (criterion) and the clinician’s judgments of each patient’s risk for coronary heart disease, could be quantified with ra. The correlation between the predicted values
The Lens Model Equation
The accuracy of judgments can be decomposed using the LME that combines two linear regression models: one of the relationships between the ecological criterion and the cues, and another between the individual’s judgments and the cues, both fit to the same set of cases.15,16
The LME defines judgment accuracy, or achievement, as the correlation between judgments and criterion values, ra, and then descriptively decomposes achievement into the 4 components: G, Re, Rs, and C, all of which are themselves, correlations. The components are related in the classic equation:
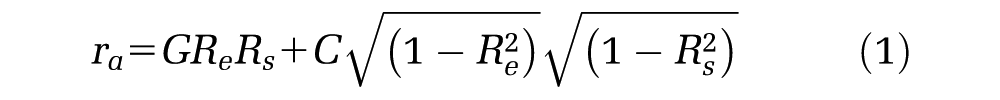
wherein each term represents a correlation:
Cooksey
17
and Stewart18,19 extended the LME to examine the relationships between dichotomous decisions and a dichotomous criterion applying logistic, rather than linear, regression. Unlike linear regression, in which the correlation between predicted values and residual values resulting from a given model is zero, this is not the case with logistic regression, and so the logistic LME requires three C terms to represent the relationship between the two regression models. Stewart18, 19 showed that Re needs to be replaced by the ratio of the computed standard deviations of predicted values (probabilities) to the standard deviation of actual (dichotomous) values
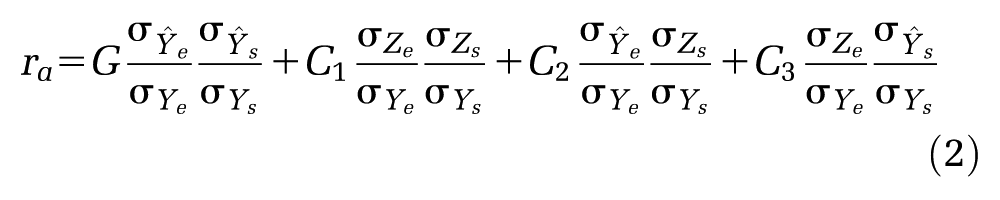
where C1 is the correlation between the residuals of the 2 models,
In the context of studying interpersonal conflict, Naylor and Schenck 20 and Brehmer and Hammond 21 adapted the linear LME (Equation 1) to examine the amount of agreement between two individuals judging the same set of cases by replacing the ecology regression equation with a regression equation relating the second individual’s judgments and cues:

In this form, ra now refers to agreement between two individuals; R1 and R2 represent the cognitive control of the first and second individual, respectively; G may be interpreted as the amount of similarity between the judgment policies of the two individuals, and C is the similarity in unmodeled aspects of their policies that contribute to their agreement. Beckstead et al. 8 used this form to examine agreement among physicians judging the benefits of cardiac rehabilitation for the same set of patients.
The Bifocal Lens Model and Bifocal Lens Model Equation
When an individual provides two related responses (one quantitative judgment of risk and one dichotomous decision to take a risk-reducing action) to the same set of cases, it is possible to examine the correlation, or cohesion, between these two sets of responses. This type of dual-response task can be represented with the Bifocal Lens Model shown in Figure 2.
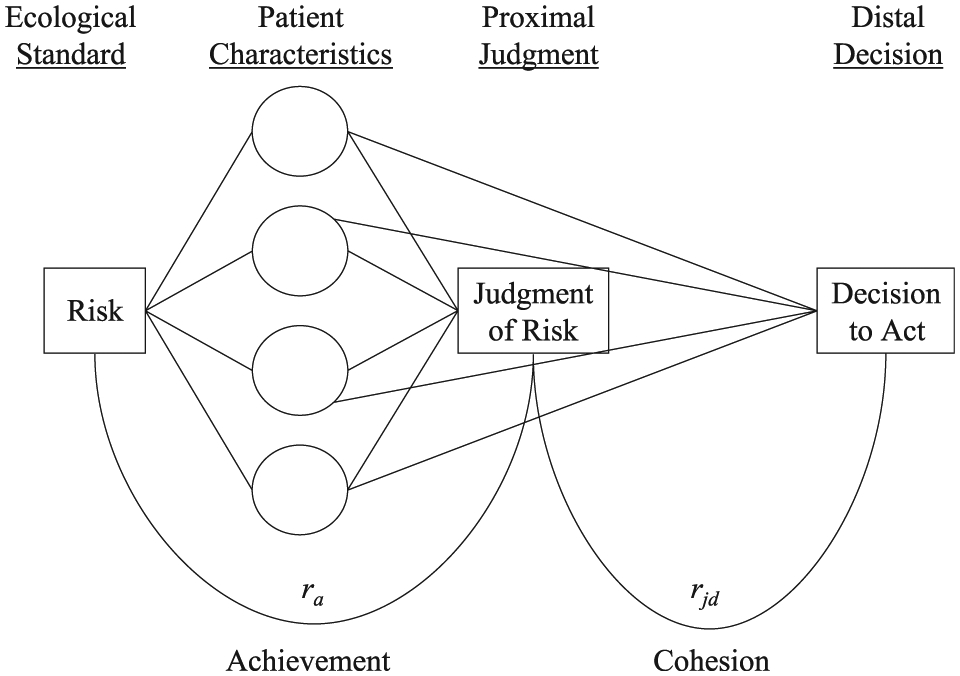
The Bifocal Lens Model in clinical decision-making context. See text for details.
Consistent with the classic Lens Model, the ecology is represented on the left-hand side and the subjective responses from the clinician are on the right-hand side. Towards the center are the cues, in this case a set of patient characteristics. The lines originating from the cues converge to the ecological criterion (Risk) and to the subjective judgment of risk, in much the same way that light passing through a lens can be focused at a point lying on either side. These lines represent the influence of the cues and are typically standardized coefficients estimated from multiple regression equations. Achievement (ra) or the accuracy of the individual’s judgments compared with the ecological criterion is represented by the arc in the lower left-hand side of the figure and is the correlation coefficient decomposed in the classic LME.
In the Bifocal Lens Model, the metaphor is extended to encompass two subjective focal points on the right-hand side, one proximal and one distal. As the figure illustrates, both the proximal judgment of risk and the distal decision to act are modeled on the same set of cues via linear and logistic regression, respectively. Cohesion (rjd), or the correlation between the two sets of responses from an individual, is represented by the arc connecting judgments of risk and decisions to act in the lower right-hand side.
Using the interpersonal conflict form of the LME (Equation 3) that links the judgments from two individuals as a point of departure, replacing the quantitative judgments from individual number 2 with a second set of dichotomous responses (i.e., decisions) from individual number 1, and incorporating modifications for a logistic regression (Equation 2) to handle this second set of dichotomous responses, we have the Bifocal Lens Model Equation (BiLME):
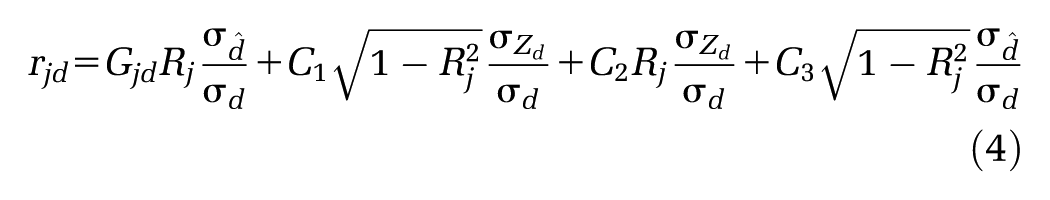
In this form, cohesion, rjd—the correlation between a clinician’s judgments (j) of patient risk and decisions (d) to take a risk-reducing action—is a function of internal policy matching (Gjd) or the extent to which the clinician used the same cue-weighting strategy when formulating these two responses, the amount of cognitive control in the clinician’s judgment policy (Rj), and decision policy,
In the traditional linear forms of the LME, (Equations 1 and 3), the correlation between the two sets of residuals, is simply C. In the logistic form of the LME (Equation 2), C1 is defined as the correlation between the two sets of residuals. Whether discussing C or C1, this term may reflect common reliance on variables not included in either regression model.
Unique to the BiLME, however, the correlation between the two sets of residuals can also represent important psychological aspects of the relationship between the individual’s judgments and decisions. Much like a partial correlation coefficient, C1 represents the relationship remaining between an individual’s judgments and decisions when the influences of the cues have been partialed out (removed) from both via regression. That is, in the BiLME, C1 is a component of cohesion that is unrelated to systematic cue utilization. For instance, a clinician may have a tendency to decide “take action” following risk judgments that are above a certain subjective value and to decide “take no action” following judgments that fall below that same value. In the BiLME, one interpretation of C1 is that it reflects the extent to which, having formed a judgment based on the cues, the clinician simply compares them to a subjective threshold value in order to make a decision. It may also be the case that C1 is unrelated to risk judgment accuracy (i.e., achievement, ra).
Also, because the two regression equations forming the BiLME (one modeling risk judgments, and one modeling decisions to act) are based on responses from the same clinician, it is expected that C1 will be larger than in traditional LME applications, where the two regression equations are based on data originating from two independent sources (e.g., ecology and judge in the standard Lens Model, or, judge 1 and judge 2 in the interpersonal conflict form). Historically, in traditional LME studies, the correlation between residuals tends to be near zero (0.04; 95% CI, 0.02 to 0.06). 22
Applications
Having laid out the development and rationale for the BiLME, data from two studies are presented in which the cohesion between judgments of patient risk and decisions to take risk-reducing actions is examined to illustrate its usefulness. The first study involved registered nurses (RNs) who judged the risk of patients experiencing critical events during hospital stays and decisions to alert hospital rapid response teams. The second study examined nurse practitioners (NPs) who made judgments of patient risk for developing coronary heart disease and decisions to refer patients to cardiologists. In both studies, individual differences in cohesion (rjd) were examined in relation to BiLME parameters (Rj, Rd, Gjd and C1) and in relation to judgment accuracy (ra).
Both studies used representative designs, with the intent to sample the substance of the ecology (i.e., patient profiles) so that it retains its realistic content and feel from the participant’s point of view. Hammond discusses the difficulty of doing so and suggests that one approach is to retain the distributions and intercorrelations among cues that the participant would ordinarily encounter. 23 The advantage here comes in the form of greater generalizability. In both studies, following Wigton’s suggestions, published distributions and correlations of the cues and criterion (described in the Method sections below) were used to construct a population of patient cases. 24 After constructing such a population, cases were randomly selected for presentation. The means, standard deviations, and correlations among cues and criterion in the sample of cases were checked for consistency with those reported in the referenced articles before presentation to participants.
Study 1: Judging Risk for Acute Deterioration and Decision to Alert Rapid Response Teams
Method
Participants
Twenty-five RNs participated in this online study.
Materials
Participants read brief descriptions, or profiles, of 100 hypothetical (and representative) patients admitted to the emergency room complaining of chest pain. Each description presented 7 pieces of information (cues): heart rate, respiratory rate, oxygen saturation, respiration support, level of consciousness, urine output in the past 4 h, and systolic blood pressure. These cues have been shown to be important predictors of the clinical condition of hospital patients and have been incorporated into the modified early warning score (MEWS), a risk index for acute deterioration and critical events, such as cardiopulmonary arrest, unplanned admission to the ICU, and death. 25 The means, standard deviations, and correlations among cues and criterion in the sample of profiles were then checked for consistency with those reported by Subbe et al. 25 Patient values on the MEWS served as the ecological standard for risk (as a proxy for actual dichotomous outcome) and permitted calculation of ra.
Procedure
Each patient profile was presented on a separate screen. For each of the 100 profiles, participants provided a subjective judgment of how likely (0% chance to 100% chance) they believed the patient was to deteriorate or to experience an adverse critical event over the next 12 h and indicated whether or not they would alert the hospital’s rapid response team to monitor the patient. Completion of the task took 33 min on average (range, 25 to 52 min).
Data Analysis
Data were analyzed for each participant separately using multiple linear and multiple logistic regressions. BiLME parameters and judgment accuracy (ra) were calculated for each participant. Fisher’s r-to-Z transformation was applied to all correlation coefficients before aggregation, except where noted.
Results
Data from 2 participants were discarded; 1 because the participant only completed 74 of the 100 profiles, and the other because the participant gave only 4 alert decisions, all based on the same value of a single cue, which prevented computation of the parameter covariance matrix in the logistic regression model. This left n = 23 for analysis. Of these, 20 were female. The average age of participants was 36.9 y (SD, 11.5 y) and participants had been in practice as a nurse, on average, 10.5 y (SD, 9.9 y).
The various BiLME parameters (rjd, Gjd, Rj, Rd, and C1) as well as judgment accuracy (ra) are shown for each participant in Table 1. As the BiLME focuses on a new aspect of the Lens Model, that is, the relationship between judgments and decisions based on the same cases (rjd), I felt it important to first comment on the accuracy (ra) of the participants’ judgments in order to establish comparability with previous research involving the traditional LME before discussing decomposition of rjd. In a meta-analysis of 86 studies that employed the LME between 1954 and 2007, Karelaia and Hogarth 22 reported that average judgment accuracy was 0.56 (95% CI, 0.53 to 0.59). In a second meta-analysis of 35 studies employing the LME conducted by Kaufmann and Athanasou 26 , judgment accuracy was reported for 9 studies in medicine (mean ra = 0.40; 95% CI, 0.31 to 0.59). Three additional studies (not included in either meta-analysis) involving nurses or NPs found average judgment accuracy values of 0.42 9 , 0.553 10 , and 0.675. 12 In the current study, judgment accuracy (ra) ranged from 0.474 to 0.851, with an average of 0.682. Thus, judgment accuracy seems comparable to that found in previously published studies.
Results of Study 1; MEWS Task

MEWS, modified early warning score; rjd, cohesion (the correlation between judgments and decisions); Gjd, internal policy matching; Rj is cognitive control over judgments; Rd, cognitive control over decisions; C1, correlation between the residuals from the two regression models; and ra, judgment accuracy (the correlation between judgments and the ecological standard).
It is evident from inspection of Table 1 that there was notable variation in all the model parameters across the participants. The average cohesion (rjd) was 0.765 (SD, 0.210). The C1 coefficients were large, as expected, because the two sets of responses upon which they were based came from the same source (mean, 0.477). They also showed considerable variation (SD, 0.202) across participants. The average cognitive control parameters were reasonable (Rj = 0.783; Rd = 0.774) although slightly lower than those reported by Karelaia and Hogarth (mean, 0.80; 95% CI 0.79 to 0.82) and by Kaufmann and Athanasou (mean, 0.81; 95% CI, 0.76 to 0.86). The average Gjd = 0.844 fell slightly above the upper bound reported in the studies reviewed by Karelaia and Hogarth (mean, 0.80; 95% CI, 0.76 to 0.83) and Kaufmann and Athanasou (mean, 0.70; 95% CI, 0.64 to 0.77). Note, however, that Gjd in the current study refers to the correlation of predicted values from two regression equations originating from the same individual (i.e., internal policy matching), and so one might expect it to be larger than that found in traditional LME studies.
To examine individual differences in cohesion as functions of BiLME parameters (Gjd, Rj, Rd, C1) and judgment accuracy (ra), two approaches—each defensible but neither perfect when correlation coefficients are treated as data points—were used. Spearman’s correlation, rho, was calculated among the raw values and also Pearson’s correlation, r, with Fisher’s r-to-Z transform. Both results are shown in Table 1. The two approaches concur that individual differences in cohesion were most strongly related to differences in C1, somewhat less related to internal policy matching Gjd, and only modestly related to cognitive control (Rj, and Rd). This pattern of results suggests that variation in cohesion, across individuals, was due to factors other than differences in cue utilization. Interestingly, individual differences in cohesion showed the lowest correlations with differences in accuracy (ra). In other words, across individuals, cohesion was relatively independent of accuracy.
Discussion
This study is the first to employ the BiLME to examine individual differences in the cohesion between clinical judgments of patient risk and decisions to take risk-reducing action. While differences in cohesion were correlated with all of these parameters to some degree, the strongest relationship was found to be with individual differences in C1, the correlation between the residuals of the modeled judgments and the modeled decisions, rather than between the two policies themselves (Gjd). Taken at face value, this suggests that decisions were linked to judgments for reasons orthogonal to cue utilization. As this finding seemed somewhat counter-intuitive, one might question whether it may be unique to the particular judgment or decision task employed (i.e., risk for acute deterioration and decision to alert rapid response teams) and limited to the population of participants sampled (i.e., RNs). To address these concerns, data from a second study that involved a different population of participants (NPs) and a different judgment/decision task are presented.
Study 2: Judging Risk of Developing Coronary Heart Disease and Referrals to Cardiologists
Method
Participants
Thirty NPs participated in this pencil and paper survey.
Materials
One of the most widely circulated prediction rules for coronary heart disease (CHD) is based on the ongoing Framingham study. Eight patient characteristics—gender, age, smoking status, total cholesterol level, high-density lipid level, systolic blood pressure, and whether or not the patient has been diagnosed with diabetes or left ventricular hypertrophy—represent an optimal set of risk factors. These were selected from a larger set of potential risk factors using stepwise selection procedures (see Anderson et al. 27 for details) and served as cues. Scores on this risk index served as the ecological standard. A representative sample of 70 patient profiles was constructed for presentation using the same approach as in Study 1. The means, standard deviations, and correlations among cues and criterion in the sample of profiles were then checked for consistency with those reported by Anderson et al. 27 before presentation.
Procedure
The 70 patient profiles were presented, one per page, in booklets. The participants provided a subjective estimate of how likely (0% chance to 100% chance) they believed each patient was to develop CHD in the next 10 y, and were then asked if they would refer the patient to a cardiologist, (yes or no). Completion of the task took an average of 32 min (range, 20 to 47 min).
Data Analysis
The methods of data analysis were identical to those described in Study 1.
Results
Data from 6 participants were excluded from analysis: 2 participants failed to complete all 70 profiles, and 4 made no referrals. This left n = 24 for analysis. The average age of participants was 48.2 y (SD, 60.8 y), 22 were female, and participants had been in practice as an NP, on average, 8.9 y (SD, 6.3 y).
The BiLME parameters (rjd, Gjd, Rj, Rd, and C1) as well as judgment accuracy (ra) are shown for each participant in Table 2. There was considerable variation in all of the parameters across the participants. The average accuracy (ra) of participants was 0.732, which is comparable to previously published LME studies. Cohesion (rjd) averaged 0.721. The two measures of cognitive control were high, on average (Rj = 0.873, Rd = 0.875). The average value of Gjd was also high, 0.828. Although C1 values were high (mean, 0.260) compared with traditional LME studies, they were significantly lower than those in Study 1 (t = 40.807; df = 45; P < 0.001; η2 = 0.339). [η2 is an index of effect size. It is the proportion of variance in the dependent variable explained by the independent variable. Cohen 28 provides guidelines for interpretation: small (0.01) medium (0.06), and large (>0.14)].
Results of Study 2; CHD Task
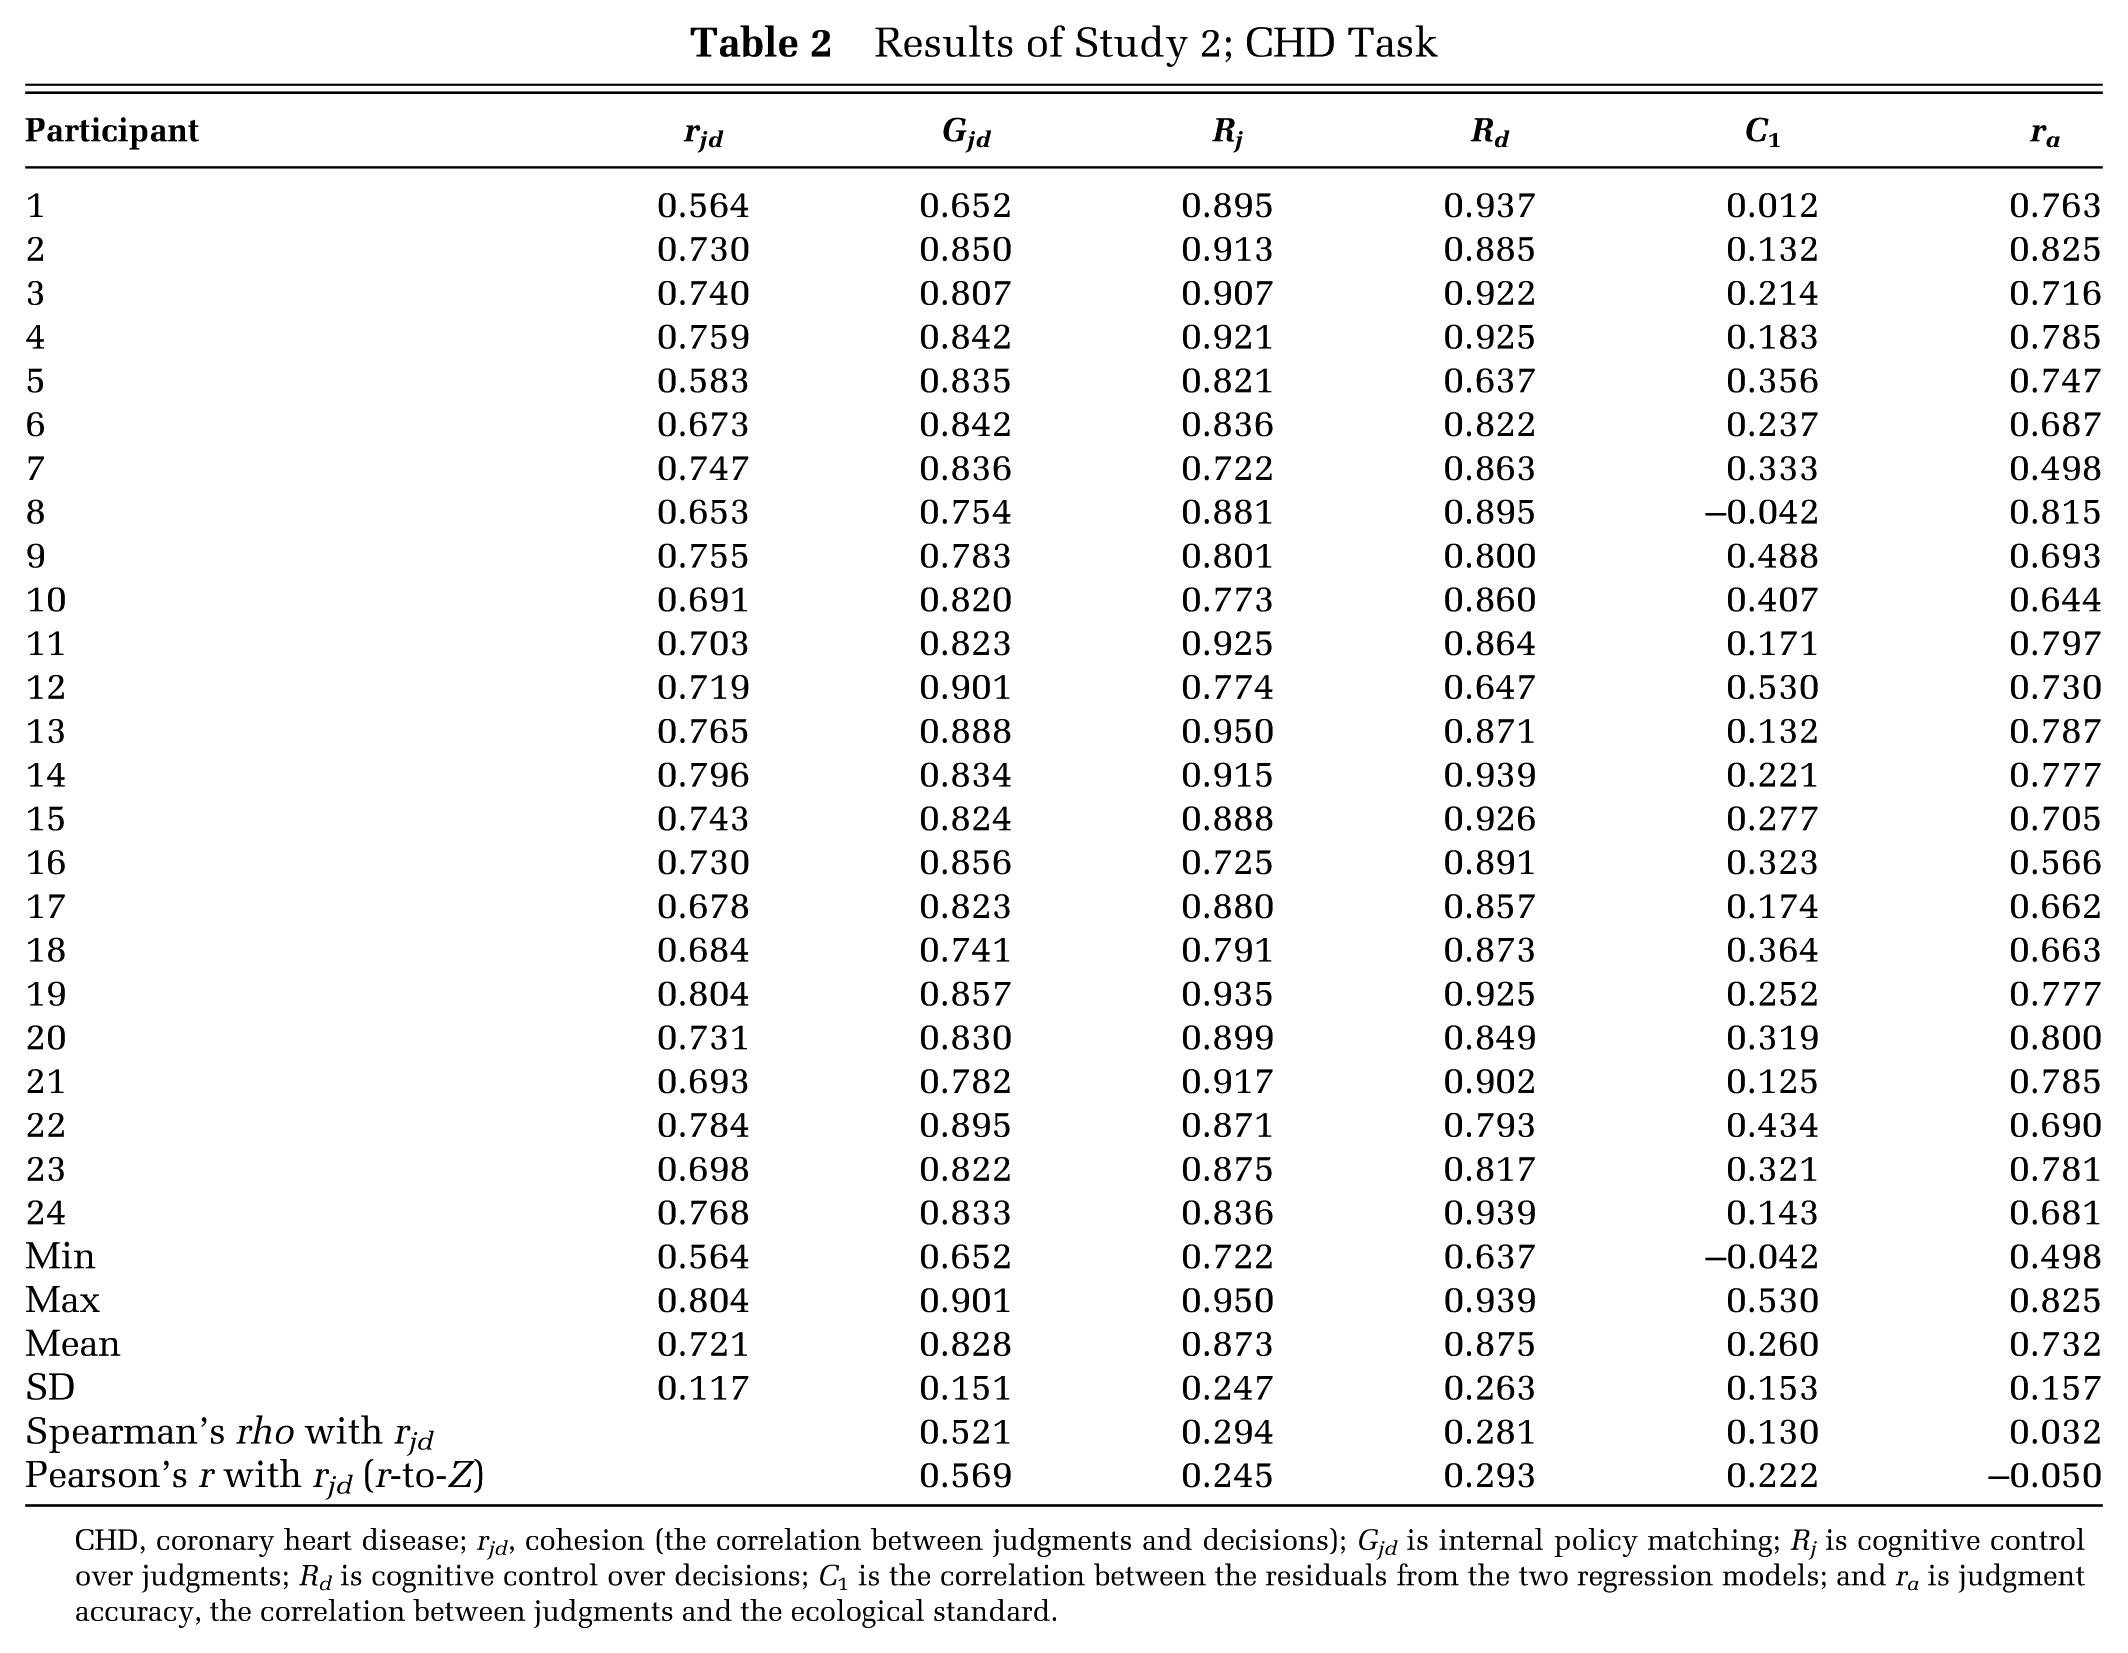
CHD, coronary heart disease; rjd, cohesion (the correlation between judgments and decisions); Gjd is internal policy matching; Rj is cognitive control over judgments; Rd is cognitive control over decisions; C1 is the correlation between the residuals from the two regression models; and ra is judgment accuracy, the correlation between judgments and the ecological standard.
In contrast with the results from Study 1, the individual differences in cohesion (rjd) seen here were most strongly related to differences in internal policy matching (Gjd) and weakly correlated with differences in C1, the correlated residuals from the two regression models (see Table 2). Again, individual differences in cohesion were nearly independent of differences in judgment accuracy (ra).
Statistical comparisons of all BiLME parameters with those from Study 1 are shown in Table 3. Neither the accuracy of judgments (ra) nor the cohesion (rjd) between judgments and decisions differed significantly between the 2 studies; although, the effect sizes were notable (η2s were 0.081 and 0.080, respectively). The average internal policy matching component (Gjd) was nearly identical across the two studies. Both measures of cognitive control (Rj and Rd) were, on average, significantly higher than in Study 1.
Comparison of Average BiLME Parameters between Studies
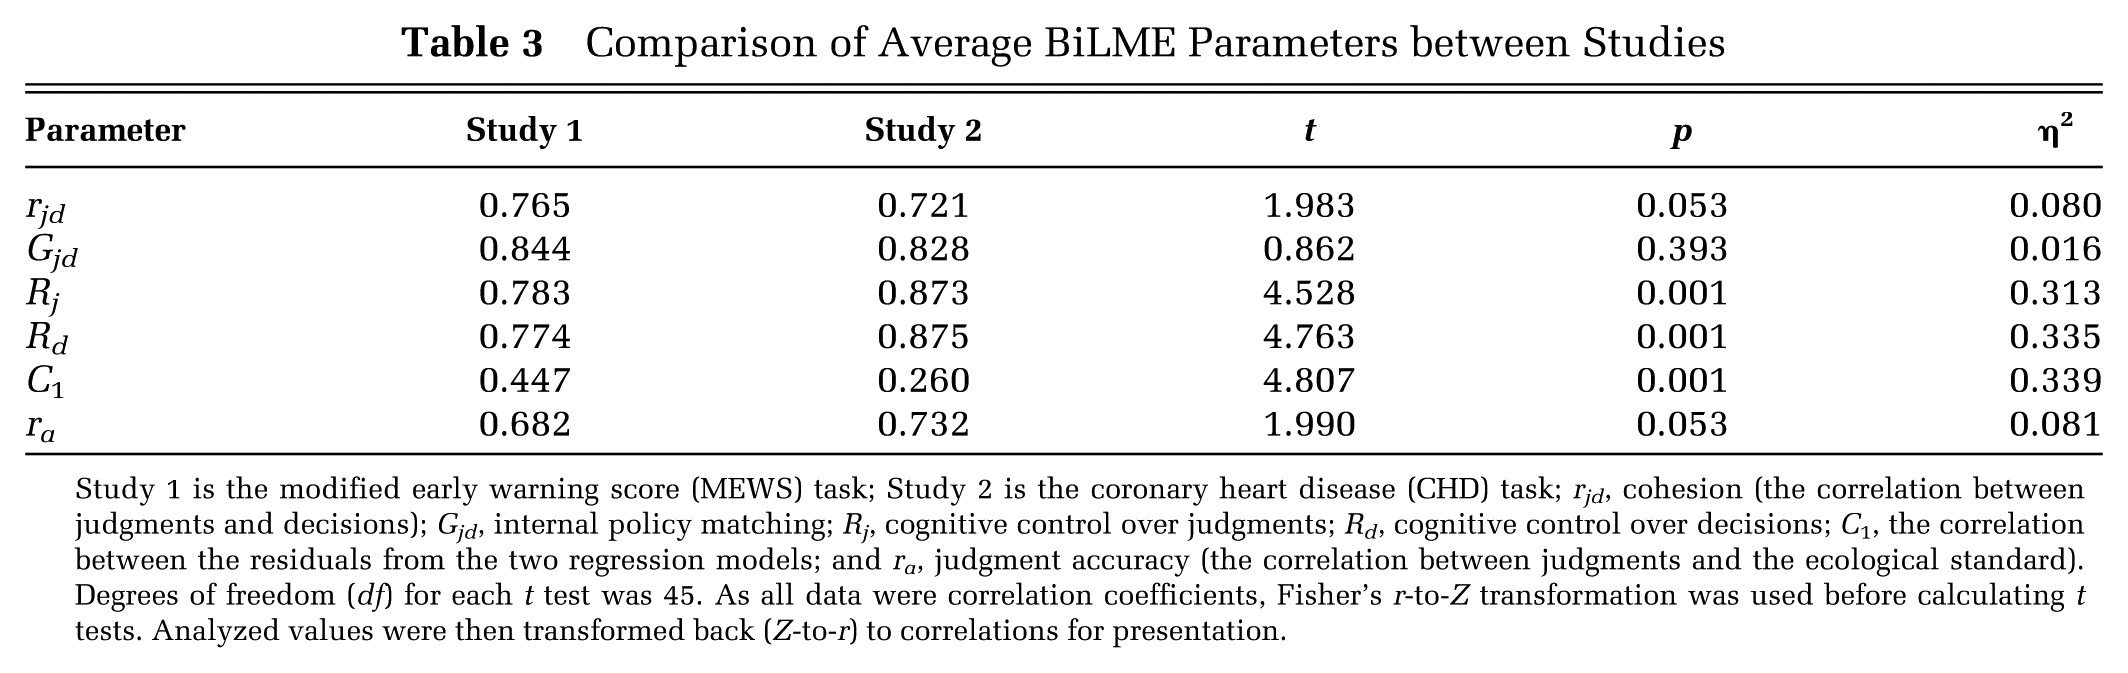
Study 1 is the modified early warning score (MEWS) task; Study 2 is the coronary heart disease (CHD) task; rjd, cohesion (the correlation between judgments and decisions); Gjd, internal policy matching; Rj, cognitive control over judgments; Rd, cognitive control over decisions; C1, the correlation between the residuals from the two regression models; and ra, judgment accuracy (the correlation between judgments and the ecological standard). Degrees of freedom (df) for each t test was 45. As all data were correlation coefficients, Fisher’s r-to-Z transformation was used before calculating t tests. Analyzed values were then transformed back (Z-to-r) to correlations for presentation.
Discussion
In this study, the BiLME was again used to examine individual differences in cohesion. Differences in cohesion were correlated with all of the BiLME parameters to some degree. The most notable difference in the results of this study, relative to those from Study 1, was the reversal in the magnitudes of the two correlations relating individual differences in cohesion to individual differences in internal policy matching (Gjd) and to individual differences in C1, the correlated residuals from the two regression models. Here, individual differences in cohesion showed a weaker correlation with differences in C1. Further, using r-to-Z transforms, the Pearson correlation of cohesion scores with C1 scores was significantly smaller in this study than in Study 1 (0.222 v. 0.705; t = 20.184; df = 45; P = 0.034), but the correlation of cohesion scores with Gjd scores did not differ significantly (0.569 v. 0.442; t = 0.575; df = 45; P = 0.568) between studies.
One explanation for these differences between Study 1 and Study 2 may be the mode of administration (online in Study 1, pencil-and-paper in Study 2). Another possibility may be a qualitative distinction in the type of judgment-to-decision connection examined in each study. While both studies elicited clinical judgments of patient risk for an adverse outcome, the decision in Study 1 (to alert, or not) exhausted all the options open to the decision maker. In the current study, however, the decision whether or not to refer the patient to a cardiologist represents only one of various options that are not mutually exclusive (others could include prescribing blood pressure medications, or cholesterol lowering agents, or both).
General Discussion
In this article, the cohesion between clinical risk judgments and treatment-related decisions was examined. Novel forms of Brunswik’s Lens Model and the LME were developed to decompose cohesion. The approach is considered “bifocal” in the sense that it focuses on two sets of linked responses from the same individual. Data from two studies were used to illustrate how individual differences in cohesion could be related to differences in the parameters of the BiLME (Equation 4). Cohesion (rjd) varied due to individual differences in cognitive control (Rj and Rd), similarity in the judgment and decision policies (Gjd), and a possible reliance on a subjective threshold value applied to the judgments in order to make decisions (C1). Whether C1 is indicative of a subjective risk threshold for action decisions as suggested here, or simply a response-set bias, is not directly discernable from the current data; it does, however, pose an interesting direction for future research.
The parameters of the BiLME were associated with individual differences in cohesion in both studies; however, their relative influences differed between the two studies. In Study 1, where RNs judged hospital patients’ risk for critical events and decided to alert (or not) the rapid response team, differences in cohesion were most strongly associated with differences in C1, the correlation between the residuals from the regression models of judgments and decisions. This finding suggests that individual differences in cohesion may have been due to factors unrelated to cue utilization because C1 is the correlation between an individual’s judgments and decisions with the influence of the cues partialed out. In Study 2, where NPs judged patients’ risk for CHD and decided to refer to a cardiologist (or not), individual differences in cohesion were most strongly related to differences in internal policy matching (Gjd), suggesting that variation in cohesion was due to individual differences in the similarity of the two cue-weighting strategies used to form judgments and to make decisions.
The BiLME permits the testing of two hypotheses relevant to the following question: Why are some individuals (performing the same judgment-decision task) more cohesive than others? H1: Individuals differ in the extent to which they use the same cue-weighting strategy to form their judgments and to make their decisions (i.e., individual differences in Gjd will correlate with rjd values). H2: Having formed their judgments based on the cues, individuals differ in the extent to which they simply apply a subjective threshold value to their judgments in order to make their decisions (i.e., individual differences in C1 will correlate with rjd values).
The BiLME (Equation 4) links the results from two regression models—one linear and one logistic—based on the same set of cases. Substituting ra for rjd makes it possible to apply the equation to traditional, dual-system judgment analysis studies, where continuous judgments are compared with an ecology composed of dichotomous outcomes, or where dichotomous judgments are compared with a continuous outcome in the ecology. In this regard, Equation 4 is quite flexible and adds to the set of tools available to judgment analysts. Hamm and Yang 29 have recently compared a similar “hybrid” method for deriving lens model parameters from the linear and logistic forms of the LME.
Across individuals (within each study), cohesion showed little to no relationship with individual differences in judgment accuracy (ra). That is, the cohesiveness among an individual’s judgments of patient risk and decisions to take risk-reducing actions was relatively independent of how accurately the individual judged patient risk relative to the ecological standard. What makes this finding interesting is that some individuals can show strong connections between their decisions and their judgments regardless of whether their judgments of risk are accurate. And conversely, individuals who can accurately judge risk may not always rely on their own judgments when making decisions.