
Abstract
Clinical prediction models are increasingly used to guide care. Such models combine historical data with statistical techniques to forecast—reducing uncertainty in prognosis or reducing risks of high-stakes clinical decisions. Those who develop prediction models make choices—implicitly or explicitly—about the relative costs of false-positives, false-negatives, and other model characteristics such as time horizon that help set decision thresholds. Typically absent, however, is input from the patients for whom the models might be relevant. If these prediction models are to usefully guide patient-centered clinical care, they ought to be designed less around the preferences of the modelers and more around the preferences of the patients they aim to serve.
People living with a serious illness face high prognostic uncertainty and wrenching decisions about care goals. Prognostic models, if tailored to the patients making such decisions, might inform choices these patients encounter such as targeted deployment of intensive outpatient management, referral for palliative care, or whether to engage in advance care planning. However, there are technical and logistical barriers to accurately incorporating patient preferences into model development, including difficulties—real or perceived—in identifying an appropriate method for quantifying patient preferences for characteristics of prognostic models. As a consequence, most clinical prediction models, such as those for patients with breast cancer, 1 coronary artery disease, 2 and chronic obstructive pulmonary disease,3,4 do not account for patient preferences for different error types or other model characteristics.
Therefore, we sought to quantify preferences for the predictive time horizon (the future period over which a model makes a prediction, e.g., the probability of some event in the next 6 months), sensitivity, specificity, and the confidence interval (CI) around these estimates for a hypothetical mortality prediction model in a population of community-dwelling patients living with advanced chronic lung disease. We employed a discrete choice experiment (DCE) to identify patients’ relative utilities for these model characteristics. We hypothesized that patients would have preferences about tradeoffs between model characteristics that could inform the development of future prediction models that better reflect their goals. Such an approach could also serve as an example of preference elicitation to inform the development of a patient-centered predictive model in other populations.
Methods
We performed a cross-sectional study of adult, community-dwelling patients with chronic lung disease who visited an outpatient pulmonary clinic. We conducted a DCE to determine the part-worth utilities of different characteristics of a hypothetical prediction model that identified the future risk of in-hospital death. We followed best practices for design and reporting of conjoint analysis studies for health-related applications. 5
Population and Sample Size
We screened the daily appointment schedule at 3 outpatient academic pulmonary clinics within the University of Pennsylvania Health System. Patients were eligible for inclusion if they had any recent International Classification of Disease–10 code for a chronic lung disease (Supplemental Table S1) and also met at least 1 of the following criteria for disease severity: 1) forced expiratory volume in 1 second (FEV1) <50%, 2) peripheral oxygen saturation <88% recorded during a recent outpatient encounter, or 3) daytime supplemental oxygen therapy documented in the electronic health record. We chose to include patients with higher disease severity because they are more likely to benefit from a prognostic model and likely have different decision-making biases and preferences than healthier patients do. 6 Patients meeting eligibility criteria were approached by research coordinators on the day of their visit in the waiting area, and patients providing informed consent were enrolled. All participants received $20 for completing the study. There was no additional follow-up. The University of Pennsylvania Institutional Review Board approved the study (#826986).
Task and Study Design
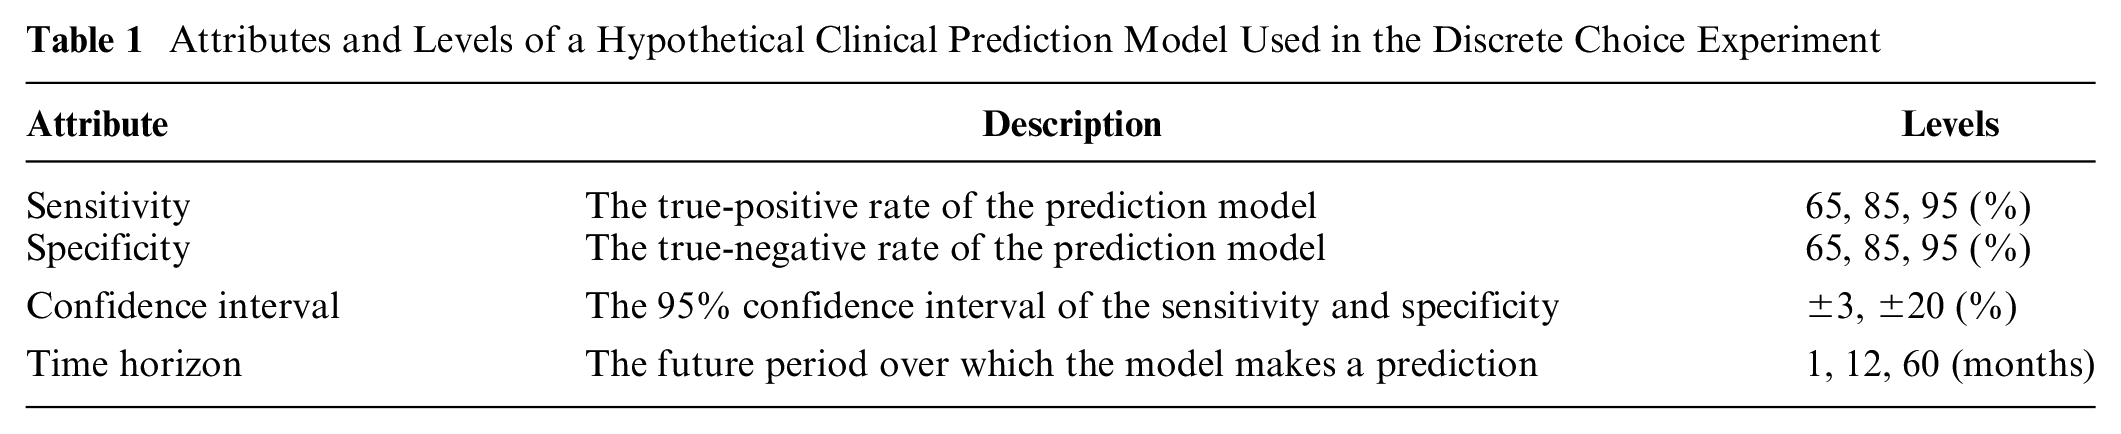
We used 12 forced-choice tasks (Figure 1) with a full-profile, partial-factorial design. Each task required the participant to choose 1 of 2 hypothetical prediction models with different characteristics (Table 1). The levels for each task were chosen using the ChoicEff macro with SAS software (SAS Institute Inc., Cary, NC). An additional task in which one model strictly dominated the other was also included as a check for participant understanding and internal validity (Supplemental File, final task on page 39). Each participant was presented with all 13 tasks in a randomized order.
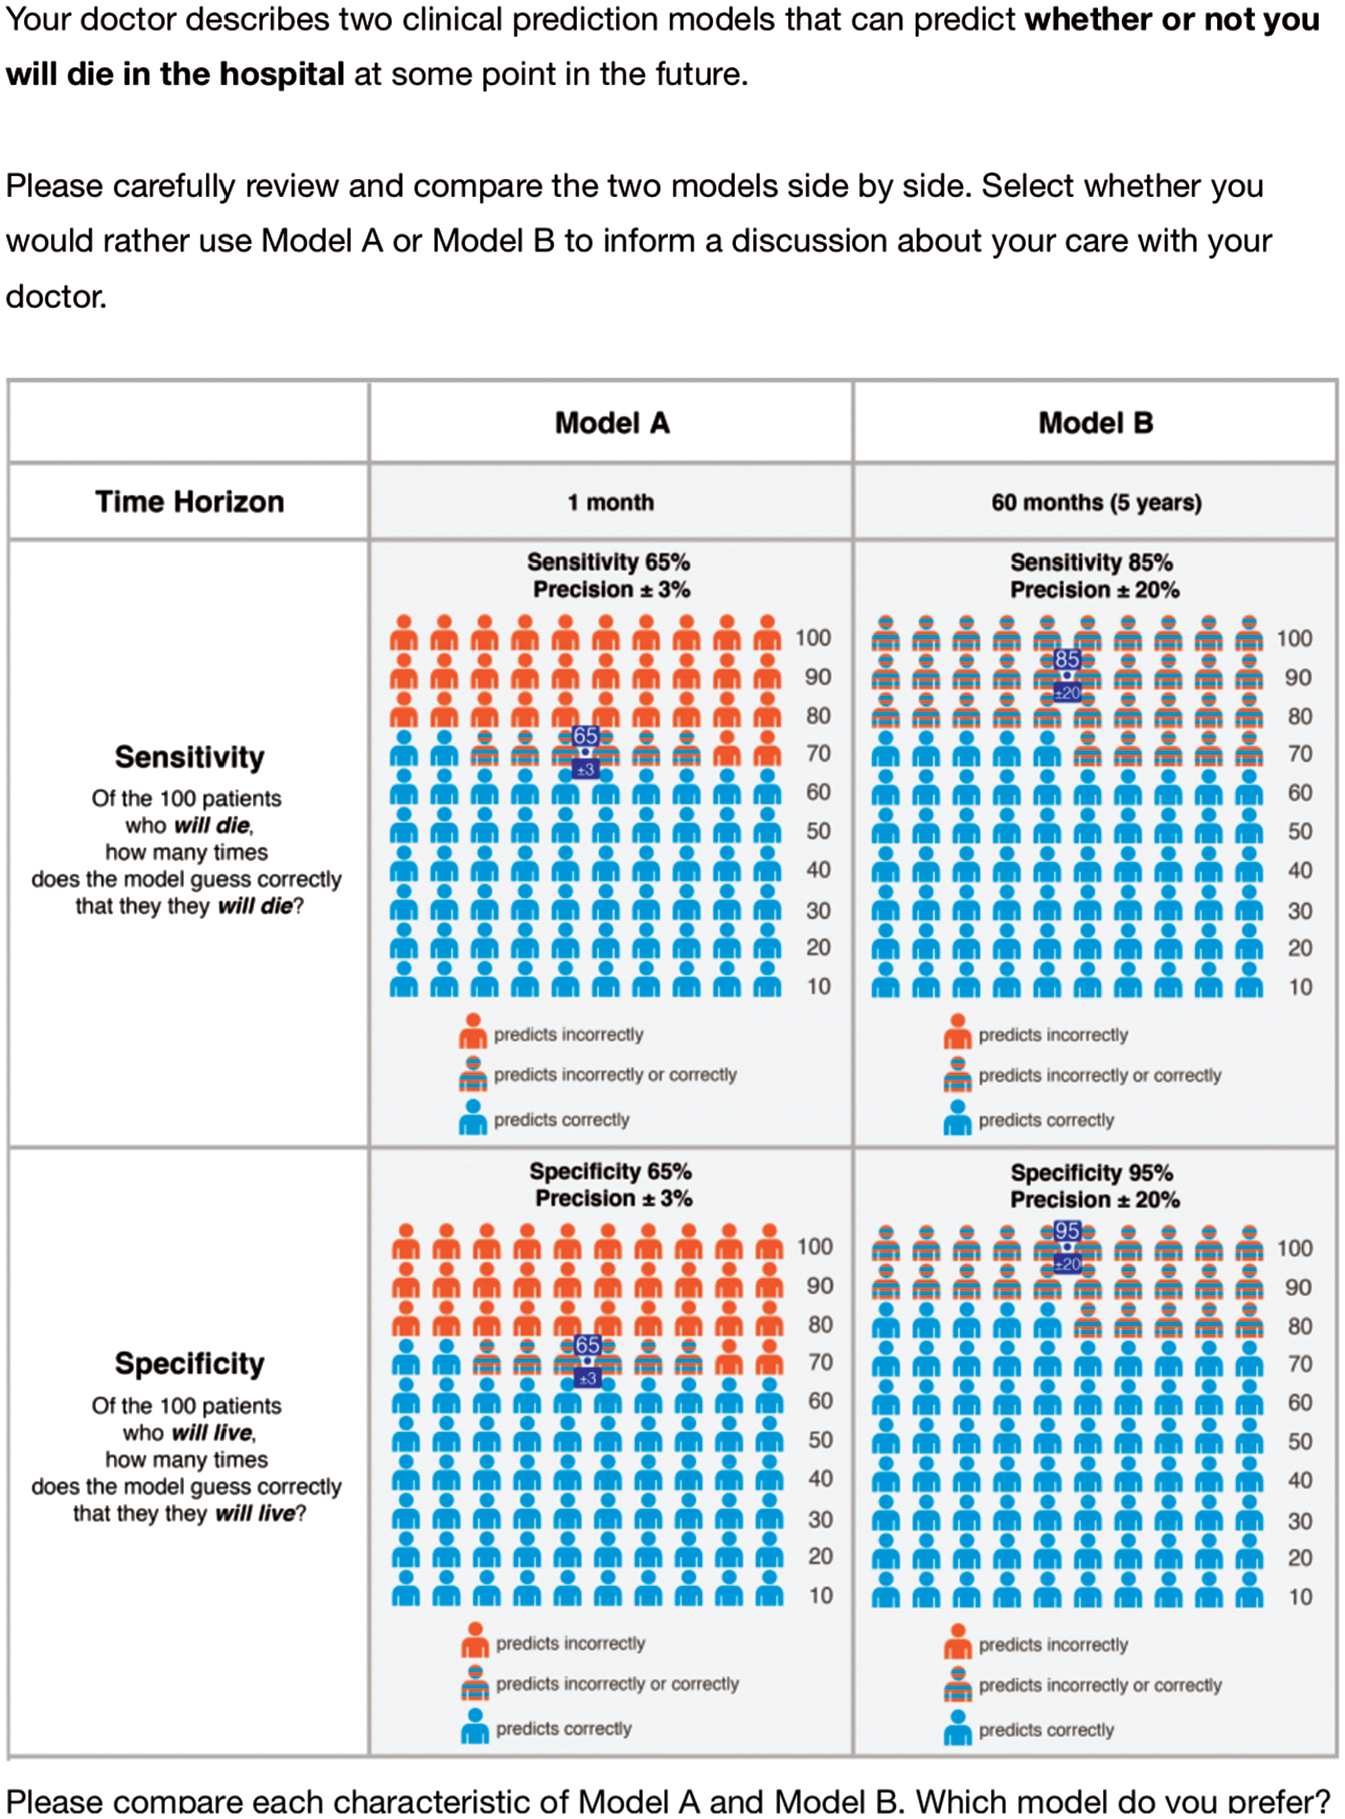
Sample task from the discrete choice experiment.
Attributes and Levels of a Hypothetical Clinical Prediction Model Used in the Discrete Choice Experiment
Instrument Development
Attributes were selected based on input from the study team with expertise in the development of clinical prediction models. Specifically, sensitivity, specificity, CIs, and predictive time horizon were chosen because of their centrality to the model development process and influence on a model’s eventual predictions. In addition, the inherent tradeoffs between these attributes offered several opportunities to link patient preferences directly to analytic choices in model development.
First, a classification threshold that determines a particular combination of sensitivity and specificity could be determined with knowledge of the relative utilities of the predicted outcomes. For example, in the case of predicting mortality among patients living with lung disease, this decision could account for the value of correctly identifying the true risk of death, whether high or low. This must be balanced against the cost of mistakenly predicting high or low risk of death when in fact the opposite is true.
Second, the role of CIs in communicating risk information is not yet clearly defined. 7 CIs around predicted probabilities that are perceived as narrow may convey a degree of certainty around a prediction that could engender trust in the model. How a patient defines wide and narrow is unknown and may vary with respect to the consequences associated with a prediction. Analytically, the width of the CI depends on the number of observations used to train the model, the number of variables and their signal, and the extent of model overfitting, among other factors.
Third, predictive model developers must select a relevant time horizon based on an optimal tradeoff between performance and utility. That is, utility as a function of the predictive time horizon for a prediction model most likely follows an inverted U-shaped curve, while its performance follows the opposite pattern. For example, for a patient in clinic, it is probably easy to train a high-performing model to predict death within the next hour. But a model at this time horizon likely yields little utility because such a prediction is obvious in most cases. Similarly, it would be easy to achieve high performance yet uninformative to predict death occurring sometime in the next 100 years. As the time horizon is shifted away from either temporal extreme, the predictive task becomes more difficult, thus increasing the marginal utility of relevant prognostic information for middling time horizons. 8 The choice of the predictive time horizon should be long enough to allow for some intervention or change in behavior while being short enough to feel relevant to a decision in the present. 9
The feasibility of communicating and understanding these statistical concepts using best practices for risk communication10–12 was demonstrated in a previous pilot study. 13 Levels for each attribute were selected to include those of commonly published prediction models.14–16 We also chose attribute levels to avoiding extreme values that could induce a grounding effect based on guidelines for DCE development in the absence of prior data from similar experiments. 5 The model outcome of in-hospital death used for all tasks was selected based on results of a combined free-listing and multiple-choice exercise with 30 volunteers in the outpatient clinic. Participants in this pilot survey were not included in the main study. A copy of the final instrument is available in the Supplement.
Additional Measures
Participants reported their sociodemographic characteristics and their interest in the results of a clinical prediction model for use by themselves and by their doctor, and they completed the short Numeracy Understanding in Medicine instrument (S-NUMi). 17 The S-NUMi is an 8-item instrument that measures multiple domains of numeracy, is strongly associated with other commonly used numeracy instruments, and is also associated with understanding of statistical concepts such as sensitivity and specificity that were presented to patients in this study.13,17 The S-NUMi score ranges from 0 (low) to 8 (high).
Statistical Analysis
For the primary analysis, we calculated the odds of choosing one hypothetical prediction model over another using an explanatory, multivariable logistic regression model adjusted for each attribute. We included a crossed random effect for both participant and task. However, the variance of the random intercept for participant was near zero and so was removed in subsequent analyses and the model refit with a single random intercept for task. In a separate explanatory model, we also examined interactions between sensitivity and specificity and between sensitivity and time horizon.
In the absence of prior literature on preferences for predictive model characteristics, we assumed a linear utility function. 18 As a check against this assumption, explanatory models were fit separately using attributes as continuous and categorical variables. Model fit between these approaches was compared with the Akaike information criterion (AIC) and analysis of variance (ANOVA). Ratios of fitted coefficients and their CIs were calculated using the delta method with a nonlinear Wald test to determine the “exchange rates” between characteristics of the hypothetical prediction model.19,20 The ratios of the marginal rates of substitution among pairs of attributes represent the preferences for the rate at which participants might trade off one attribute for the other.
Given the complexity of the presented information in each task, we also conducted a sensitivity analysis in which we repeated the primary analysis while excluding all those participants who chose the strictly dominated prediction model in the internal check question and another in which we excluded those with any dominant preferences (i.e., those who always chose the prediction model with the better of a single attribute). With multiple modeling approaches available for analysis of DCE data, 21 we also repeated the primary analysis using a conditional logit model to see how the results were affected by specification of the explanatory model and also refit the main model using a zero intercept.
As a secondary analysis, we fit separate explanatory models adjusted for self-perceived risk and for numeracy. Self-perceived risk was modeled as a continuous variable between 0 and 1 based on each participant’s assessment of their own risk of dying in the hospital in the next 12 months. We adjusted for numeracy using the S-NUMi score as described above modeled as a continuous variable. We compared characteristics between groups using the chi-squared and t test for categorical and continuous variables, respectively. Binomial CIs were reported for events with binary outcomes. Using a mixed-effects logistic regression model, to detect a 0.65 log-odds effect across all parameters for main effects and 2 interaction terms with
Results
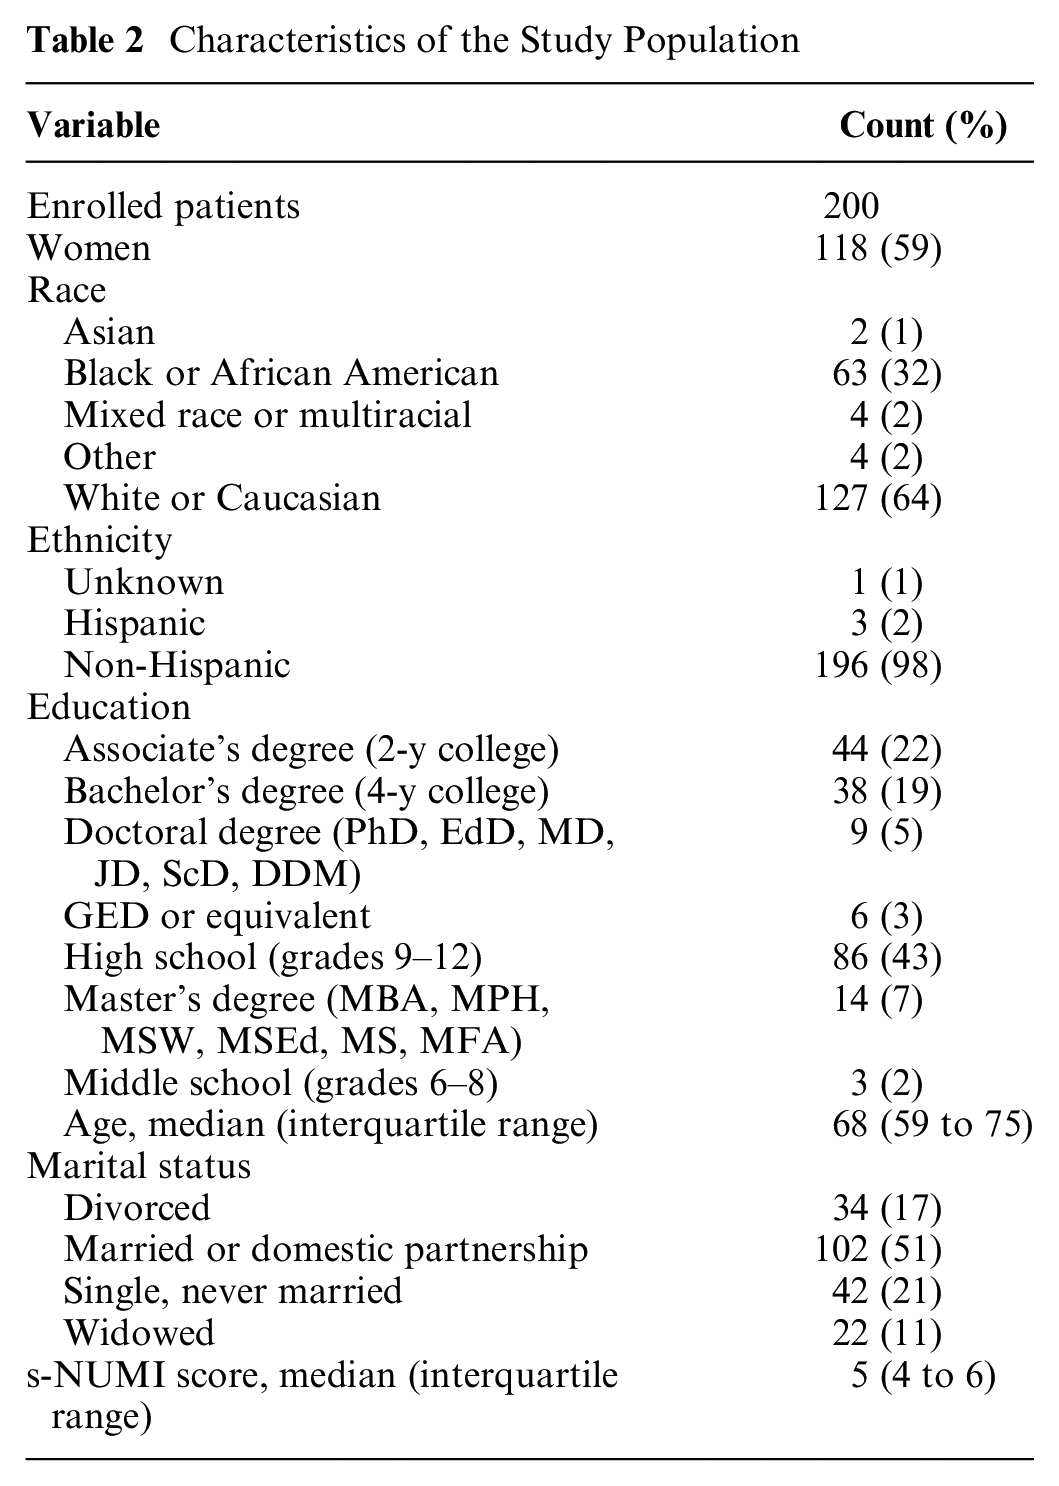
We surveyed 200 patients during their visit to an outpatient pulmonary clinic (Figure 2) between January 31, 2018, and February 14, 2019. Of these, 118 (59%) were women, 127 (64%) were white, and the median age was 68 years (interquartile range [IQR], 59 to 75 years; Table 2). The task with a choice of a strictly dominant option was answered correctly by 189 (94.5%, 95% CI 90.4 to 97.2) participants.
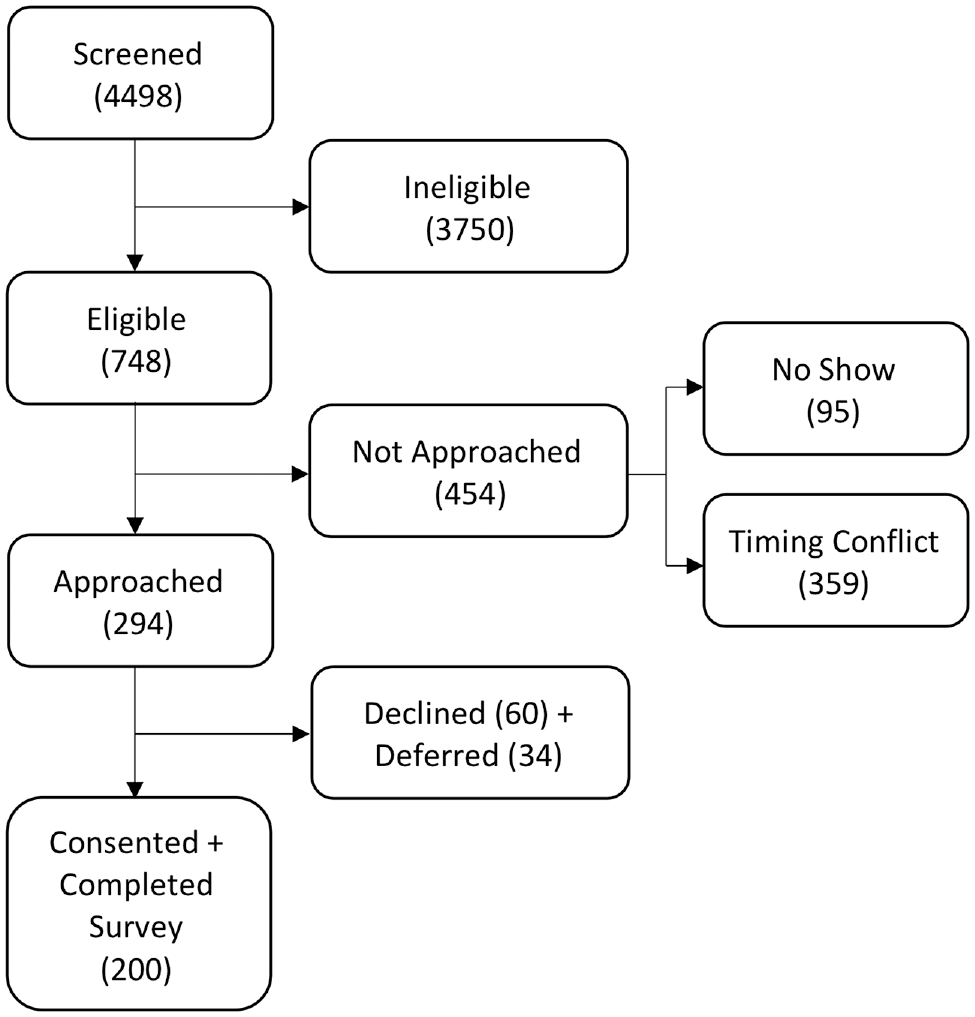
Cohort screening and enrollment.
Characteristics of the Study Population
Patients’ interest in predictive information was high for use by themselves (n = 169, 85%) and by their physicians (n = 184, 92%). In unadjusted analyses, interest did not differ by gender, race, numeracy, or education (P > 0.05 for all comparisons). However, patients who were interested in using predictive information themselves were younger (mean age 65.5 v. 71.0 years, 95% CI for difference 1.44 to 9.45, P = 0.009) and had higher estimates of their own 1-year in-hospital mortality (10.7% v. 4.0%, 95% CI for difference 2.8% to 10.5%, P < 0.001). Patients who were interested in their physicians using predictive information were also younger (mean age 65.9 v. 71.9 years, 95% CI for difference 0.91 to 11.02, P = 0.023), but their mortality risk was not significantly different from patients who did not express such interest (10.1% v. 5.2%, 95% CI for difference −0.1% to 9.8%, P = 0.055).
The odds of choosing a given model increased along with improvements in all attribute categories (Figure 3). Estimated coefficients of the explanatory model using continuous rather than categorical attributes are reported in Supplemental Table S3. There was no difference in fit between these 2 model approaches as determined by AIC (4026 and 4020) and ANOVA (P = 0.999).
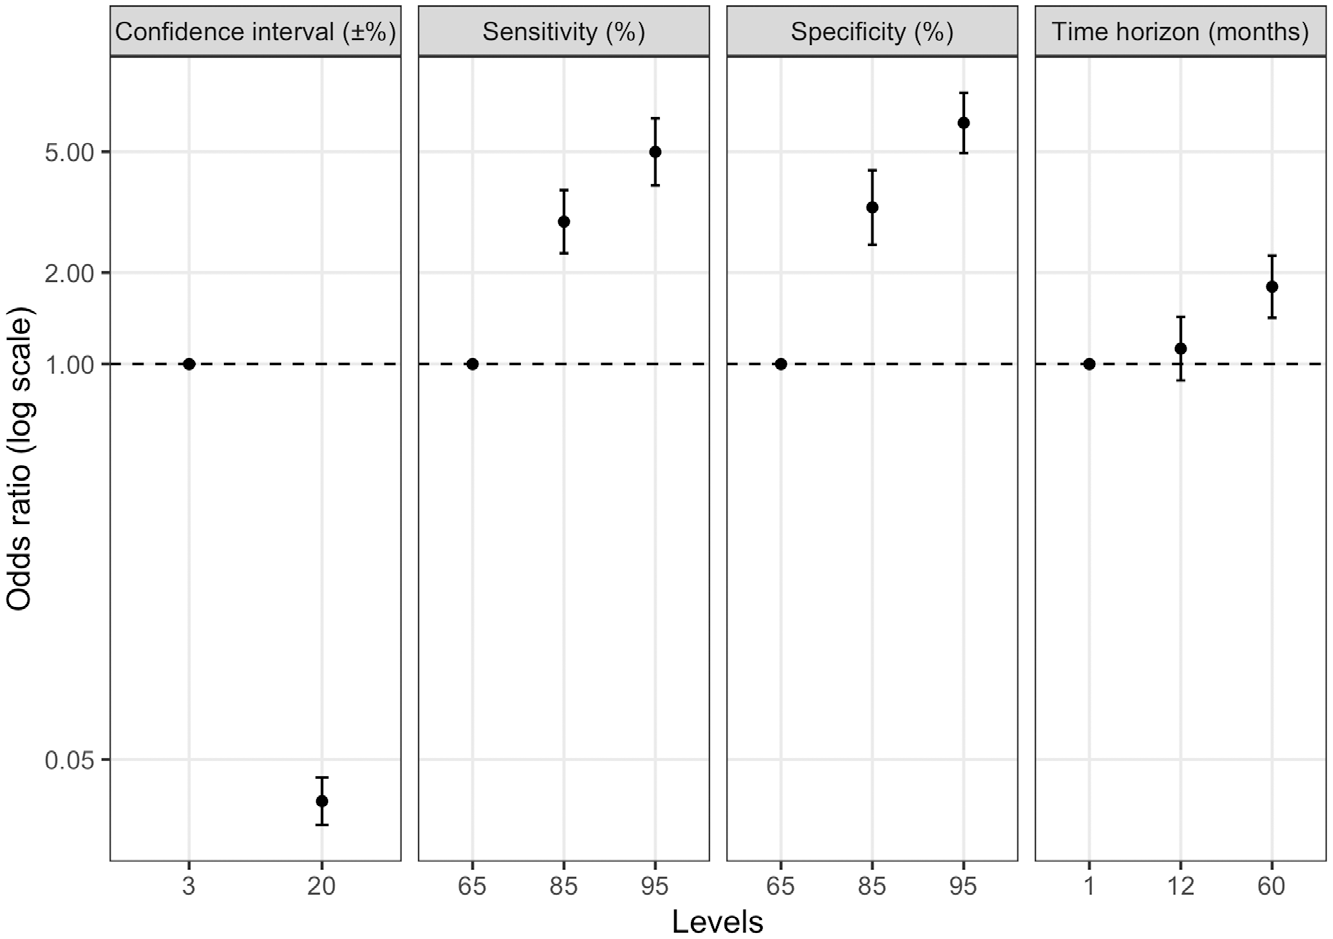
Estimated regression coefficients of each attribute modeled as a categorical variable and each task with a random intercept. Coefficients represent relative utilities for each level of each attribute associated with a hypothetical mortality prediction model.
Patients’ interests in maximizing sensitivity and specificity were similar (0.88 percentage points of specificity equivalent to 1% point of sensitivity, 95% CI 0.72 to 1.05; Table 3). Patients were willing to accept a reduction of 6.10 months (95% CI 3.66 to 8.54) in the predictive time horizon for a 1% increase in specificity. Examples of equivalent hypothetical prediction models based on these exchange rates are presented in Figure 4.
Ratios of Coefficients as Log Odds from the Mixed-Effects Logistic Regression Model
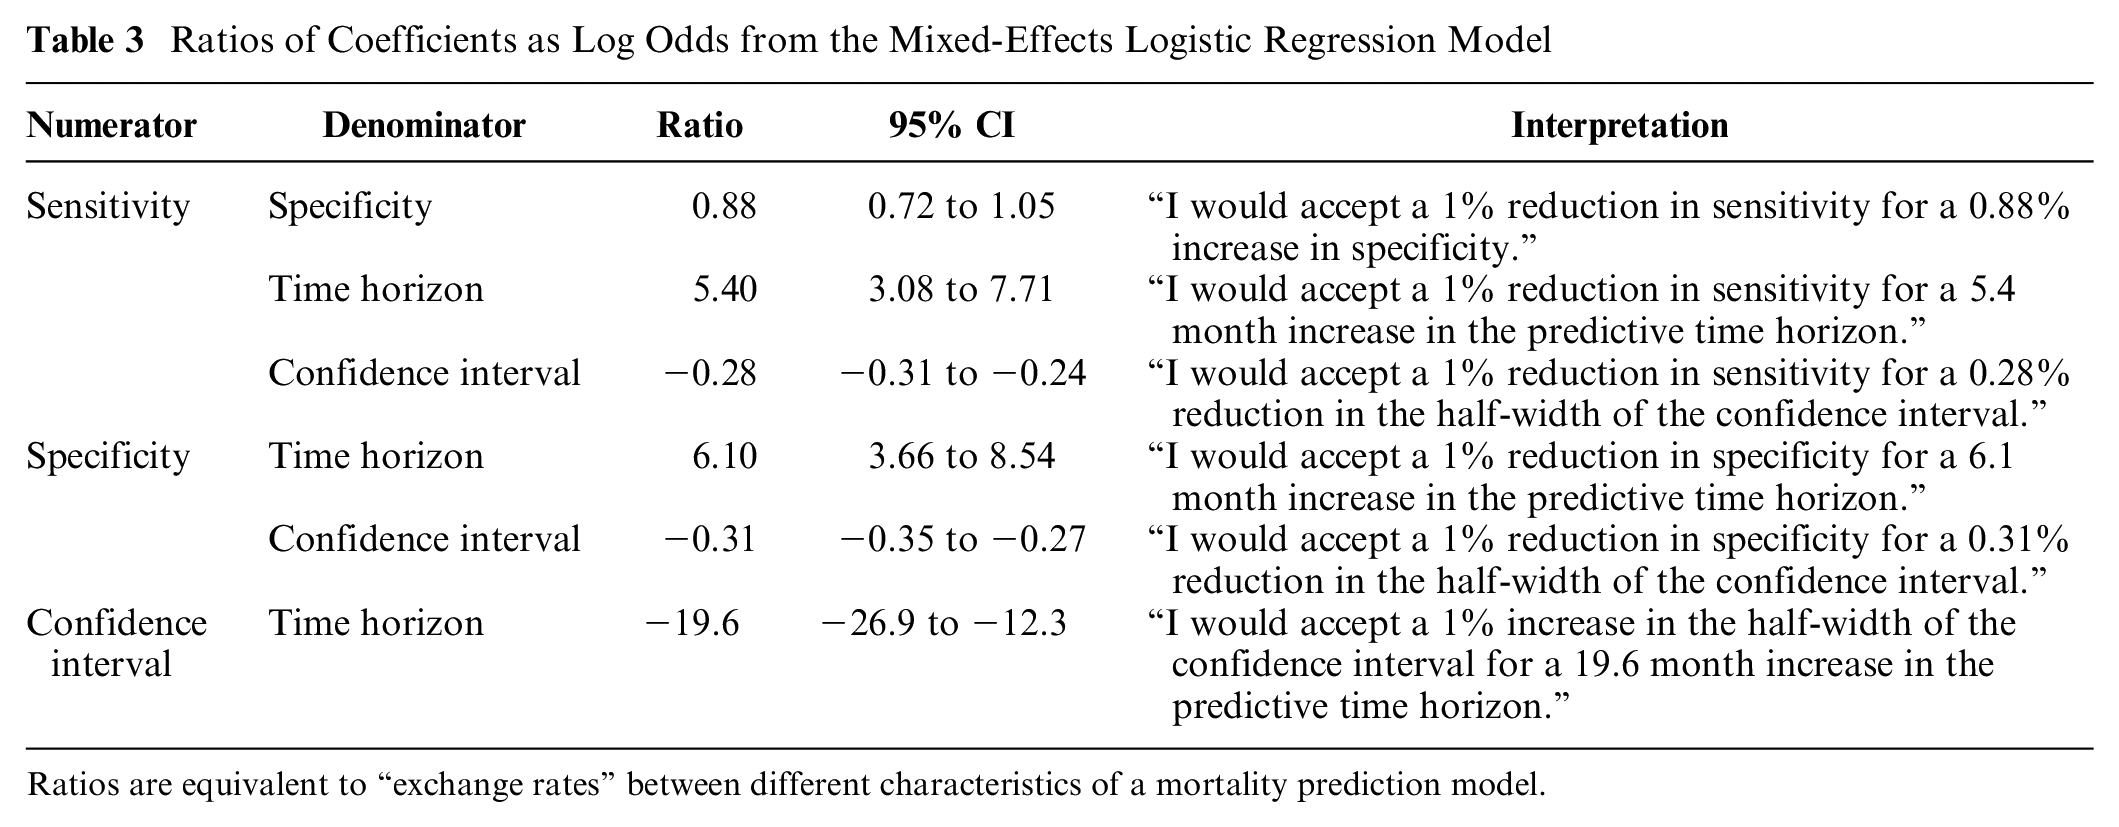
Ratios are equivalent to “exchange rates” between different characteristics of a mortality prediction model.
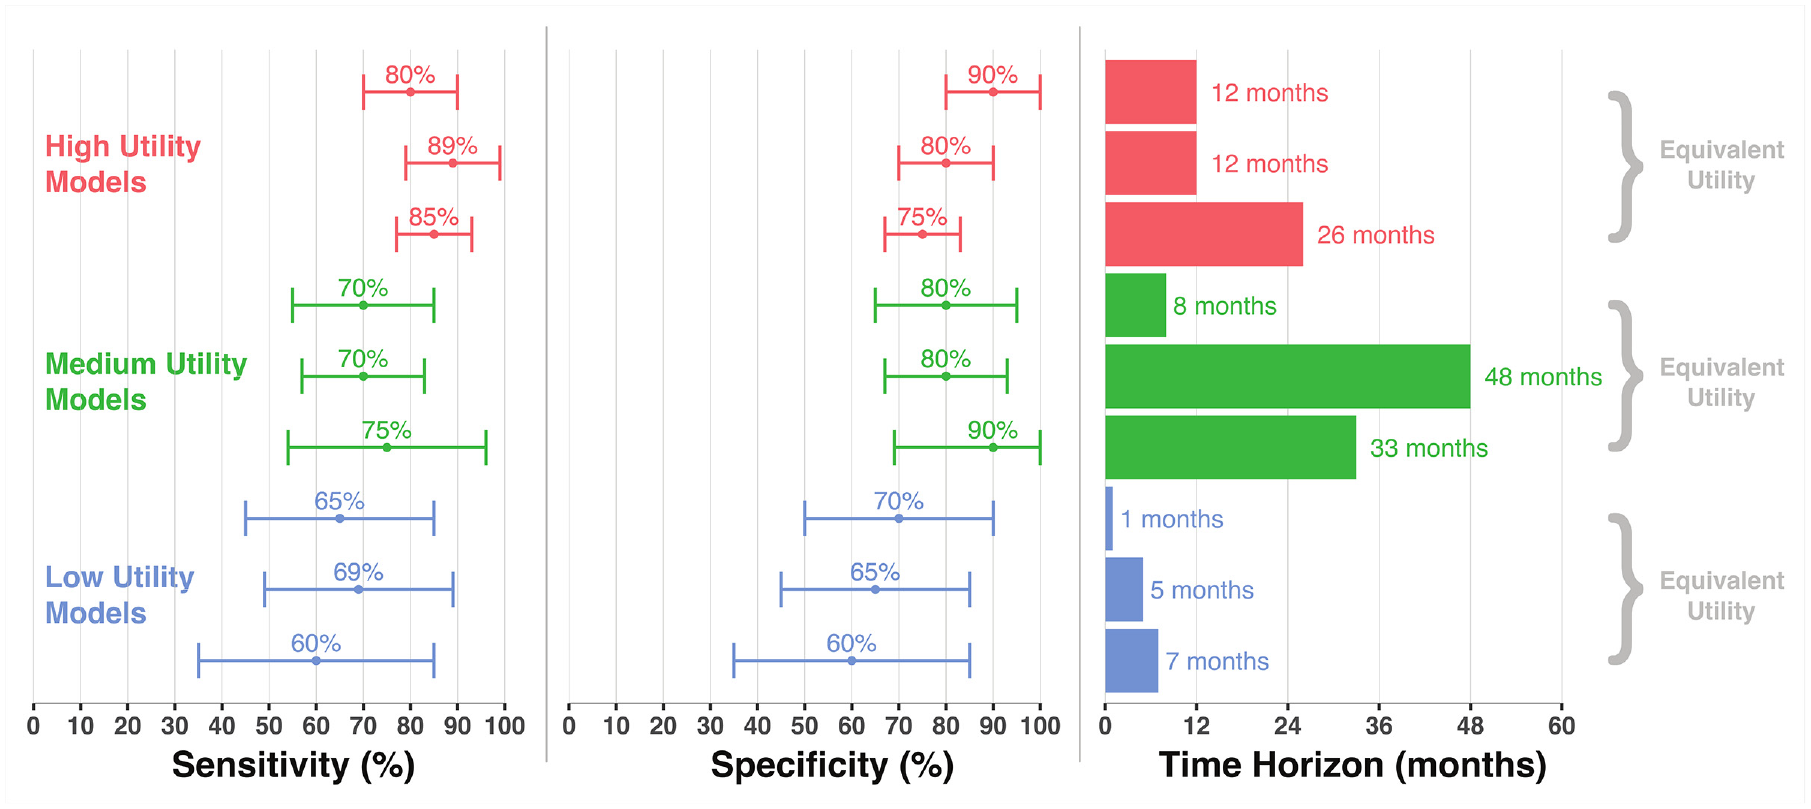
Examples of models with equivalent utility based on estimated exchange rates.
Self-reported probability of 1-year in-hospital death ranged from 0% to 79%, with median a of 0% (IQR 0 to 10), and it was uncorrelated with age (Pearson’s r 0.08, 95% CI −0.06 to 0.22). Neither baseline perceived mortality risk (odds ratio [OR] 1.00, 95% CI 1.00 to 1.00) nor numeracy (OR 1.00, 95% CI 0.95 to 1.06) was associated with choice of a predictive model after adjustment for model attributes. In addition, the estimated odds ratios for each attribute were not meaningfully changed following adjustment for numeracy (Supplemental Table S4) or perceived risk of death (Supplemental Table S5).
We observed 11 (5.5%) participants who incorrectly chose the strictly dominated model and 63 (31.5%) who exhibited dominant preferences for a single attribute, the most common of which was the CI (Supplemental Figure S1). When separately or together excluding these categories of participants, we observed small numeric differences in coefficient estimates and their ratios, but the direction of the effects and their relative magnitudes remained unchanged (Supplemental Tables S6, S7, S8). Similarly, when repeating the primary analysis using a conditional logit model, there were some numeric differences in the estimates, while the relative effect sizes and directions were preserved (Supplemental Tables S9 and S10). When repeating the primary analysis with a zero intercept, we also observed small numeric changes but with the same direction and relative magnitude of the effects (Supplemental Table S11).
Discussion
This study of outpatients with chronic lung diseases provides several insights regarding the usefulness and future design of patient-centered prediction models. First, we found that patients express high interest in using mortality prediction models in clinical care, with strong majorities saying they would be interested in using such models themselves and having their physicians use them. Although this interest was consistent among patients living with chronic lung disease across many demographic categories, older patients were less likely to express interest in the use of such models.
Second, we demonstrated the feasibility of quantifying specific “exchange rates” for prediction model characteristics. These findings have several implications for analytic choices made early in the development of mortality prediction models by investigators studying patients with life-limiting lung disease. This approach also serves as a generalizable demonstration of an often-overlooked step in the patient-centered development of clinical prediction models.
The fact that “exchange rates” can be quantified directly centers the preferences of eventual users (patients in this case) in analytic decisions typically made by researchers for default or convenience reasons. For example, the choice of a classification threshold for predicting a binary outcome depends on the relative utilities of sensitivity and specificity. In the development of a previously published prediction model to identify patients with chronic obstructive pulmonary disease at high risk of mortality and therefore appropriate for palliative care, a sensitivity of 100% was chosen so as to minimize the false-negative rate. 3 However, the study does not account for the potential harms of false-positive errors because of patient and family distress 27 and from overburdening the palliative care referral service. 28 In contrast, our findings suggest that, if anything, false-negative errors may be more acceptable to such patients than false-positive errors. Although we did not ask follow-up questions about the reasons for patients’ stated preferences, we hypothesize that this preference, if real, may be due to desires to avoid unnecessary stress associated with a false prediction of impending death. These 2 studies cannot be directly compared as they tested different outcomes and associated interventions, and the interval between predictions (e.g., 1-time prediction v. annual) was not specified. Clarifying the tradeoff between sensitivity and specificity, and hence of false-positive and false-negative errors, in a specific clinical circumstance will support the development of mortality prediction models that are aligned with patient preferences.
The quantification of utilities for sensitivity and specificity also permits the use of decision curve analysis and net benefit approaches as methods of selecting the optimal classification threshold. These approaches are powerful and visually intuitive, but they rely on the enumeration of utilities for different predicted outcomes. In the original article describing decision curve analysis, the authors present an estimate of 9-to-1 for the disutility of a false-negative error compared with a false-positive one. 29 This estimate is taken from a hypothetical surgeon’s preference for balancing the risks of cancer recurrence with urinary incontinence and impotence. Future work on prediction modeling in any clinical scenario should quantify these tradeoffs empirically and recognize that preferences between patients, clinicians, and other stakeholders may diverge. Other tradeoffs evaluated in this study are also directly relevant to analytic decisions in model development. The finding that patients preferred longer time horizons is consistent with some published models.3,15,30 While 30-day time horizons are of interest because of national policies around hospital readmission, 31 our findings suggest that predictive information over this time horizon is likely less relevant to patients.14,32,33 In addition, the decisions made by the developers of predictive models about trading off sensitivity or specificity and the predictive time horizon should also be sensitive to user preferences for their relative part-worth utilities. As the predictive time horizon increases, a model will more easily capture events of interest, and thus sensitivity will increase at the cost of specificity. The most relevant time horizon will depend on the planned intervention in response to the prediction and may depend on particular patient preferences for temporal discounting, which were not accounted for in this study.
The strong preferences we observed for narrower CIs suggest that statistical uncertainty measurements are important for patients relying on a mortality prediction model. 7 This is in contrast to prior work in other contexts suggesting that the CI may not be influential in decision making. 34 These discordant findings may also suggest heterogeneity among individuals in their ability to tolerate ambiguity. 35 Strong preferences for narrow CIs highlight the need to reduce variance in predictions through sufficient data collection before any model development begins and through reduction of overfitting in the training phase.
Many participants also exhibited dominant preferences for CIs, for which there are at least 2 interpretations. 36 First, for some patients, the reliability of a model’s predictions (indicated by the narrowness of the CI) may be the single most important feature upon which the value of the model rests. In such a case of noncompensatory decision making, there are no other attributes that could sufficiently offset the disutility associated with poor reliability. Second, there may be a hidden threshold effect not detected by the levels tested in this study. In such a scenario, there may be a maximum CI width above which any model is deemed unreliable and thus of no value to a decision maker. If the threshold were at 10%, it would not have been detected in this analysis, which tested CIs of ±3% and ±20%. However, this study design was not able to determine the underlying decision-making strategy that produced these results, including elimination by aspects, lexicographic ordering of preferences, or others.37,38 In any case, these findings suggest that increased attention to reporting of CIs in prediction model evaluation is warranted.
This study should be interpreted in light of its limitations. First, the hypothetical prediction model presented in the DCE tasks included a composite outcome of mortality and hospitalization, which may be difficult for patients to predict and for which a particular intervention may be difficult to justify. All-location mortality may be a more relevant outcome in some settings, and so findings should not be generalized to prediction models that provide risk scores for different outcomes. Second, there is likely a diminishing marginal utility at the extremes of all model performance measures that was unable to be assessed here but may be relevant for determining decision thresholds at extremes of performance. Third, results may not be generalizable to other populations, as this sample is from a single tertiary referral health system and did not include some common lung diseases, such as asthma. Finally, we did not vary the color of the figures presented to patients and thus could not determine their effect on the preferences for different attributes.
In conclusion, it is possible to quantify the tradeoffs between performance and other characteristics of a hypothetical mortality prediction model based on patients’ stated preferences. Among outpatients with chronic lung disease, interest in predictive information for future mortality risk is very high. These results should inform analytic choices in model development for predicting in-hospital mortality in this population and serve as an example for developing patient-centered prediction models in other populations.
Supplemental Material
dce_supplement_R1_2.18.2020.rjf_online_supp – Supplemental material for Preferences for Predictive Model Characteristics among People Living with Chronic Lung Disease: A Discrete Choice Experiment
Supplemental material, dce_supplement_R1_2.18.2020.rjf_online_supp for Preferences for Predictive Model Characteristics among People Living with Chronic Lung Disease: A Discrete Choice Experiment by Gary E. Weissman, Kuldeep N. Yadav, Trishya Srinivasan, Stephanie Szymanski, Florylene Capulong, Vanessa Madden, Katherine R. Courtright, Joanna L. Hart, David A. Asch, Sarah J. Ratcliffe, Marilyn M. Schapira and Scott D. Halpern in Medical Decision Making
Supplemental Material
Survey_instrument.rjf_online_supp – Supplemental material for Preferences for Predictive Model Characteristics among People Living with Chronic Lung Disease: A Discrete Choice Experiment
Supplemental material, Survey_instrument.rjf_online_supp for Preferences for Predictive Model Characteristics among People Living with Chronic Lung Disease: A Discrete Choice Experiment by Gary E. Weissman, Kuldeep N. Yadav, Trishya Srinivasan, Stephanie Szymanski, Florylene Capulong, Vanessa Madden, Katherine R. Courtright, Joanna L. Hart, David A. Asch, Sarah J. Ratcliffe, Marilyn M. Schapira and Scott D. Halpern in Medical Decision Making
Footnotes
Acknowledgements
We are grateful to Thomas Valley, MD, MSc, at the University of Michigan for insightful comments on an early draft of this article and to all of the patients who agreed to participate in the study.
The authors disclosed receipt of the following financial support for the research, authorship, and/or publication of this article: Dr. Weissman received support from NIH K23HL141639, NIH L30HL138788, Penn LDI/CHIBE Roybal Center (P30AG034546). Dr. Halpern received support from NIH K24HL143289. Financial support for this study was provided in part by multiple grants from the National Institutes of Health. The funding agreement ensured the authors’ independence in designing the study, interpreting the data, writing, and publishing the report.
Authors’ Note
This work was completed by faculty and staff primarily within the Division of Pulmonary, Allergy, and Critical Care Medicine and within the Palliative and Advanced Illness Research (PAIR) Center, both in the Department of Medicine, Perelman School of Medicine, University of Pennsylvania. Preliminary results of this study were presented as a poster at the American Thoracic Society International Conference 2019 in Dallas, Texas.
References
Supplementary Material
Please find the following supplemental material available below.
For Open Access articles published under a Creative Commons License, all supplemental material carries the same license as the article it is associated with.
For non-Open Access articles published, all supplemental material carries a non-exclusive license, and permission requests for re-use of supplemental material or any part of supplemental material shall be sent directly to the copyright owner as specified in the copyright notice associated with the article.