
Abstract
Background
Network meta-analysis exploits randomized data to compare multiple interventions and generate rankings. Selecting an optimal treatment may be complicated when multiple conflicting outcomes are evaluated in parallel.
Design
The present study suggested the incorporation of multicriteria decision-making methods in network meta-analyses to select the best intervention when multiple outcomes are of interest by creating partial and absolute rankings with the TOPSIS, VIKOR, and PROMETHEE algorithms. The TOPSIS and VIKOR techniques represent distance-based methods for compromise intervention selection, whereas the PROMETHEE analysis method allows the definition of preference and indifference thresholds. In addition, the PROMETHEE technique allows a variety of modeling options by selecting alternative preference functions. Different weights may be applied to outcomes objectively with the entropy method as well as subjectively with the analytic hierarchy process, enabling the individualization of treatment choice depending on the clinical scenario.
Results
Visualization of decision analysis may be performed with multicriteria score-adjusted scatterplots, while league tables may be constructed to depict the PROMETHEE I partial ordering of interventions. A simulated study was performed assuming equal weights of outcomes, and the TOPSIS, VIKOR, and PROMETHEE II methods were compared using a similarity coefficient, indicating a high degree of agreement among methods, especially with higher numbers of interventions.
Conclusions
Multicriteria decision analysis provides a flexible and computationally direct way of selecting compromise interventions and visualizing treatment selection in network meta-analyses. Further research should provide empirical data about the implementation of multicriteria decision analysis in real-world network meta-analyses aiming to define the most suitable method depending on the clinical question.
Highlights
Multicriteria decision-making methods can be implemented in network meta-analysis to indicate compromise interventions.
The TOPSIS, VIKOR, and PROMETHEE methods can be used for optimal treatment selection when conflicting outcomes are evaluated.
The weights of outcomes can be defined objectively or subjectively, reflecting the priorities of the decision maker.
This is a visual representation of the abstract.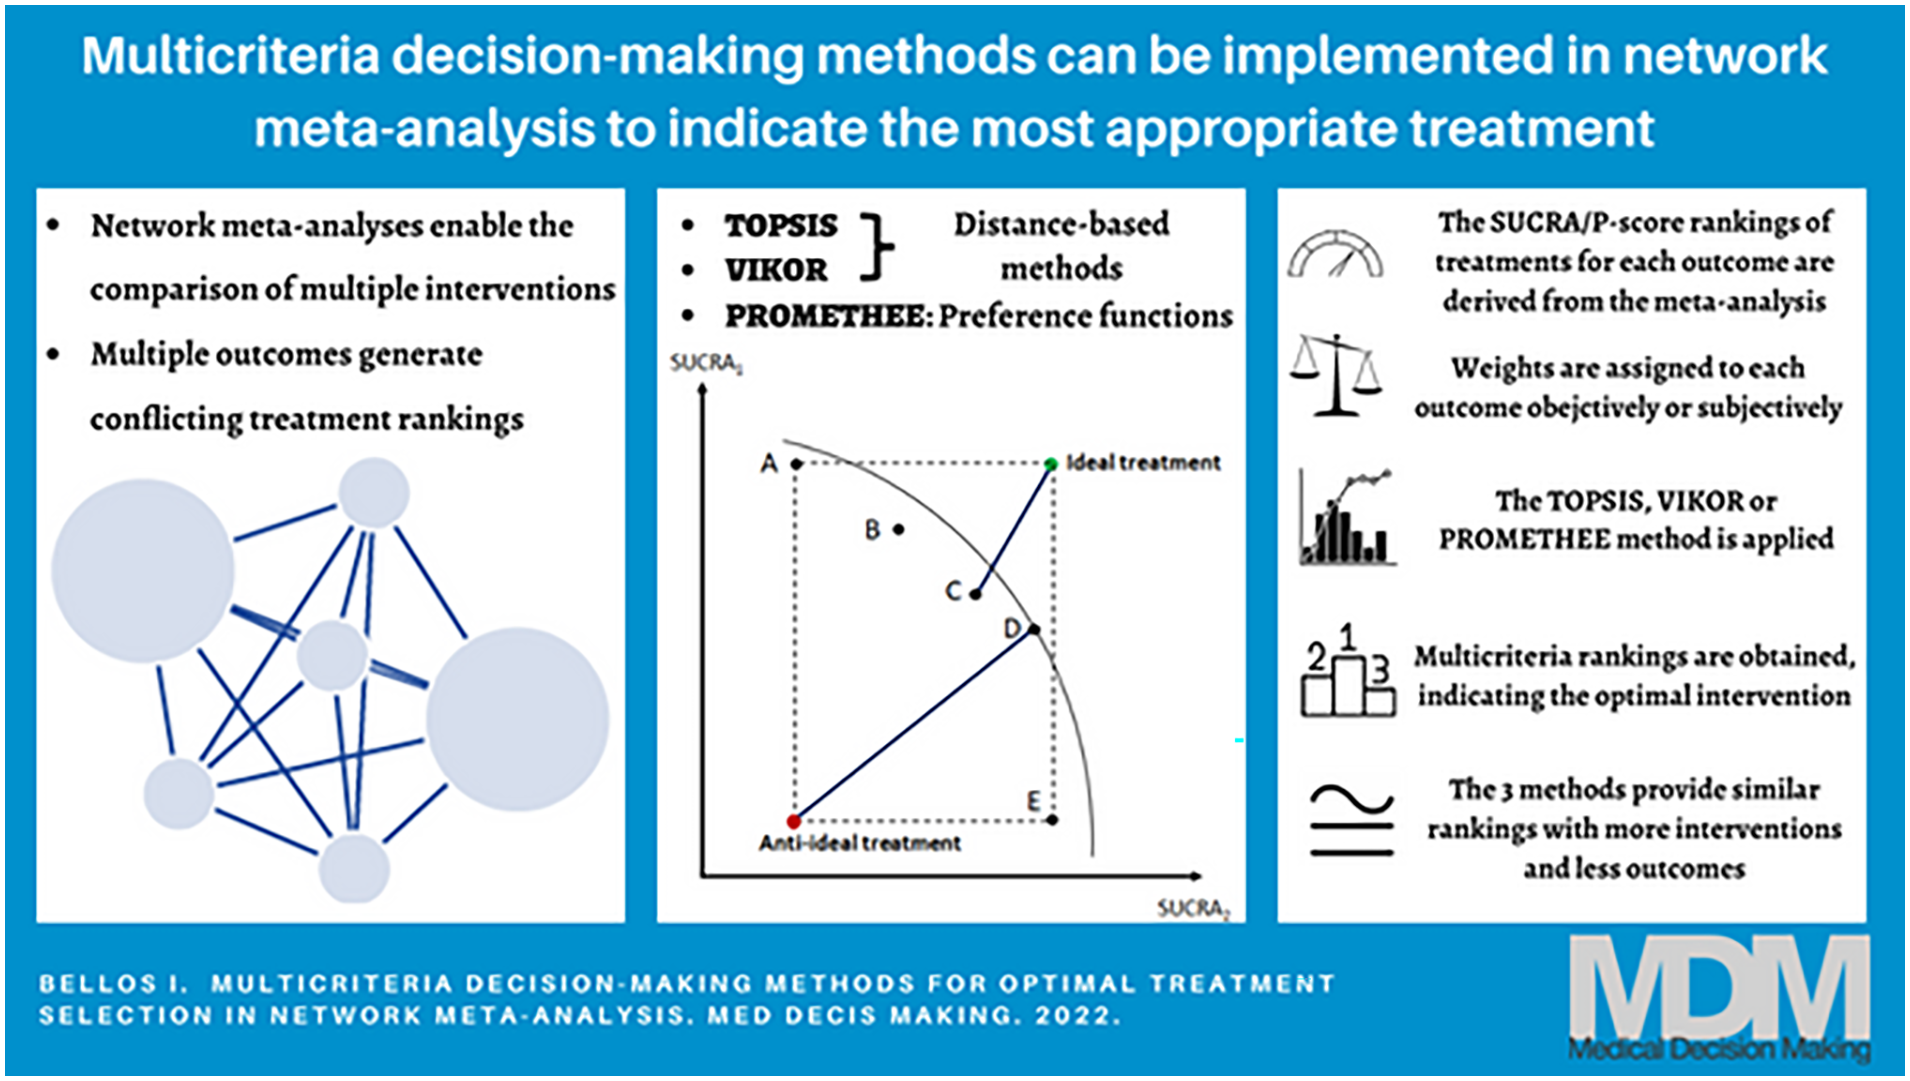
Network meta-analysis represents an extension of the conventional pairwise meta-analysis that enables the simultaneous comparison of multiple interventions. To achieve this, data from randomized controlled trials with 2 or more arms are pooled, exploiting both direct and indirect evidence. 1 This process offers greater precision in effect estimates and allows the ranking of treatments regarding specific outcomes of interest. 2 For this purpose, in Bayesian network meta-analysis, the interventions are ordered according to their surface under the cumulative ranking curve (SUCRA) ratings, which are derived by the distribution of rank probabilities. 3 Correspondingly, in the frequentist framework, the P-score has been proposed as a ranking tool, expressing the degree of certainty that a treatment is better than its alternatives. 4
Decision making in health care is multifactorial, since selecting an optimal treatment plan relies on the interplay of various factors, such as efficacy, safety, acceptability, and patient-related outcomes. 5 Nonetheless, discrepancies are anticipated among the ranking lists of different outcomes, precluding the direct draw of conclusions concerning the most appropriate intervention. As a result, a synthesis of the rankings estimated by network meta-analyses is needed to identify treatments providing the optimal balance in the investigated outcomes of interest. In this line, cluster analysis has been proposed as an initial method to detect patterns among different treatments in regard to different outcomes, 6 although computational complexity issues along with the lack of direct implications for decision making have limited its widespread use in network meta-analyses. Moreover, a partial ordering approach has been also suggested that schematically illustrates the ordering relations but without indicating the most desirable treatment alternative. 7
Health economic models have been recently incorporated into network meta-analyses aiming to combine the generated estimates of relative efficacy with cost data and investigate the relative cost-effectiveness of interventions. 8 In this context, several models can be applied, such as the Markov multistate and continuous-time semi-Markov models, and estimate cost-effectiveness using measures including the incremental cost-effectiveness ratio per quality-adjusted life-year gained or the incremental net monetary benefit. However, the implementation of such methodologies may be limited by their computational complexity in terms of assumptions and parameter definition, as well as by the fact that long-term projections are performed using short-term data derived by trials.9,10 Interestingly. Chaimani et al. 11 proposed the Probability of Selecting a Treatment to Recommend (POST-R) as a novel measure to generate rankings in network meta-analysis using a Markov chain approach, which also takes into account additional information, such as the amount of confidence in evidence, clinical experience, and cost of treatments. Nonetheless, such an approach may be based on expert opinions, introducing a significant degree of subjectivity.
The present study aims to provide a computationally direct way of generating rankings in network meta-analysis; to achieve this, multicriteria decision-making methods are incorporated to define compromise interventions by taking into account multiple outcomes. To this end, 3 different approaches are described and implemented in both empirical and simulated data exploiting the estimated SUCRA or P-score rankings of treatments. In addition, an objective and a subjective method for assigning weights to outcomes according to the clinical scenario are discussed.
In the first part, the methodology of applying the 3 decision-making algorithms in network meta-analyses is described. Subsequently, these methods are implemented in 2 real-world meta-analyses, using 2 approaches for determining weights to different outcomes. Finally, the degree of concordance among the 3 proposed decision-making methods is tested through a simulation study.
Materials and Methods
Multicriteria Decision Analysis
TOPSIS method
The Technique for Order of Preference by Similarity to Ideal Solution (TOPSIS) approach 12 aims to select the most appropriate intervention as the one with the maximum distance from the positive ideal point and the minimum distance from the negative ideal point. These points represent hypothetical interventions, with coordinates being the maximum and minimum SUCRA or P-score values of the data set for each outcome, respectively. The basis for calculations is the decision matrix:
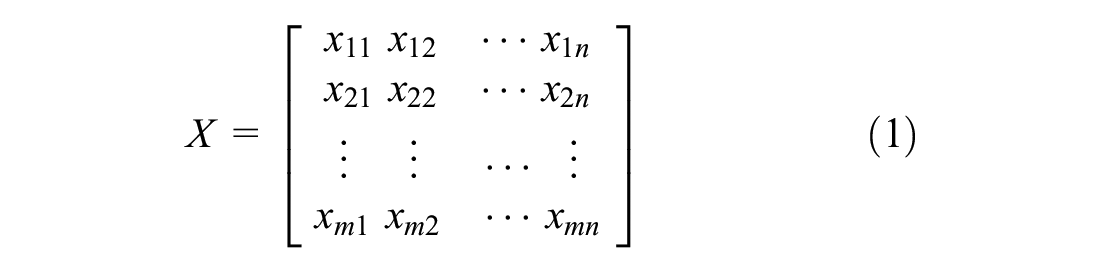
where n represents the number of outcomes and m the number of interventions.
At first, a normalized matrix is constructed with the vectorial procedure:

where

where


Then, the distances of each point of the above ideals (


The last step consists of estimating the score (

Then, interventions are ranked according to their S score, with S closer to 1 indicating a better intervention. The TOPSIS analysis was performed in R (package “TOPSIS” 13 ).
VIKOR method
The Vise Kriterijumska Optimizacija I Kompromisno Resenje (VIKOR) method
14
aims to determine a set of compromise interventions to guide decision makers when contradictory outcomes are present. The methodology is based on the Lp metric and creates rankings according to the amount of proximity to an ideal solution. First, the decision matrix (1) is used, and for each outcome, the best (

while if the jth outcome is nonbeneficial, then

In the next step, the Si and Ri values are calculated with equations (11) and (12).


where

where
The intervention with the lowest
Subsequently, the interventions are ranked according to their Q values, and the intervention with the lowest Q is proposed as the compromise solution if 2 conditions are satisfied. Specifically, the plausibility of the C1 condition of acceptable advantage is satisfied if

where

The analysis with the VIKOR method was applied using R (package “MCDM” 15 ).
PROMETHEE method
The Preference Ranking Organization Method for Enrichment of Evaluations (PROMETHEE) algorithms were introduced by Brans and Vincke
16
to rank a set of interventions with conflicting outcomes. The PROMETHEE is a family of outranking methods, with PROMETHEE I providing partial and PROMETHEE II complete rankings. A preference function is introduced, while thresholds of preference (

where

where


According to the PROMETHEE I approach,
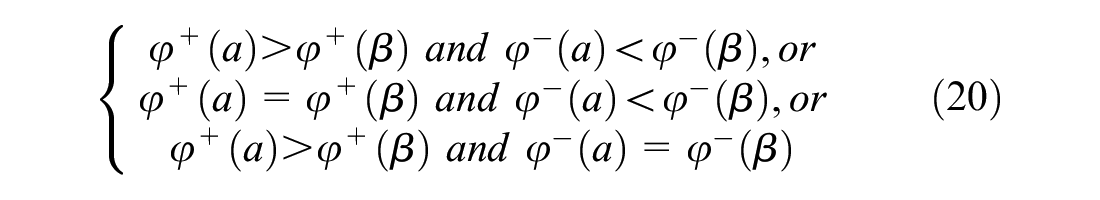
Alternatively,

while

For the PROMETHEE II method, the net outranking flow (

As a result, a complete ranking can be obtained by ordering interventions according to their net outranking flows, with higher values indicating better interventions. The PROMETHEE I and II analyses were performed in R (package “PROMETHEE” 17 ).
Estimation of Weights
Entropy method
The entropy method 18 is an objective approach for weight assignment, expressing the degree of information uncertainty. The entropy is the measure of the disorder of a system; hence, information entropy reflects the amount of useful information that can be derived. In this line, outcomes with high dispersion of the measured values (SUCRAs or P-scores) are supposed to provide more information and are thus attributed with higher weights. For the estimation of weights, the decision matrix (1) is first normalized.

Then, the entropy value (

where
Finally, the entropy weights (

A sample R script for entropy weight estimation is provided in Supplementary Appendix 1.
Analytic hierarchy process
The analytic hierarchy process 19 is a subjective method for determining weights, which is based on a hierarchy including the decision goal, the interventions, and the outcomes used for their assessment. Priorities are defined by constructing a pairwise comparison system; to achieve this, verbal evaluations are converted to numerical integer values ranging from 1 to 9, with higher values indicating the stronger importance of one outcome over another. As a result, a pairwise comparison matrix (A) is created as the following.
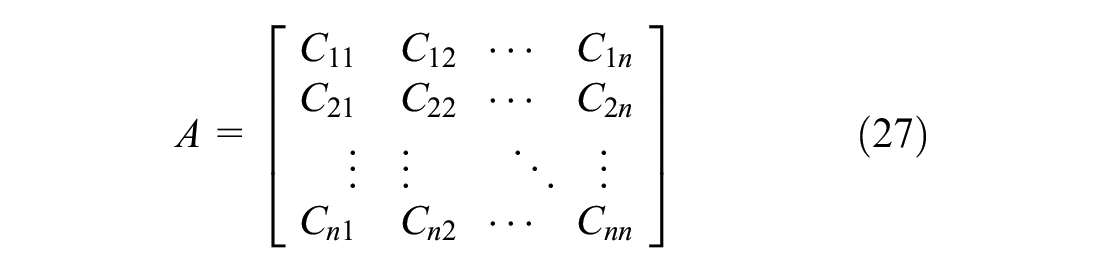
where

Subsequently, the weights (

The next step is to test the consistency of the matrix. Specifically, the maximum eigenvalue (

Then, the consistency index (CI) is calculated using the maximum eigenvalue as follows.

Finally, the consistency ratio (CR) is estimated by dividing the CI by the random index (RI) that corresponds to the CI of a randomly generated pairwise comparison matrix.

Values of CR less than 10% are acceptable, indicating consistency of the matrix. 20
Similarity Coefficient
The similarity of rankings generated by the TOPSIS, VIKOR, and PROMETHEE II methods was quantified using the similarity coefficient proposed by Sałabun and Urbaniak. 21 This coefficient is considered to be appropriate for decision-making purposes, as the positions at the top of the ranking exert a greater impact on the estimated similarity. The similarity coefficient (WS) is calculated by equation (33).
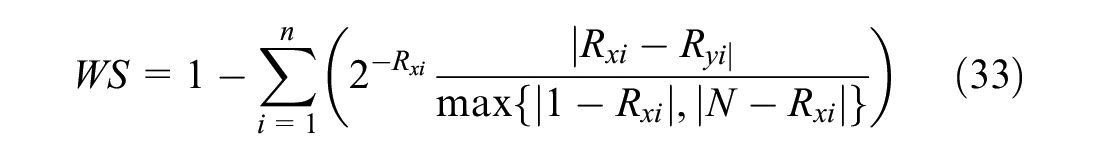
where
Published Data Sets
Antidepressants for major depressive disorder
In a network meta-analysis of 522 double-blinded randomized controlled trials, the relative efficacy and acceptability of 22 treatments (21 antidepressants and placebo) were evaluated following a Bayesian approach. 22 A total of 116,477 patients were included, while the odds ratio was chosen as the effect measure. Efficacy was defined as the response rate, quantified by the proportion of patients with a reduction of ≥50% of the total depression score, while acceptability referred to treatment discontinuation due to any reason. Interventions were ranked according to their SUCRA values (Table 1).
SUCRA Values for Efficacy and Acceptability of Antidepressants for Major Depressive Disorder
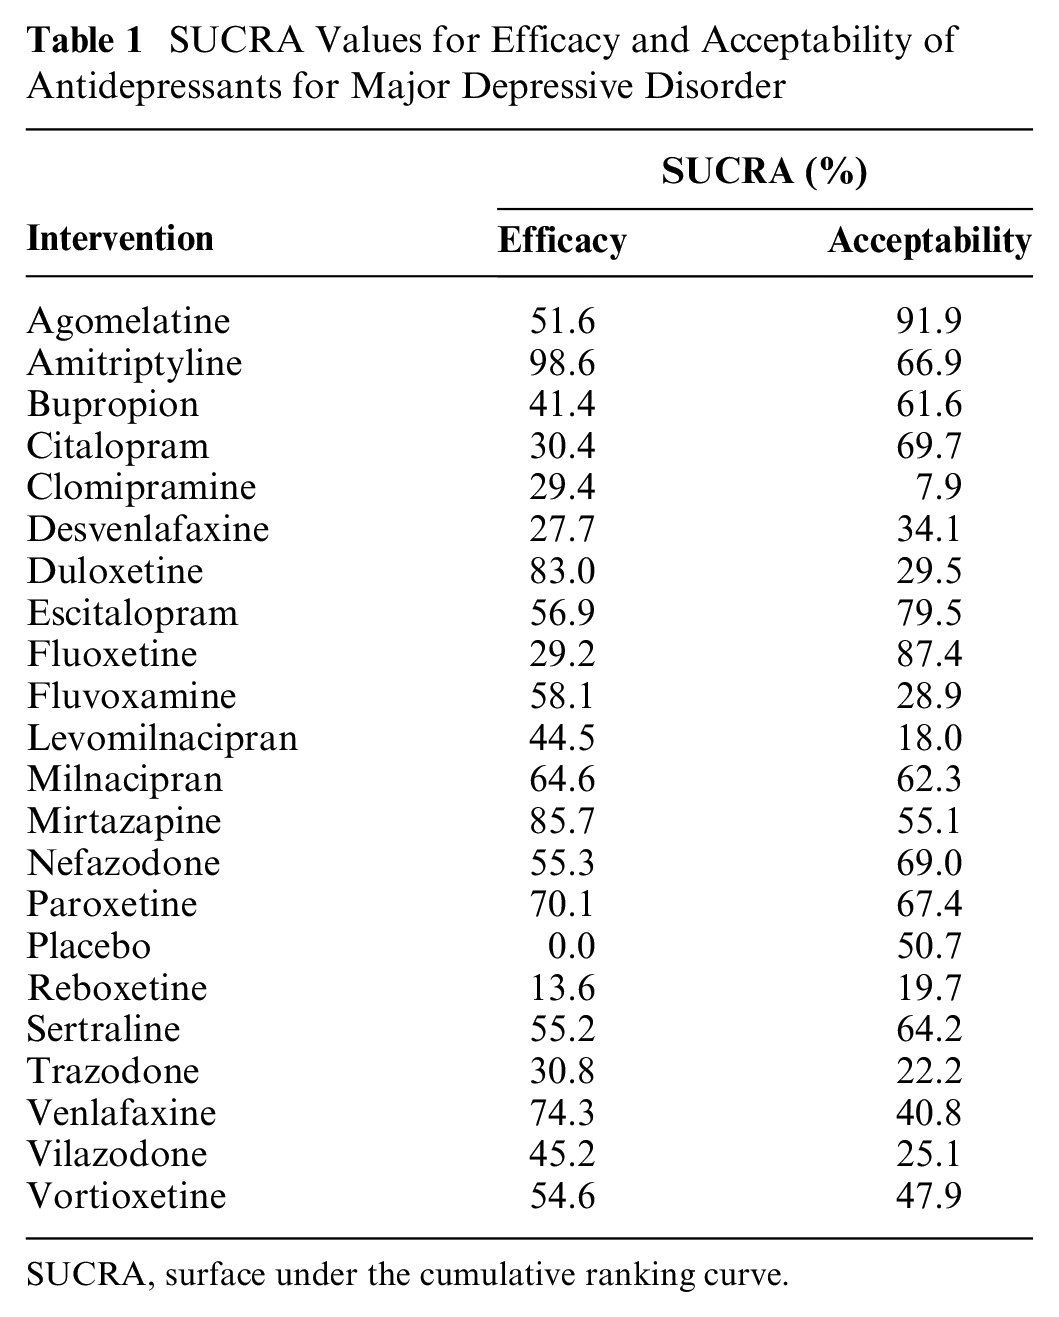
SUCRA, surface under the cumulative ranking curve.
Multicriteria decision analysis was performed using the TOPSIS, VIKOR, and PROMETHEE I and II methods. For the PROMETHEE analysis, the preference SUCRA threshold was set at 5% and the indifference threshold at 1%. A 2-dimensional plot reflecting the TOPSIS
Pharmacologic treatments for acute bipolar depression
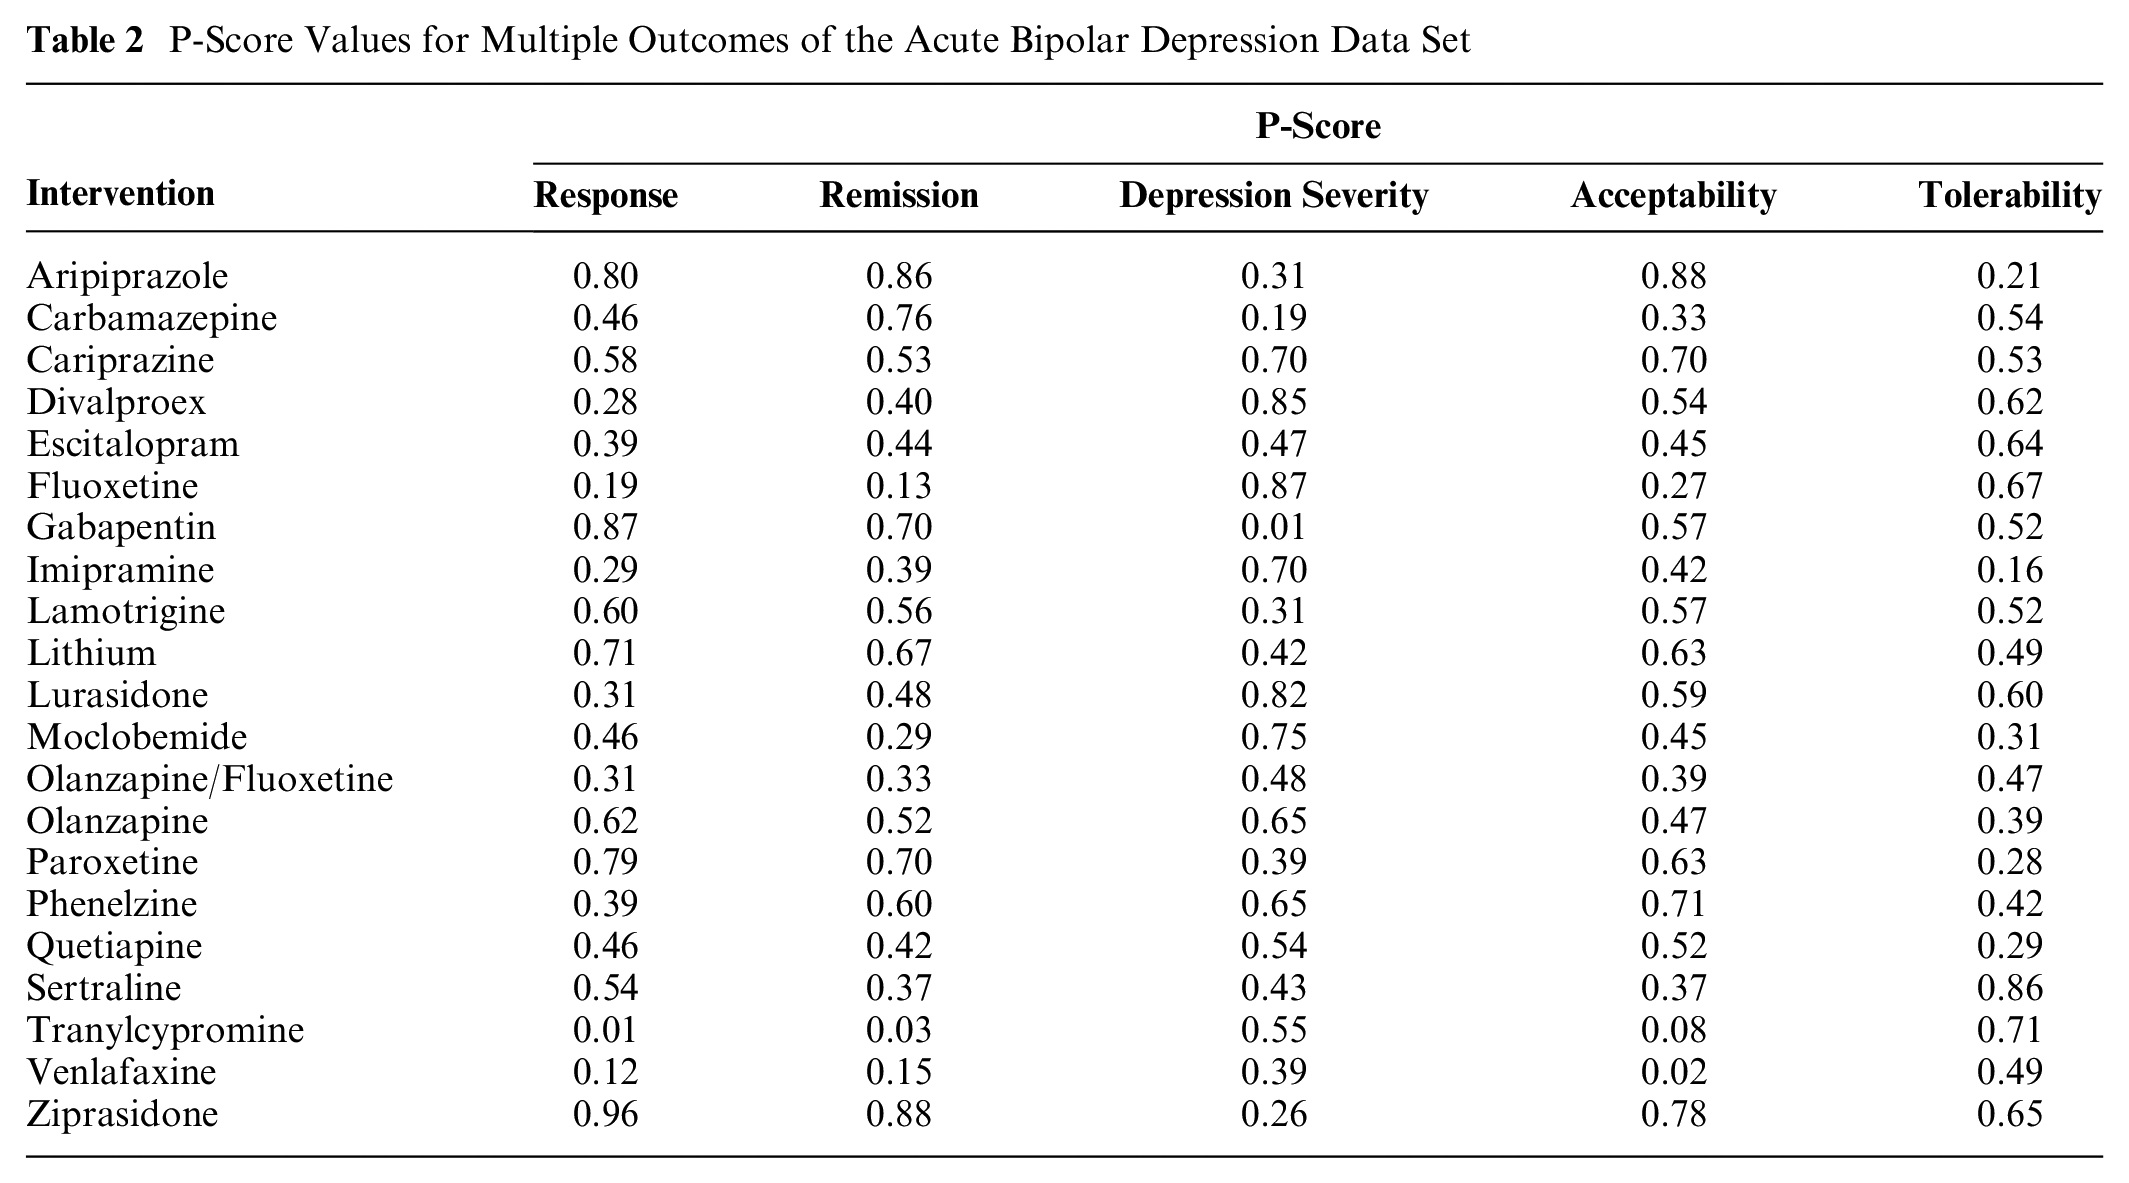
A total of 42 studies were pooled in a network meta-analysis comparing the effects of 21 interventions. 23 A frequentist model was applied, while summary odds ratios and standardized mean differences were reported. The outcomes of interest were the following: response rate (50% reduction in the total depression score), remission rate (Montgomery-Åsberg Depression Rating Scale <10 or Hamilton Depression Rating Scale <7), reduction in depression severity (change in rating score), acceptability (discontinuation out due to any reason), and tolerability (treatment-emergent affective switch). The estimated P-scores were used to rank the pharmacologic interventions (Table 2).
P-Score Values for Multiple Outcomes of the Acute Bipolar Depression Data Set
Absolute rankings were obtained with the TOPSIS, VIKOR and PROMETHEE II algorithms. For the PROMETHEE II analysis, the preference P-score threshold was set at 0.05 and the indifference threshold at 0.01. The similarity of rankings was evaluated using the
Simulated Data
The simulation study consisted of 1,000 simulated data sets of SUCRA values, ranging from 0% to 100% for different scenarios of available interventions and outcomes. Specifically, the number of alternative interventions was set to be 10, 15, or 25, while the evaluated outcomes were considered to be 2, 4, 6, or 8. As a result, 12 different scenarios were tested, and overall, 12,000 simulated data sets were created. SUCRA values were generated using the uniform distribution for each intervention and outcome. For each case, multicriteria decision analysis was applied with the TOPSIS, VIKOR, and PROMETHEE II methods, obtaining absolute rankings of the interventions. For the PROMETHEE II analysis, the linear preference function was applied, while the preference and indifference SUCRA thresholds were set at 5% and 1%, respectively. Equal weights of the outcomes were hypothesized. The similarity of rankings was evaluated using the
Results
Antidepressants for Major Depressive Disorder
The relationship between the SUCRA values for efficacy and acceptability is depicted in Figure 1. The outcomes of the absolute rankings generated by the TOPSIS, VIKOR, and PROMETHEE II methods are presented in Table 3. All methods indicated amitriptyline as the best intervention. More specifically, TOPSIS indicated as top interventions those with the highest S score, namely, amitriptyline (S: 0.821, rank 1), followed by mirtazapine (S: 0.715, rank 2) and paroxetine (S: 0.710, rank 3). Correspondingly, the VIKOR method indicated as best the following interventions with the lowest Q values: amitriptyline (Q: 0.004, rank 1), paroxetine (Q: 0.099, rank 2), and milnacipran (Q: 0.183, rank 3). It should be noted that both assumptions of the VIKOR algorithm were satisfied, as the difference between the Q values of paroxetine and amitriptyline was greater than 1/21, while amitriptyline had the lowest S and R values. The PROMETHEE II method demonstrated that the top treatments with the highest net Φ were amitriptyline (net Φ: 0.369, rank 1), escitalopram (net Φ: 0.286, rank 2), and paroxetine (net Φ: 0.274, rank 3). The similarity coefficient was 0.963 for the TOPSIS–VIKOR comparison, 0.949 for the VIKOR–PROMETHEE II comparison, and 0.965 for the TOPSIS–PROMETHEE II comparison.
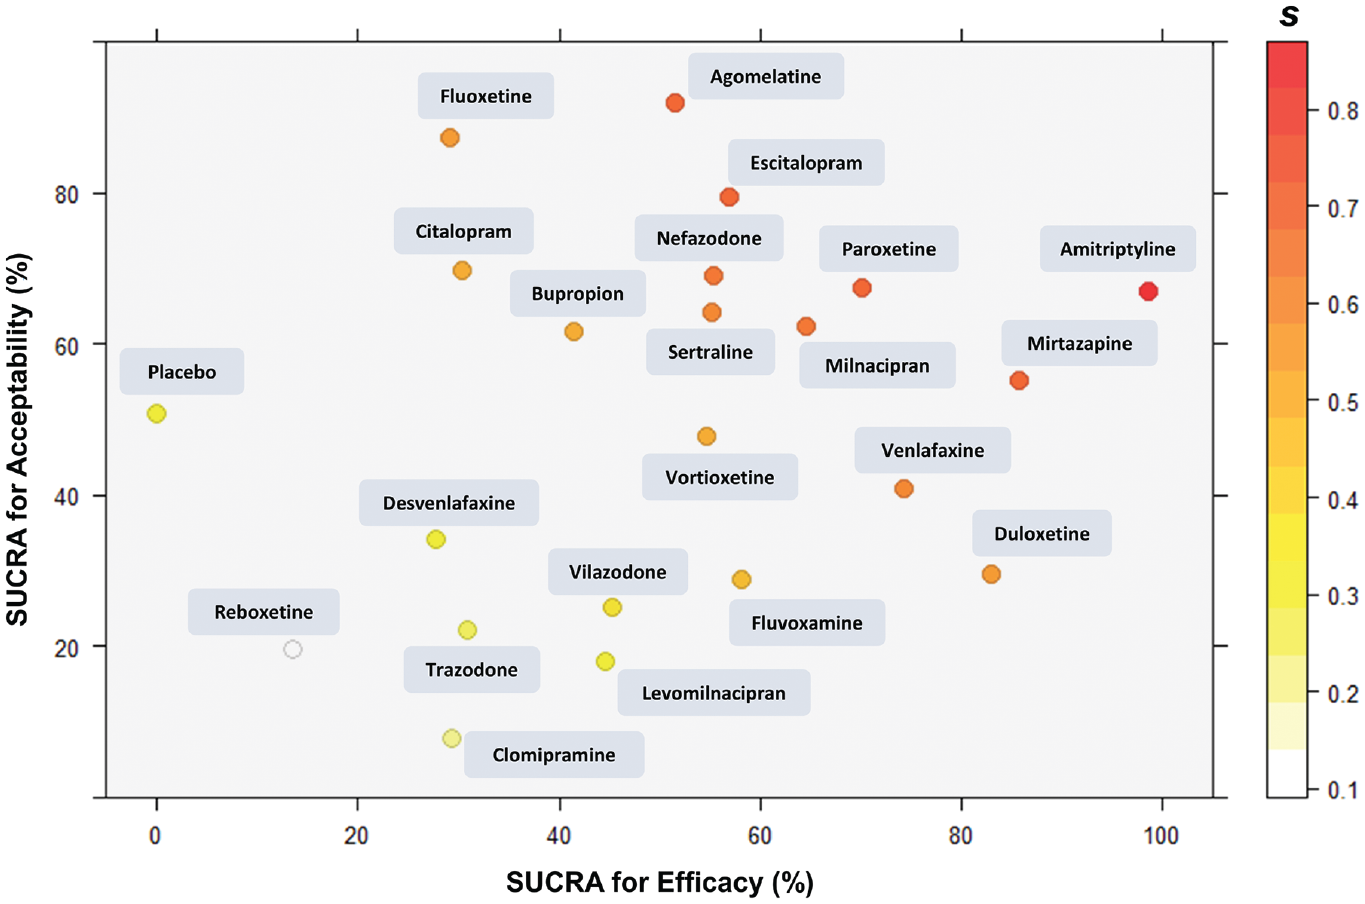
Scatterplot of surface under the cumulative ranking curve (SUCRA) values for efficacy and acceptability. Colors indicate the TOPSIS S score of interventions.
TOPSIS, VIKOR, and PROMETHEE II Rankings of Antidepressants Using Equal and Entropy-Defined Weights a
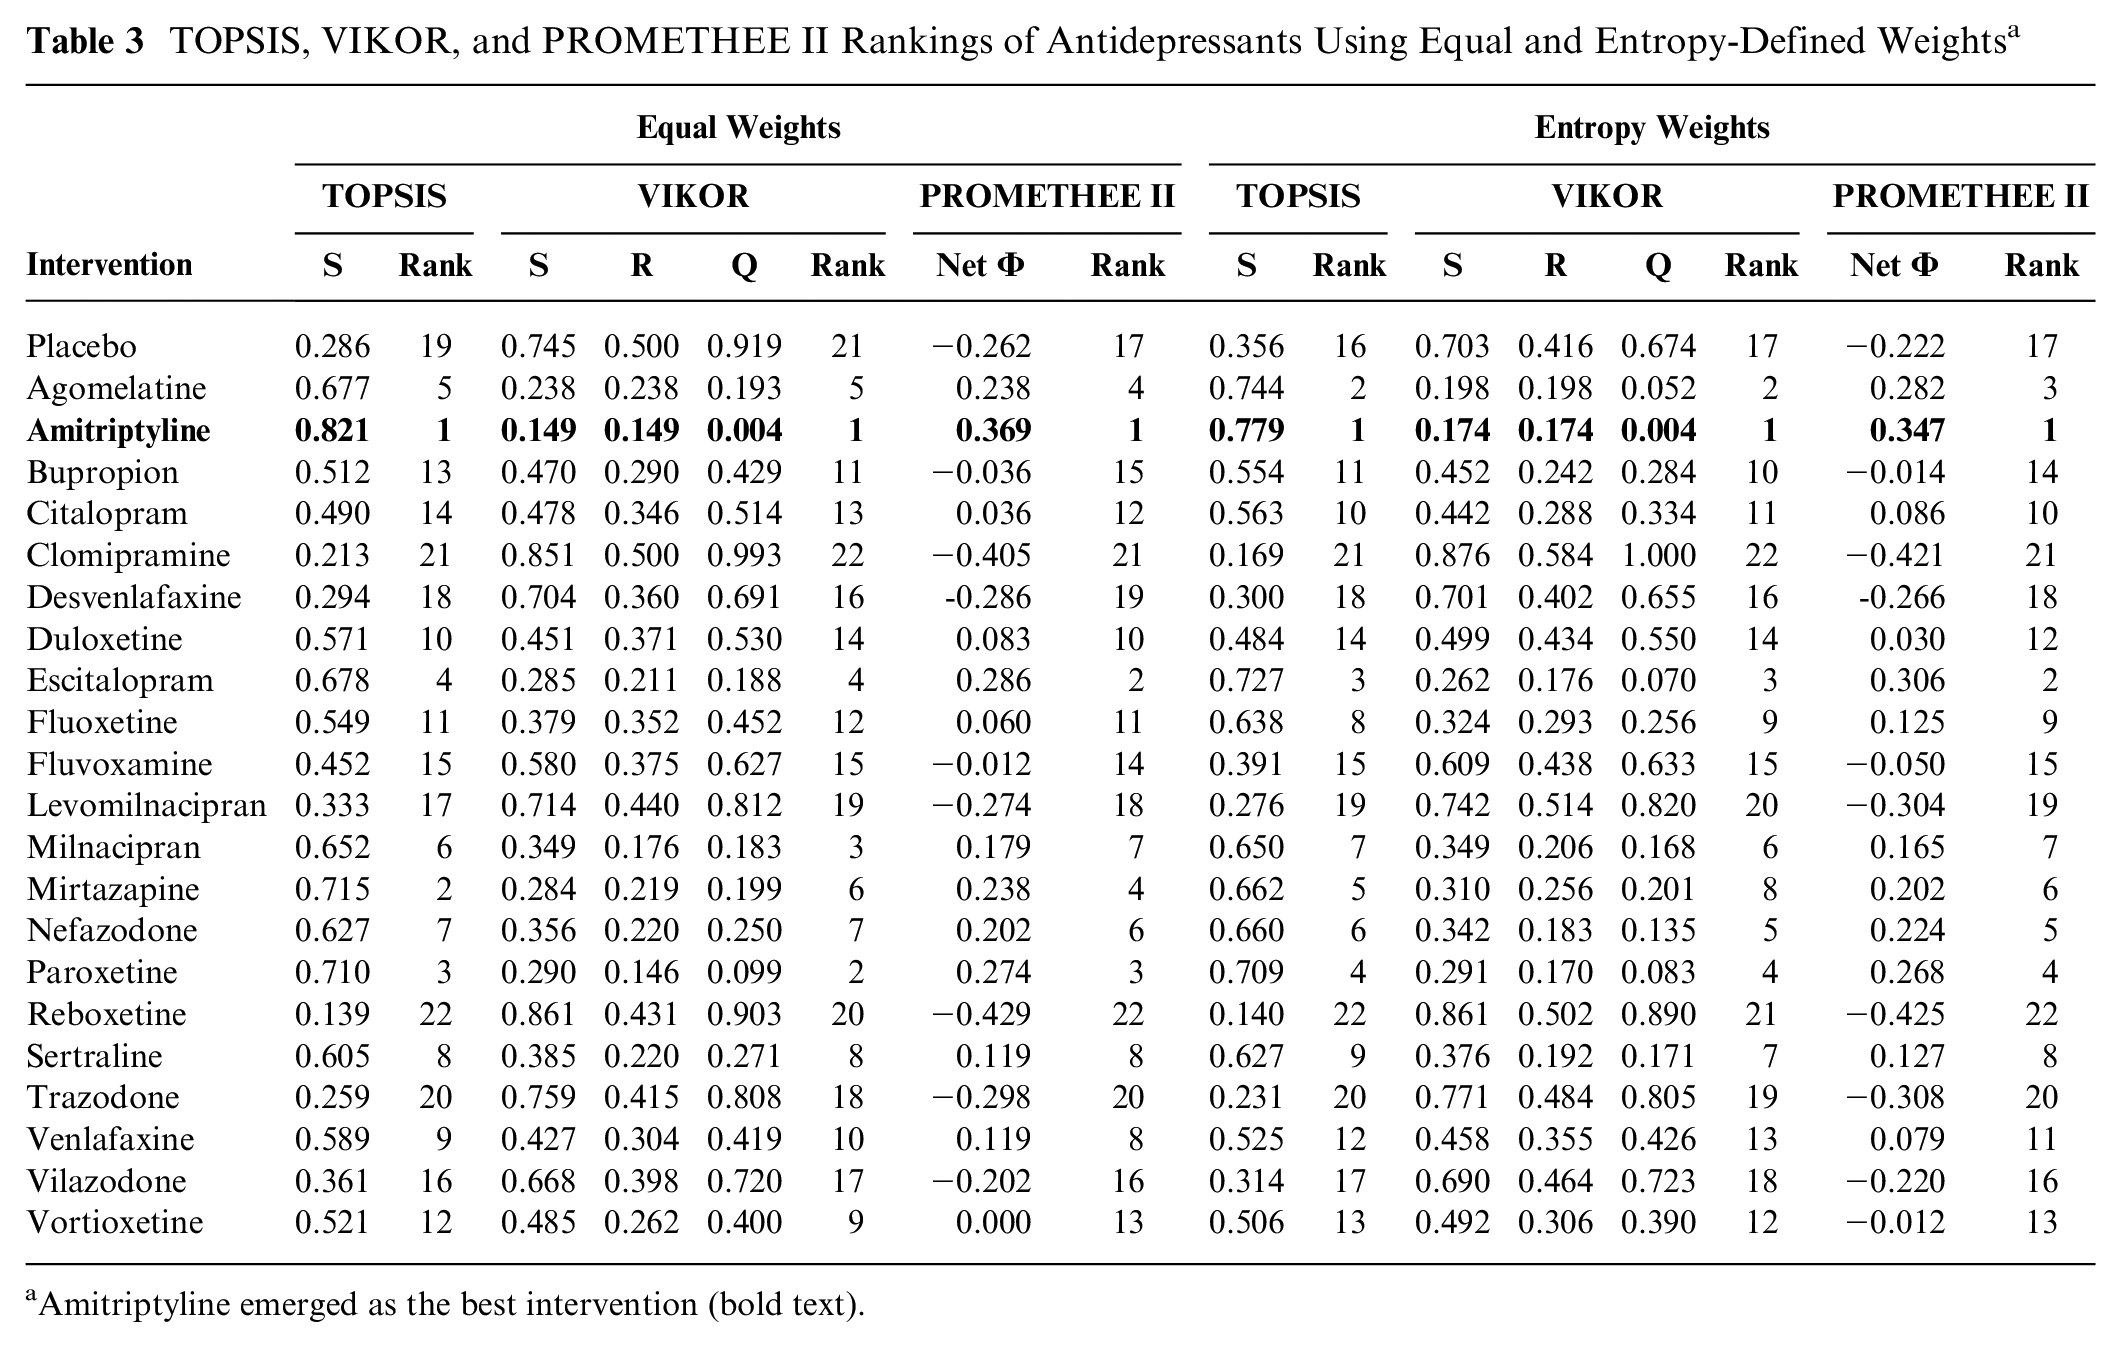
Amitriptyline emerged as the best intervention (bold text).
The partial ordering of alternatives according to the PROMETHEE I method is illustrated in Figure 2, suggesting that agomelatine is indifferent to mirtazapine, while sertraline is incomparable to venlafaxine. The entropy method assigned a weight of 0.416 and 0.584 to the efficacy and acceptability outcomes, respectively. The entropy-weighted analysis provided similar outcomes, with amitriptyline ranking first with all methods.
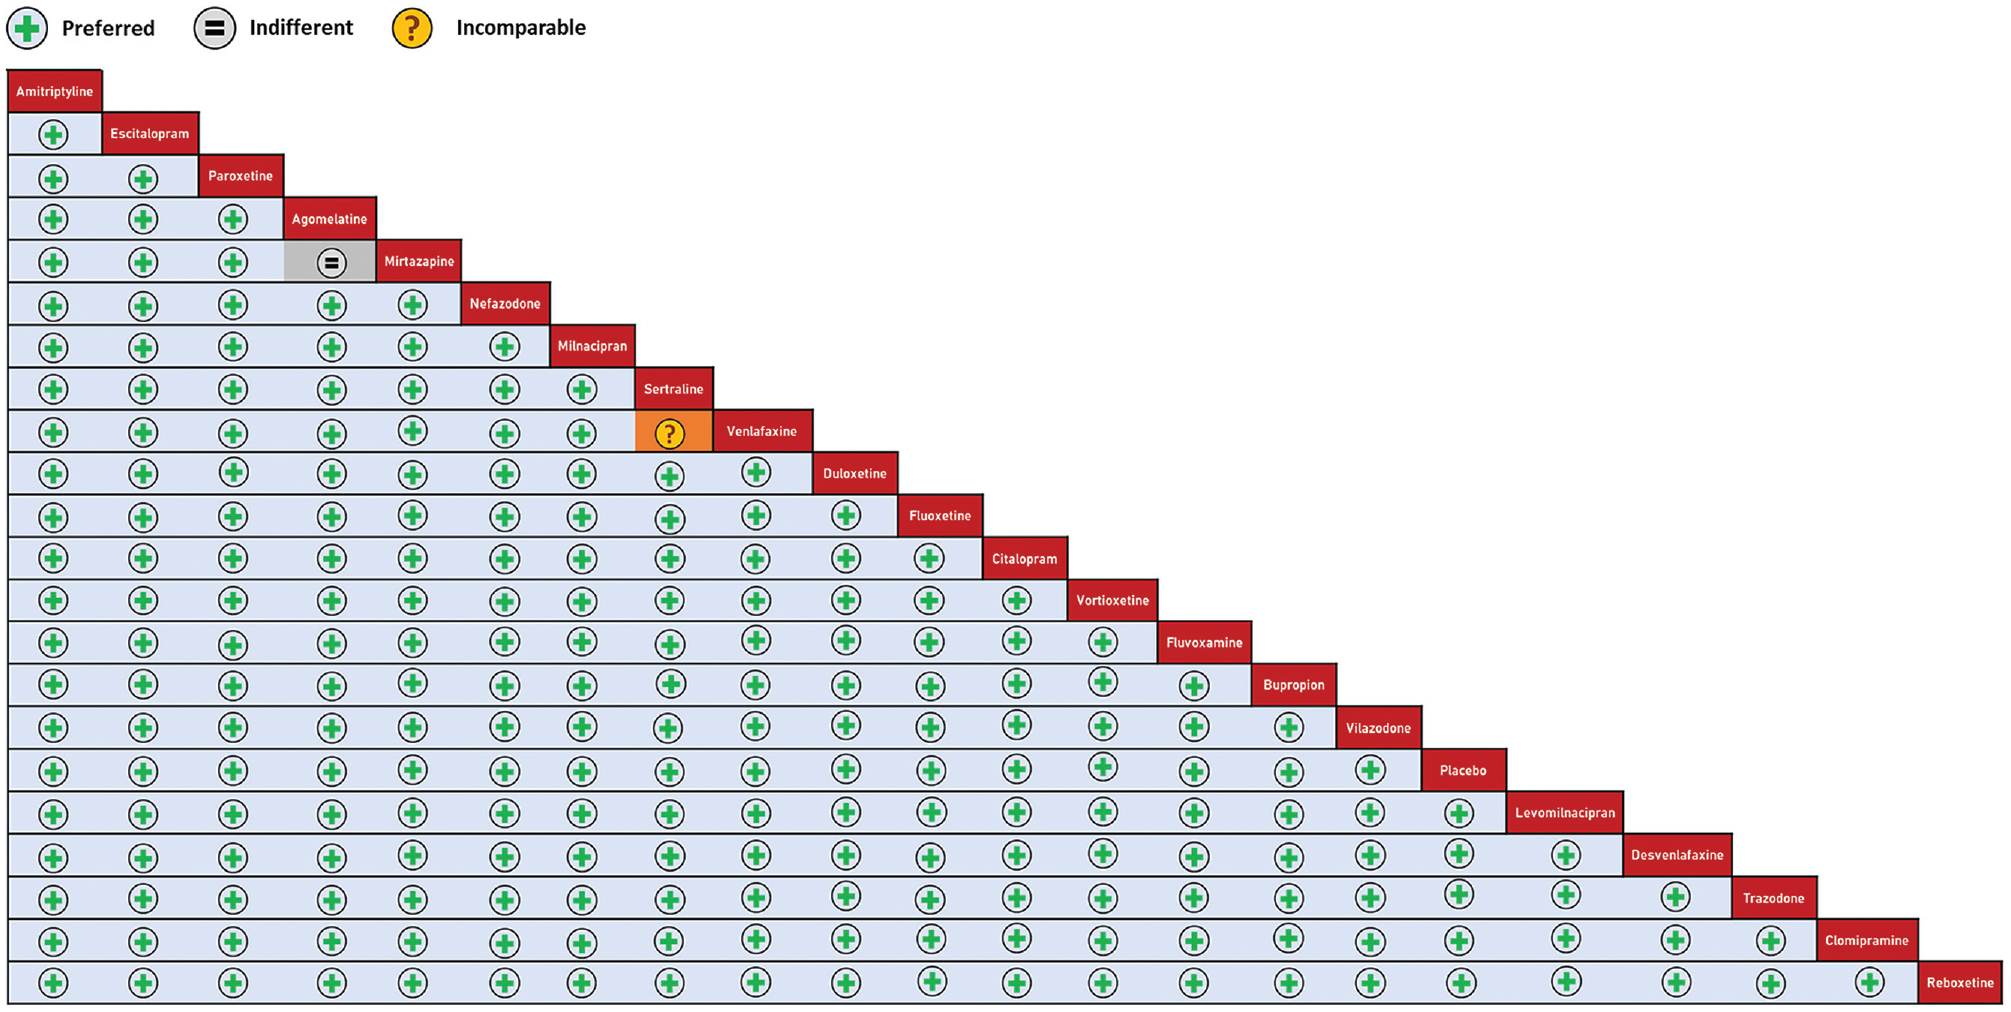
League table demonstrating the partial ordering of antidepressants according to the PROMETHEE I method.
Pharmacologic Treatments for Acute Bipolar Depression
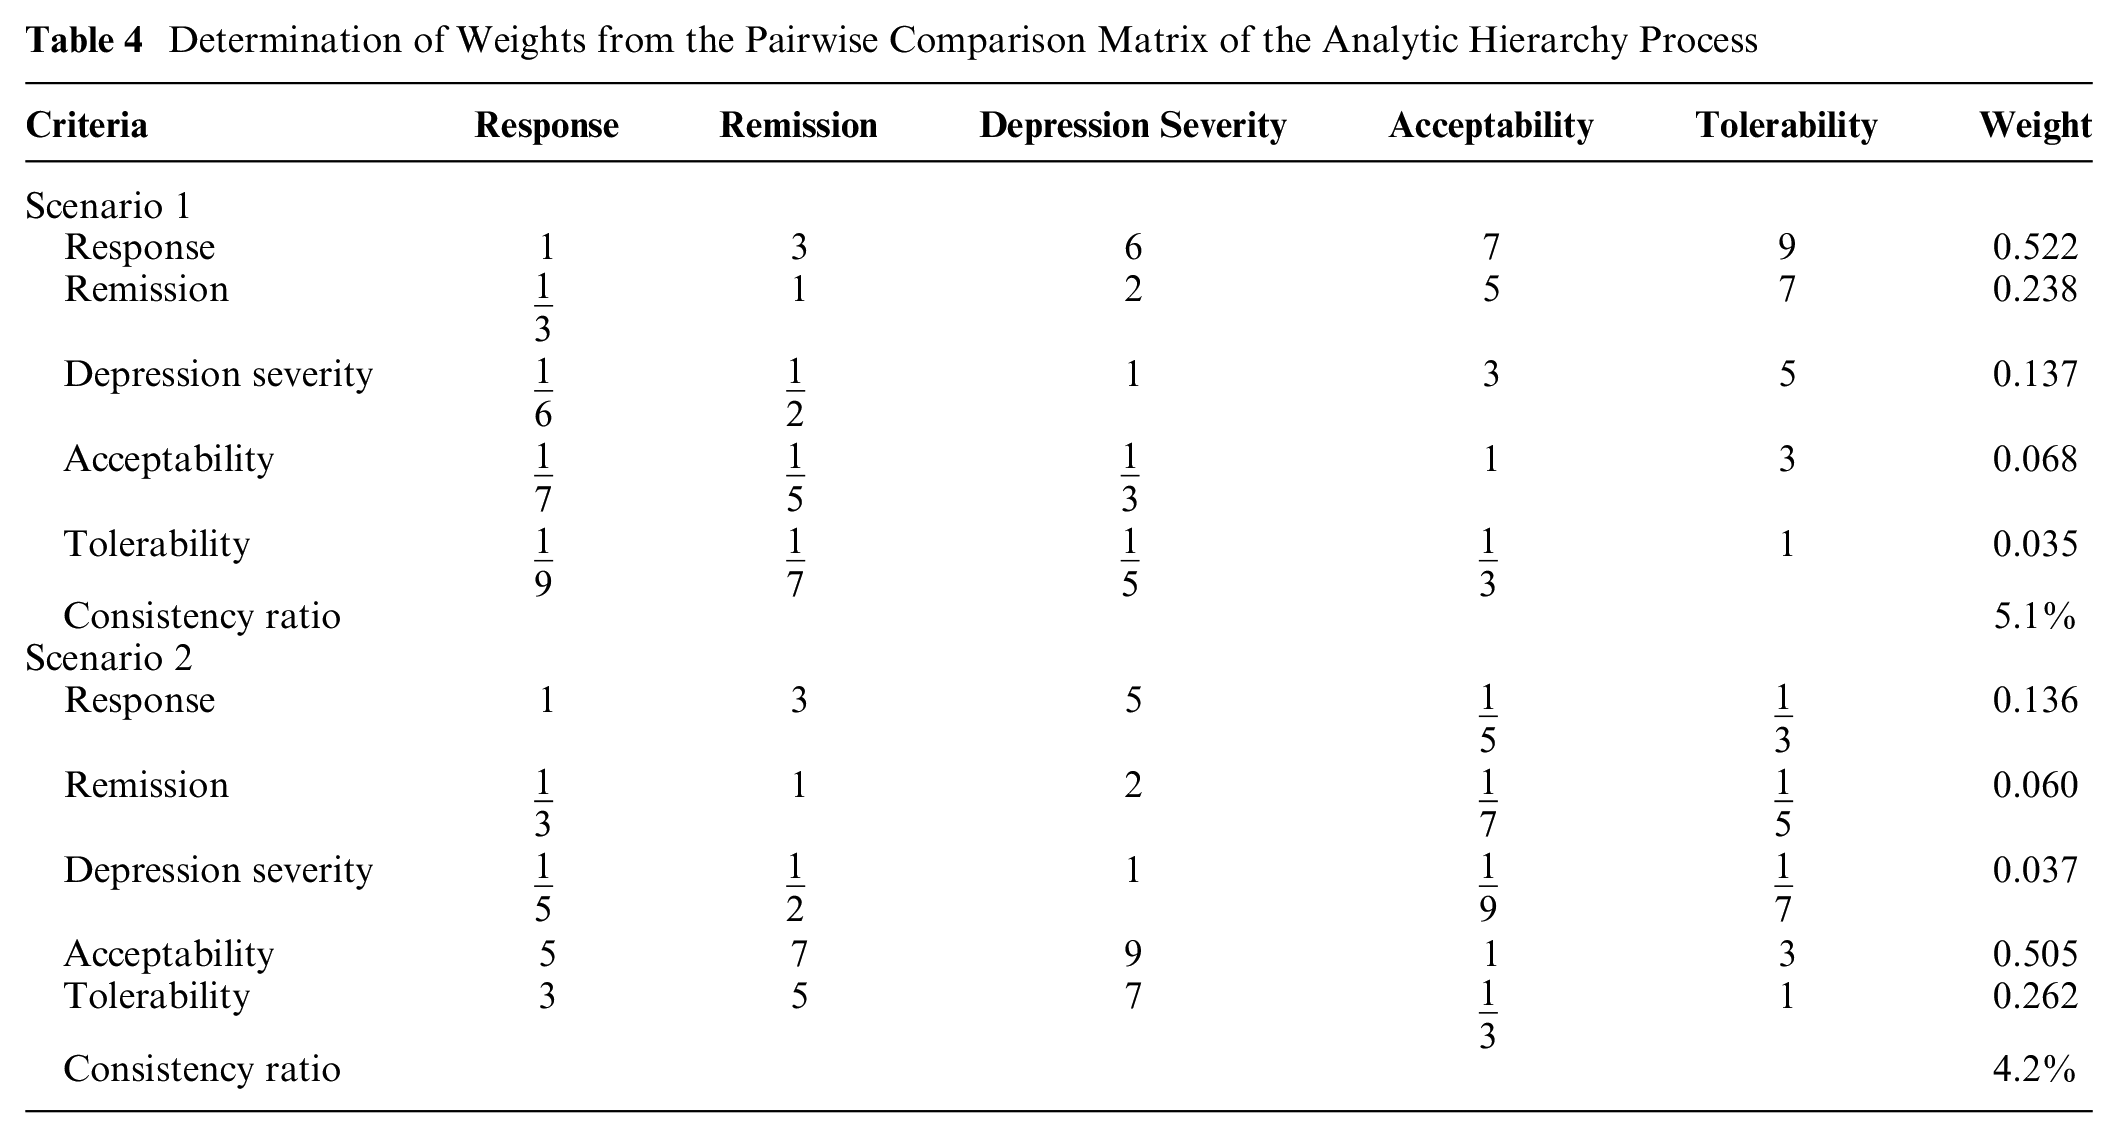
The pairwise comparison matrices are presented in Table 4. In the first scenario, the outcome of response is considered of moderate importance compared with remission, of strong importance compared with depression severity, of very strong importance compared with acceptability, and of extreme importance compared with tolerability. On the other hand, in the second scenario, the outcome of acceptability is deemed to be of moderate importance compared with tolerability, of strong importance compared with response, of very strong importance compared with remission, and of extreme importance compared with depression severity. As a result, in the first scenario, higher weights are assigned to the outcomes of response (
Determination of Weights from the Pairwise Comparison Matrix of the Analytic Hierarchy Process
The results of the TOPSIS, VIKOR and PROMETHEE II rankings are exhibited in Table 5. In both scenarios, tranylcypromine ranked first by all methods, with VIKOR assumptions being satisfied in both cases. Specifically, in both scenarios, tranylcypromine achieved the highest TOPSIS S score (scenario 1: 0.924, scenario 2: 0.897), the lowest VIKOR Q value (scenario 1: 0.000, scenario 2: 0.000), and the highest PROMETHEE II net Φ value (scenario 1: 0.175, scenario 2: 0.179). Therefore, it can be assumed that tranylcypromine may be the most appropriate intervention irrespective of whether the clinical management plan gives priority to efficacy or acceptability. For the first and second scenario, the similarity coefficient was 0.998 and 0.999 for the TOPSIS-VIKOR comparison, 0.978 and 0.977 for the VIKOR-PROMETHEE II comparison, and 0.979 and 0.978 for the TOPIS-PROMETHEE II comparison, respectively.
TOPSIS, VIKOR, and PROMETHEE II Rankings of Interventions for Acute Bipolar Depression Placing More Importance on Efficacy (Scenario 1) and Acceptability (Scenario 2) a
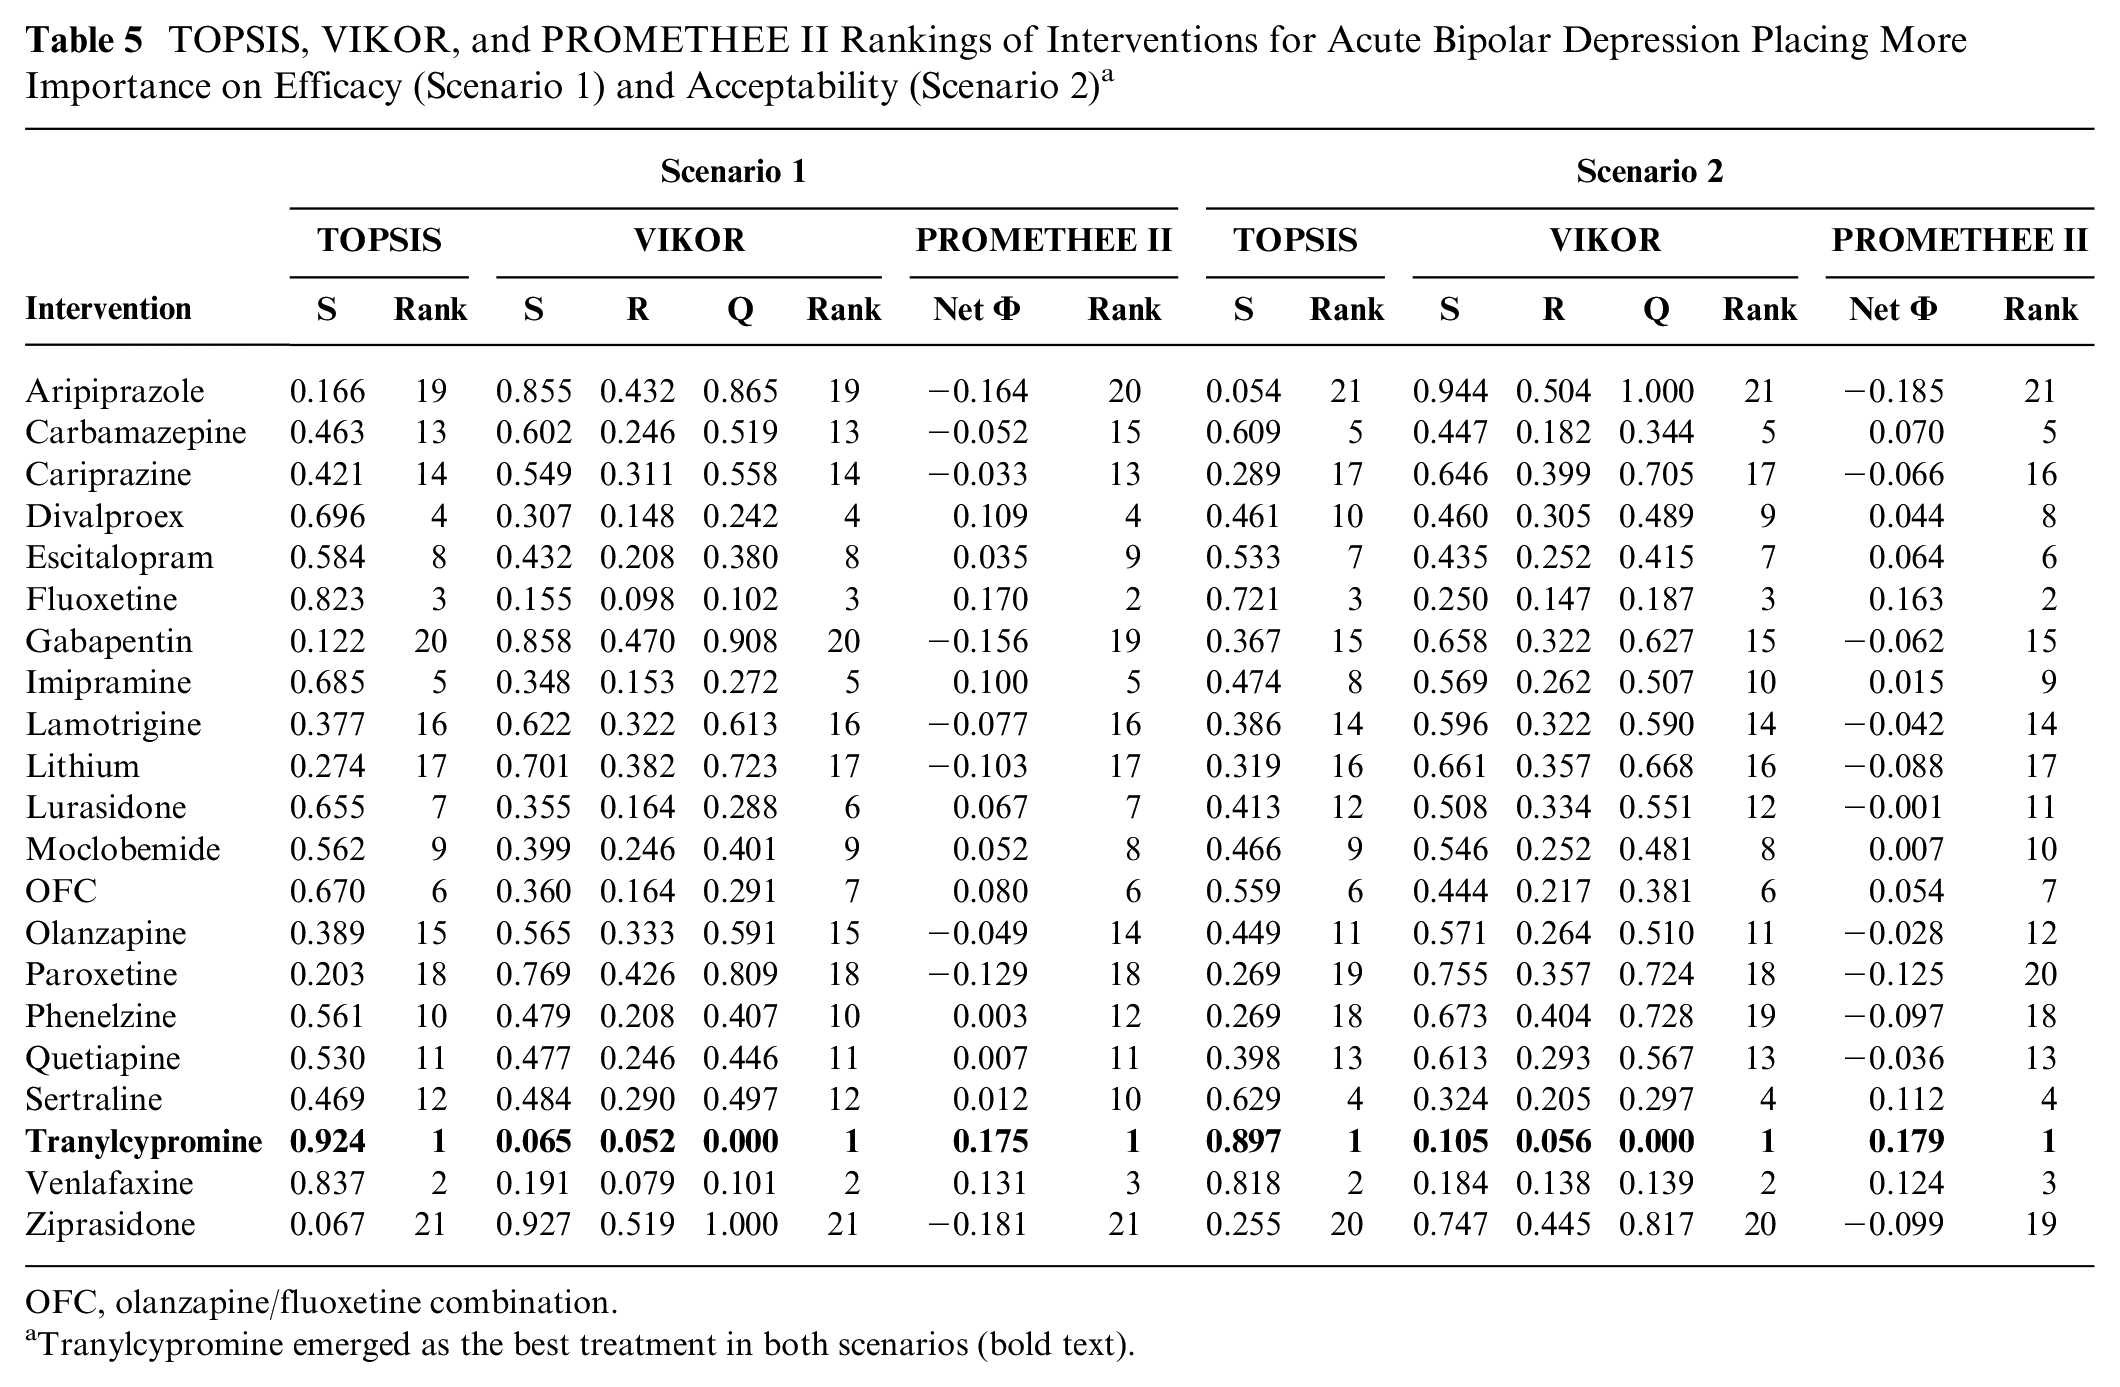
OFC, olanzapine/fluoxetine combination.
Tranylcypromine emerged as the best treatment in both scenarios (bold text).
Simulated Data
The similarity of absolute ranking methods for various scenarios of different numbers of interventions and outcomes is schematically presented in Figure 3. Specifically, a high degree of similarity was observed for the TOPSIS-VIKOR comparison, with a median
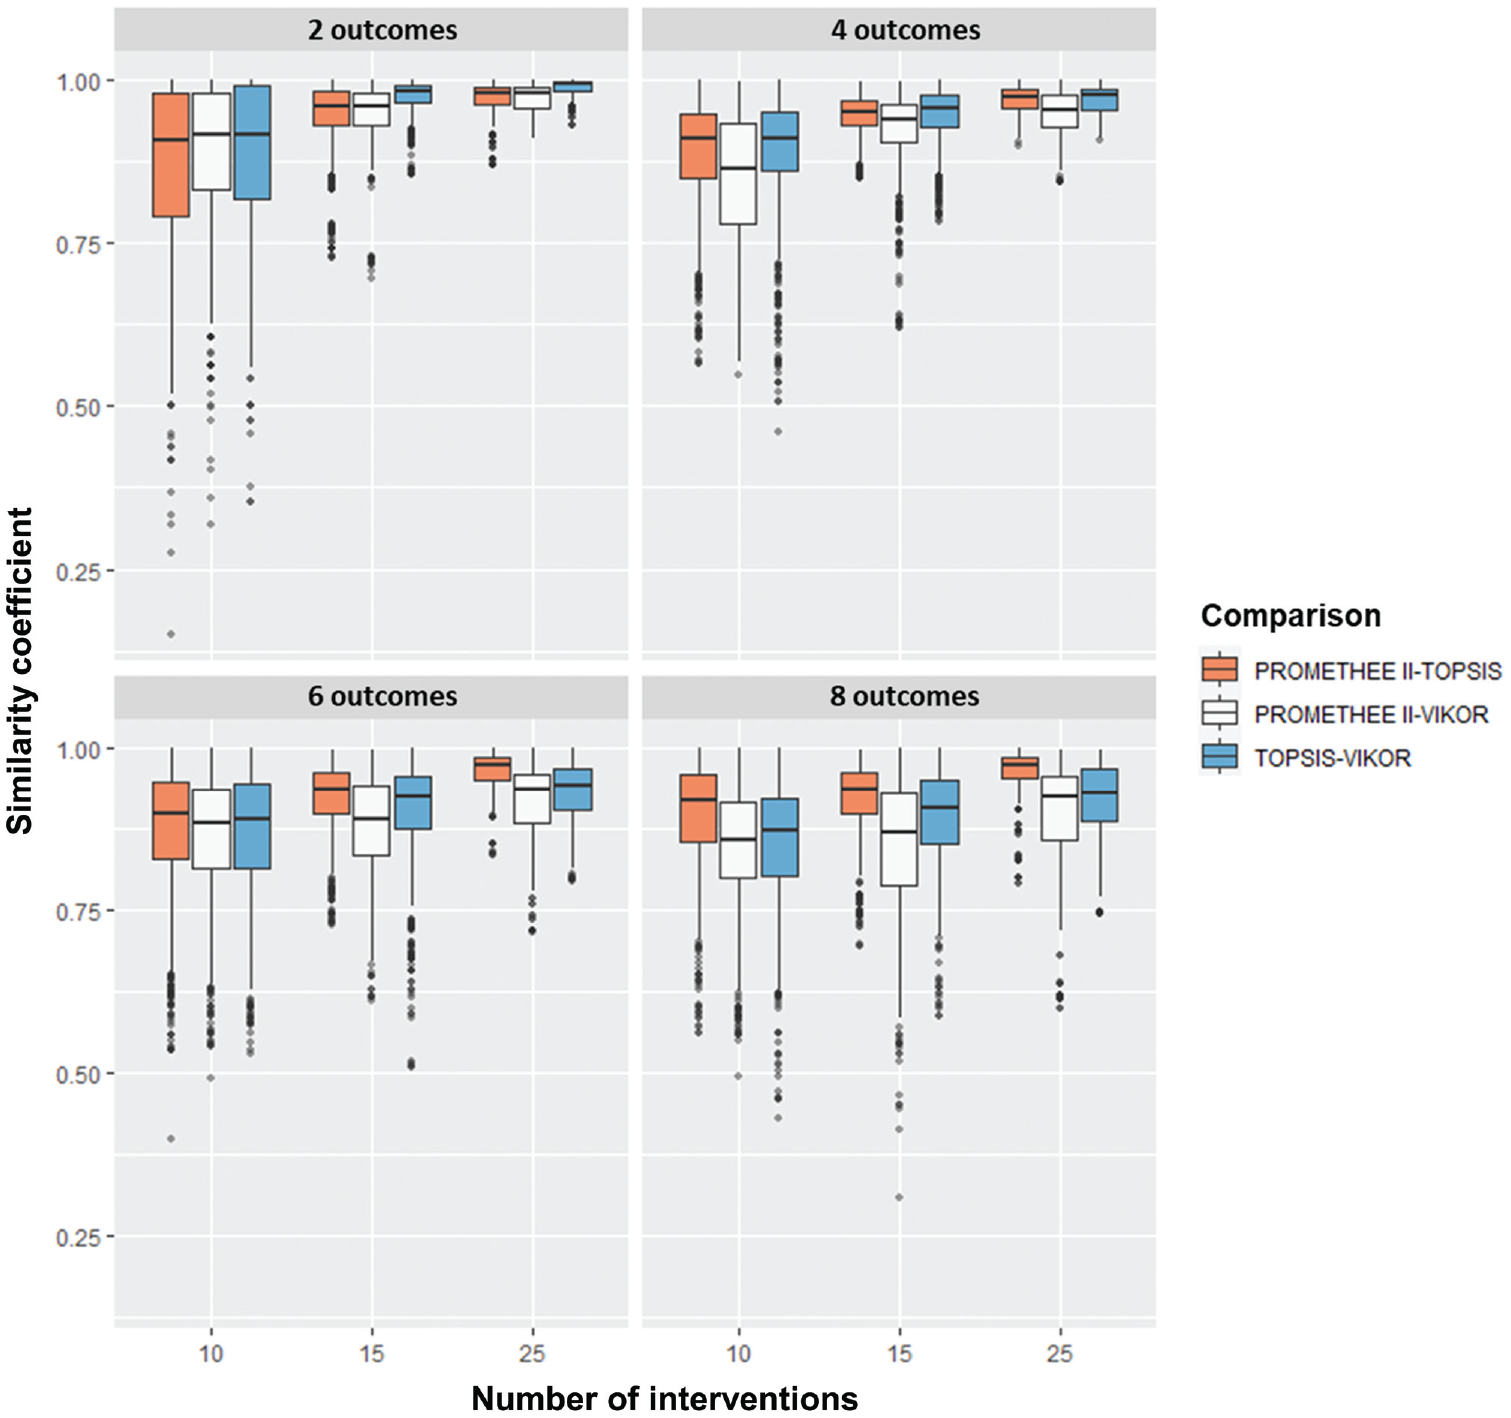
Boxplots of simulated data displaying the similarity of TOPSIS, VIKOR, and PROMETHEE II methods for a different number of interventions and outcomes.
Discussion
Network meta-analysis constitutes an important tool for decision making in health care, as it enables the ranking of interventions preserving randomization. Network meta-analyses typically implement a univariate approach, although multiple outcomes are often evaluated in parallel. Therefore, decision making requires the identification of compromise solutions, taking into account the treatment rankings across various outcomes. To this end, the present study suggested the application of the TOPSIS, VIKOR, and PROMETHEE II methods in network meta-analysis to obtain absolute multicriteria rankings based on the estimated SUCRA or P-score values across multiple outcomes. The results of these methods were compared in real-world meta-analyses, as well as in simulated data sets, suggesting an overall high degree of agreement. It should be stated that higher similarity coefficients were obtained with a higher number of interventions and a lower number of outcomes. As a result, more than 1 method may be applied by reviewers of network meta-analyses with a low interventions-to-outcomes ratio to test the stability of treatment rankings.
A new graphical tool was proposed, especially in cases in which 2 outcomes were assessed. Specifically, a scatterplot of SUCRA values was constructed, coloring points according to their TOPSIS
The implementation of PROMETHEE I in network meta-analysis may serve as a useful decision-making tool, as partial ordering is able to reveal complex relationships among interventions. This approach may overcome the limitations of absolute rankings, allowing the identification of interventions that are indifferent or even incomparable to others. 16 An analogous method of partial ranking has been suggested for the resolution of conflicting rankings, proposing the construction of Hasse diagrams. 7 The present methodology extends this approach, suggesting the visualization of partial ordering in a league table, which is less complicated, especially when the number of the compared interventions is large.
The results of decision analysis may be highly dependent on the applied outcome weights. Apart from equal-weight analysis, the objective entropy method was proposed, as it provides a direct way of assigning superior weights to outcomes containing more information than others. 28 Alternatively, the subjective analytical hierarchical process allows the decision maker to place greater importance on certain outcomes depending on the clinical scenario and preference. The process is flexible and computationally simple and allows the use of verbal judgments as well as the evaluation of consistency. 29 In this context, network meta-analyses may include multiple sensitivity analyses assigning superior weights to different outcomes, enabling the individualized choice of the most appropriate treatment for specific patient populations.
The incorporation of decision analysis methods in network meta-analysis may be complicated by the inherent limitations of the metrics used for treatment ranking. Specifically, the SUCRA and P-score values include no information about statistical uncertainty; hence, they should be interpreted in the context of the confidence intervals of the effect measure. The quality of evidence is also not taken into account, and the possibility of bias should be considered. 30 The generalizability of the comparison of the 3 methods may be limited by the use of the uniform distribution for the generation of SUCRA values in the simulation study; therefore, their degree of agreement remains to be confirmed in real-world network meta-analyses. It is also important to note that the possibility of choosing from various decision analysis methods with different normalization algorithms and outcome weights may increase the degrees of freedom during the analysis, increasing the risk of selective reporting; hence, the exact plan for implementation of specific multicriteria algorithms should be prespecified in the protocol of network meta-analyses.
In conclusion, the TOPSIS, VIKOR, and PROMETHEE multicriteria decision analysis methods can be incorporated in network meta-analysis, contributing to optimal treatment selection when multiple conflicting outcomes are simultaneously evaluated. The weights of different outcomes may be defined objectively or subjectively to reflect the priorities of the decision maker. Future research should be directed toward testing alternative weighting methods, providing empirical data about the utility of multicriteria methods in network meta-analysis, and determining the most appropriate algorithm depending on the clinical question.
Supplemental Material
sj-docx-1-mdm-10.1177_0272989X221126678 – Supplemental material for Multicriteria Decision-Making Methods for Optimal Treatment Selection in Network Meta-Analysis
Supplemental material, sj-docx-1-mdm-10.1177_0272989X221126678 for Multicriteria Decision-Making Methods for Optimal Treatment Selection in Network Meta-Analysis by Ioannis Bellos in Medical Decision Making
Footnotes
The author declared no potential conflicts of interest with respect to the research, authorship, and/or publication of this article. The author received no financial support for the research, authorship, and/or publication of this article.
Data Availability Statement
The codes used in the analysis are provided as supplementary material.
References
Supplementary Material
Please find the following supplemental material available below.
For Open Access articles published under a Creative Commons License, all supplemental material carries the same license as the article it is associated with.
For non-Open Access articles published, all supplemental material carries a non-exclusive license, and permission requests for re-use of supplemental material or any part of supplemental material shall be sent directly to the copyright owner as specified in the copyright notice associated with the article.