
Abstract
Background.
Researchers widely use discrete choice experiments (DCEs) to assess health preferences across subgroups. However, variations in decision consistency, rather than true differences in preferences, can drive observed utility differences. Despite the growing use of DCEs to assess health preference heterogeneity, recent studies highlight a persistent lack of methodological transparency in accounting for unobserved heterogeneity, underscoring the need for technically robust approaches to support credible and actionable comparisons across groups. This study improves health preference research methods by directly addressing scale heterogeneity and reducing bias when comparing subgroups.
Methods.
A simulated DCE evaluated hypothetical cancer treatments across 2 imagined groups (patients, caregivers). Each task presented 3 alternatives (including a status quo), varying in months gained, survival rate, side-effect severity, and out-of-pocket cost. Mixed logit models were estimated. Scale heterogeneity was addressed using the Swait–Louviere 2-step procedure. Willingness to pay (WTP) was computed and compared across groups via the Poe et al. (2005) simulation-based test.
Results.
The Swait–Louviere test confirmed significant scale heterogeneity (P < 0.05) but no meaningful taste differences (P > 0.10). Once scale effects were accounted for, the analysis revealed a shared preference structure across patients and caregivers, with variability driven by inconsistent decision making rather than true preference divergence. Consistent with this, none of the between-group WTP differences were statistically significant, reinforcing the absence of meaningful subgroup contrasts and underscoring the importance of separating scale from taste to avoid biased inference.
Conclusions.
Adjusting for scale heterogeneity strengthens DCE validity by reducing bias from decision noise and enabling accurate subgroup comparisons. Using simulated data, this study applied the Swait–Louviere 2-step and scale-invariant WTP contrasts to separate taste from scale; both methods converged, showing that heterogeneity reflected scale rather than true preference differences, with negligible WTP gaps. Routine scale diagnostics, taste (preference) tests under equalized scale, and welfare space reporting are recommended to ensure valid inference. However, as this study used simulated data with no real respondents, its findings are illustrative only and not intended for real-world inference; generalizability and external drivers of scale heterogeneity were not assessed.
Key Highlights
The study enhances methodological rigor by explicitly addressing scale heterogeneity—an often-overlooked bias that improves the validity and real-world relevance of preference-based insights.
Applying the Swait–Louviere test and willingness to pay, whenever possible, enables researchers to distinguish true preference differences from response inconsistency across choice datasets.
The findings advocate for the routine inclusion of scale diagnostics in stated-preference research to strengthen health decision making and modeling practice.
This is a visual representation of the abstract.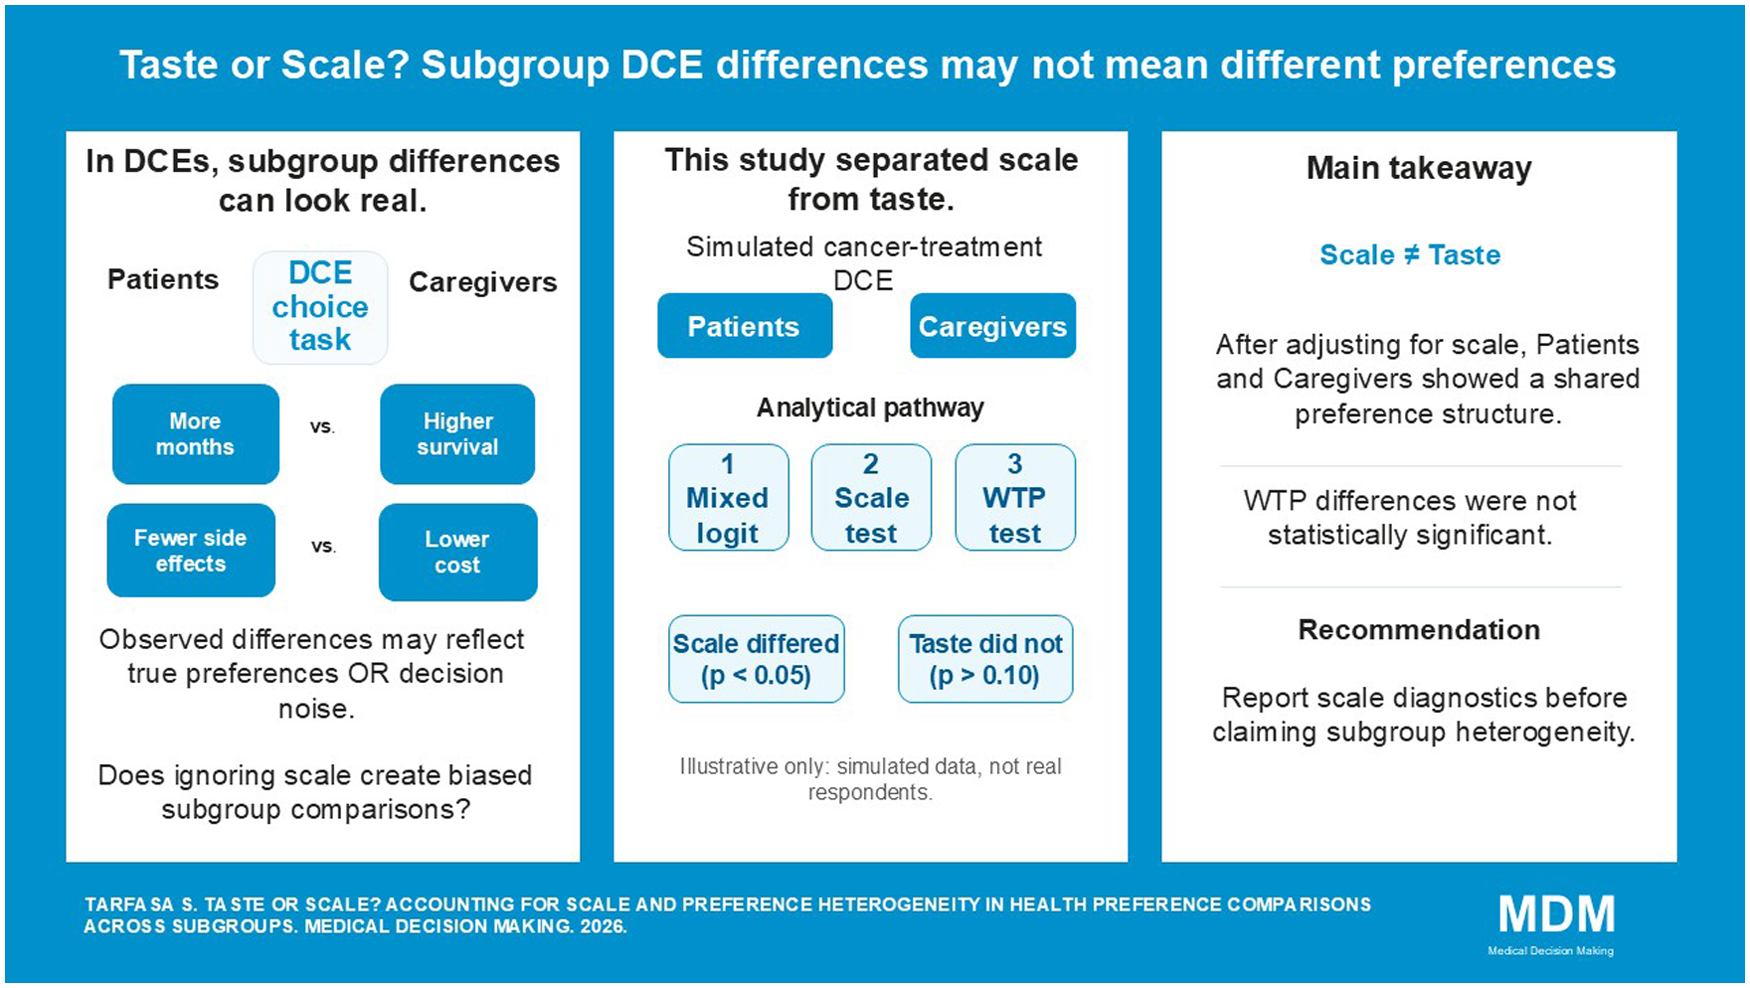
Keywords
Over the past 2 decades, discrete choice experiments (DCEs) have become ubiquitous in health economics because they are practical, efficient, and suited to questions faced by regulators, industry, health technology assessment bodies, and patient groups. 1 Growth has been propelled by patient-centered care, which values methods that elicit and quantify patient concerns and preferences. 2 Preference evidence already informs decisions: for example, the US Food and Drug Administration’s device center has used DCE findings, and in Canada, patient perspectives are considered within the deliberative framework of Canada’s Drug Agency alongside clinical and economic inputs. 3 Collected via qualitative or mixed-methods workflows, preference data support judgments about acceptability, tradeoffs, and equity, helping align interventions with public values and needs.4,5
DCEs provide a systematic, quantitative way to elicit stakeholder perspectives—patients, caregivers, clinicians, and decision makers—making them useful for judging intervention acceptability across settings. 6 By revealing how people trade off benefits and risks, DCEs link clinical evidence to patient-centered care, supporting more tailored and effective solutions. Comparing preferences across groups is essential for understanding decision making and judging generalizability. Applications include subgroup comparisons in health state valuations, informing shared decision making, and evaluating alignment across elicitation methods.7–10 Notably, DCE and threshold technique can yield divergent rankings and fail to predict screening choices, underscoring the need for transparent, method-aware comparisons. 11
Interpreting subgroup comparisons is challenging because choice model coefficients bundle taste (preferences) with scale (error variance). 5 In DCEs, observed heterogeneity arises from differences in preferences (how individuals value attributes) and scale (how consistently they make choices); scale may reflect latent factors such as attentiveness or unobserved attributes and, if ignored, can bias structural parameters in unknown directions biasing conclusions and recommendations.11–13 Despite its prevalence, few health care DCEs explicitly diagnose scale heterogeneity and apply formal identification strategies.14–16 Several early studies compared raw coefficients from separately estimated models without accounting for scale, thereby conflating preference differences with choice consistency and assuming homogeneous tastes.17–19 Only a few studies have formally addressed scale heterogeneity using the Swait–Louviere test and flexible model specifications, yielding more defensible subgroup comparisons.20,21
Most prior work relied on observed covariates and overlooked unobserved scale effects, rarely separating scale from taste. To the best of the author’s knowledge, this is the first study to address this gap by combining the Swait–Louviere test for cross-group scale adjustment with a willingness-to-pay (WTP) space strategy to isolate genuine preference differences net of scale.
Objective of the Study
The objective of this study is to test whether observed differences in stated preferences between hypothetical patients and caregivers reflect true variations in values or are driven by differences in decision consistency (scale heterogeneity), using simulated data to support methodological investigation in health preference research.
Methods
Discrete Choice Experiments
DCEs rely on attributes and their levels to describe goods, services, or policies, generating profiles via experimental design theory. 22 Choice experiments (CEs) are part of the family of stated preference methods that typically ask respondents in a series of choice tasks to choose between 2 or more alternative policies, which are described based on their relevant characteristics.23,24 Preferences for existing or new products, technologies, or policy programs are elicited using a social survey format, such as in-person or online interviews. 22 This allows estimation of public demand for these policies and preferences for their specific characteristics or attributes. Usually, the benefits associated with the policies and the costs involved, for example, the price individual respondents would have to pay to secure the described policy benefits, are described. The inclusion of a monetary attribute in the DCE allows estimation of public WTP for the intervention.
Econometric Choice Model
Preferences are modeled under the random utility model, where utility

where
A mixed-logit model was used in this study that accounts for preference heterogeneity in both observed and unobserved preferences but requires computationally intensive procedures to estimate probabilities. 24
The decision to use mixed logit rather than the generalized multinomial logit (GMNL) model was guided by methodological considerations. While the GMNL model provides a structured framework for disentangling heterogeneity components, there is ongoing debate about its ability to do so effectively. Some studies suggest that the GMNL model may not fully separate preference heterogeneity from scale heterogeneity, as the estimated scale parameter might also capture other forms of correlation among utility coefficients. 23
Preference and Scale Equality Test
A statistical test procedure was conducted to formally evaluate whether preferences differ across the 2 groups, examining both taste and scale heterogeneity.
27
This method distinguishes 2 primary sources of heterogeneity: scale heterogeneity, which reflects variations in the consistency of choices due to differences in the variance of the unobserved utility component, and taste heterogeneity, which captures variations in preference parameters for treatment attributes. To disentangle scale from taste, this test 1) conducted a grid search of a relative scale factor (λ) that maximizes the pooled log-likelihood when one group’s coefficients are rescaled and 2) conducted likelihood ratio (LR) tests at the optimal λ to assess scale and taste equality using group-specific and pooled fits. Each value of λ is used to reestimate the pooled model, and the log-likelihood is recorded. The optimal scale factor (
Two LR Tests Are Performed
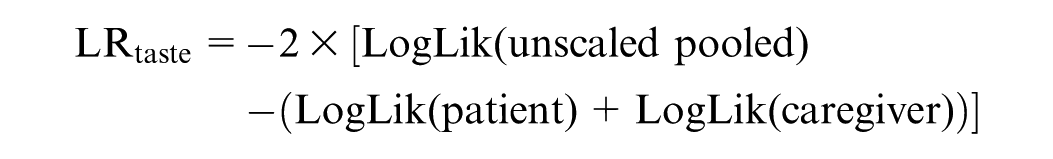
A nonsignificant result indicates no statistical difference in preferences between groups.

A nonsignificant result indicates no statistical difference in scale (error variance). This 2-step procedure allows rigorous testing of whether observed differences in model estimates reflect true preference heterogeneity or merely differences in decision consistency.
Scale-Invariant WTP
Because coefficient-space comparisons confound taste with scale, the study also computed marginal rates of substitution, reported as WTP:
Study Design and Data
This study used a fully simulated dataset that shares the same attribute set and levels, and no real respondents were involved. An unlabeled, full-profile DCE was conducted with 3 alternatives per task, where the third represented the status quo. Each simulated respondent completed 3 choice tasks. Two hypothetical populations—patients and caregivers—were simulated, with 500 respondents per group (1,000 total decision makers). This design enables the controlled evaluation of whether cross-group differences in estimated coefficients reflect genuine taste differences versus scale heterogeneity (differences in decision consistency) when participants prioritize the same attributes. Group labels were assigned to distinguish between patients and caregivers.
Attributes and choice rules
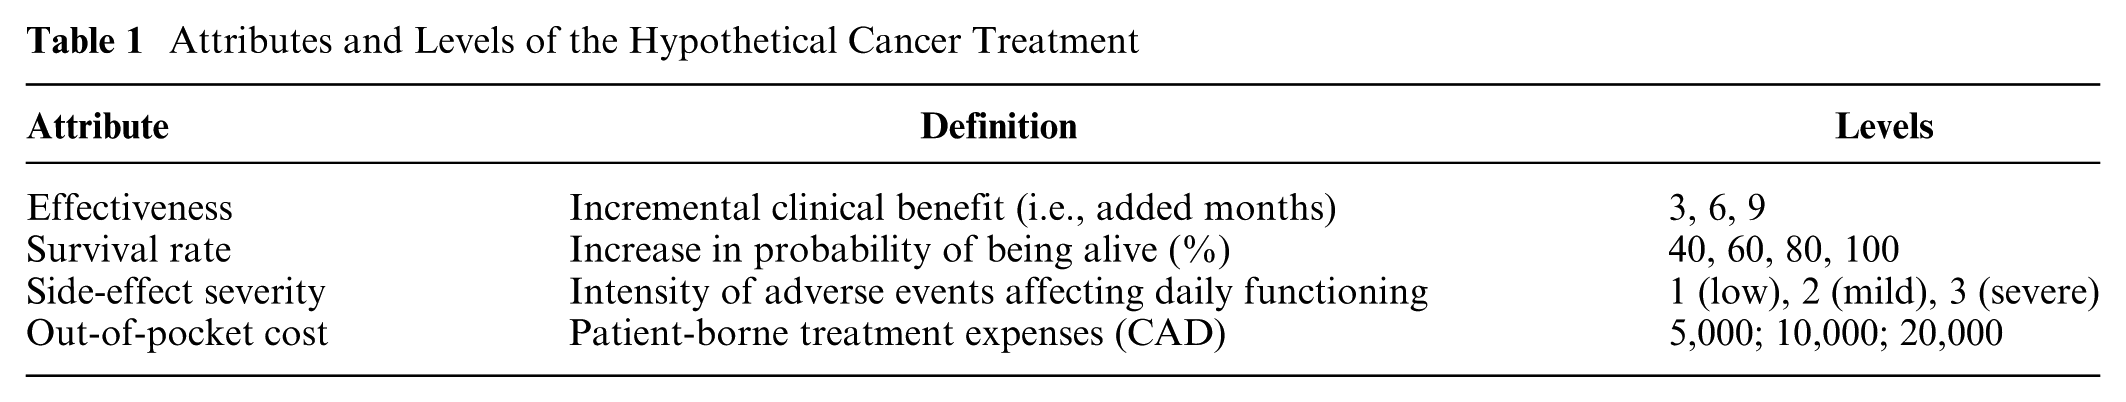
Attribute selection and level ranges were informed by the published literature. 30 A hypothetical cancer treatment was characterized by 4 attributes: 1) treatment effectiveness, expressed as additional months gained (3, 6, or 9 mo); 2) survival rate (40%, 60%, 80%, or 100%); 3) side-effect severity (1 = low, 2 = mild, 3 = severe); and 4) out-of-pocket cost (CAD 5,000, 10,000, or 20,000). Attribute levels were randomly drawn with replacement for each alternative within each task (Table 1).
Attributes and Levels of the Hypothetical Cancer Treatment
Simulation and utility specification
Utilities were generated using group-specific preference parameters for patients and caregivers representing the relative importance of effectiveness, survival, side effects, and cost, respectively. A random Gumbel error term was also added, which captured unobserved variation. The simulated respondents were assumed to select the alternative with the highest total utility, yielding 1 observed choice per task. To mimic realistic uptake behavior, the status quo option was assigned a level of zero across all 4 attributes, representing the choice to forgo treatment and incur no cost, and it was calibrated to be chosen in approximately 12% of tasks per group. The primary goal of the exercise was to demonstrate how to conduct statistical tests for scale and preference heterogeneity when comparing preferences between 2 groups. 27 This procedure generated a transparent and reproducible synthetic dataset that aligned with realistic cancer treatment tradeoffs and was designed to test preference and scale heterogeneity.
Only the cost and side-effect attributes were modeled as random variables, whereas survival rate and effectiveness were held fixed to reduce computational demand. All parameters were estimated via simulated maximum likelihood, with computational efficiency ensured through the use of Halton sequences (10,000 replications) to approximate the likelihood integrals. 31
This study is based on simulated data generated for methodological investigation and controlled method demonstration of group-specific taste and scale differences. It is not uncommon to use this type of data in health preference research. 14 The use of simulated data is particularly valuable when access to real-world preference data is limited or restricted due to confidentiality concerns or when suitable datasets matching the study’s subgroup comparison requirements are not available. Given the absence of an accessible real-world dataset that precisely matches the study’s testing requirements, this revision uses simulated data as a transparent and reproducible proof of concept. Simulation enables rigorous model estimation while maintaining transparency, reproducibility, and ethical integrity. The full data-generation protocol is available to authorized readers. An empirical replication using an existing DCE with subgroup comparisons is planned, contingent on data-use permissions.
Results
Three mixed logit models were estimated: one for each hypothetical group (patient and caregiver) and the third pooled sample. Given the study’s methodological focus and simulated data, parsimony was prioritized. Preliminary estimates indicated statistically significant heterogeneity only for side-effect attribute in patient group, accordingly, modeled as random coefficients (normal), while months gained and survival rate were retained as fixed. Alternative specifications were explored with additional random parameters, and no improvement was observed in model fit (loglikelihood). Because the design is demonstrative rather than inferential, attribute coefficients were not interpreted substantively, and cost was treated normally distributed due to the theoretical possibility that some respondents may perceive higher price (cost) as a quality signal. The LR tests for both the patient (χ2 = 779.49) and caregiver (χ2 = 374.36) models were highly significant (P < 0.001), indicating that the full models provide significantly better fit than the null models do. McFadden’s R2 indicated a good model fit (0.265) for patient group and a modest fit (0.128) for the caregiver group, suggesting that the explanatory variables capture more choice variation among patient group than caregiver. 32 The resulting estimates are largely consistent across models in terms of coefficient direction, magnitude, and statistical significance. A notable difference emerged for the side-effects attribute, which is statistically significant at the 1% level in the patient model but only marginally significant (10% level) in the caregivers’ group (Table 2).
Mixed Logit Estimates for Patient, Caregiver, and Pooled Samples
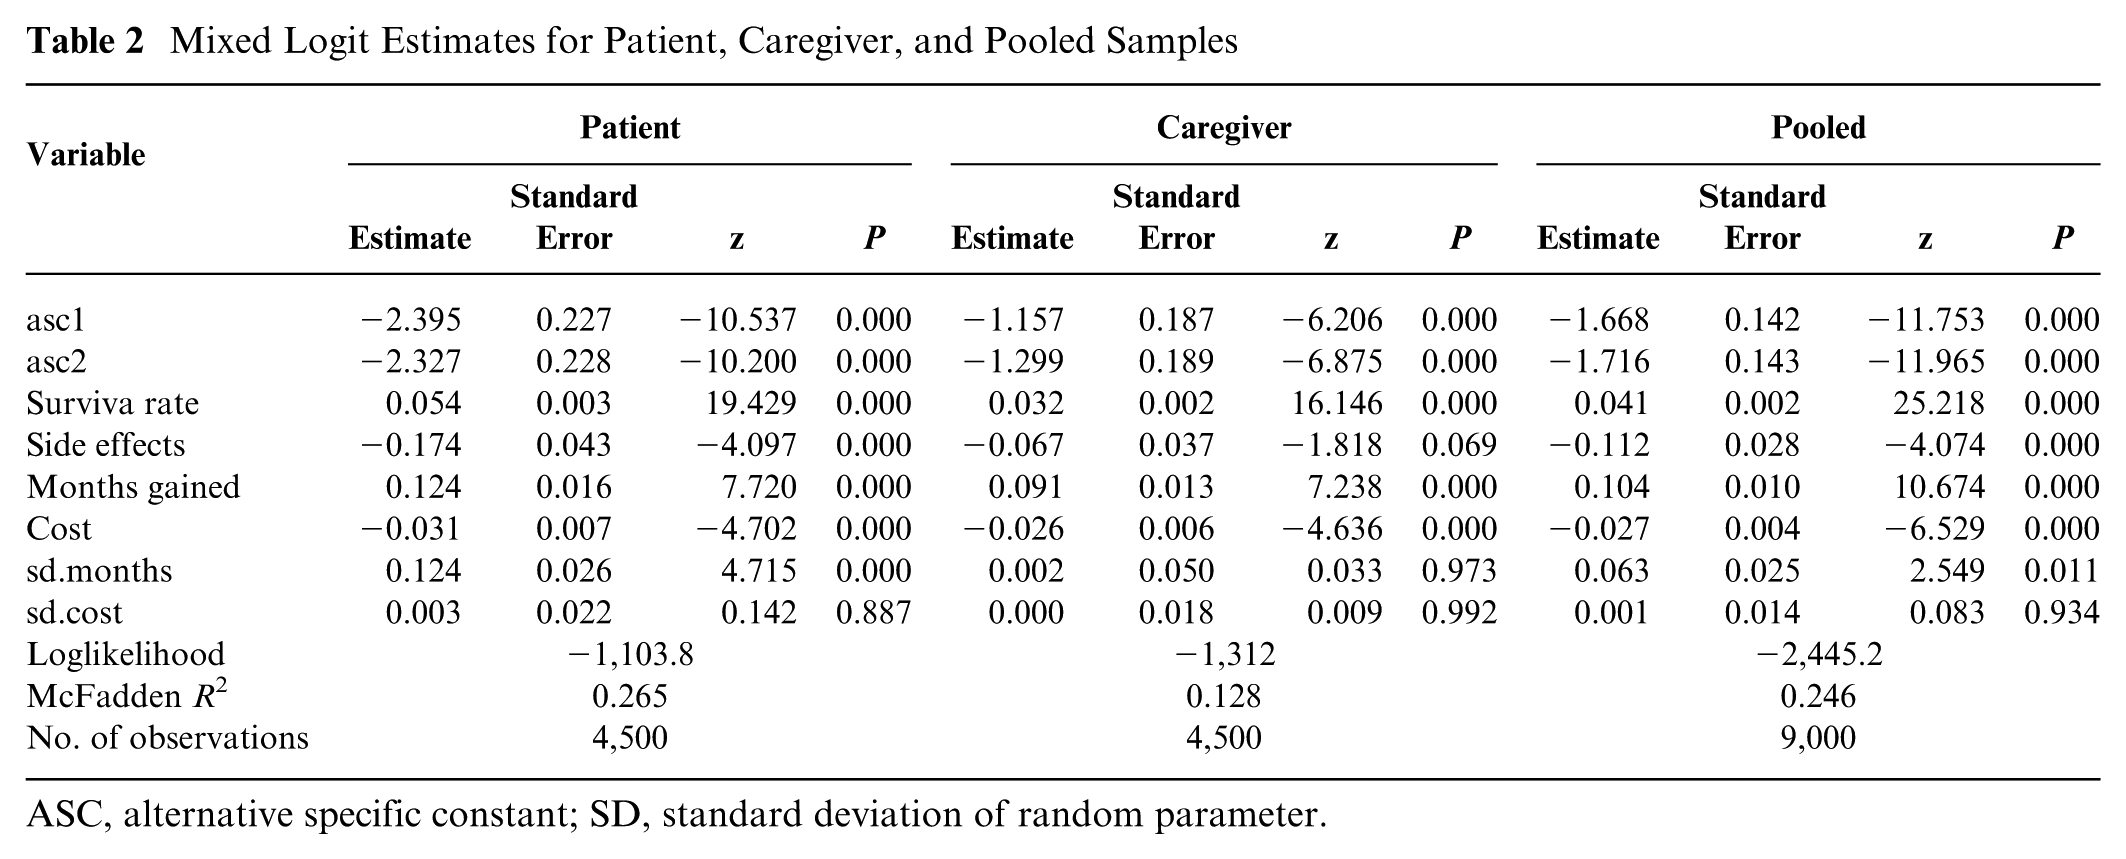
ASC, alternative specific constant; SD, standard deviation of random parameter.
Among the attributes tested, only “months gained” exhibited significant preference heterogeneity (patient), as indicated by a statistically significant standard deviation term at the 1% level. Across both groups, preferences aligned around a consistent pattern; that is, treatment profiles associated with increased survival rates and greater life extension (months gained) were favored, whereas higher costs and more severe side effects were disliked. Although these model-based comparisons suggest similar preferences between the 2 groups, visual inspection of coefficient estimates alone does not provide a statistically rigorous basis for asserting equivalence (see Figure 1).
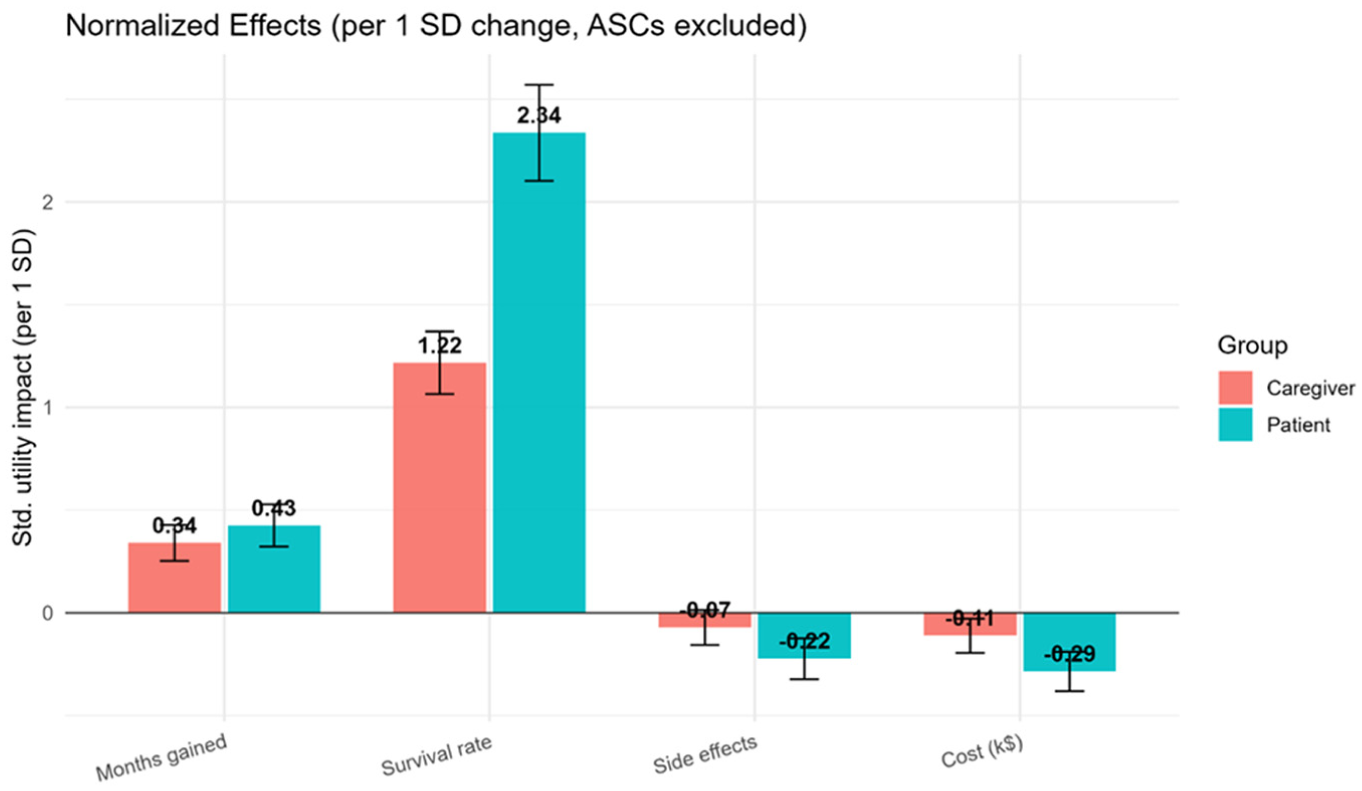
Graphical comparison of preference (normalized) between patients and caregivers.
The Swait–Louviere LR test results (Table 3) provide valuable insights into the nature of heterogeneity between patient and caregiver groups. The taste differences, as indicated by the LR test (LR = 7.87, P > 0.1), were not statistically significant.
Equality of Preferences (β) and Scale (λ) Test Results
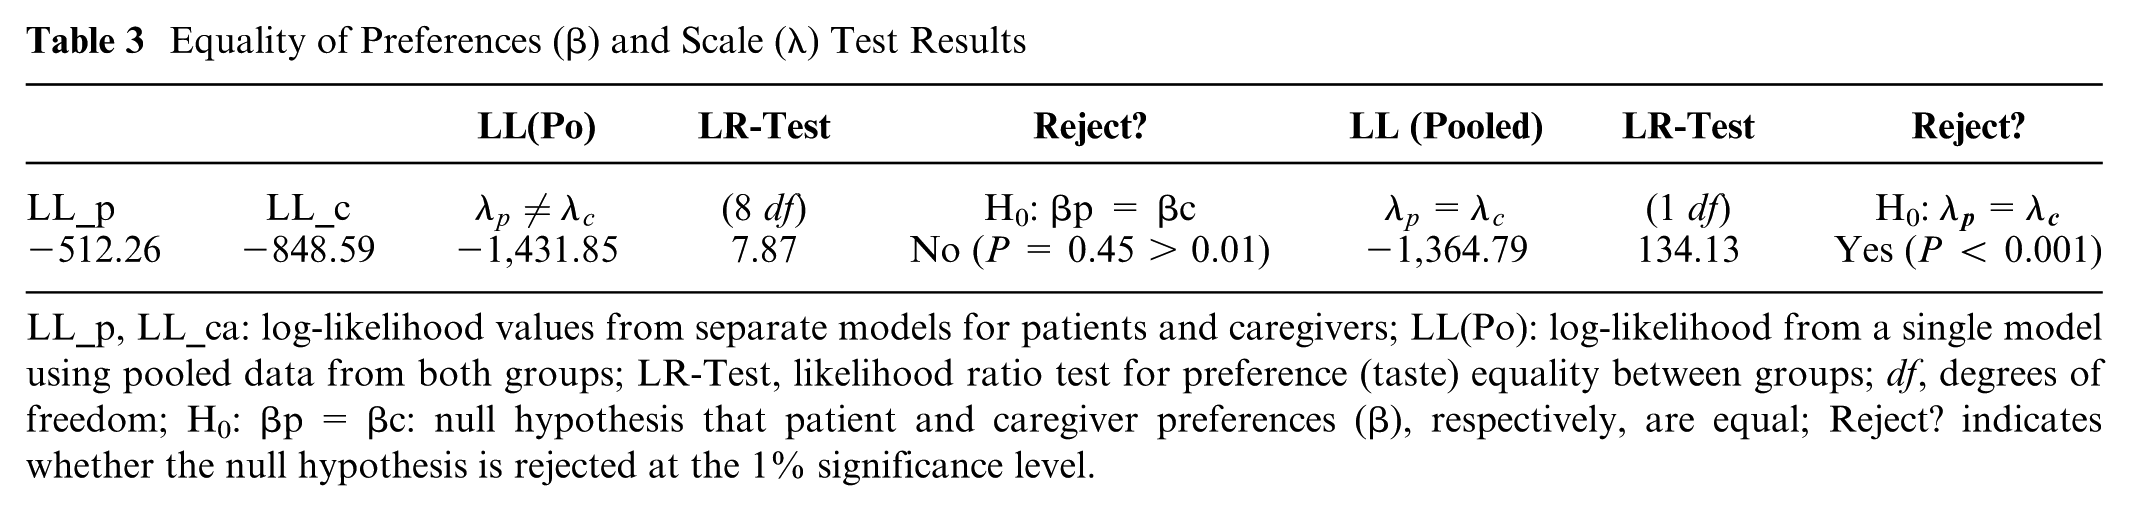
LL_p, LL_ca: log-likelihood values from separate models for patients and caregivers; LL(Po): log-likelihood from a single model using pooled data from both groups; LR-Test, likelihood ratio test for preference (taste) equality between groups; df, degrees of freedom; H0: βp = βc: null hypothesis that patient and caregiver preferences (β), respectively, are equal; Reject? indicates whether the null hypothesis is rejected at the 1% significance level.
In contrast, the LR test (LR = 134.128, P < 0.001) indicates pronounced scale heterogeneity between the 2 groups (see Figure 2). This result confirms the simulation setup in which utility coefficients were intentionally set equal across groups but the scale parameter differed.
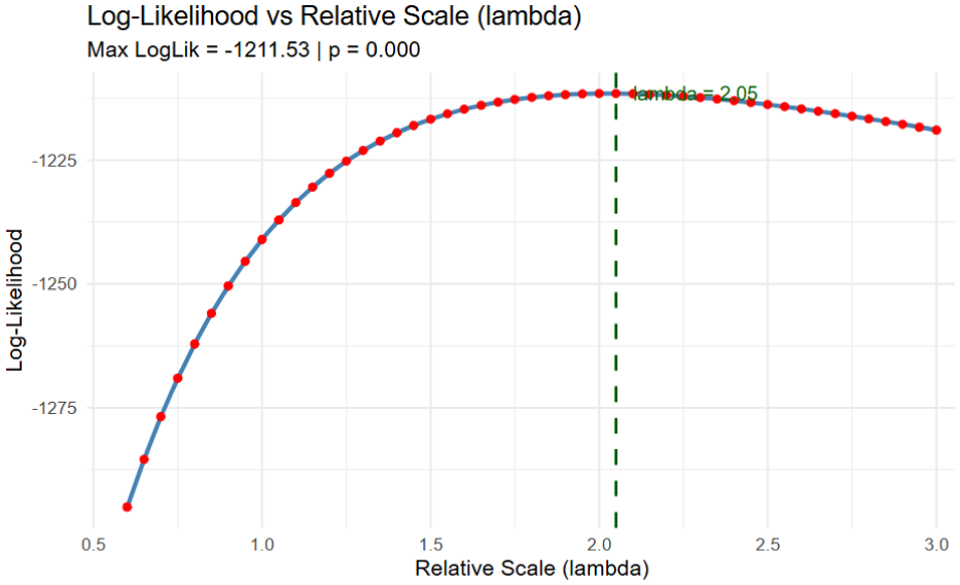
Log-likelihood versus relative scale (λ) plot.
Scale-Invariant WTP Comparisons
Because WTP is a marginal rate of substitution, it inherently adjusts for scale within each group. Consequently, comparing WTP between patients and caregivers is a valid strategy for testing preference differences independent of scale heterogeneity. To formally assess this, the study applied a simulation-based convolution test that compares distributions of welfare measures (e.g., WTP) formed as nonlinear functions of estimated parameters across 2 independent samples without relying on normality. Using 40,000 simulated draws, the empirical distribution (see Figure 3) of the between-group difference was generated to obtain two-sided P values and confidence intervals. After correction, none of the between-group WTP differences were statistically significant (Table 4). The mean difference (patients − caregivers) for months gained was −$8,047 per month (95% confidence interval [CI]; P = 0.054); for side effects, $223 per level (95% CI; P = 0.87); and for survival rate, −$28,054 per 10% survival (95% CI; P = 0.31), all based on 40,000 simulated draws.
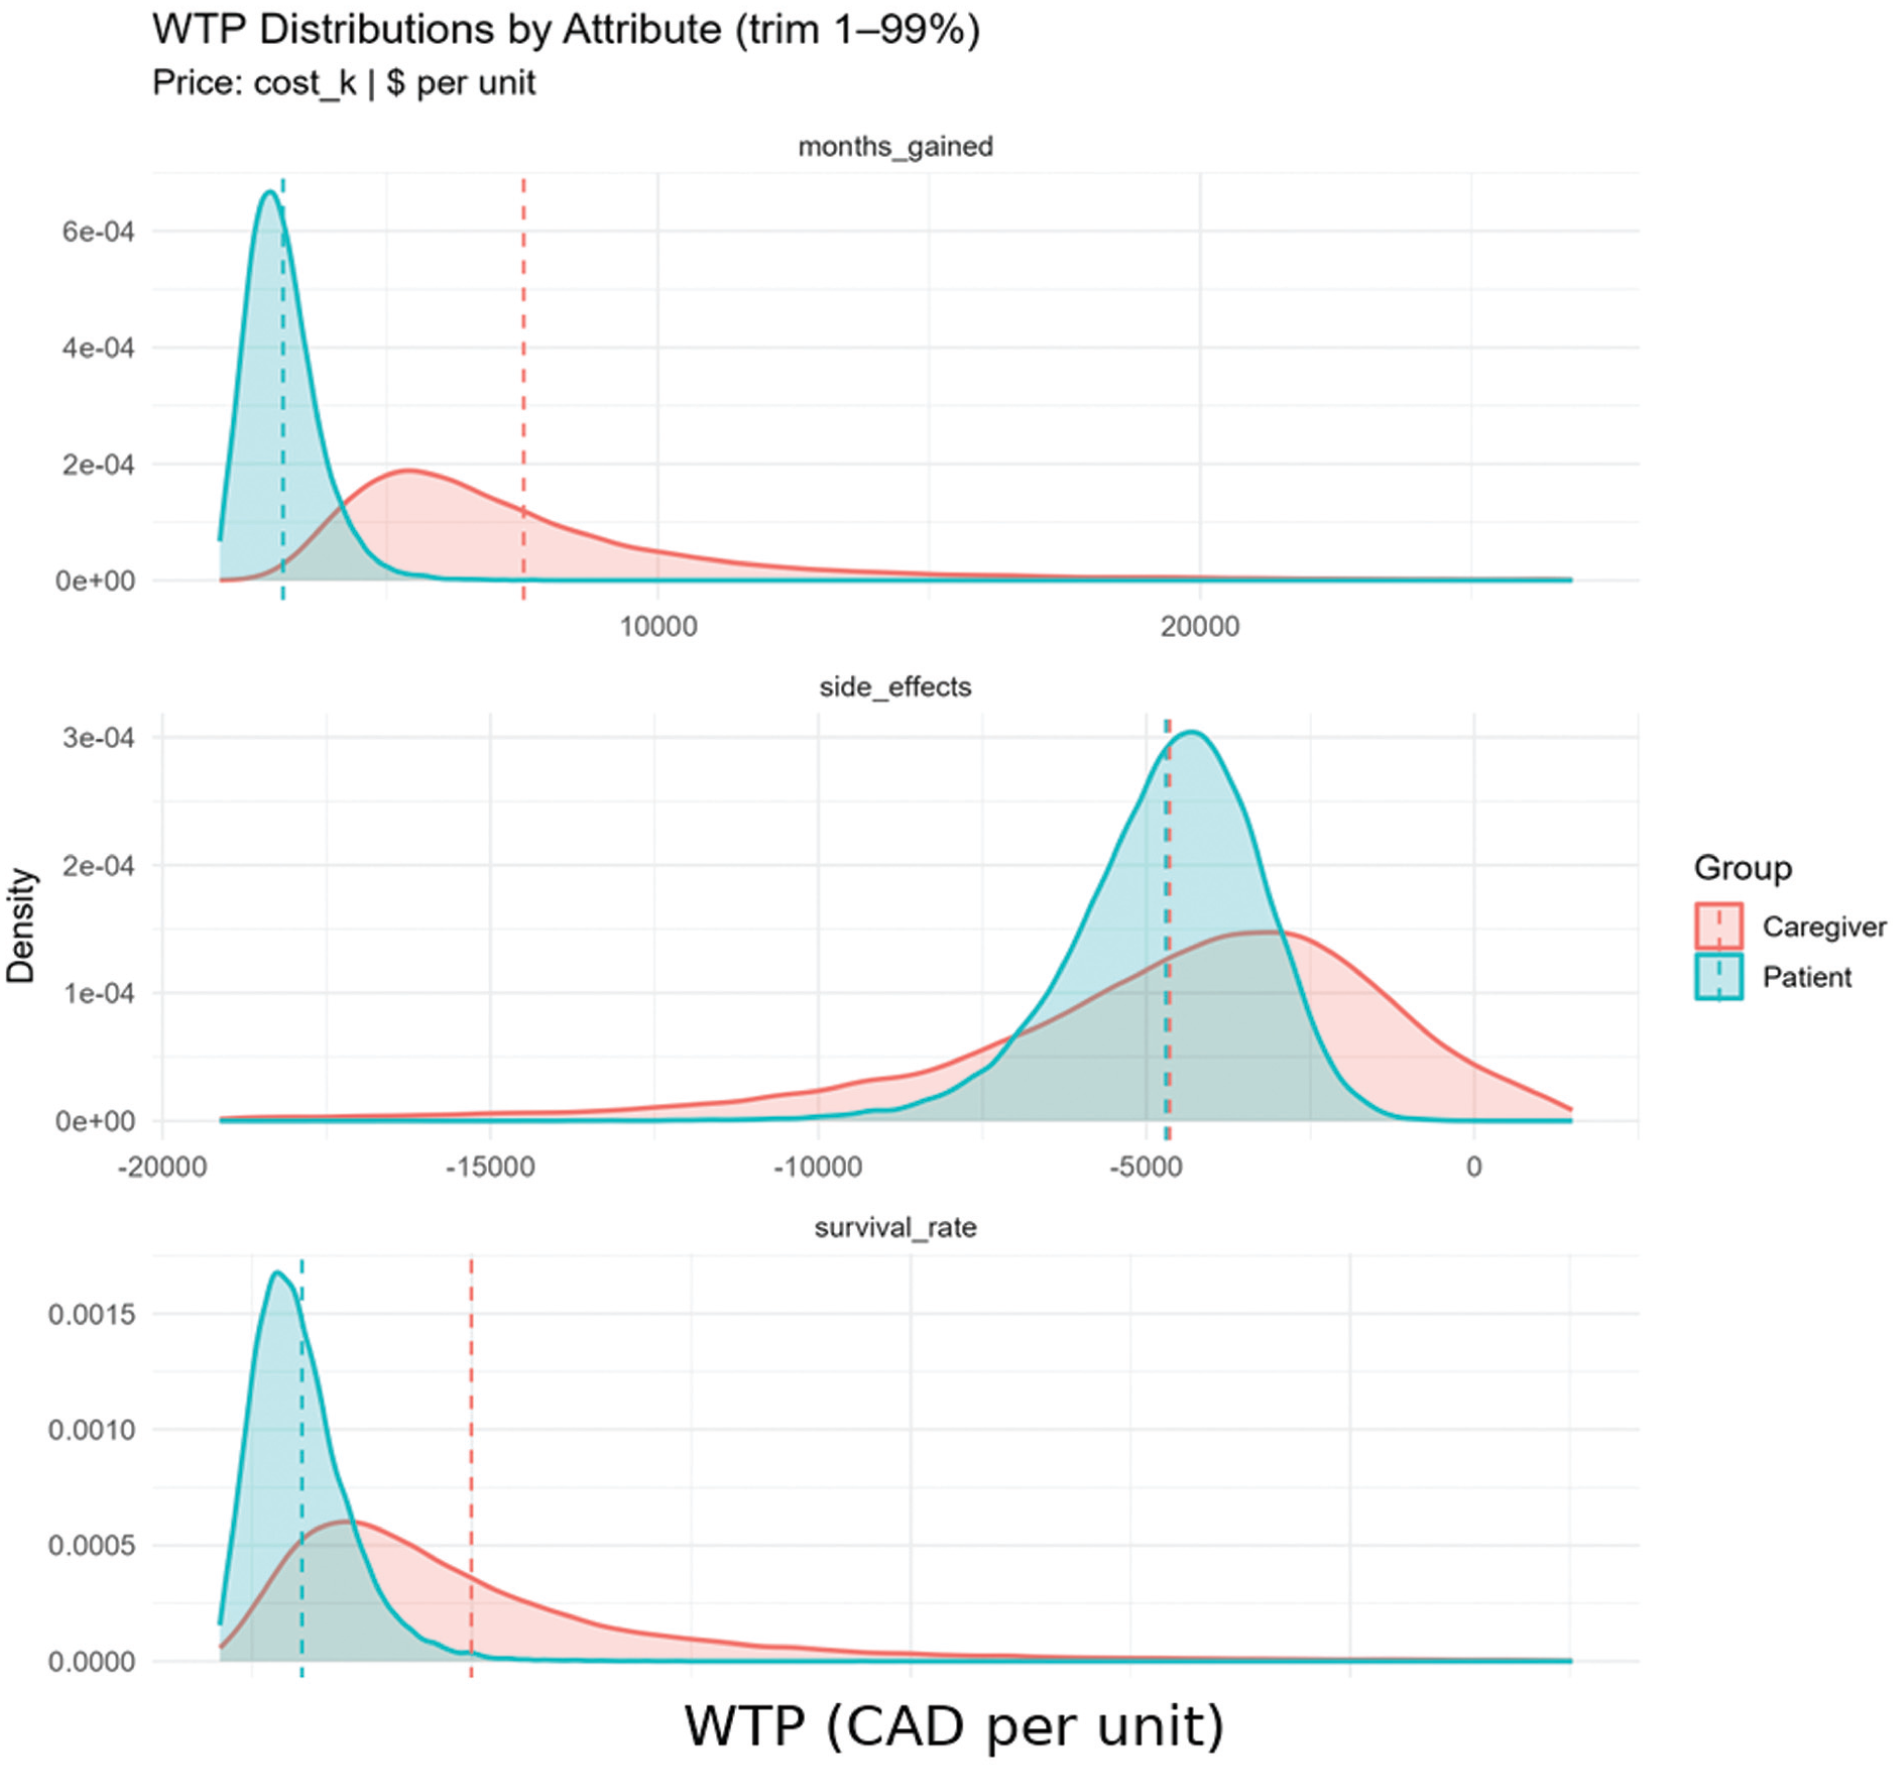
Willingness-to-pay distributions by attribute.
Mean Difference Willingness to Pay (Poe et al Test)
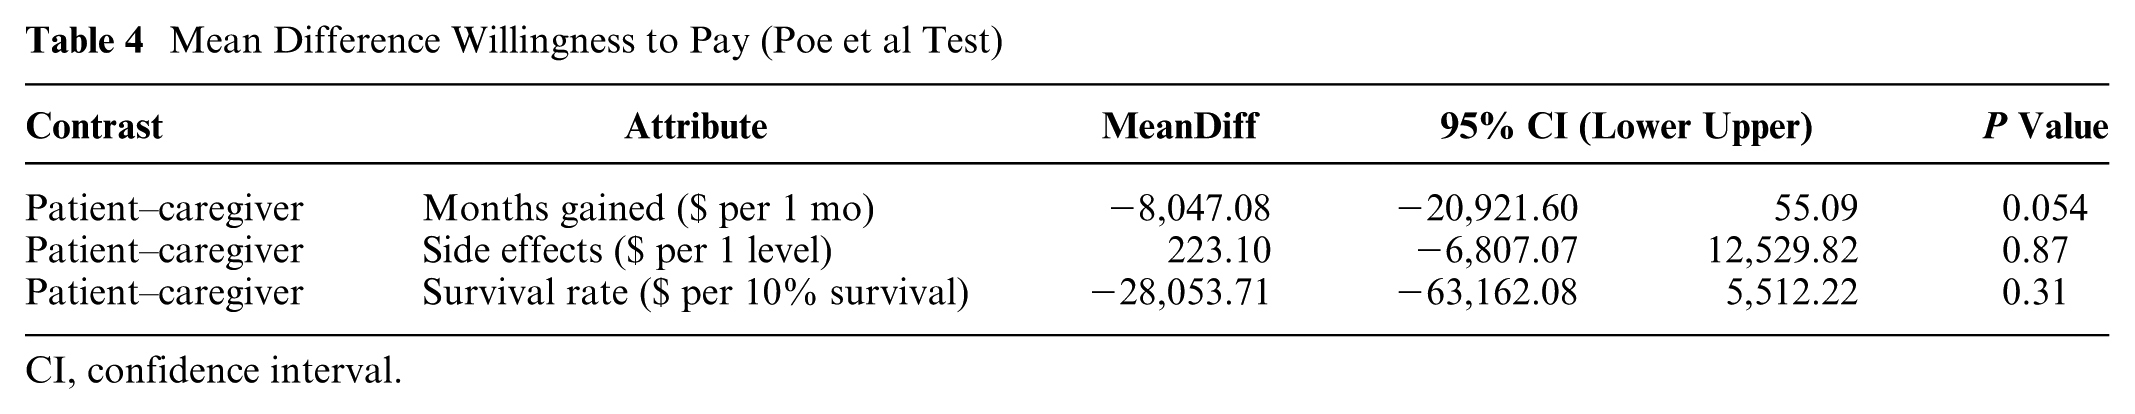
CI, confidence interval.
Consistent with the SL procedure, which indicated no taste differences once scale heterogeneity was accommodated, these WTP contrasts corroborate the absence of meaningful preference differences between patients and caregivers.
Discussion
Comparing health preferences across groups is central to valid inference and decision relevance. However, raw coefficient contrasts can confound true preference (taste) differences with variation in scale, potentially misattributing differences in choice consistency as substantive preference gaps. Mixed logit models were estimated on controlled simulated datasets for patients and caregivers to allow for unobserved heterogeneity in preferences. Although coefficient signs and magnitudes appeared qualitatively similar across groups, visual similarity alone does not establish equivalence.
To formally distinguish taste from scale, the study applied the Swait–Louviere (SL) 2-step procedure, which first estimates a relative scale factor and then tests equality of preference parameters across groups. Importantly, the SL procedure does not require a monetary attribute; it is applicable to any cross-group DCE comparison. Results from the SL test attributed between-group heterogeneity primarily to scale rather than taste, indicating that differences in estimated coefficients reflected variation in decision consistency rather than true preference divergence.
As a welfare-based cross-check, WTP estimates were compared between groups. When a cost/price attribute is available, WTP provides a complementary, decision-relevant check because it is a marginal rate of substitution and the common scale factor cancels out. Using the Poe et al. convolution test with 40,000 simulated draws, the study formally tested whether between-group WTP distributions differed. None of the between-group WTP differences statistically or practically reinforced the conclusion that patient and caregiver preferences are aligned once scale is accounted for and independently corroborated the SL result.
Interpreting scale heterogeneity is important for applied research. Scale captures variation in the unobserved component of utility (i.e., error variance) and is often viewed as reflecting differences in decision consistency or attentiveness. In empirical contexts, such variation can arise from survey burden, health literacy, or cognitive load. Although the present study uses simulated data and does not explore these underlying drivers, the results underscore the necessity of diagnosing and addressing scale heterogeneity before attributing observed differences to taste. This interpretation follows established guidance in the stated-preference literature that cross-group contrasts should explicitly consider scale to avoid overstating taste differences.
Limitations
These findings are based on simulated data with no real respondents. External drivers of scale heterogeneity and generalizability to specific patient populations were not examined. In practice, conclusions can depend on model specification, distributional assumptions, and simulation settings; we mitigated this with many draws for the Poe et al. test.
Conclusions
In summary, preference comparisons must be made on a scale-aware footing. This methodological study using simulated DCE data and mixed-logit models paired the Swait–Louviere 2-step with scale-invariant WTP contrasts (evaluated via the Poe et al. simulation test) to separate true taste differences from decision noise. Both approaches converged: between-group heterogeneity was attributable to scale, and WTP contrasts showed no statistically meaningful gaps, indicating alignment of preferences once the scale was accommodated. The study therefore recommends that health-preference analyses—and the policy decisions they inform—routinely include explicit scale diagnostics, that is, estimate relative scale factors, test taste equality under equalized scale, and report WTP results when a monetary attribute is present. Conclusions should be based on scale-adjusted evidence rather than raw coefficients or visual inspection alone. While these findings are illustrative and not intended for direct real-world inference, they provide a clear, reproducible blueprint for empirical applications to avoid scale-induced misinterpretation and to ground policy guidance in correctly identified preference signals. Future research should extend this methodological framework to real-world choice data, enabling the validation of the simulation-based findings under observed behavioral conditions.
Footnotes
Acknowledgements
The author conducted all aspects of this work independently.
The author declared no potential conflicts of interest with respect to the research, authorship, and/or publication of this article. The author received no financial support for the research, authorship, and/or publication of this article.
Ethical Considerations
This study used computer-generated simulated data and did not involve human participants or animal subjects.
Consent to Participate
Not applicable.
Consent for Publication
Not applicable.
Data Availability
The simulated data and code generated during this study are available from the corresponding author upon reasonable request.