
Abstract
Background
Preoperative identification of intramuscular hemangioma (IMH) subtypes (capillary hemangioma, cavernous hemangioma, and mixed hemangioma) is urgently necessary. Enhanced T2*-weighted angiography (ESWAN) is sensitive to vessels and metabolites and can be used to diagnose IMH subtypes.
Purpose
To compare the diagnostic performances of ESWAN and conventional magnetic resonance imaging (MRI) for qualitative and quantitative diagnosis of IMH subtypes.
Material and Methods
In total, 23 patients with IMHs were examined using conventional MRI and ESWAN. The signal intensity ratios (SIRs) of conventional MRI and ESWAN were measured.
Results
There was no significant difference for volume among the three subtypes (P = 0.124, P = 0.145). Various shapes and MRI signals were shown in the three subtypes of IMH. There was no significant difference for SIRs of conventional MRI (P = 0.558, P = 0.259, P = 0.385, P = 0.347). However, there was a significant difference for SIRs of ESWAN parameters (P = 0.050, P < 0.001, P = 0.005, P = 0.002). Capillary hemangiomas can be diagnosed when R2* SIR is <0.912 and intratumoral susceptibility signal (ITSS) percentage is <29.085%. Cavernous hemangiomas should be considered when R2* SIR is >0.912, ITSS percentage >35.226%, and phase SIR >2.536. In addition, mixed hemangiomas should be considered when T2* SIR is >0.662 and R2* SIR <1.618.
Conclusion
Conventional MRI can only display the volume, shape, and signal of IMHs. 3D-MinIP imaging of ESWAN can show the veins and minor hemorrhage. SIRs of ESWAN parameters including T2* value, R2* value, phase value, and percentage of ITSS can be used to quantitatively diagnose capillary hemangiomas, cavernous hemangiomas, and mixed hemangiomas.
Introduction
Intramuscular hemangioma (IMH) is a benign neoplastic proliferation with diffuse vascular growth in skeletal muscle (1). Although IMH accounts for only 0.8% of all hemangiomas, it represents the most common benign tumors in the muscle (2,3). The pathological subtypes of IMH include capillary hemangioma, cavernous hemangioma, and mixed hemangioma (4–6). The accurate medical treatment of IMH is based on its histopathological subtypes, location, and growth rate (6–8). However, the low morbidity, occult onset, and non-specific clinical manifestations lead to difficult preoperative diagnosis, especially for pathological subtypes (9). In addition, fine-needle aspiration biopsy on the solid component of the tumor cannot be performed for excluding malignancy (10). Therefore, it is necessary to find an appropriate method for the preoperative diagnosis of IMH and its histopathological subtypes.
Magnetic resonance imaging (MRI) is considered the first choice to describe the location, display the lesion, and determine its nature. On T1-weighted (T1W) images, the signal of IMHs is higher than muscle but lower than adipose tissue. On T2-weighted (T2W) imaging, the signal of IMHs is obviously higher than fat, with a multilobulated tubular appearance or “bag of worms” inside. The low-intensity central region is highly specific and is characterized by “dot sign” blood flow without phlebolith (8). While IMHs show typical features on conventional MRI sequences, they are almost always misdiagnosed in clinical diagnosis (9). Furthermore, only 8% of preoperative diagnoses are performed before surgery when IMH is suspected (11). Therefore, further investigations should be conducted to determine whether conventional MRI sequences can be used to qualitatively and quantitatively diagnose IMH and its histopathological subtypes preoperatively.
Enhanced T2*-weighted angiography (ESWAN) is a unique imaging modality, which is sensitive to blood metabolites, venous vessels, and calcium iron deposits. It is a MRI contrast-enhancement technique without contrast agent (12). The low-flow abnormal vessels, including capillary and cavernous malformations, can be easily detected in ESWAN images. In addition, three-direction flow compensation is used to avoid the influence of blood flow direction and velocity. The details of proliferating venules and circulating reflux veins can also be shown accordingly. It has been reported that ESWAN is a precise method to show the intracranial capillary telangiectasia and cerebral hemorrhage (13). It can be used not only to diagnose the hemangioma subtypes of the brain or spine, but also to directly display the vessels in cartilage tube or disease progression (14–17). However, there is no report of ESWAN being used for the diagnosis of IMHs. Therefore, it is uncertain whether the ESWAN technique can diagnose IMHs and its subtypes qualitatively and quantitatively.
The aim of the present study was to analyze and compare the qualitative and quantitative diagnostic performance of the ESWAN technique and conventional MRI sequences for IMH and its subtypes, respectively.
Material and Methods
Patients
This prospective clinical trial was approved by the University Institutional Ethics Committee and informed consent was obtained from all patients. A total of 23 patients (8 men, 15 women; mean age = 41 years; age range = 16–78 years) with IMH underwent conventional MRI and ESWAN sequences from March 2015 to March 2019. All patients received surgical treatment and were confirmed by pathology, including six cases of capillary hemangiomas, eight cavernous hemangiomas, and nine mixed hemangiomas. Clinical data and primary sites of these tumors are shown in Table 1. The trial registration number of the Chinese Clinical Trial Registry is ChinCTR1800019947.
Clinical data, primary sites, and volumes of IMH subtypes with their volume comparisons.
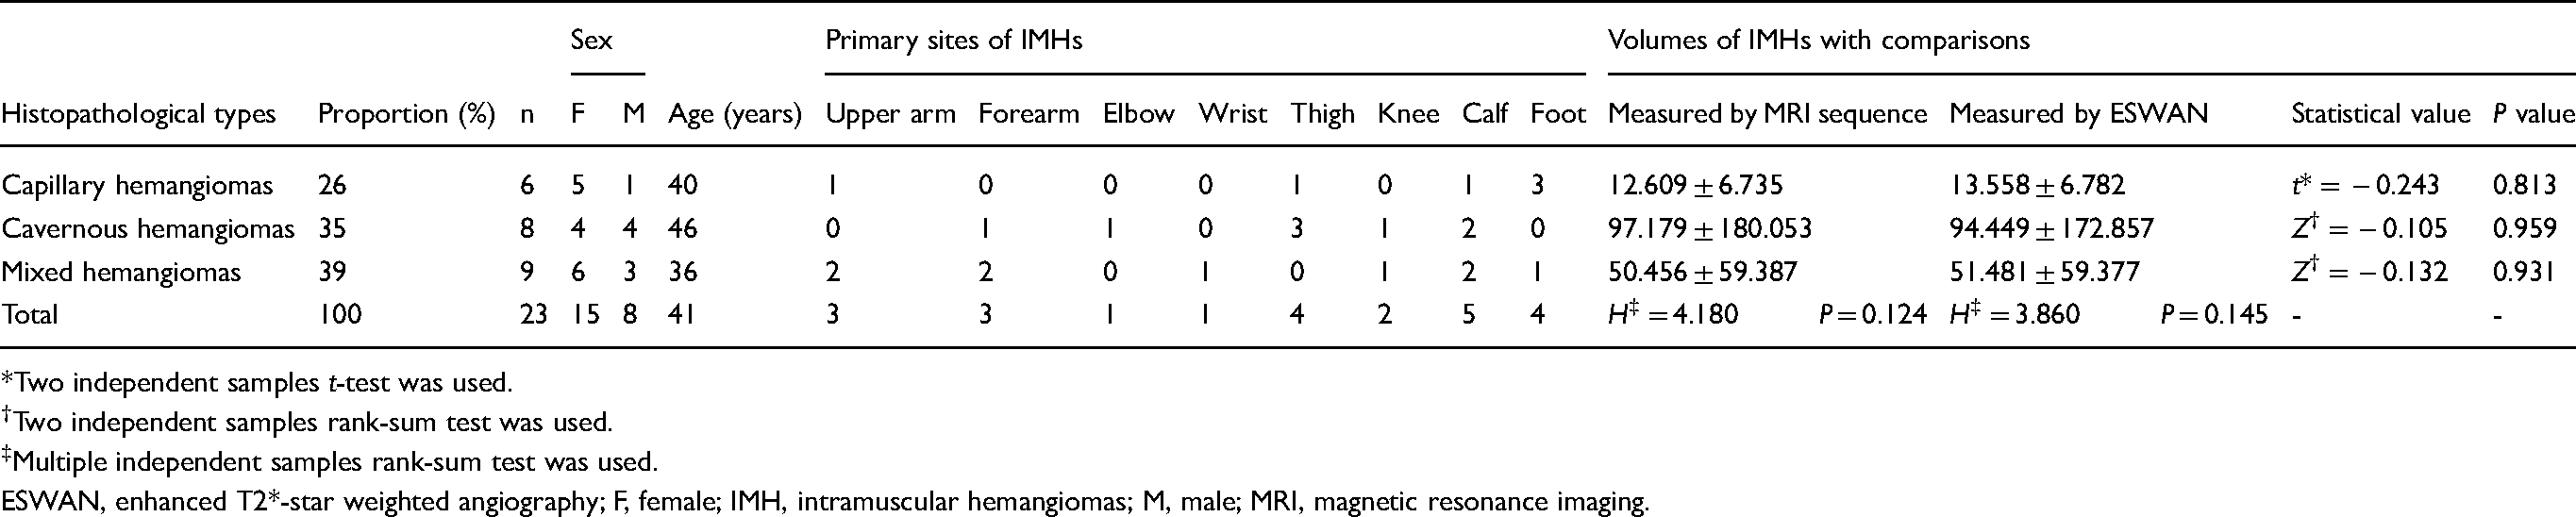
*Two independent samples t-test was used.
Two independent samples rank-sum test was used.
Multiple independent samples rank-sum test was used.
ESWAN, enhanced T2*-star weighted angiography; F, female; IMH, intramuscular hemangiomas; M, male; MRI, magnetic resonance imaging.
Conventional MRI
MRI was performed using a 3.0-T MR scanner (Signa, HDxt, 3.0 T; General Electric Healthcare, Milwaukee, WI, USA) with phased-array coil, surface coil, or body coil. The conventional MRI sequences included spin echo (SE) T1W imaging (TR/TE = 650 ms /Min Full), fast spin echo (FSE) T2W imaging (TR/TE = 3975/68 ms; number of excitations [NEX = 4), and fat suppression (FS) proton density weighted (PDW) imaging (TR/TE = 2000/42 ms, NEX = 3). Field of view (FOV) was 15–40 cm with a slice thickness of 4 mm, slice spacing of 1 mm, and reconstruction matrix size of 256 × 224.
ESWAN imaging and post-processing
ESWAN imaging was performed using axial 3D gradient recalled echo (GRE) sequence (first echo: TR/TE = 16.3/2.1 ms, 8 echoes, flip angle = 20°) after conventional scanning and before dynamic contrast-enhanced (DCE) scanning; the FOV, slice thickness, slice spacing, and reconstruction matrix size were equal to conventional sequences. The volumes of different IMH subtypes were calculated from the polygonal volume based on 3D reconstruction technique. Functool software was used to establish the T2* map, R2* map, phase diagram, and 3D minimum intensity projection (3D-MinIP) imaging. Intratumoral susceptibility signal (ITSS) was determined as intratumoral linear or dot-like low signal intensity (SI) structures detected on 3D-MinIP imaging. The numbers of ITSS and its proportion in each tumor from all levels were calculated using the signal processing in NMR (SPIN) software (http://www.mrc.wayne.edu/download.htm) (Fig. 1, purple area to the red circle area).
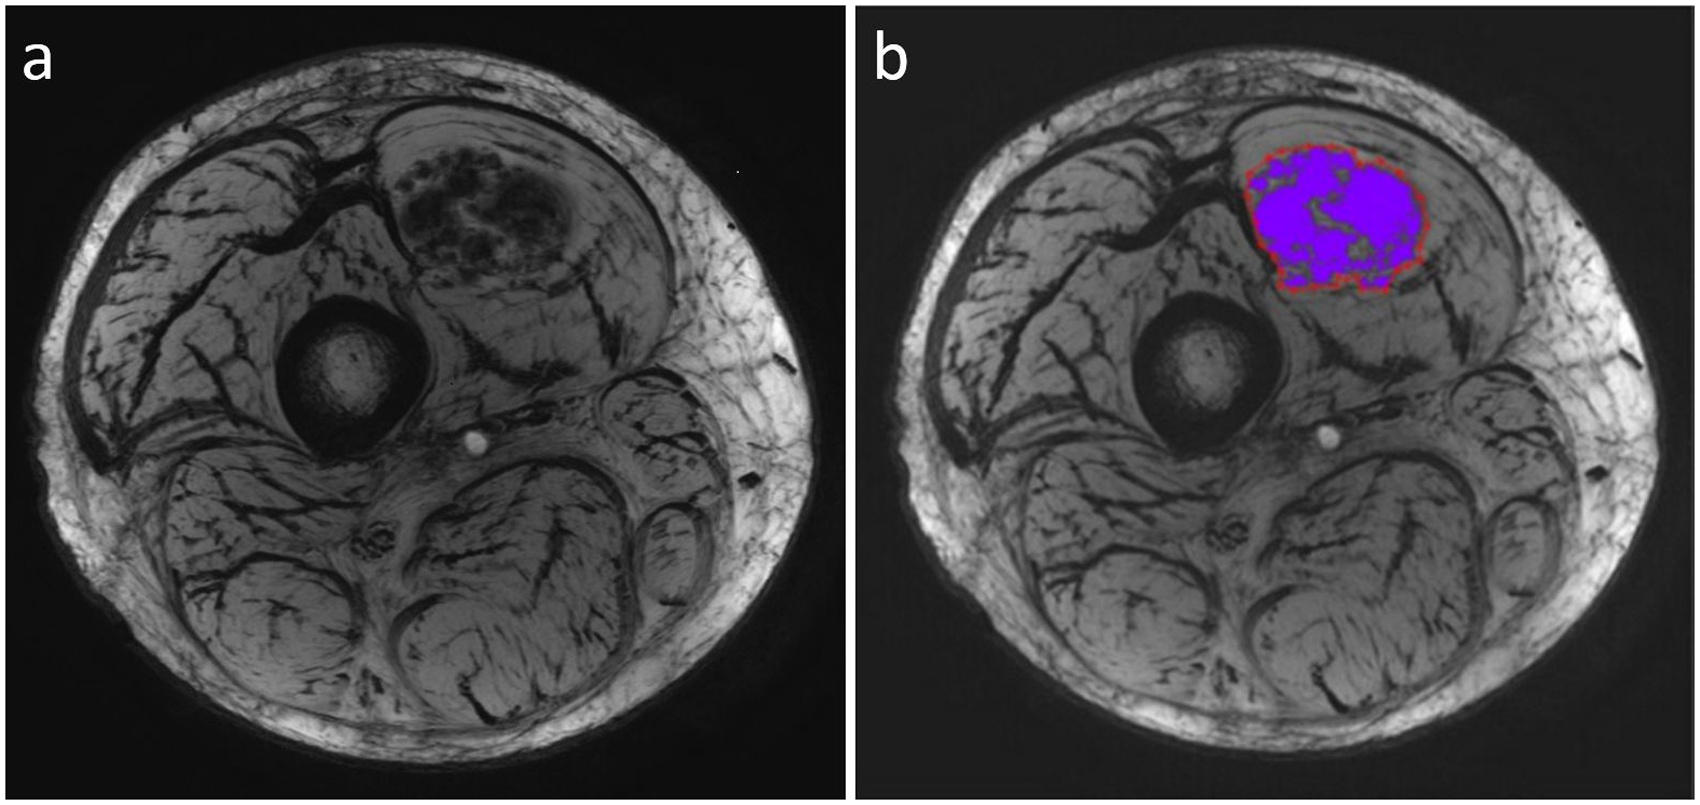
Calculation method of the percentage of ITSS. (a) Conventional ESWAN image. (b) The proportion of ITSS to whole tumor (purple area to the red circle area) shown in the ESWAN 3D-MinIP image of a cavernous hemangioma. ESWAN, enhanced T2*-weighted angiography; ITSS, intratumoral susceptibility signal.
DCE-MRI
DCE-MRI was performed using 2D fast spoiled gradient echo sequence (2D FSPGR). The contrast agent gadolinium-DTPA (Magnevist, Berlex, Wayne, NJ, USA) was injected as 2.5 mL/s marked with 0.l mmol/kg through a high-pressure injector followed by an additional injection of 10 mL saline at the same velocity.
Regions of interest (ROI)
The ROI was manually drawn by a single radiologist with six years of experience in musculoskeletal radiology who was blinded to radiologic reports and histopathologic results. The area of the ROI was 25 mm2 and placed on the parenchyma of each IMH on ESWAN imaging, which was the most obvious place in the early stage of tumor enhancement. Large cystic area, thrombi, and constructed defect were excluded. SI values of three ROIs in each image within three consecutive images (a total of nine ROIs) of ESWAN imaging and conventional MRI were measured for each tumor and muscle on the same level. The ratios between the tumor SI values and muscle SI values were calculated as the signal intensity ratio (SIR) of each conventional MRI sequence or ESWAN parameter. The low signal in hemangioma on 3D-MinIP imaging was defined as ITSS. All the ITSS in hemangioma and the percentage of ITSS were calculated.
Statistical analysis
SPSS version 24.0 (IBM Corp., Armonk, NY, USA) was used for the statistical analysis. The mean ± standard deviations (SD) were used to describe the observational indices. Rank-sum test or one-way analysis of variance (ANOVA) with least significant difference (LSD) t-test was used to compare the SIRs of conventional MRI and ESWAN and the comparison among three subtypes. Receiver operating characteristic (ROC) curves with respective cutoff values were used to accommodate best diagnostic accuracy based on Youden index. P values < 0.05 were considered significant for two-tailed probability, meanwhile for LSD t-test and rank-sum test, α = 0.05 and α’ = α/3 = 0.017, respectively.
Results
Comparison of conventional MRI and ESWAN
The volumes of three subtypes of IMH were measured on MRI-T2W imaging and MRI-ESWAN imaging. There was no significant difference of IMH volume among the three subtypes (P = 0.124, P = 0.145). In addition, there was no significant difference between MRI-T2W imaging and MRI-ESWAN (P = 0.813, P = 0.959, P = 0.931) (Table 1).
Various shapes were present in the three subtypes. Capillary hemangiomas were round with clear boundaries without separation. Five cases of cavernous hemangiomas were round and the other three were patchy with clear boundaries. They have different shapes of vessels in invaded muscles with thickened septa around abnormal vessels. Two cases of mixed hemangiomas were round and the other seven were patchy with irregular boundaries and large malformed vessels. The lesions showed thin septa and circuitous vessels.
Various MRI signals were seen in the three subtypes. Capillary hemangiomas showed intermediate SI in four cases and heterogeneous high SI in two cases on T1W imaging. All cases were slightly high on T2W imaging. Five cases showed heterogeneous intense enhancement and one case showed ring-enhancement on contrast-enhanced T1W imaging. Three cases had homogeneous intermediate SI and the other three cases had heterogeneous SI on ESWAN phase imaging. All cases appeared with homogeneous low SI on ESWAN R2* and ESWAN 3D-MinIP imaging. Four cases of cavernous hemangiomas had heterogeneous intermediate SI and the other four cases had lamellar high SI on T1W imaging. All cases were heterogeneous with high SI on T2W imaging and intense enhancement on contrast-enhanced T1W imaging. ESWAN images showed low signal on phase imaging and heterogeneous signal on R2* imaging. 3D-MinIP imaging was displayed circuitous vessels with a low signal inside. For mixed hemangiomas, six cases had intermediate SI and slightly high signal inside and three cases had intermediate SI on T1W imaging. All cases had heterogeneous high SI on T2W imaging. Two cases showed slight enhancement, three cases had intermediate enhancement, and four cases had intense enhancement on contrast-enhanced T1W imaging. All cases had heterogeneous low SI on ESWAN phase imaging and ESWAN R2* imaging, and heterogeneous signal with circuitous vessels inside on ESWAN 3D-MinIP imaging. The three subtypes of IMH and their corresponding pathological features are shown in Figs. 2–4.
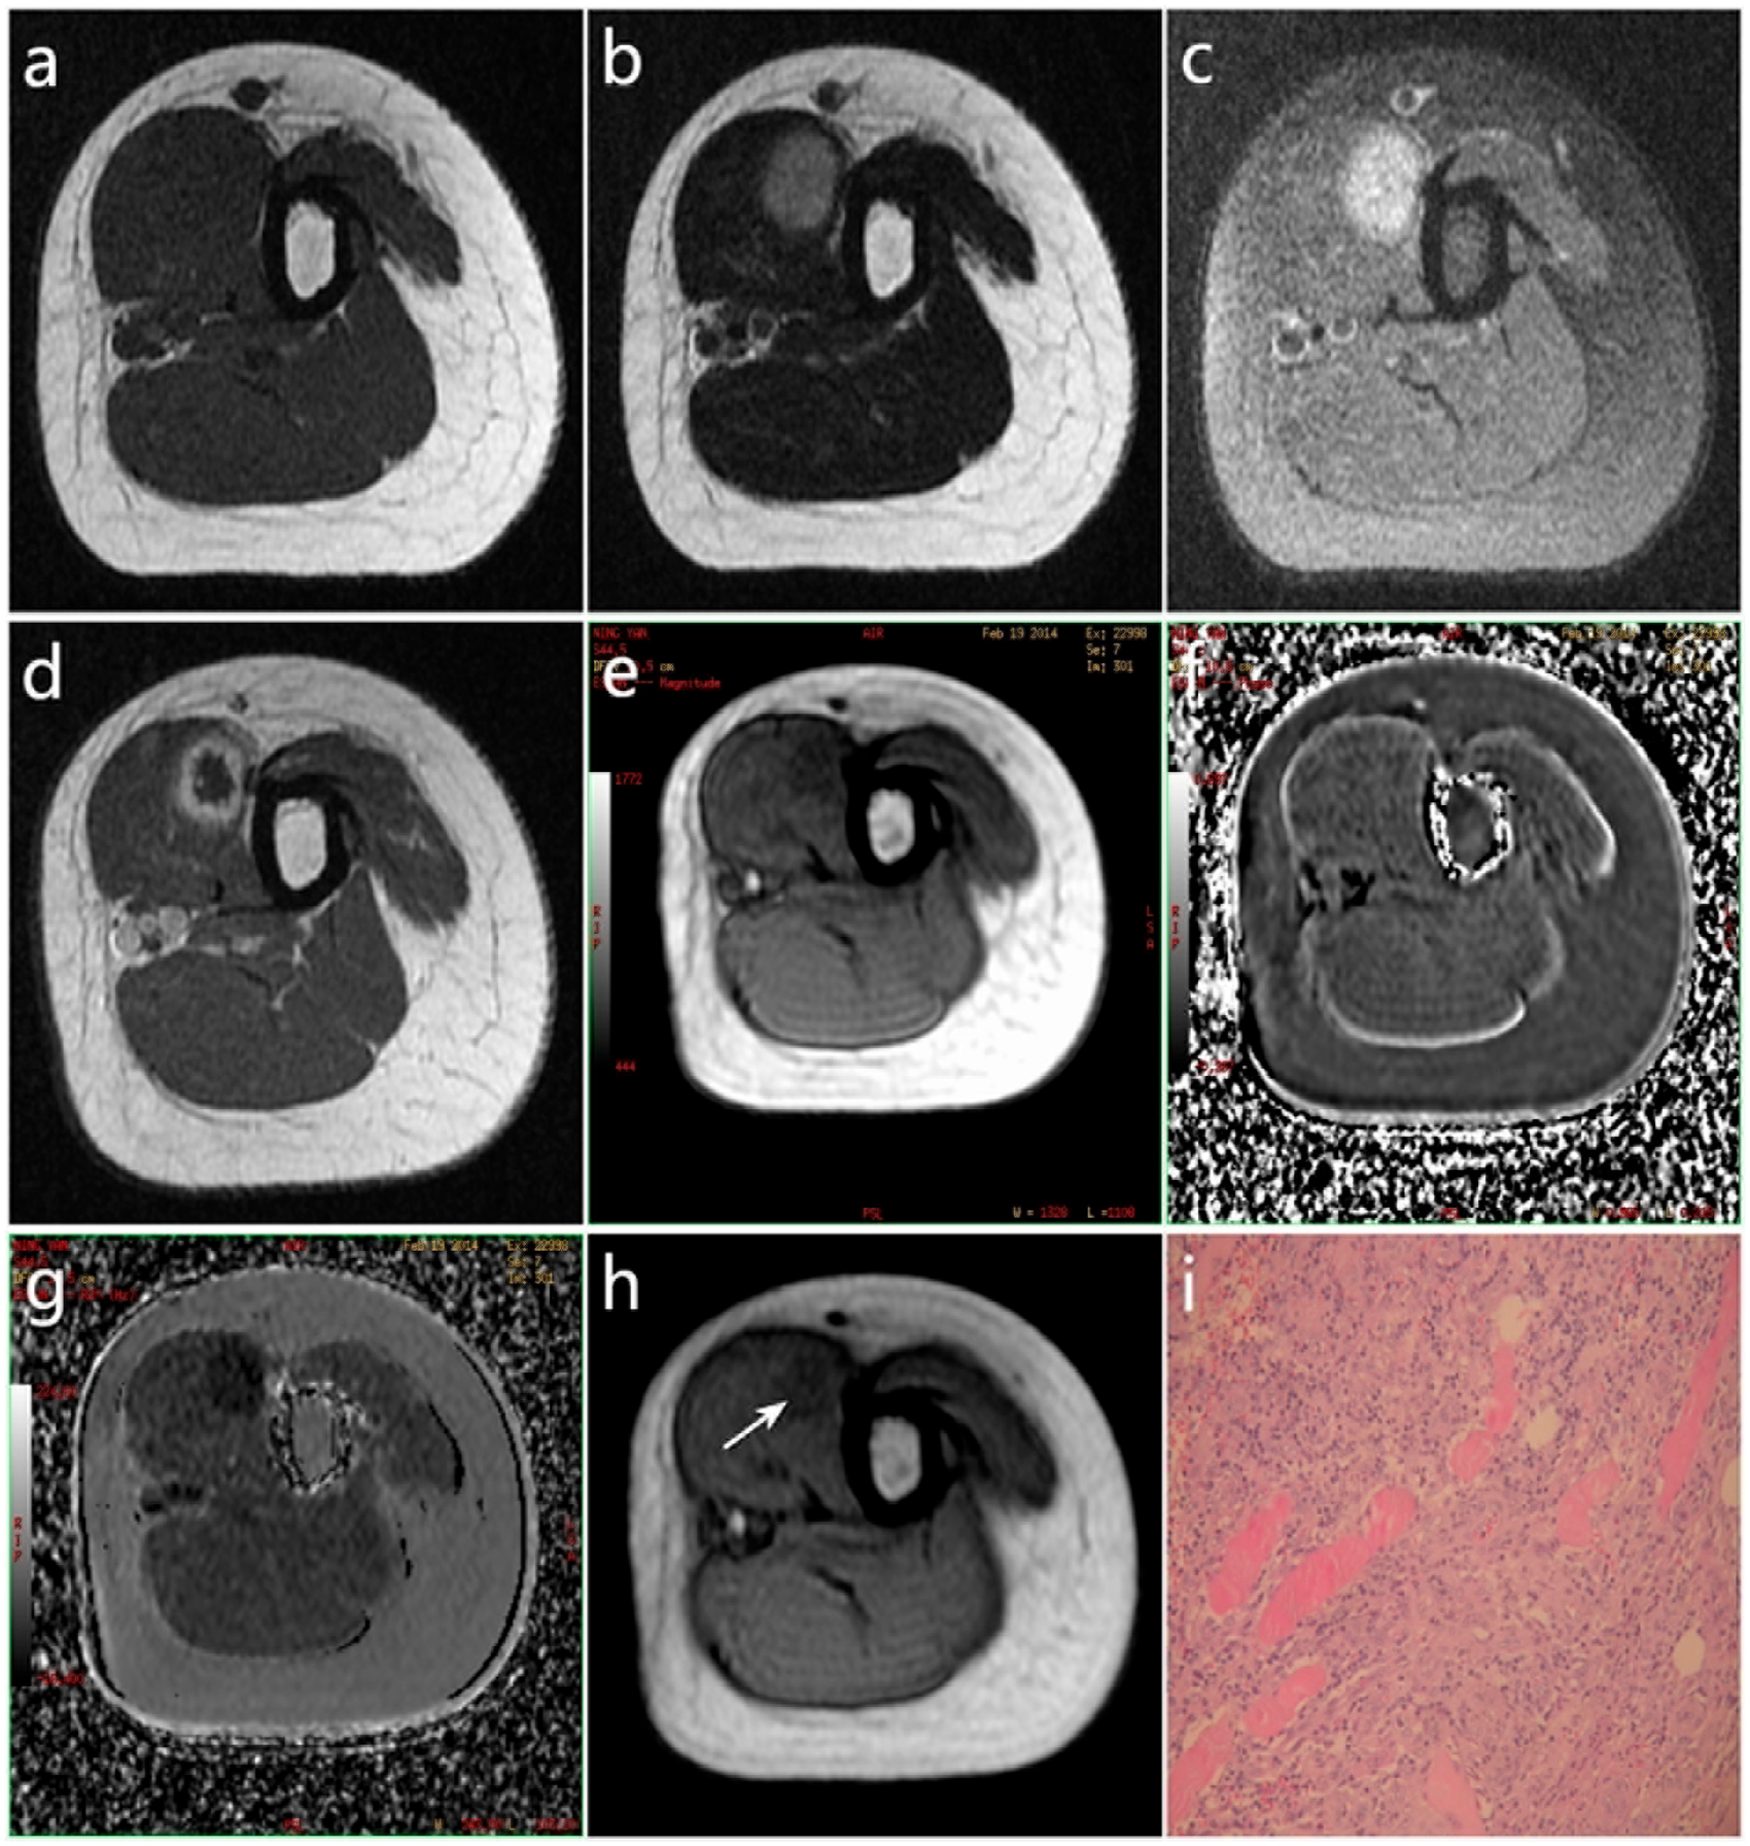
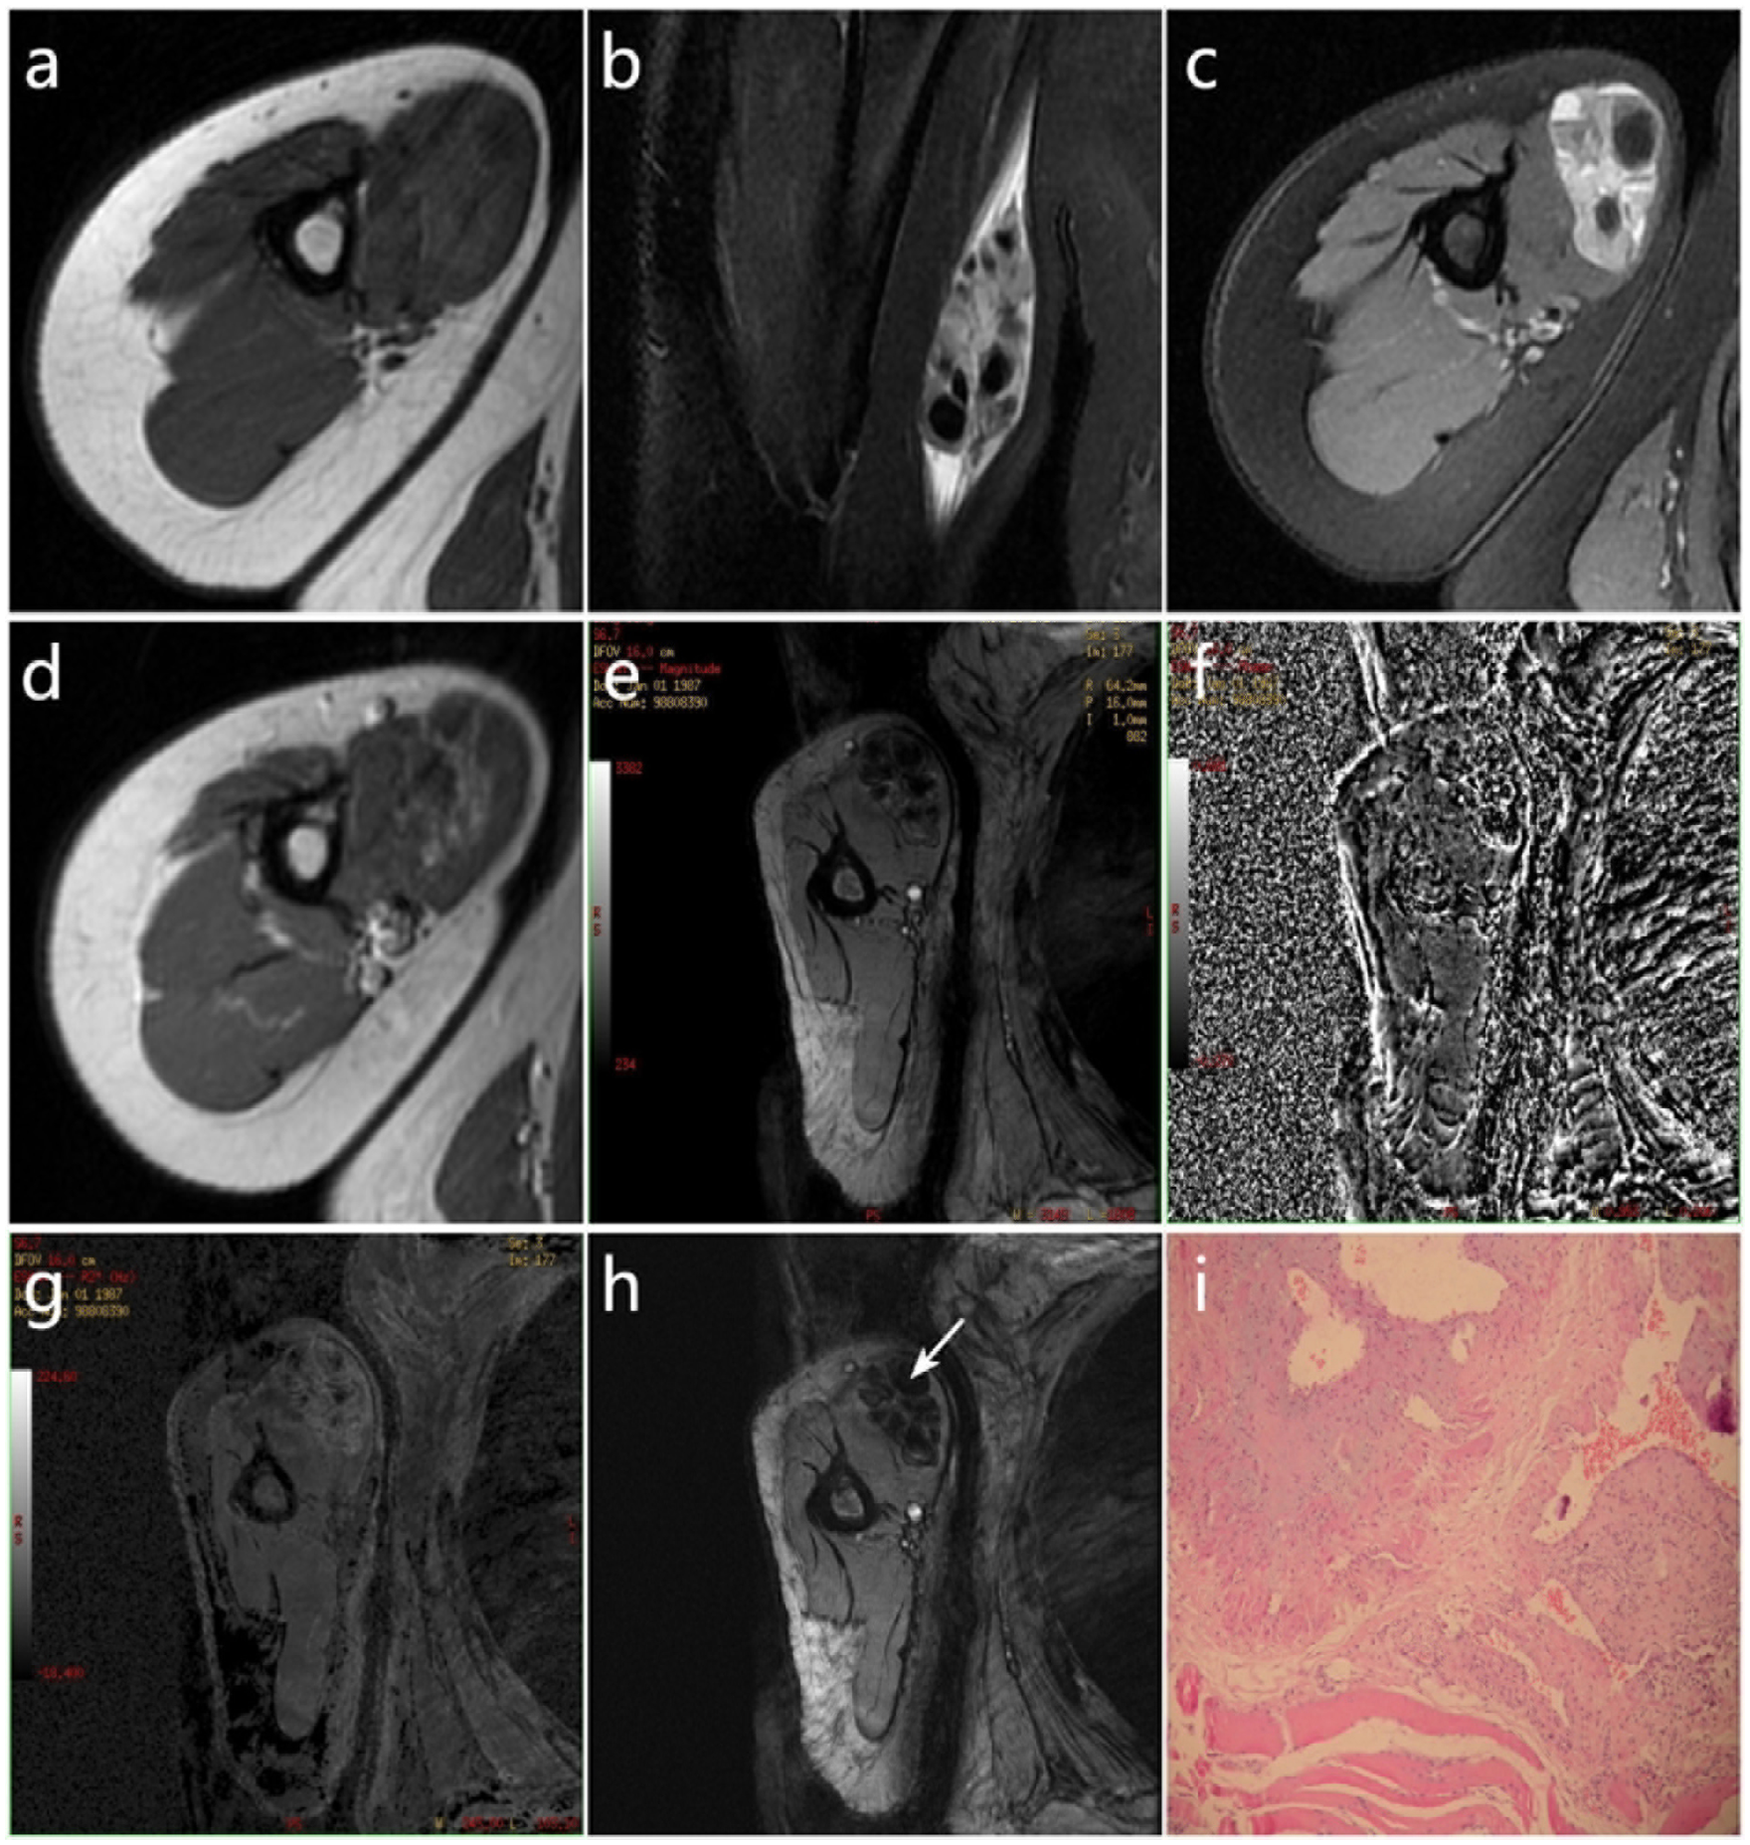
MRI performances and pathological features of capillary hemangioma in musculus biceps brachii. (a) Intermediate SI on T1W imaging, (b) slightly high SI on T2W imaging, (c) homogeneous high SI on PDW imaging, (d) ring enhancement on DCE T1W imaging, (e) homogeneous low SI on magnitude image of ESWAN, (f) homogeneous intermediate SI on phase imaging of ESWAN with phase SIR –0.809, (g) homogeneous low SI on R2* image of ESWAN with R2* SIR 0.157, (h) homogeneous low SI on 3D-MinIP imaging of ESWAN with percentage of ITSS 4.9%, (i) photomicrographs from light microscopy (hematoxylin and eosin stain; original magnification × 200). DCE, dynamic contrast-enhanced; ESWAN, enhanced T2*-weighted angiography; ITSS, intratumoral susceptibility signal; MRI, magnetic resonance imaging; PDW, proton density weighted; SI, signal intensity; SIR, signal intensity ratio; T1W, T1-weighted; T2W, T2-weighted.
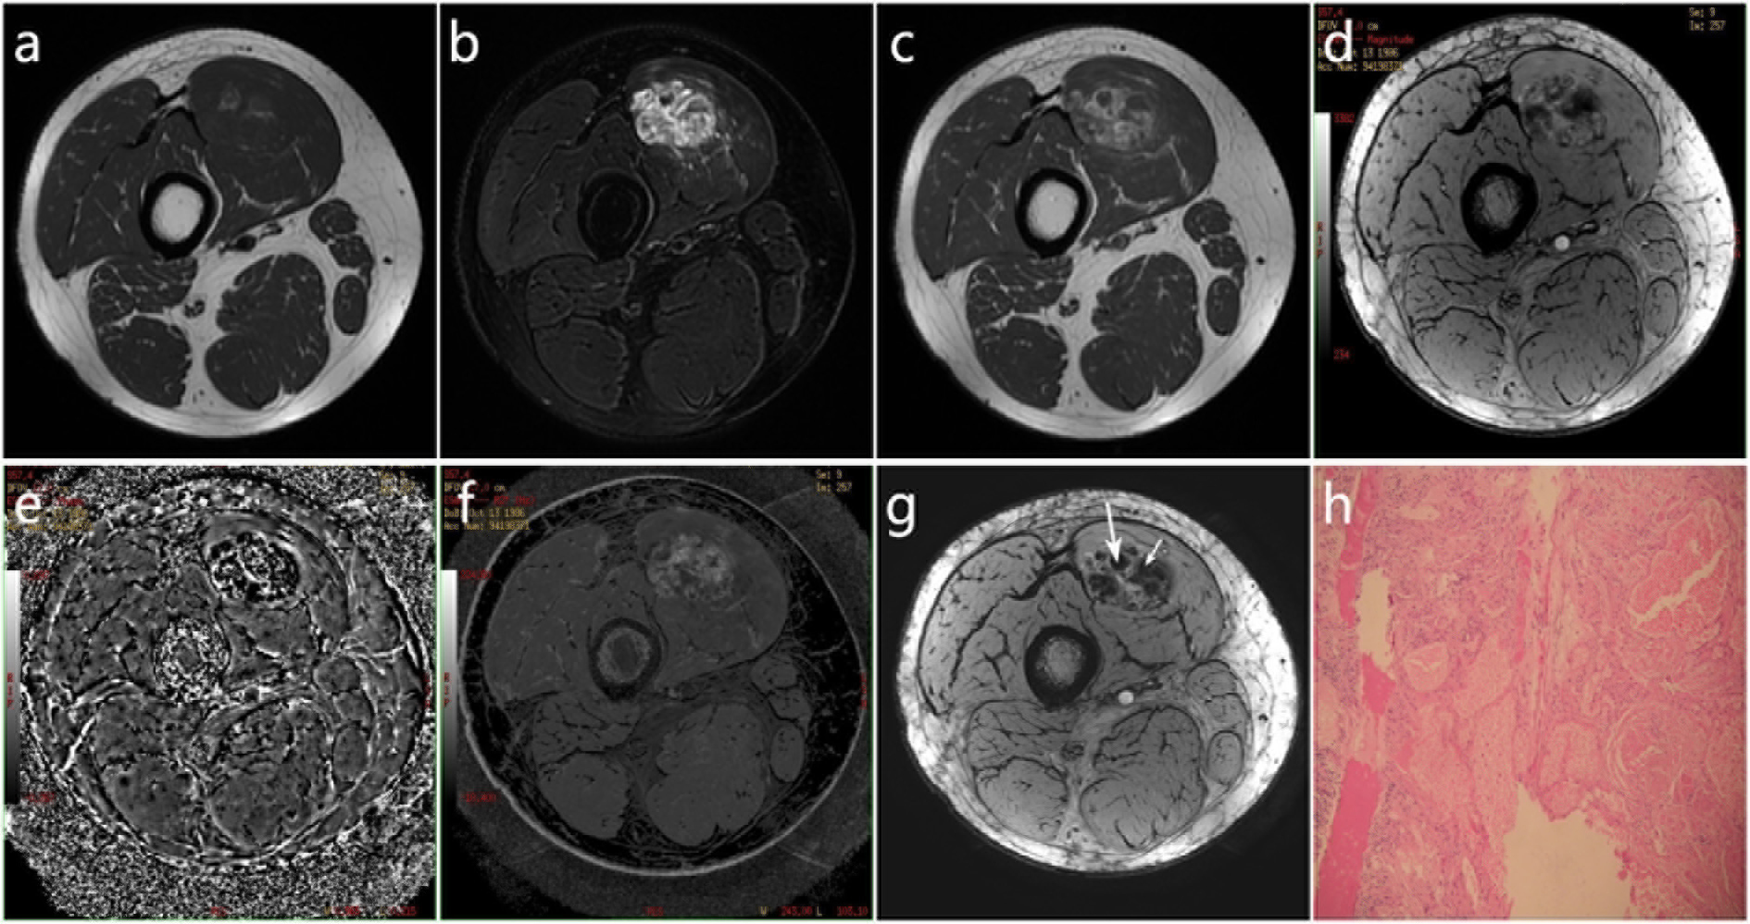
MRI performances and pathological features of cavernous hemangioma in medial vastus muscle. (a) Heterogeneous intermediate SI on T1W imaging, (b) heterogeneous high SI on T2W imaging, (c) heterogeneously intense enhancement on DCE T1W imaging, (c) heterogeneous SI on magnitude image of ESWAN, (e) heterogeneous low SI on phase imaging of ESWAN with phase SIR 14.239, (f) heterogeneous SI on R2* image of ESWAN with R2* SIR 1.812, (g) heterogeneous SI on 3D-MinIP image of ESWAN with circuitous vessels (big arrow) and minimal hemorrhage of low SI (small arrow) inside with percentage of ITSS 73.9%, (h) photomicrographs from light microscopy (hematoxylin and eosin stain; original magnification × 100). DCE, dynamic contrast-enhanced; ESWAN, enhanced T2*-weighted angiography; ITSS, intratumoral susceptibility signal; MRI, magnetic resonance imaging; SI, signal intensity; SIR, signal intensity ratio; T1W, T1-weighted; T2W, T2-weighted.
MRI performances and pathological features of mixed hemangioma in musculus biceps brachii. (a) Intermediate SI on T1W imaging, (b) slightly high SI on T2W imaging, (c) homogeneous high SI on PDW imaging, (d) ring enhancement on DCE T1W imaging, (e) homogeneous low SI on magnitude image of ESWAN, (f) homogeneous intermediate SI on phase imaging of ESWAN with phase SIR 13.490, (g) homogeneous low SI on R2* image of ESWAN with R2* SIR 1.632, (h) homogeneous low SI on 3D-MinIP image of ESWAN with percentage of ITSS 78.9%, (i) photomicrographs from light microscopy (hematoxylin and eosin stain; original magnification × 100). DCE, dynamic contrast-enhanced; ESWAN, enhanced T2*-weighted angiography; ITSS, intratumoral susceptibility signal; MRI, magnetic resonance imaging; PDW, proton density weighted; SI, signal intensity; SIR, signal intensity ratio; T1W, T1-weighted; T2W, T2-weighted.
Comparison of SIRs of conventional MRI sequences among three subtypes of IMH
SIRs of conventional MRI sequences are shown in Table 2, including T1W, T2W, PDW, and contrast-enhanced T1W imaging. There were no significant differences for SIRs of conventional MRI sequences among the three subtypes of IMH (P = 0.558, P = 0.259, P = 0.385, P = 0.347) (Table 2).
SIRs of conventional MRI sequences and ESWAN parameters for each subtype with comparison among three subtypes of IMH.
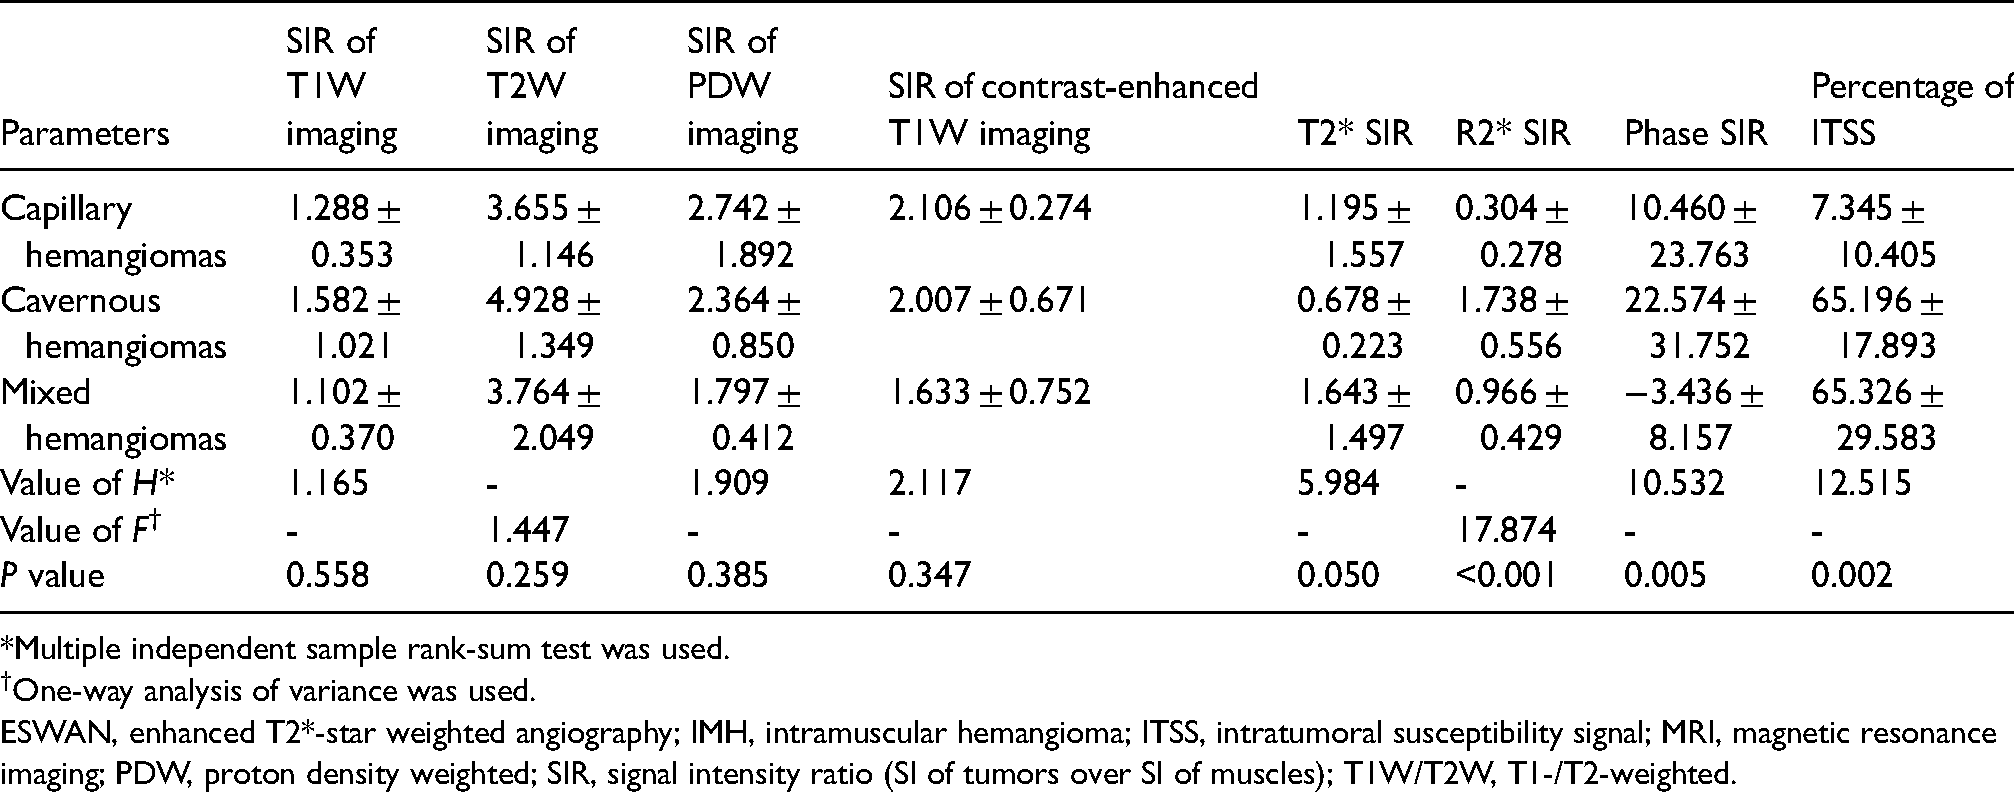
*Multiple independent sample rank-sum test was used.
One-way analysis of variance was used.
ESWAN, enhanced T2*-star weighted angiography; IMH, intramuscular hemangioma; ITSS, intratumoral susceptibility signal; MRI, magnetic resonance imaging; PDW, proton density weighted; SIR, signal intensity ratio (SI of tumors over SI of muscles); T1W/T2W, T1-/T2-weighted.
Comparison of SIRs of ESWAN parameters with ROC curves among three subtypes of IMH
SIRs of ESWAN parameters are shown in Table 2, including T2* value, R2* value, phase value, and percentage of ITSS. There were significant differences for SIRs of ESWAN among the three subtypes (P = 0.050, P < 0.001, P = 0.005, P = 0.002) (Table 2).
Multiple comparisons were performed to compare any two of the three subtypes (Table 3). There were significant differences for R2* SIR and percentage of ITSS between capillary hemangiomas and cavernous hemangiomas (P < 0.001, P = 0.001). However, there were no significant differences between T2* SIR and phase SIR (P = 1.000, P = 0.108). In addition, there were significant differences for R2* SIR and percentage of ITSS between capillary hemangiomas and mixed hemangiomas (P = 0.011, P < 0.001). However, there were no significant differences between T2* SIR and phase SIR (P = 0.272, P = 0.328). There were significant differences for T2* SIR, R2* SIR, and phase SIR between cavernous hemangiomas and mixed hemangiomas (P = 0.006, P = 0.002, P < 0.001). However, there was no significant difference for the percentage of ITSS between them (P = 0.963).
Multiple comparisons with corresponding ROC curve analysis among three subtypes of IMH based on SIRs of ESWAN parameters.
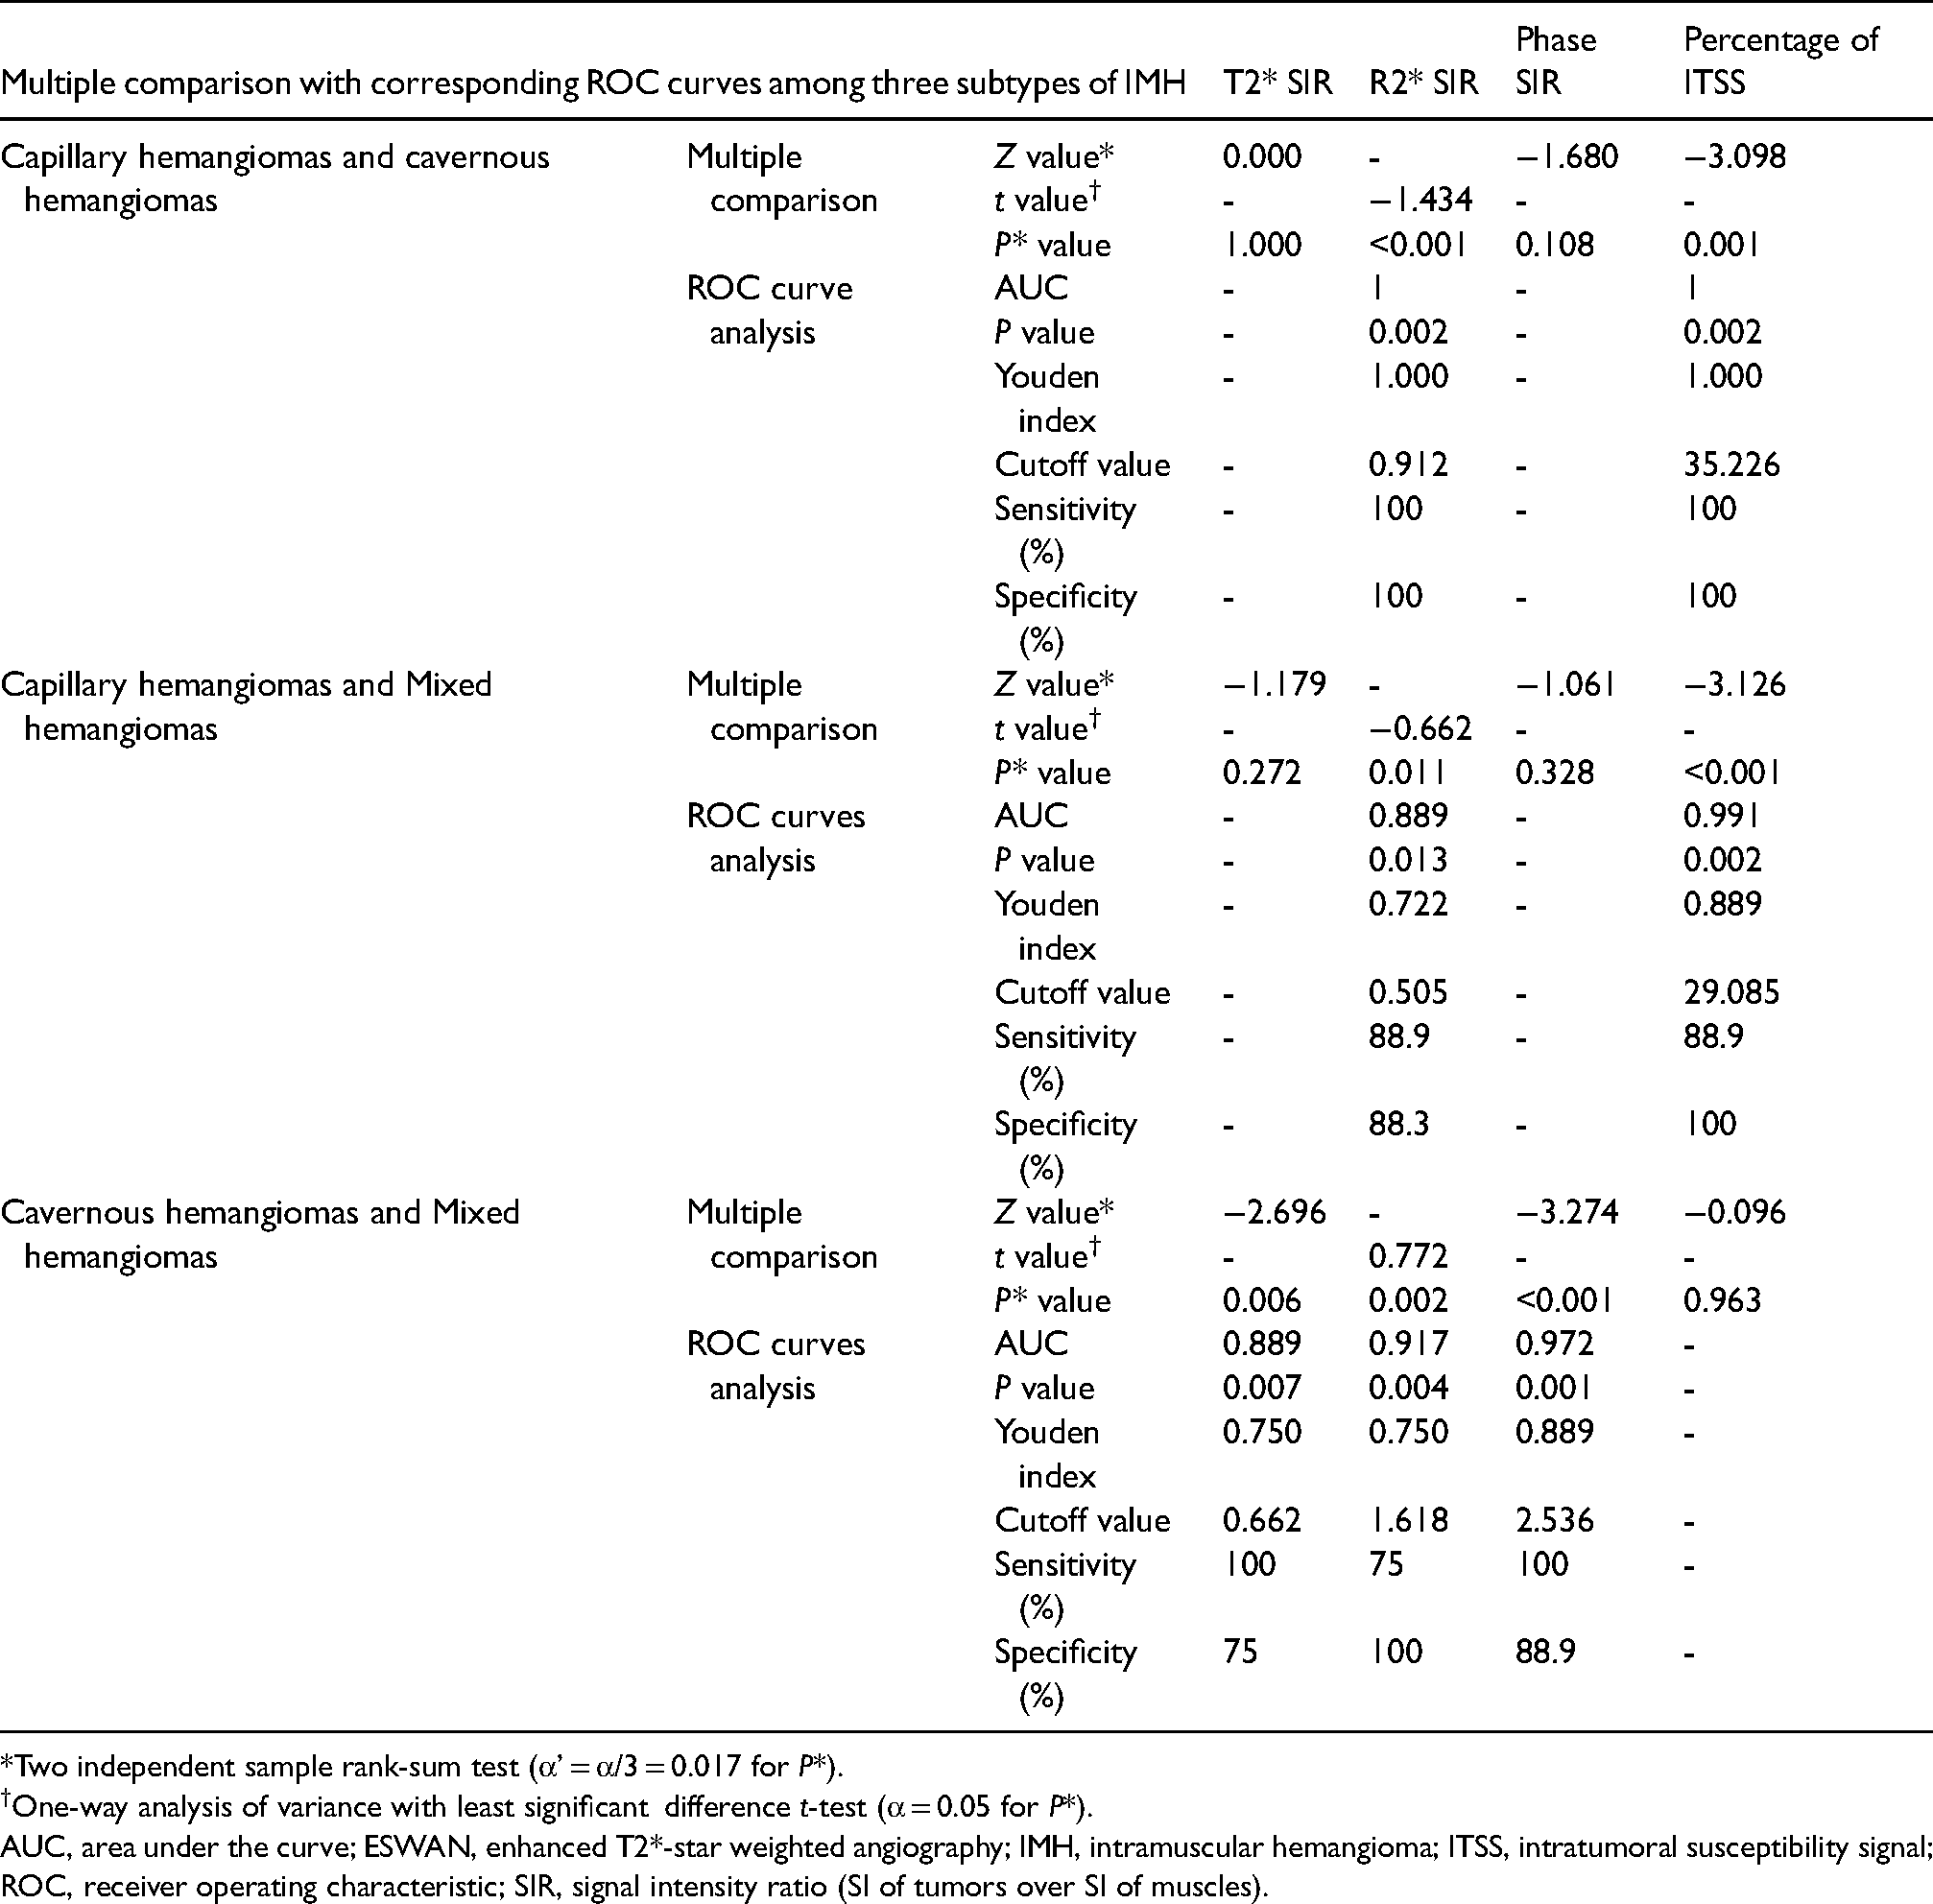
*Two independent sample rank-sum test (α’ = α/3 = 0.017 for P*).
One-way analysis of variance with least significant difference t-test (α = 0.05 for P*).
AUC, area under the curve; ESWAN, enhanced T2*-star weighted angiography; IMH, intramuscular hemangioma; ITSS, intratumoral susceptibility signal; ROC, receiver operating characteristic; SIR, signal intensity ratio (SI of tumors over SI of muscles).
ROC curves with their respective cutoff values were formed to promote the best diagnostic accuracy based on the Youden index. Sensitivity and specificity were used to evaluate diagnostic efficiency (Table 3 and Fig. 5). Capillary hemangiomas can be diagnosed when R2* SIR is <0.912 and ITSS percentage is <29.085%. Cavernous hemangiomas should be considered when R2* SIR is >0.912, ITSS percentage is >35.226%, and phase SIR is >2.536. In addition, mixed hemangiomas have T2* SIR >0.662 and R2* SIR <1.618.
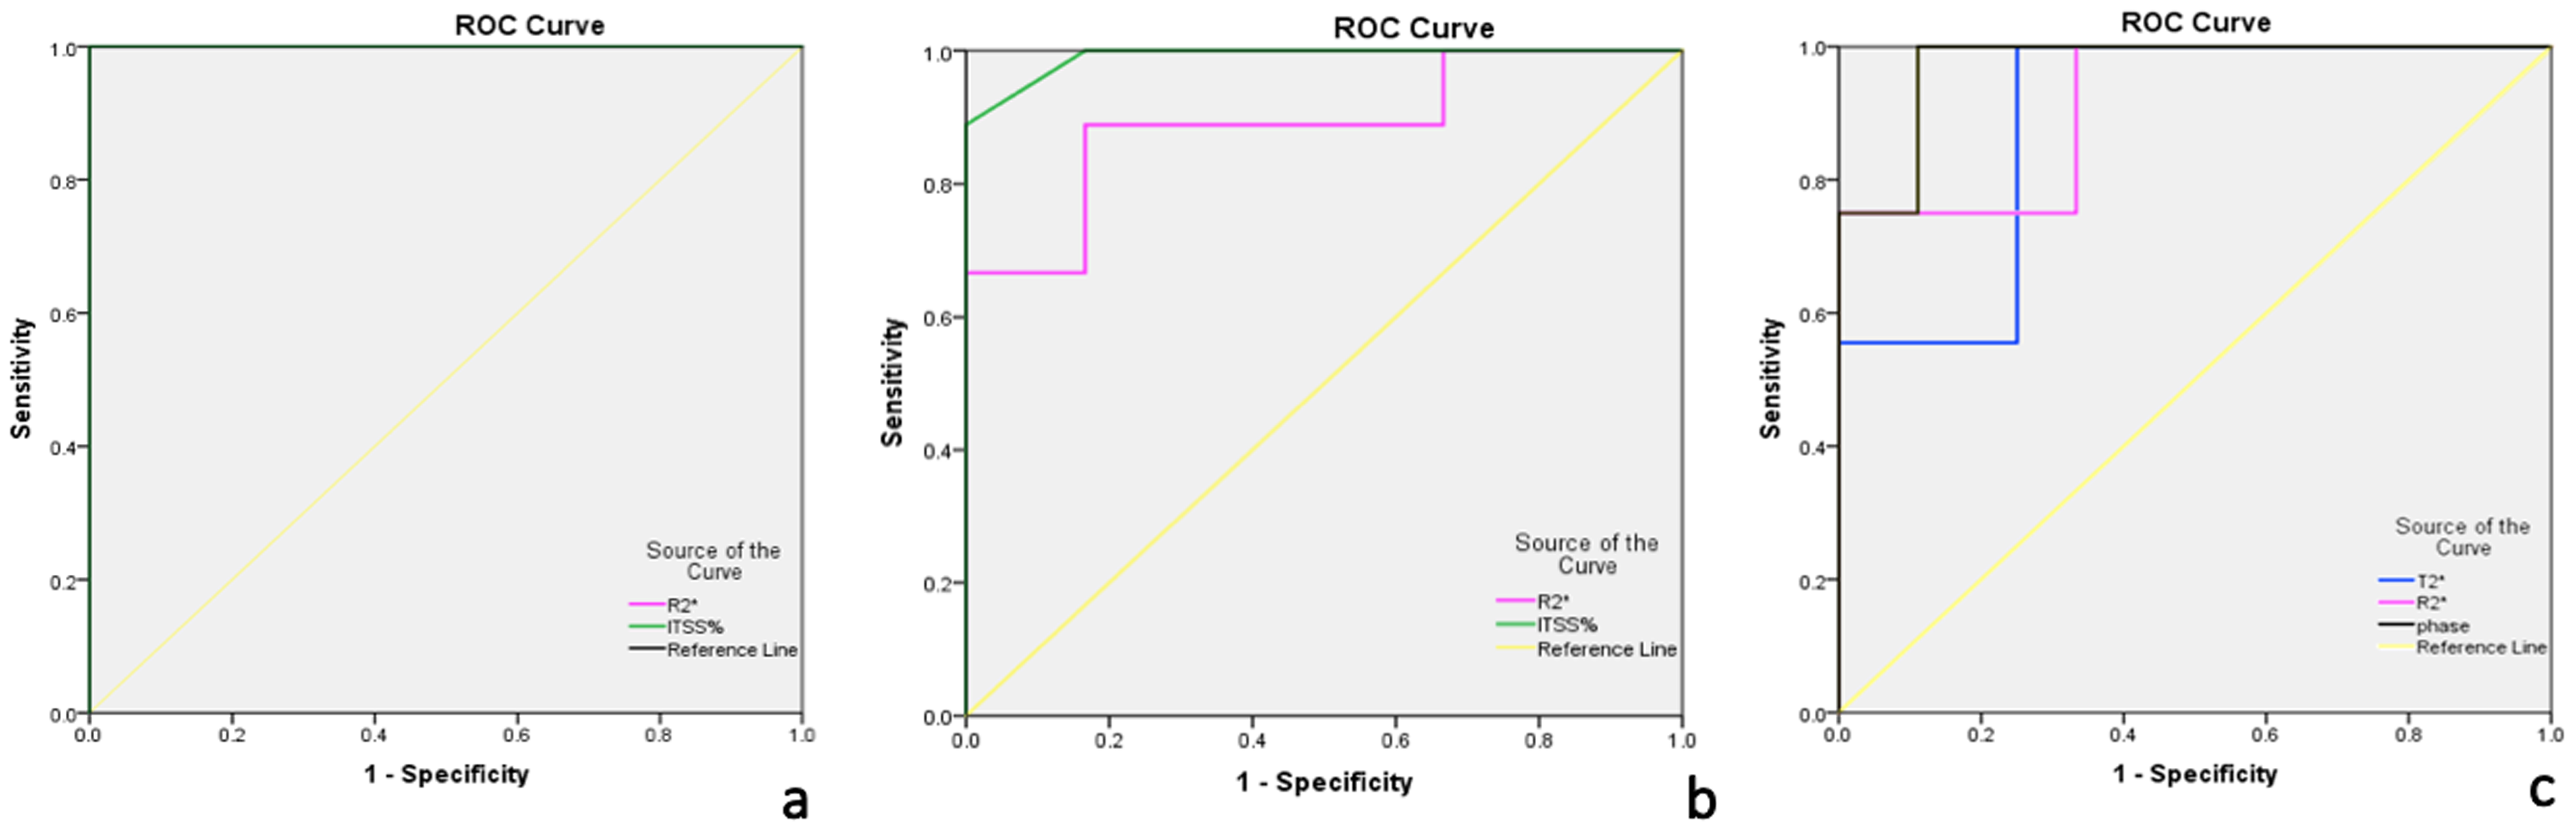
The diagnostic accuracy of ESWAN parameter SIRs in differential diagnosis of IMH subtypes. (a) ROC curves of SIRs of ESWAN parameters (R2* SIR and percentage of ITSS) for capillary hemangioma and cavernous hemangioma, (b) ROC curves of SIRs of ESWAN parameters (R2* SIR and percentage of ITSS) for capillary hemangioma and mixed hemangioma, (c) ROC curves of SIRs of ESWAN parameter (T2* SIR, R2* SIR, and phase SIR) for cavernous hemangioma and mixed hemangioma. ESWAN, enhanced T2*-weighted angiography; IMH, intramuscular hemangioma; ITSS, intratumoral susceptibility signal; ROC, receiver operating characteristic; SIR, signal intensity ratio.
Discussion
Management of IMH should be according to its histopathological subtypes, region of disease, and tumor size although there is no malignant potential (8). All treatment strategies involve regular observation, surgical resection, and conservative therapy, including pharmacotherapy, sclerotherapy, and radiotherapy (7). A capillary hemangioma often adopts simple surgical excision due to its limited range, clear boundary, and less surgical bleeding. A cavernous hemangioma, because of its unclear boundary with the surrounding tissue, require non-operative treatment and operative treatment, in which surgical resection is the main treatment, but its recurrence rate is as high as 18%–61% (3). The histopathological classification of IMH subtypes is mostly postoperative, which has a limited guiding effect for preoperative treatment. Therefore, non-invasive preoperative examination of pathological subtypes is a necessary method for clinical treatment.
MRI is considered the most reliable technique to identify IMHs. We compared the volumes, shapes, and signal performances of IMH subtypes and found that conventional MRI is the most reliable imaging tool for the preoperative qualitative diagnosis of IMH, including the location, size measurement, and signal display, which is similar to previous studies (11,18). However, we always found an overlap in signal expression between the cavernous hemangioma and mixed hemangioma. What makes a cavernous hemangioma different from a capillary hemangioma in SI is that cavernous hemangiomas are obviously high SI on T2W imaging due to a high volume of free-flowing fluid in the massive vessels. However, it is difficult to differentiate between cavernous hemangiomas and mixed hemangiomas because they both contain a certain portion of intumescent blood sinus and sporadic adipose tissue. In addition, the qualitative diagnosis of cavernous hemangioma and mixed hemangioma is similar in volume and shape. Moreover, there was no significant difference in the quantitative diagnosis among SIRs of conventional MRI. Therefore, the measurement of SIRs in conventional MRI sequences cannot be used as guidance for clinicians to quantitatively diagnose three subtypes of IMH before surgery, which is a good extension for previous studies.
Magnetic sensitive weighted imaging is sensitive to blood metabolites, venous vessels, and calcium iron deposits. A capillary hemangioma is composed of proliferative capillaries with flat endothelial cells, abundant cells, and a lack of paramagnetic substances. A cavernous hemangioma consists of long-time flow and hypoxic veins with endothelial cells, which is rich in paramagnetic substances and a small quantity of diamagnetic substances. A mixed hemangioma consists of proliferative capillaries, dilated veins of different sizes, and sinuses with flat endothelial cells.
ESWAN 3D-MinIP imaging has the advantage of showing veins and minimal hemorrhage in the tissues (19). The vein has a linear or low-twisted SI. It can be twisted from the upper part to the lower part and form a “ball-shaped” vessel. Bleeding is punctate or patchy shape with low SI and interrupted irregular distribution. We found abnormal vessels and a small amount of bleeding in IMHs using 3D-MiniIP imaging. An active hemorrhage, thrombus, and calcification can also be identified.
ESWAN R2* value, phase value, and ITSS are often used as quantitative diagnostic parameters to measure iron contents and show different subtypes of hemangioma (19–21). The R2* value is the transverse relaxation rate indicating the oxygen exchange in local tissue. The decrease of oxygen in local tissues leads to the increase of deoxyhemoglobin with the increase of R2* value and the decrease of MRI SI value. According to these criteria, we can detect tumor hypoxia. There is an obvious linear positive correlation between R2* value and iron content in the tissue (correlation coefficient = 0.989) (22). Phase imaging reflects the angle of the proton relaxation, which is related to the content of magnetically sensitive substances in the organs. Therefore, the increase of paramagnetic substances will produce higher organ magnetic sensitivity. The lower SI on imaging indicates a bigger negative phase value (23). ITSS represents veins, bleeding, and hemosiderin in the tumor (24). It rises with the increase of the paramagnetic substances. However, the R2* value, phase value, and ITSS are always affected when they become the observation index (22). The R2* value is easily affected by massive hemorrhage, necrosis, and cystic lesions, leading to false negative results. The phase value is affected by the tumor’s magnetic field and external magnetic field, which further leads to the decrease of its validity. Furthermore, ITSS belongs to the semi-quantitative analysis index and is only influenced by subjectivity. Therefore, in our study, R2* SIR, phase SIR, and percentage of ITSS were used as differential diagnosis parameters. These observations quantitatively reflect the contents of paramagnetic substances in IMHs and oxygen in the blood sinus. The average of nine ROIs was used to avoid bias errors caused by uneven venous distribution, internal bleeding, and iron deposition. Mixed hemangioma in our study had the highest R2* SIR and phase SIR values, and it contained the most abundant paramagnetic materials in the three subtypes of IMH. The percentage of ITSS in capillary hemangioma was significantly lower than that in cavernous hemangioma and mixed hemangioma due to lack of paramagnetic substances. It turned out that ESWAN R2* SIR, phase SIR, and the percentage of ITSS can be used as quantitative diagnostic parameters to identify the three subtypes. The differences of T2* SIR in the three subtypes are statistically significant, especially between cavernous hemangioma and mixed hemangioma, which can also be used as a quantitative diagnostic parameter. Therefore, when conventional MRI sequences cannot sufficiently distinguish IMH subtypes before surgery, we consider that an additional ESWAN sequence should be recommended to help clinicians diagnose IMH subtypes qualitatively and quantitatively.
This study is the first to evaluate and compare the diagnostic performance of conventional MRI sequences and the ESWAN technique in qualitative and quantitative diagnosis of IMH subtypes. It improves previous studies and provides deeper visions for accurate diagnosis and treatment. More importantly, the study can provide the database for artificial intelligence, improve the accuracy of intelligent diagnosis, and reduce the rate of misdiagnosis. However, the main limitation of this study is the small sample size of patients with IMH subtypes, which may have a negative effect on statistical evaluation. Therefore, further large sample studies or meta-analyses are required.
In conclusion, the present study showed that conventional MRI can only display the volume, shape, and signal of IMHs with no subtypes diagnosed quantitatively; 3D-MinIP imaging of ESWAN can show the veins and minor hemorrhage; and SIRs of ESWAN parameters including T2* value, R2* value, phase value, and percentage of ITSS can be used to quantitatively diagnose capillary hemangiomas, cavernous hemangiomas, and mixed hemangiomas.
Footnotes
Acknowledgements
We thank Qingwei Song, Yanwei Miao, Dianxiu Ning, and Zhijin Lang for their help in the early stage with MR ESWAN scanning and data analysis. We also acknowledge Qiuping Zhang, Mingzhan Du, and Xiaoshun He for their help with the pathological analysis.
Declaration of conflicting interests
The author(s) declared no potential conflicts of interest with respect to the research, authorship, and/or publication of this article.
Funding
The author(s) disclosed receipt of the following financial support for the research, authorship, and/or publication of this article: This work was supported by Liaoning Science and Technology Project (grant number 201602245) and National Nature Science Foundation of China (grant number 81701649).