
Abstract
Objective
To describe nationwide mortality patterns related to Alzheimer's disease and cerebrovascular disease in United States adults aged ≥65 years and explore future trend projections.
Methods
In this retrospective study, we utilized the Centers for Disease Control and Prevention Wide-ranging Online Data for Epidemiologic Research database (ICD-10 G30, I60–I69) to calculate crude and age-adjusted mortality rates per 100,000 population. Temporal trends were modeled using Joinpoint regression, and 10-year forecasts were obtained using autoregressive integrated moving average models. Subgroup analyses were performed by sex, race/ethnicity, census region, urbanization, and place of death.
Results
We identified 199,606 Alzheimer's disease–cardiovascular disease-related deaths. Overall, age-adjusted mortality rates peaked at 24.8 in 2002, reduced to 14.2 in 2013, and then rose to 18.7 in 2020 before dropping to 16.6 in 2023. Women exhibited higher age-adjusted mortality rates than men (20.1 vs. 16.0). Individuals of White and Black ethnicity bore the greatest burden, and the South and West recorded the highest regional age-adjusted mortality rates. These rates were consistently higher in non-metropolitan areas than in metropolitan areas. Exploratory projections estimate an overall age-adjusted mortality rate of 16.6 by 2033, with persistently higher rates in women, non-Hispanic Black populations, and among those residing in the West and non-metropolitan areas.
Conclusions
Despite substantial decline since the early 2000s, Alzheimer's disease–cardiovascular disease mortality remains high and unevenly distributed. Exploratory projections suggest that the burden will remain substantial, underscoring the need for targeted prevention, vascular risk reduction, and equity-focused dementia care.
Keywords
Introduction
Alzheimer's disease (AD) is the most common cause of age-related cognitive impairment and has emerged as a leading health challenge. AD affects ∼6 million people in the United States and imposes a healthcare cost of US$259 billion; it has risen to be the sixth most common cause of death in the United States. 1 AD has traditionally been considered a neurodegenerative disease affecting neurons; however, alterations in the cerebral macrovasculature and microvasculature are also present, characterized by progressive neuronal loss and accumulation of amyloid-β and tau pathology. AD is increasingly being recognized as a disease influenced by vascular mechanisms. 2 The interaction between cerebrovascular disease (CVD) and AD is a topic of considerable current interest. With aging, there is an increasing prevalence of coincident AD and CVD that is well recognized. Appreciable cerebrovascular lesions are observed in the brains of 50%–84% of individuals aged >80 years. 3 Epidemiological studies have shown that AD and CVD share common risk factors such as hypertension during midlife, diabetes mellitus, smoking, apolipoprotein E (ApoE) ε4 isoforms, hypercholesterolemia, and homocysteinemia; in particular, age-related cerebrovascular damage can exacerbate neurodegeneration through mechanisms such as cerebral hypoperfusion, blood–brain barrier dysfunction, and vascular inflammation, thereby accelerating cognitive decline and increasing the risk of dementia-related mortality.4,5 In the Medical Research Council Cognitive Function and Ageing Study, vascular risk factors were not associated with an increased burden of AD pathology at the time of death in older individuals, whereas cerebral small vessel disease and cardiovascular disease were interrelated. 6 Thus, cerebrovascular pathology is increasingly recognized as an important contributor to both development and progression of AD and related mortality. In recent decades, advances in healthcare and improved stroke care have shifted national mortality trends; however, disparities persist across demographic, geographic, and socioeconomic groups.4,7 Despite growing recognition of this interaction, national epidemiological data examining mortality patterns in which AD and CVD are jointly implicated remain limited. Most previous studies have examined these conditions independently, leaving gaps in the understanding of how their combined presence influences mortality trends and demographic disparities across populations. To address this gap, we conducted a national population-based analysis using the Centers for Disease Control and Prevention Wide-ranging Online Data for Epidemiologic Research (CDC WONDER) database to evaluate trends in mortality related to AD and CVDs from 1999 to 2023 in the United States. Through age-adjusted analyses, Joinpoint regression, and time-series forecasting, this study aimed to characterize long-term mortality patterns and forecast future trajectories, with an emphasis on identifying disparities and vulnerable subgroups.
Methods
Study setting and population
Data regarding deaths occurring within the United States were extracted from the CDC WONDER database. Our primary objective was to identify AD- and CVD-related mortalities in the United States from 1999 to 2023. The CDC WONDER is a comprehensive store of death certificate data from the 50 states of the United States and the District of Columbia. Public Use record death certificates were studied to identify records in which AD and CVD were both recorded as either the underlying cause of death or the contributing cause of death. Patients aged ≥65 years were identified using the International Classification of Diseases, Tenth Revision, Clinical Modification (ICD-10-CM) codes for late-onset AD (G30.1, G30.8, and G30.9) and CVD (I60–I69); the early-onset AD code (G30.0) was excluded. These codes have been validated in previous studies using the CDC WONDER database to accurately capture AD 8 and CVD. 9 Institutional review board approval was not required for this study as we used a publicly available, de-identified dataset provided by the government. The study adheres to the reporting standards outlined in the Strengthening the Reporting of Observational Studies in Epidemiology (STROBE) guidelines. 10
Data abstraction
The dataset includes population counts, year of occurrence, location of death, demographic characteristics, geographical segmentation, state-specific data, and distinctions between urban and rural areas. Individuals pass away in various settings, including hospitals, homes, hospices, nursing homes, and long-term care facilities. “Demographics” refers to data on sex, age, race, and ethnicity. The racial and ethnic categories in this context include non-Hispanic (NH) White, NH Black or African Americans, and NH Asian or Pacific Islander. The data used in the analysis were sourced from death certificates, which have also been utilized in previous research that employed the CDC WONDER database. 11 Urbanization status was determined using the National Center for Health Statistics (NCHS) Urban–Rural Classification Scheme for Counties. Counties are classified into six levels as large central metropolitan, large fringe metropolitan, medium metropolitan, small metropolitan, micropolitan, and non-core. For this analysis, large central metro, large fringe metro, medium metro, and small metro counties were grouped as metropolitan areas, whereas micropolitan and non-core counties were grouped as non-metropolitan areas. 12 The United States was divided into four census regions, including the Northeast, Midwest, South, and West, according to the United States Census Bureau classification. 13
Statistical analyses
The crude and age-adjusted mortality rates (AAMRs) per 100,000 individuals were determined. Crude mortality rates (CMRs) were determined by dividing the number of AD and CVD-related deaths by the corresponding United States population in that year. AAMRs were calculated by standardizing AD and CVD-related deaths to the 2000 United States population, as previously described. Joinpoint regression was then used to fit segmented log-linear models to identify statistically significant changes in temporal trends using Monte Carlo permutation testing.14,15 This method identifies significant changes in AAMRs and CMRs over time by fitting log-linear regression models where temporal variations occur. Annual percentage changes (APCs) with 95% confidence intervals (CIs) for AAMRs and CMRs were calculated at the identified line segments linking join points using the Monte Carlo permutation test. APCs were considered increasing or decreasing if the slope describing the change in mortality was significantly different from zero in a two-tailed t-test. Statistical significance was set at p < 0.05. As cumulative AAMRs were not directly provided for the entire period from 1999 to 2023, we calculated them using a weighted averaging approach. Specifically, yearly AAMRs were weighted according to the corresponding annual population to account for variations in population size across years.
Autoregressive integrated moving average (ARIMA) modeling
Time-series analysis was conducted for exploratory modeling and projection of AAMRs. Data were organized by year and, where applicable, by group (e.g. race/ethnicity). Each series was treated as a univariate time series with annual frequency. We employed the ARIMA framework, which accounts for temporal correlation, non-stationarity, and random fluctuations in time-series data. ARIMA models combine the three components of autoregression (AR), differencing to remove trends (I), and moving average of past errors (MA).
For each series, the auto.arima() function from the R forecast package was applied to automatically select the optimal model order by minimizing the corrected Akaike Information Criterion (AICc). This procedure determines the number of autoregressive (p), differencing (d), and moving average (q) parameters required for the best model fit. Model adequacy was assessed by examining residuals for independence and approximate white-noise behavior. Forecasts were then generated for the subsequent 10 years and are intended to be descriptive and hypothesis-generating rather than predictive. Both point forecasts and 95% prediction intervals were generated, with the intervals reflecting the uncertainty associated with future projections. All analyses were conducted using R (version 4.5.0) with the forecast, ggplot2, dplyr, and readr packages. Similar approach on forecasting temporal trends using the ARIMA has been used in previous studies. 16
To assess the influence of the coronavirus disease 2019 (COVID-19) period on long-term mortality trends, we performed a sensitivity analysis excluding the years 2020–2022. In addition, a pre-pandemic ARIMA sensitivity analysis using data from 1999 to 2019 was conducted to evaluate whether projections were materially influenced by the temporary mortality perturbation observed during the pandemic.
Results
Overall trends in AD and CVD-related mortality
From 1999 to 2023, a total of 199,606 deaths related to AD and CV occurred among individuals aged ≥65 years in the United States (Supplementary Table 1). The overall trend from 1999 to 2023 was decreasing in nature, and the reduction was statistically significant (average APC (AAPC): −3.52, 95% CI: −3.81 to −3.13). The AAMRs between different time periods are shown in Supplementary Table 2.
Trends in AD and CVD-related mortality by sex
From 1999 to 2023, 135,721 deaths occurred among women and 63,885 among men due to AD–CVD (Supplementary Table 1). Among women, there was an overall decrease in the AAMR from 1999 to 2023 (AAPC: −3.50, 95% CI: −3.81 to −3.18); a similar declining trend was observed among men (AAPC: −3.04, 95% CI: −3.64 to −2.44). The AAMR and APC trends throughout the study period are shown in Supplementary Table 2 and Table 1, respectively. The trend is graphically depicted in Figure 1.
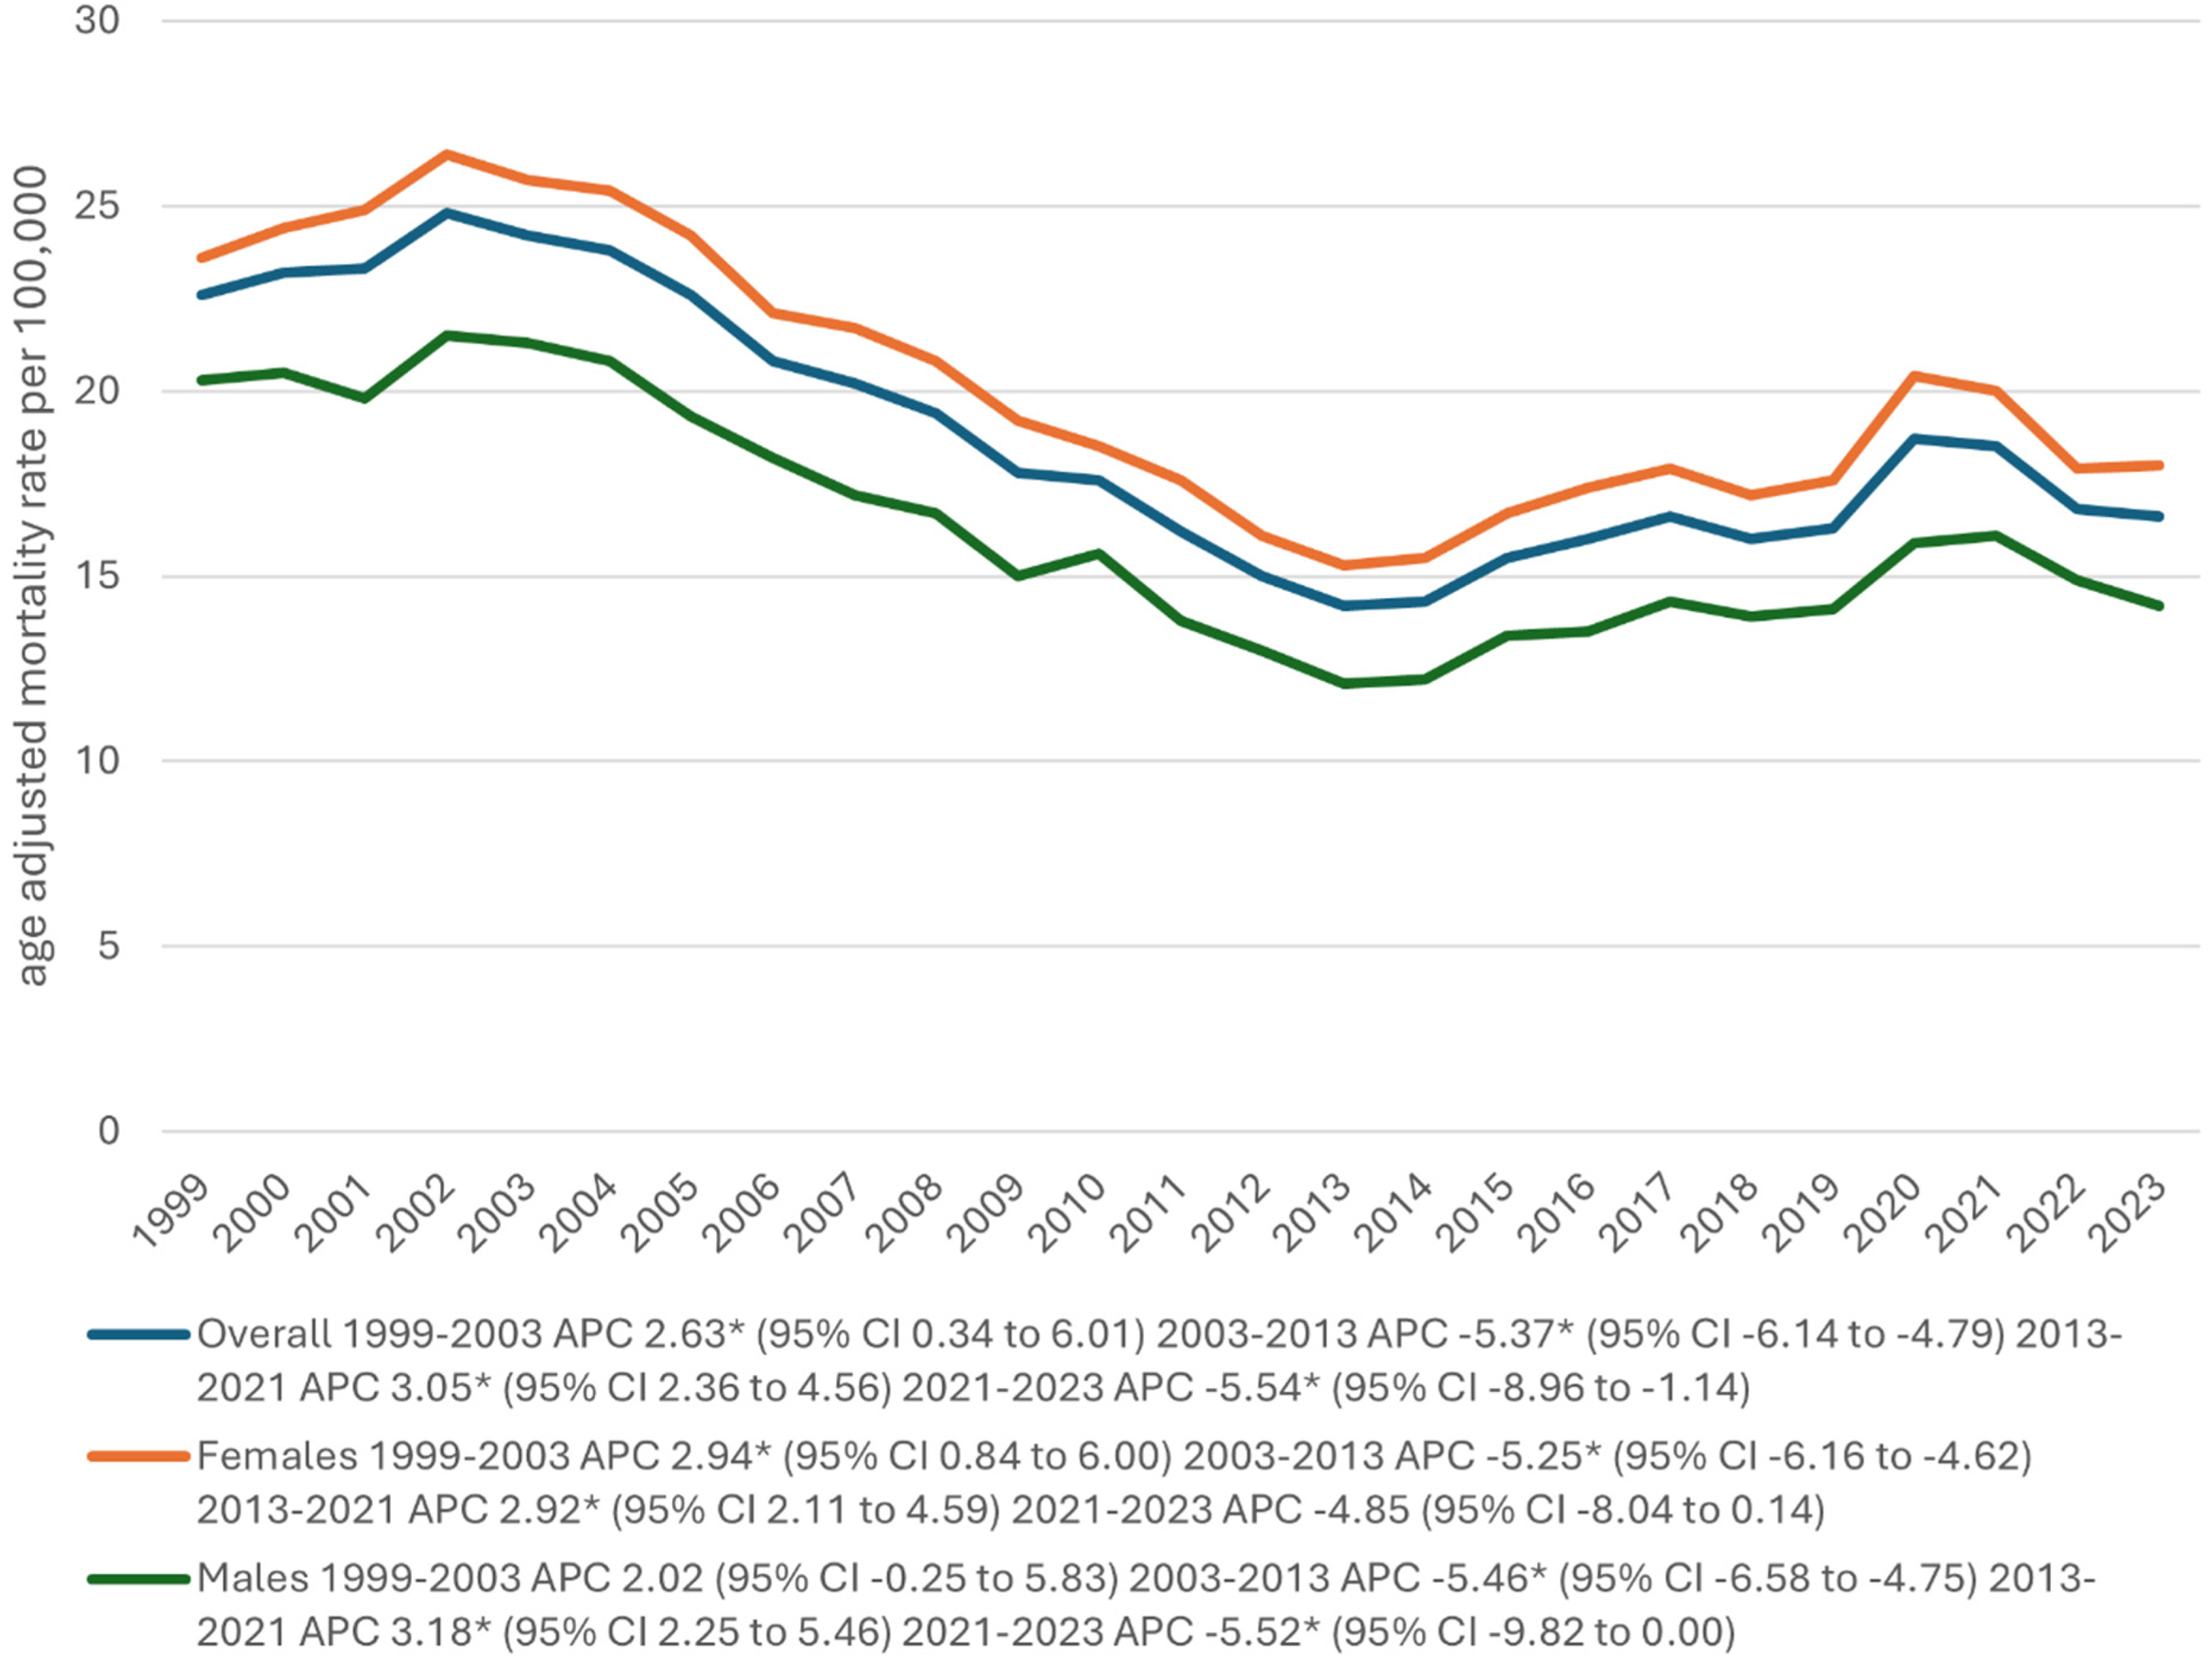
Overall and sex-stratified Alzheimer's disease and cerebrovascular disease-related age-adjusted mortality rates per 100,000 population in older adults in the United States (1999–2023). aIndicates that the annual percentage change (APC) is significantly different from zero at α = 0.05. AAMR: age-adjusted mortality rate; APC: annual percentage change; CI: confidence interval.
Annual percentage change in Alzheimer's disease and cerebrovascular disease mortality by sex: joinpoint analysis, United States, 1999–2020.
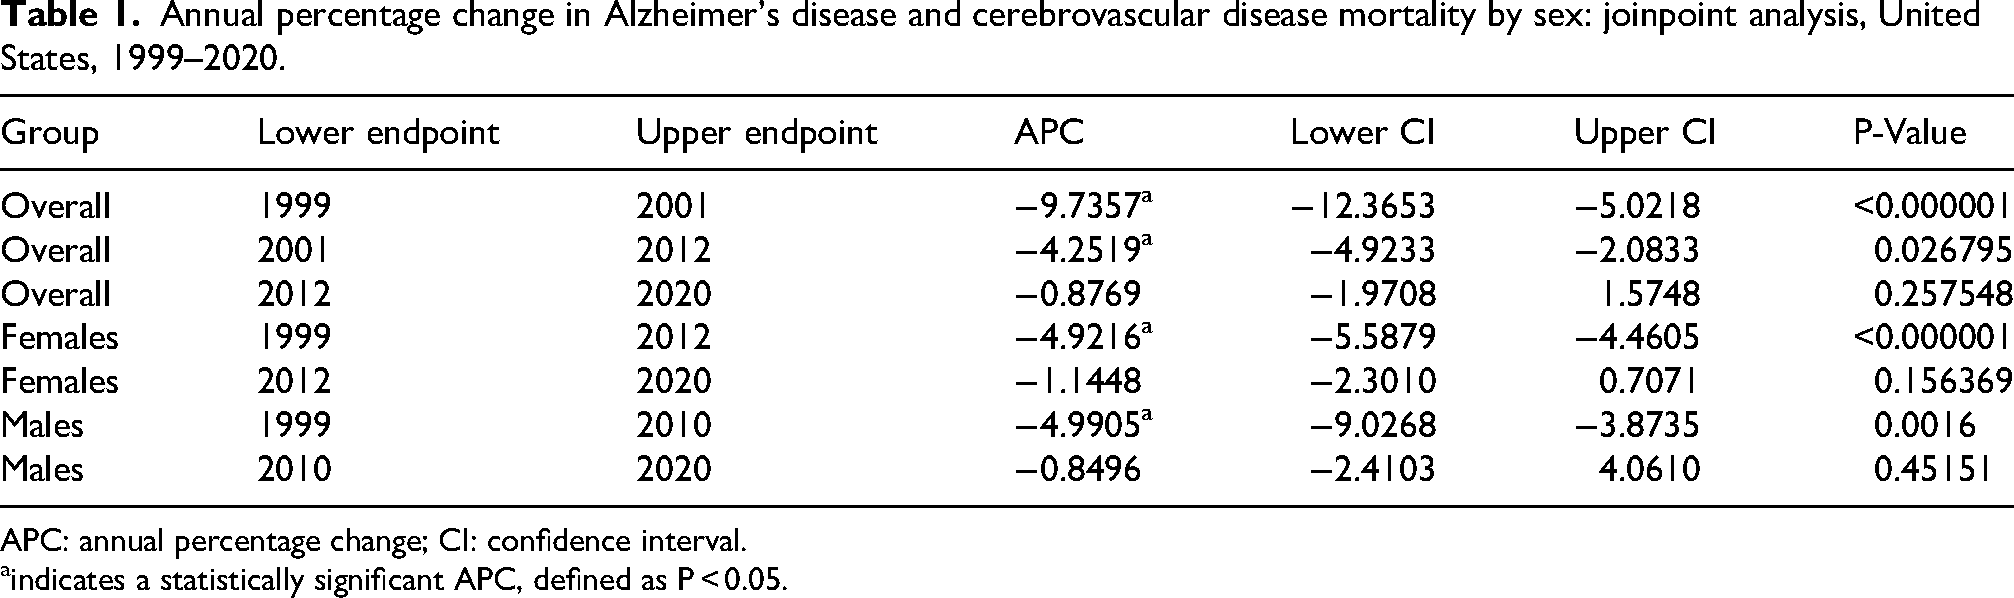
APC: annual percentage change; CI: confidence interval.
indicates a statistically significant APC, defined as P < 0.05.
Trends in AD and CVD-related mortality by race and Hispanic origin
From 1999 to 2023, 167,082 deaths occurred among those of White ethnicity; 17,361 among Black or African American individuals; 10,088 among Hispanic or Latino individuals; and 3273 among those of Asian or Pacific Islander descent due to AD and CVD (Supplementary Table 1). Across all racial groups, the overall AAMR decreased from 1999 to 2023, with the greatest decrease observed among non-Hispanic Black or African American individuals (AAPC: −5.33, 95% CI: −5.71 to −4.82), followed by that in Non-Hispanic Asian or Pacific Islanders (AAPC: −3.55, 95% CI: −4.77 to −2.31) and Hispanic or Latino individuals (AAPC: −3.06, 95% CI: −3.78 to −2.40). Individuals of non-Hispanic White ethnicity exhibited the lowest decline in AAMR (AAPC: −2.75, 95% CI: −3.32 to −2.30). The AAMR and APC trends throughout the study period are presented in Supplementary Table 3 and Table 2, respectively. The trend is graphically depicted in Figure 2.
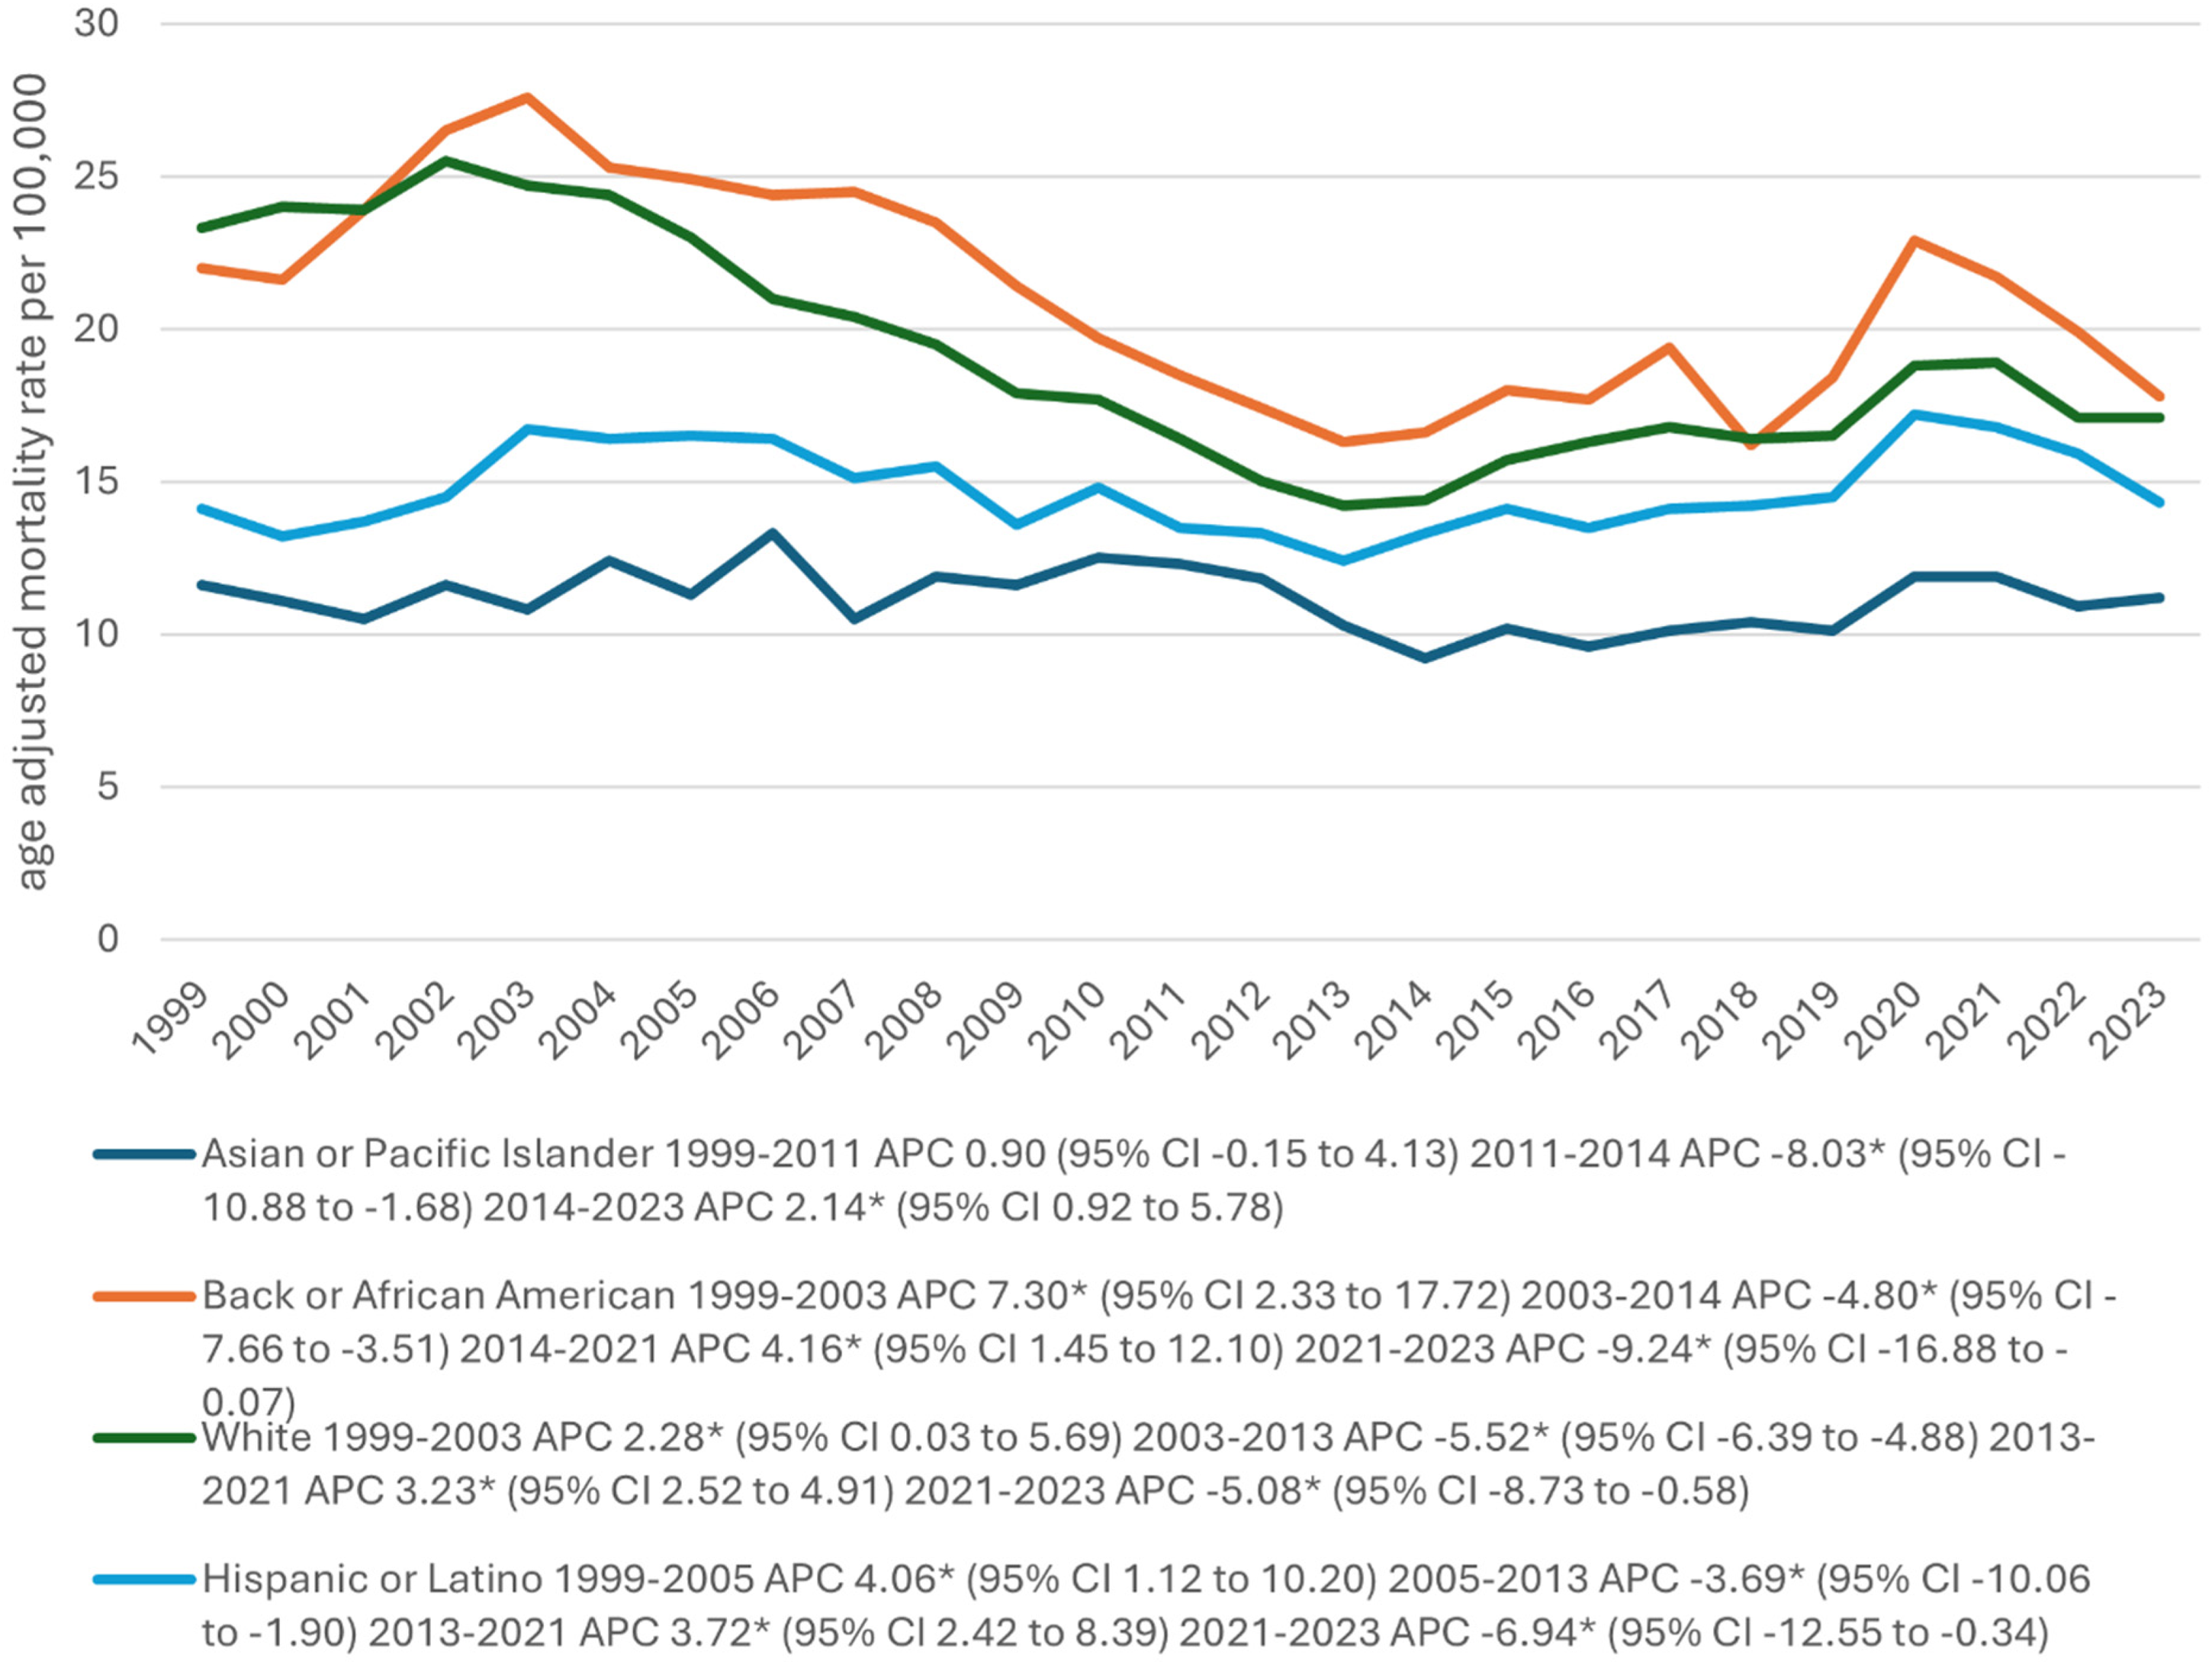
Alzheimer's disease and cerebrovascular disease-related age-adjusted mortality rates per 100,000 population, stratified by race, in older adults in the United States (1999–2023). Race categories represent non-Hispanic White, non-Hispanic Black or African American, Hispanic or Latino, and non-Hispanic Asian or Pacific Islander populations. aIndicates that the annual percentage change (APC) is significantly different from zero at α = 0.05. AAMR: age-adjusted mortality rate; APC: annual percentage change; CI: confidence interval.
Annual percentage change in Alzheimer's disease and cerebrovascular disease mortality by race: joinpoint analysis, United States, 1999–2020.
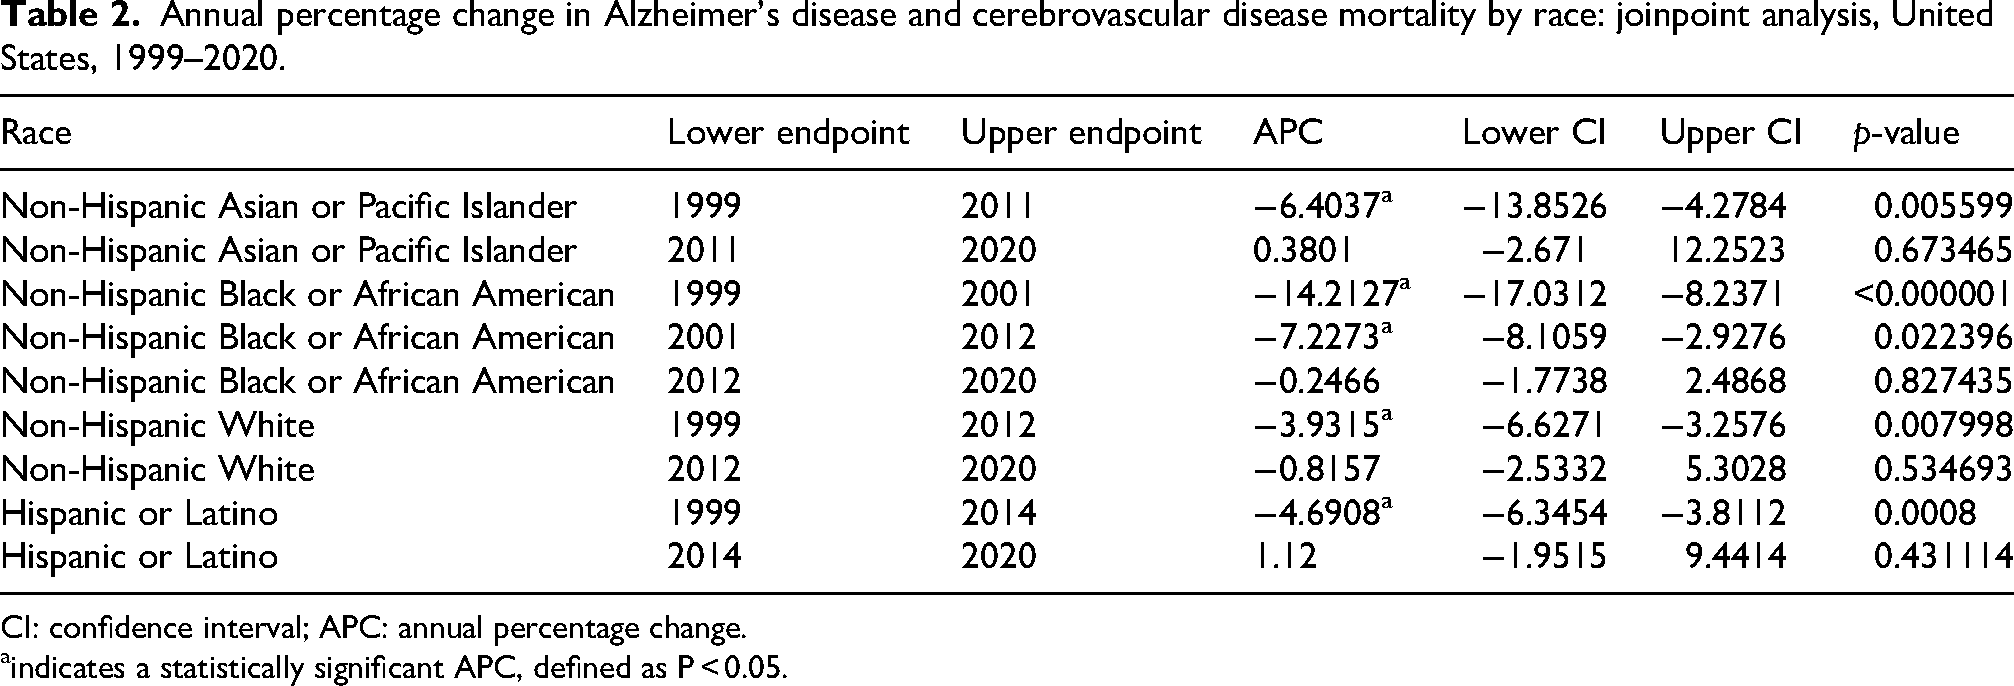
CI: confidence interval; APC: annual percentage change.
indicates a statistically significant APC, defined as P < 0.05.
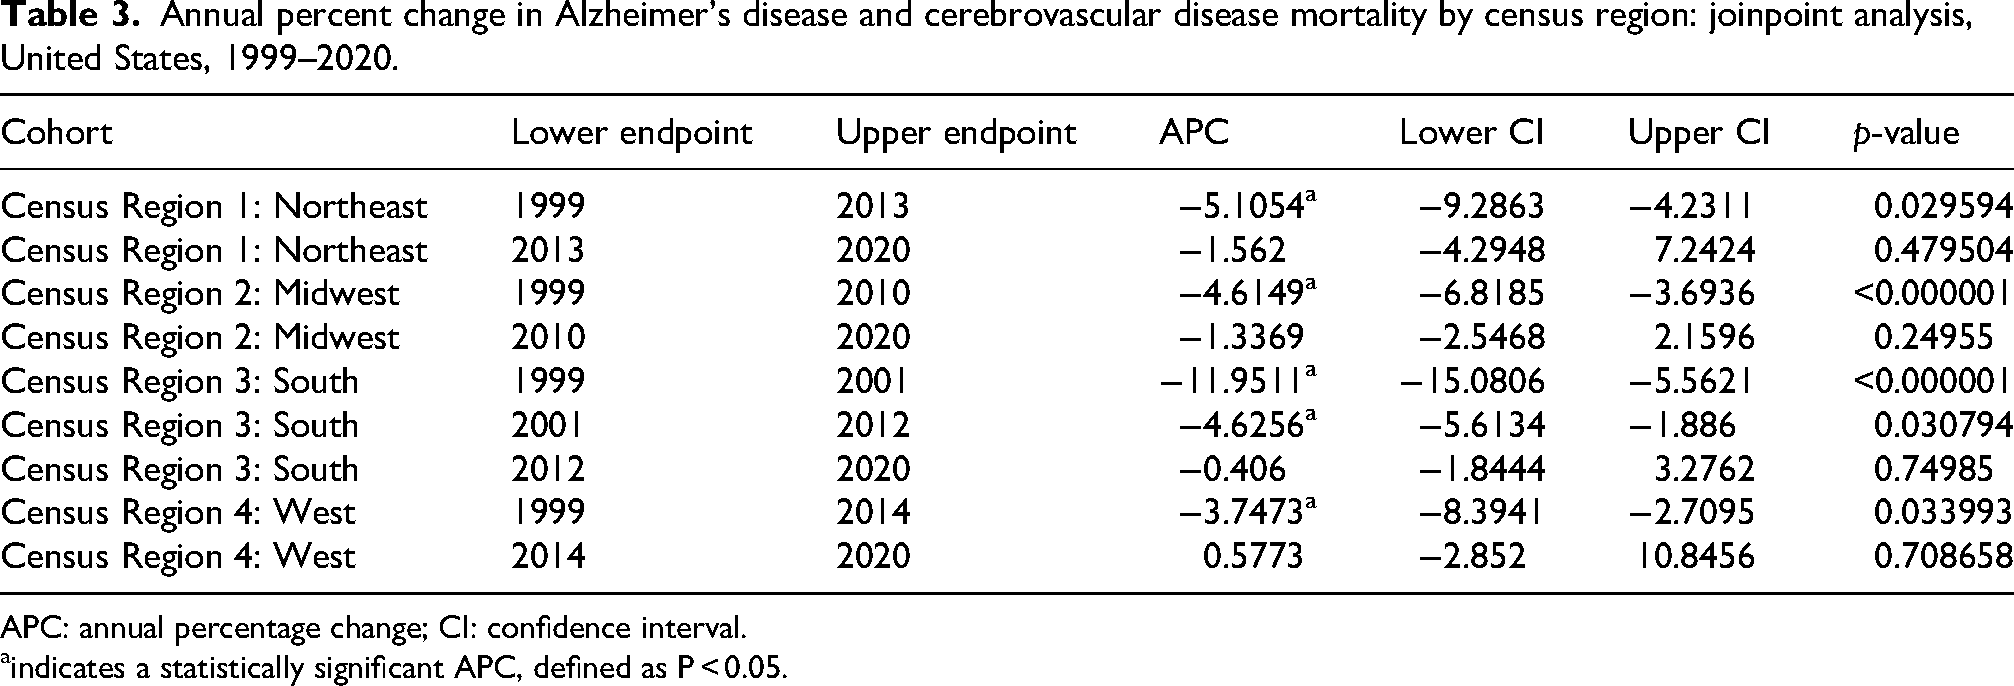
Trends in AD and CVD-related mortality by census region
From 1999 to 2023, AD- and CVD-related deaths were recorded with regional distributions as follows: (a) Northeast (26,154 deaths); (b) Midwest (47,984 deaths); (c) South (75,906 deaths); and (d) West (49,562 deaths) (Supplementary Table 1). A general declining trend was observed across all census regions, with the Northeast demonstrating the greatest decline (AAPC: −3.93, 95% CI: −4.74 to −3.37), followed by the South (AAPC: −3.77, 95% CI: −4.13 to −3.24), Midwest (AAPC: −3.06, 95% CI: −3.58 to −2.56), and West (AAPC: −2.53, 95% CI: −3.42 to −1.83). The AAMR and APC trends throughout the study period are shown in Supplementary Table 4 and Table 3 respectively. The trend is graphically depicted in Figure 3.
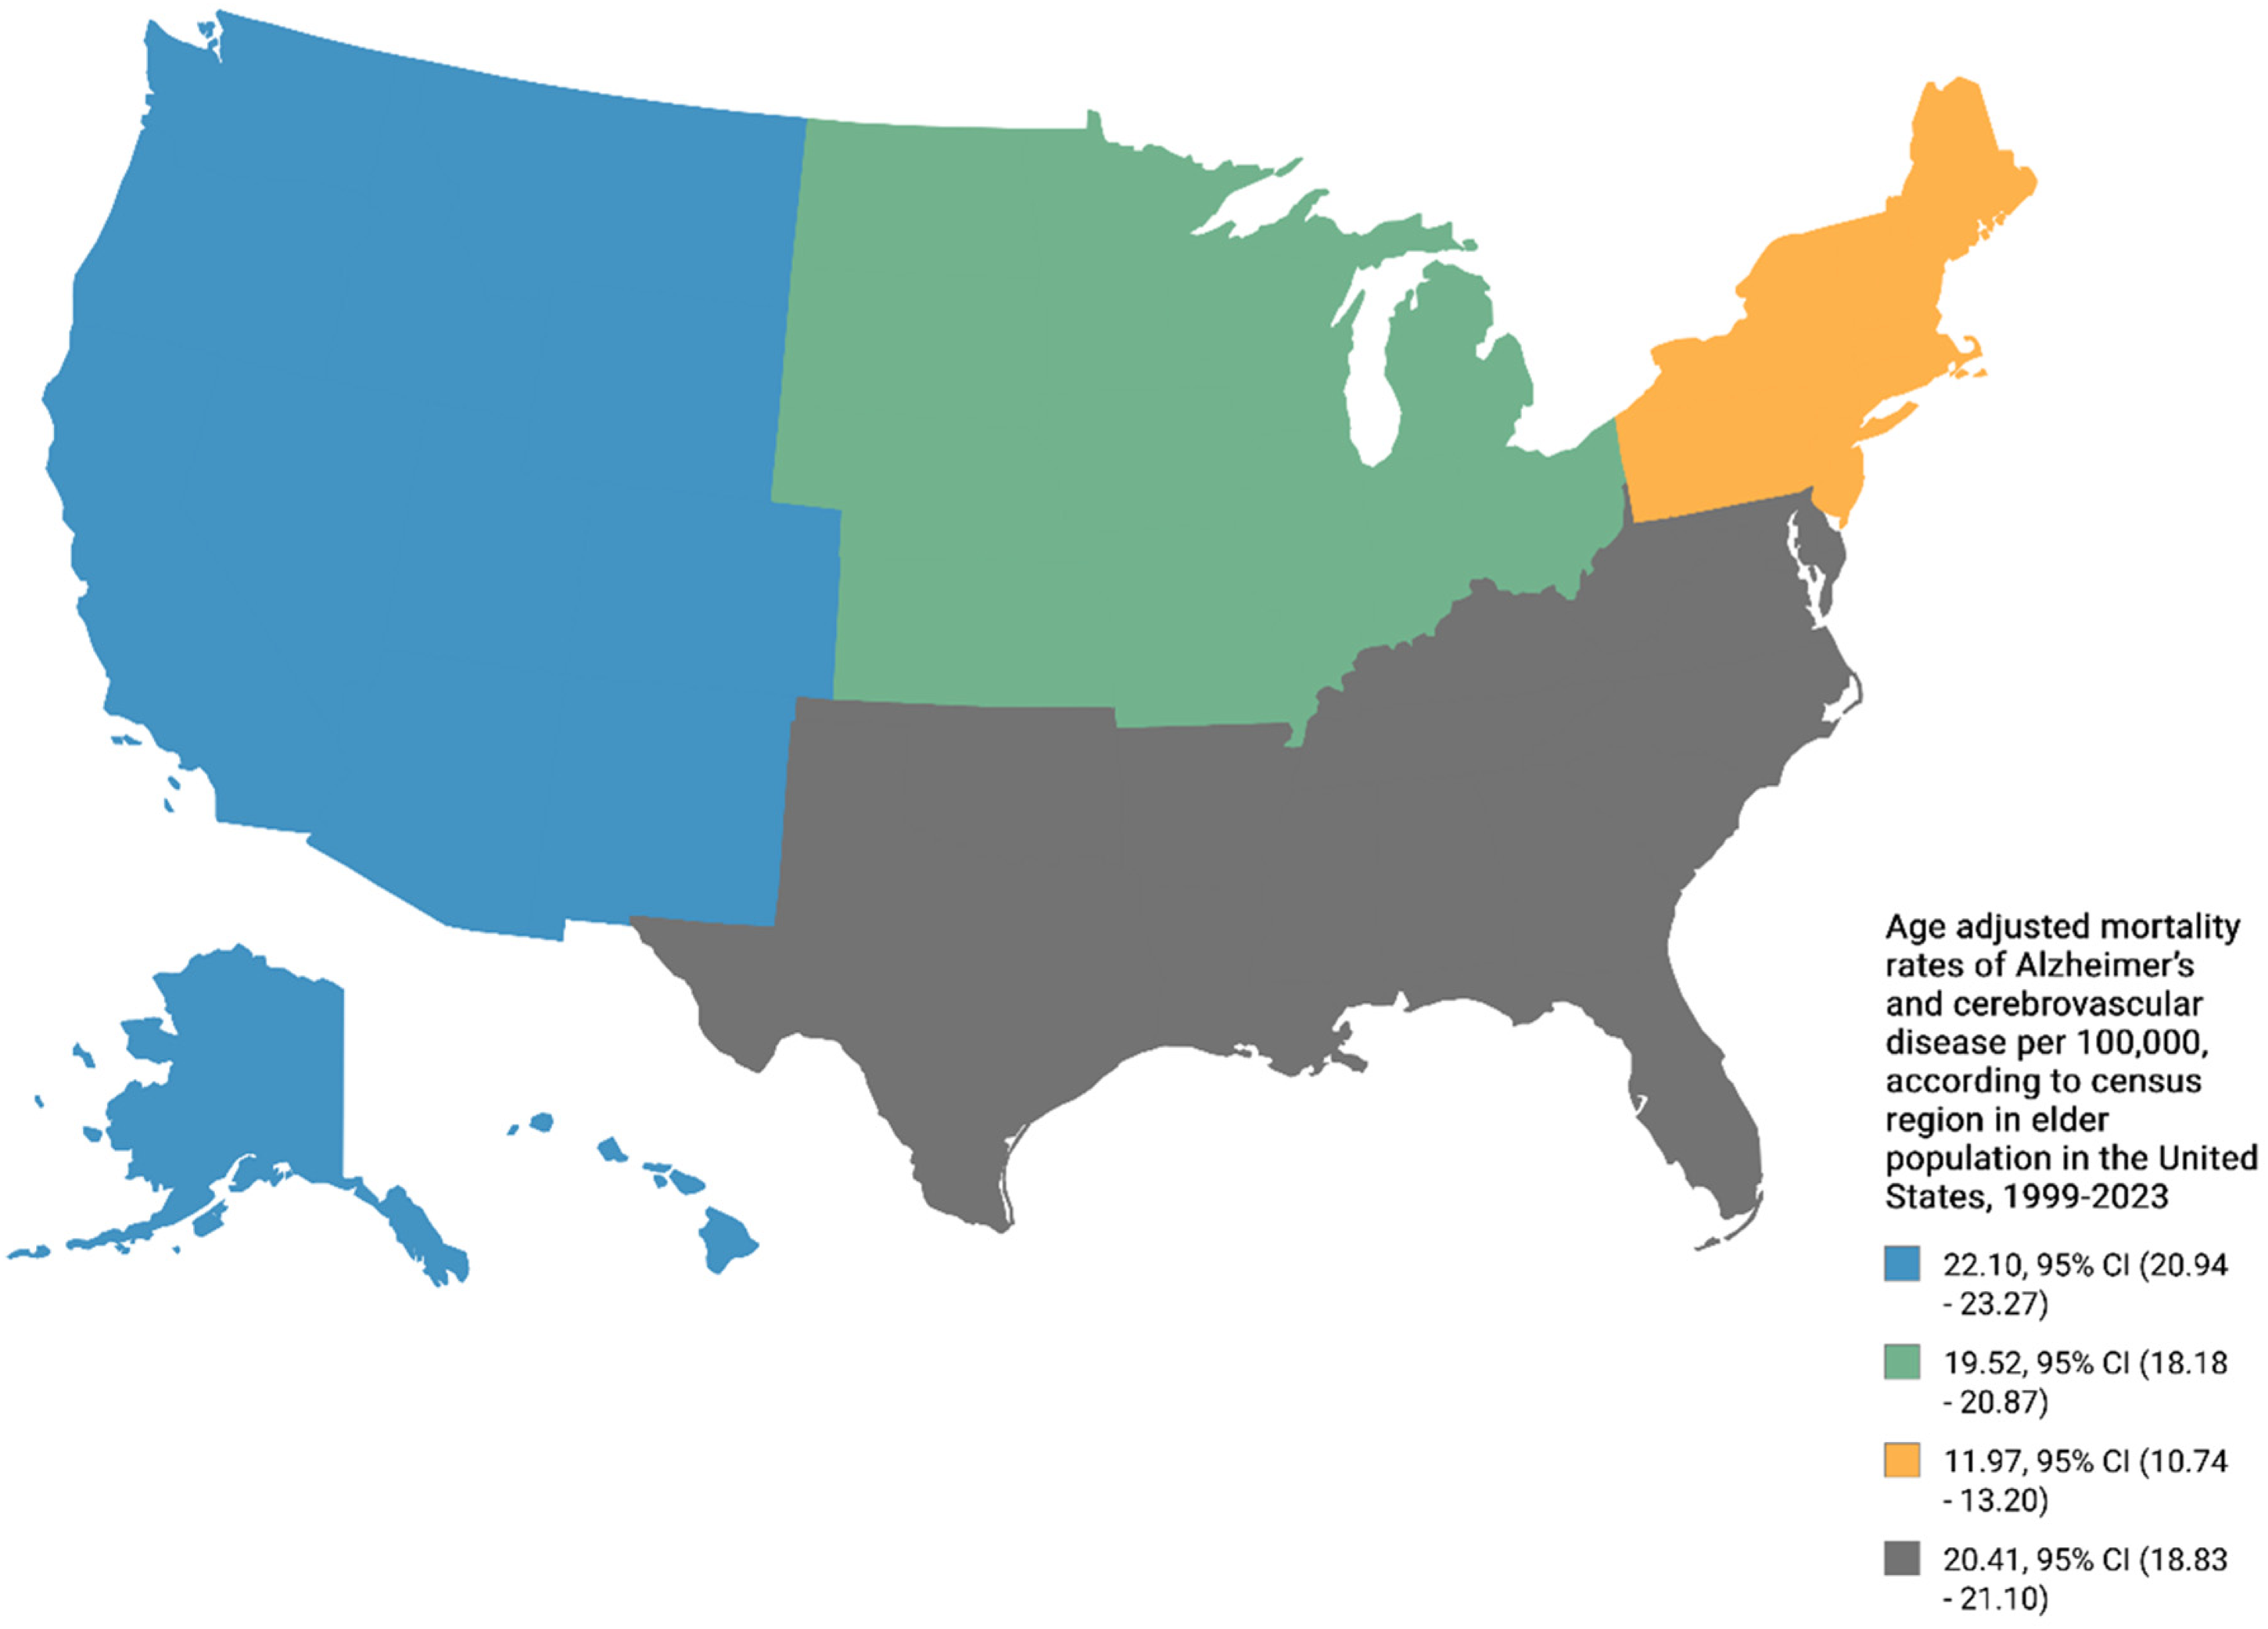
Alzheimer's disease and cerebrovascular disease-related age-adjusted mortality rates per 100,000 population, stratified by census region groups, in older adults in the United States (1999–2023). Census regions include the Northeast, Midwest, South, and West. aIndicates that the annual percentage change (APC) is significantly different from zero at α = 0.05. AAMR: age-adjusted mortality rate; APC: annual percentage change; CI: confidence interval.
Annual percent change in Alzheimer's disease and cerebrovascular disease mortality by census region: joinpoint analysis, United States, 1999–2020.
APC: annual percentage change; CI: confidence interval.
indicates a statistically significant APC, defined as P < 0.05.
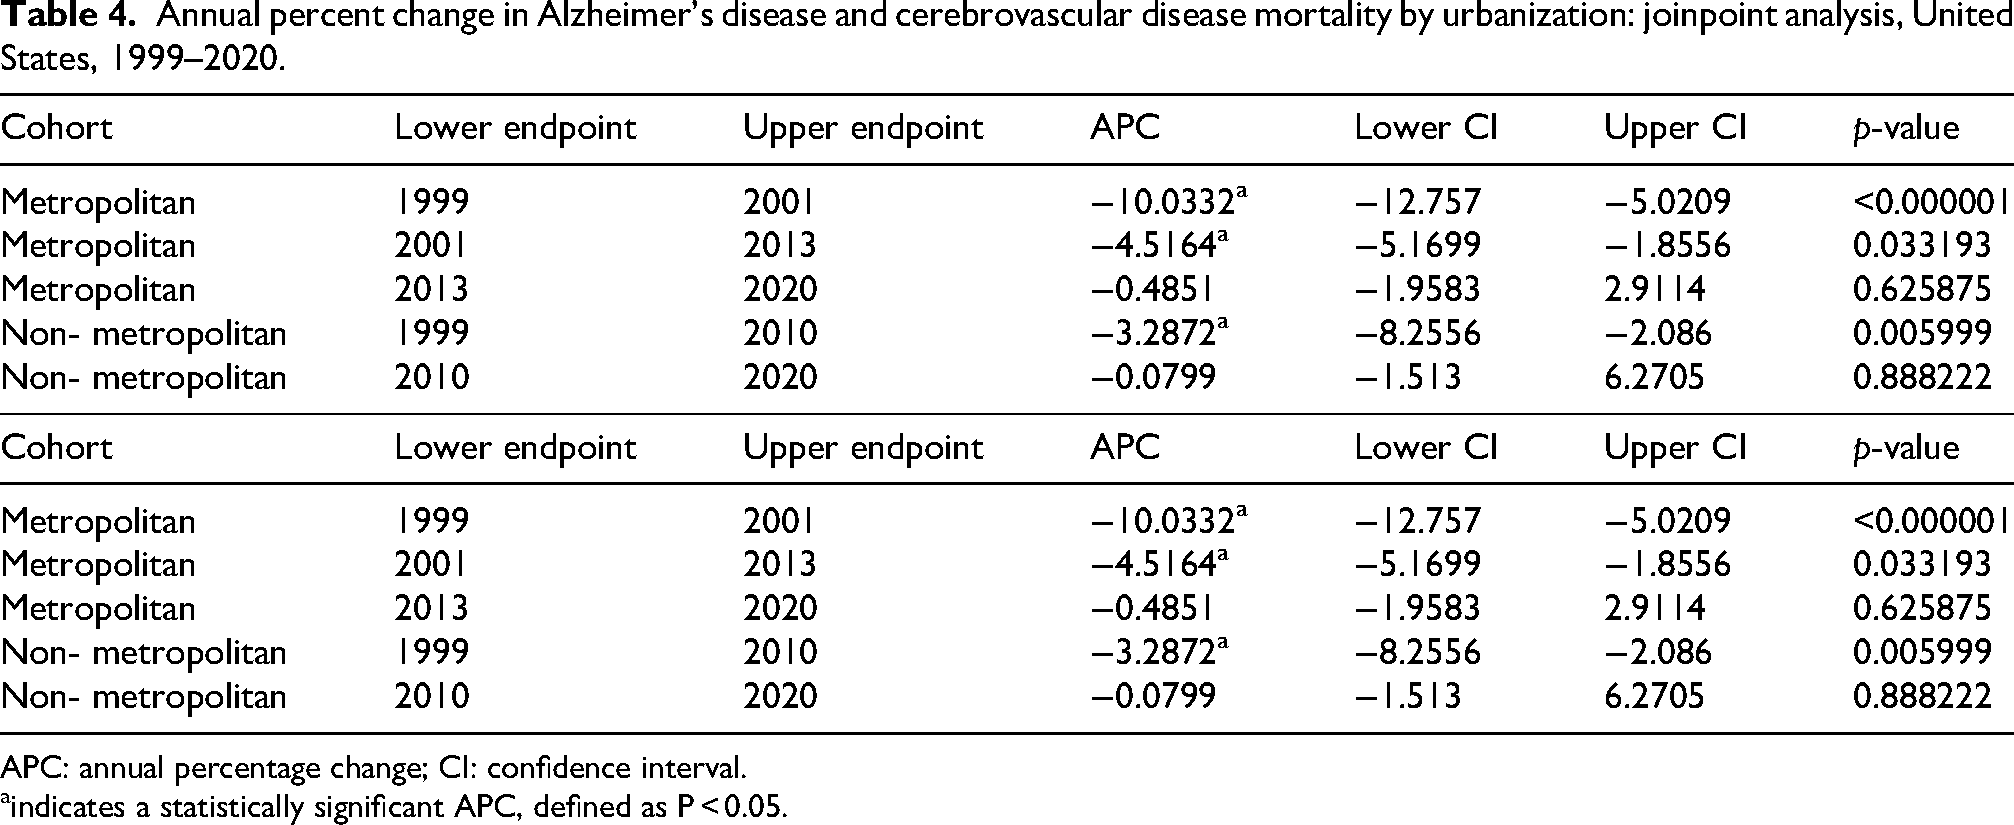
Trends in AD and CVD-related mortality by urbanization
Based on urbanization level, stark differences were observed. The AAMR decreased significantly in metropolitan areas (AAPC: −3.37, 95% CI: −4.06 to −3.30) compared with that in non-metropolitan areas (AAPC: −1.77, 95% CI: −2.44 to −1.08). The AAMR and APC trends throughout the study period are presented in Supplementary Table 5 and Table 4, respectively. The trend is graphically depicted in Figure 4.
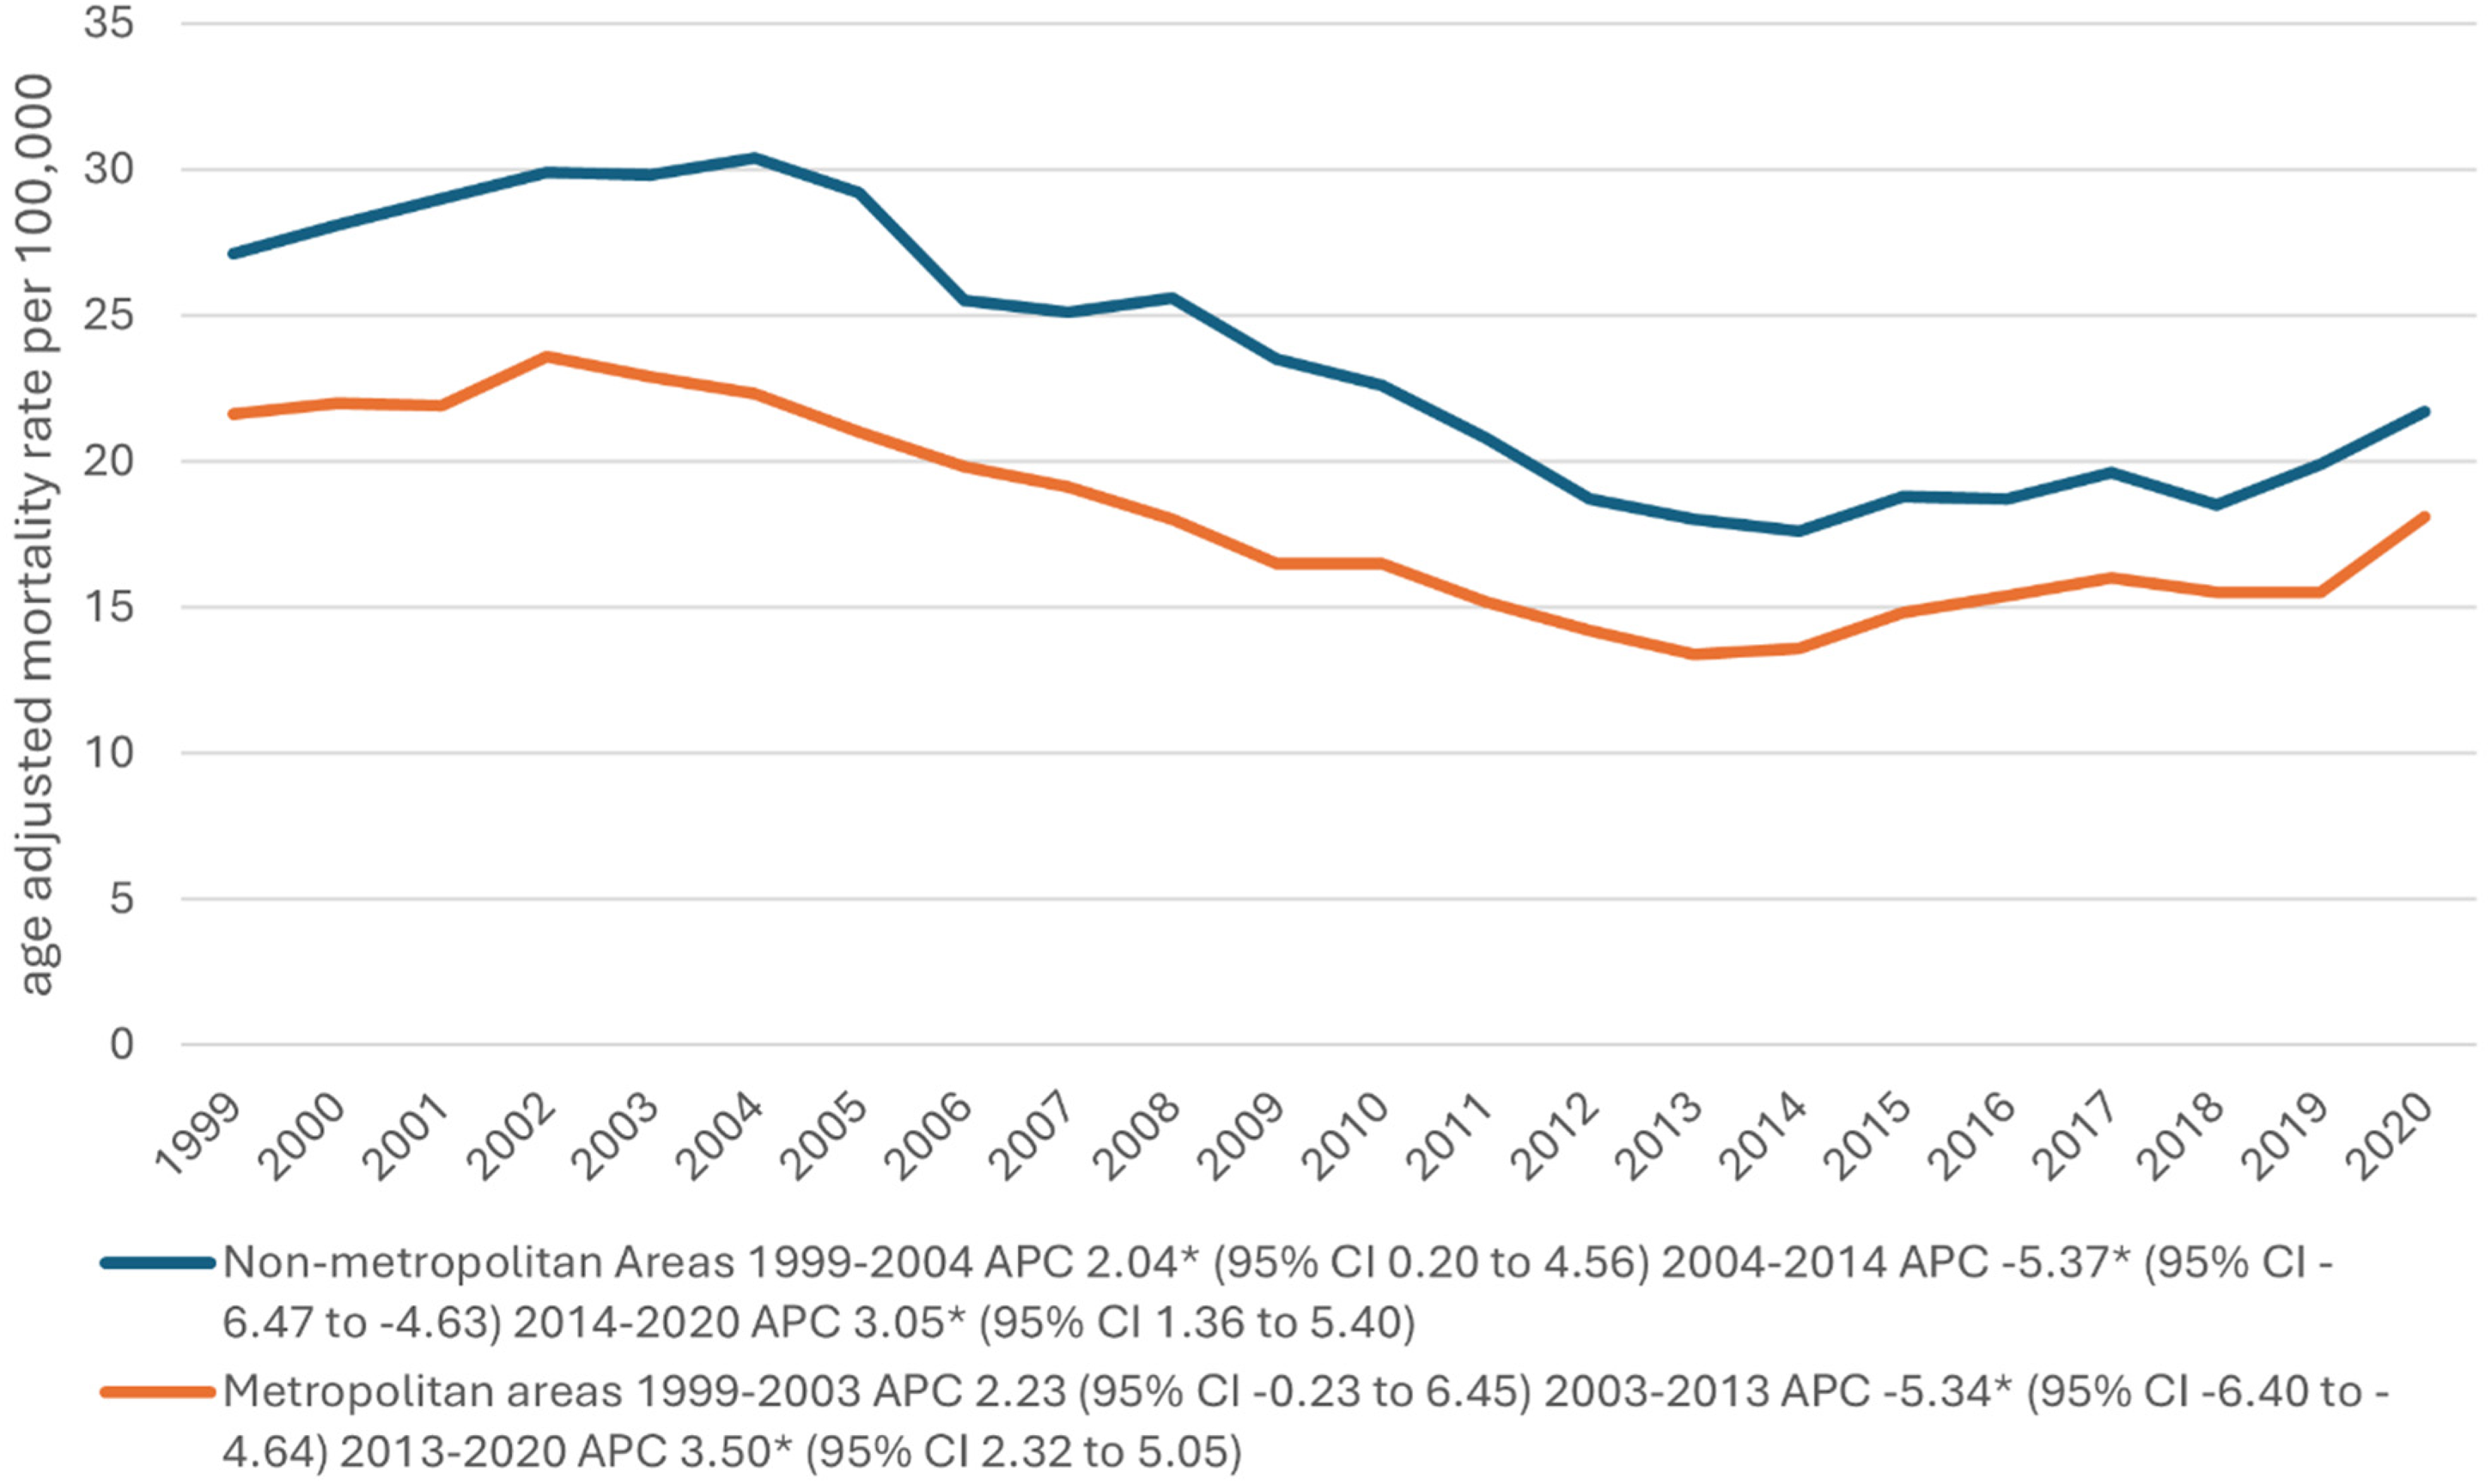
Alzheimer's disease and cerebrovascular disease-related age-adjusted mortality rates per 100,000 population, stratified by urbanization level, in older adults in the United States (1999–2020). aIndicates that the annual percentage change (APC) is significantly different from zero at α = 0.05. AAMR: age-adjusted mortality rate; APC: annual percentage change; CI: confidence interval.
Annual percent change in Alzheimer's disease and cerebrovascular disease mortality by urbanization: joinpoint analysis, United States, 1999–2020.
APC: annual percentage change; CI: confidence interval.
indicates a statistically significant APC, defined as P < 0.05.
Trends in AD and CVD-related mortality by states
During 1999–2020, California had the highest death count (23,680, AAMR: 23.7) followed by Texas (13,782, AAMR: 24.9). Furthermore, Mississippi had the highest AAMR of 30.9, with 2514 deaths. Among states with high death rates, New York had the lowest AAMR of 8.3. During 2021–2023, Oregon had the highest AAMR of 36.4, with 726 deaths, followed by Mississippi with an AAMR of 31.6, with 409 deaths. Connecticut had the lowest AAMR of 6.5 with 124 deaths. Oregon's AAMR rose sharply from 24.9 (1999–2020) to 36.4 (2021–2023), while Alabama's AAMR fell from 23.5 to 14.7 for these same time periods. (Supplementary Table 6). State-level results are presented separately for 1999–2020 and 2021–2023 due to differences in data availability and reporting structure within the CDC WONDER multiple-cause-of-death datasets.
Distribution by place of death
From 1999 to 2023, AD–CVD-related deaths increased across all recorded places of death, totaling 30,360 in medical facilities; 106,241 in nursing homes; 8386 in hospice facilities; and 41,937 at the decedent's home.
ARIMA modeling forecast
By the end of the forecast period, an overall increase in the AAMRs for AD and CVD is projected. Sensitivity analyses excluding the COVID-19 period showed similar trends, indicating that the pandemic did not substantially alter long-term patterns. Mortality remains higher among women than among men (Supplementary Figure 1).
Regional variations persist, with the lowest burden in the Northeast and highest in the West, with the Midwest and South exhibiting intermediate levels (Supplementary Figure 2).
Racial and ethnic disparities continue, with the highest burden among non-Hispanic Black individuals, followed by that among non-Hispanic White populations, and lower rates among Hispanic/Latino and Asian or Pacific Islander groups (Supplementary Figure 3).
Urban–rural differences remain evident, with higher mortality in non-metropolitan areas than in metropolitan areas (Supplementary Figure 4).
Discussion
In this nationwide study conducted on data from 1999 to 2023, which primarily focused on mortality rates related to AD and CVD, several key patterns emerged. The overall mortality rate declined considerably despite substantial fluctuations throughout the years. The most significant decline was observed between 2002 and 2013 across all demographic groups. Sex-specific patterns demonstrated that women had consistently higher mortality rates than men, with the male population exhibiting a much steeper decline in mortality rates between 2002 and 2013. The mortality rate reduction in women, although significant, was comparatively less drastic. Furthermore, there were notable racial and ethnic disparities; White Americans demonstrated the greatest overall decline in mortality rates, followed by Black and African Americans. In contrast, during 2020–2023, an increase in mortality rates was observed among Hispanic and Latino individuals. Regional disparities have also been observed. Although all regions demonstrated a sharp decline between 2002 and 2014, the South exhibited the greatest decline, followed by the Midwest and West, which showed similar trends, while the Northeast demonstrated the smallest decline. Both metropolitan and non-metropolitan areas demonstrated similar patterns; however, the decline from 2002 to 2014 was much steeper for non-metropolitan areas, with a more gradual increase during the following years. Overall, between 1999 and 2003, the AAMR increased significantly (APC: 2.63; 95% CI: 0.34 to 6.01), followed by a significant decline from 2003 to 2013 (APC: −5.37; 95% CI: −6.14 to −4.79), a significant increase from 2013 to 2021 (APC: 3.05; 95% CI: 2.36 to 4.56), and a significant decline from 2021 to 2023 (APC: −5.54; 95% CI: −8.96 to −1.14) (Supplementary Table 3). Overall, the AAMR demonstrated a significant declining trend over the study period (AAPC: −3.52, 95% CI: −3.81 to −3.13), indicating sustained improvements in AD–CVD-related mortality despite temporal fluctuations, particularly during the mid- and late-study periods.
These findings highlight the influence of demographic and geographic factors on AD and CVD and emphasize the persistent need for better targeted public health interventions.
The analysis revealed distinct sex-based trends in AD and CVD mortality. Both sexes exhibited consistent declines in mortality; however, women exhibited a slightly steeper overall reduction (AAPC: −3.50, 95% CI: −3.81 to −3.18) compared with men (AAPC: −3.04, 95% CI: −3.64 to −2.44), suggesting modest sex-based differences in long-term mortality trajectories. Women consistently exhibited higher mortality rates than men, owing to different biological, behavioral, genetic, and hormonal factors. Women are reported to have higher longevity than men, contributing to a higher likelihood of reaching an age at which the risk of developing AD is greater. 17 Furthermore, it has been noted that several hormones, such as estrogen, might play a role. 18 Estrogen has been proven to exert neuroprotective effects, 19 thereby initially preserving women's brain health. However, estrogen levels decline considerably after menopause, making women vulnerable to several conditions, including AD. Epidemiological studies have shown that cognitive function is enhanced in women with AD who are on estrogen replacement therapy. 18 Genetic factors, particularly the APOE gene, also play a crucial role. Recent studies have shown that the APOE gene, a known risk factor for AD, may be a more important risk factor for women than for men.20,21 Furthermore, complications that develop during normal physiological conditions such as pregnancy may also increase the risk of developing AD in later life among women, as indicated by the higher incidence of dementia and cognitive impairment reported in women with a history of pre-eclampsia during pregnancy.22,23 This increased dementia risk raises the likelihood of developing AD owing to the strong correlation between the two conditions. 24 These changes at the basic biological level make women more vulnerable to diseases such as AD and CVD than men, as is apparent from the trends observed in this study. For women, between 1999 and 2003, the AAMR increased significantly (APC: 2.94; 95% CI: 0.84 to 6.00), followed by a significant decline from 2003 to 2013 (APC: −5.25; 95% CI: −6.16 to −4.62), significant increase from 2013 to 2021 (APC: 2.92; 95% CI: 2.11 to 4.59), and non-significant decline from 2021 to 2023 (APC: −4.85; 95% CI: −8.04 to 0.14) (Supplementary Table 3).
Recent studies have also revealed sex-based differences in survival outcomes. Generally, men exhibit greater comorbidity and higher mortality, while women experience more disability and longer survival. 25 Survival curves have shown that women reach partial loss of autonomy faster than men. However, for men, between 1999 and 2003, the AAMR showed no significant change (APC: 2.02; 95% CI: −0.25 to 5.83), followed by a significant decline from 2003 to 2013 (APC: −5.46; 95% CI: −6.58 to −4.75), significant increase from 2013 to 2021 (APC: 3.18; 95% CI: 2.25 to 5.46), and significant decline from 2021 to 2023 (APC: −5.52; 95% CI: −9.82 to −0.004) (Supplementary Table 3).
Our CDC WONDER analysis revealed that both sexes showed a significant decline in mortality rates from 2002 to 2013, followed by a subsequent increase after 2013, possibly owing to advancements in healthcare that have increased the life expectancy, and consequently, the risk of developing AD.
Some clear racial disparities were noticed. White Americans were affected the most, followed by Black/African Americans, Hispanics/Latinos, and Asian/Pacific Islanders; these findings are in agreement with previous studies that have yielded similar results. Substantial heterogeneity was observed across racial groups. The most pronounced decline in mortality rate was observed among non-Hispanic Black individuals (AAPC: −5.33), followed by that among Asian/Pacific Islanders (AAPC: −3.55) and Hispanic/Latino individuals (AAPC: −3.06). Non-Hispanic White individuals demonstrated the least decline (AAPC: −2.75). These findings highlight persistent disparities despite overall improvements. A decline in mortality was observed between 2003 and 2013 among all of these racial groups, with the greatest overall decline observed in White Americans, owing to better health awareness regarding brain health, benefits of cognitive engagement, and dementia risk factors. 26 Among individuals of White ethnicity, between 1999 and 2003, the AAMR increased significantly (APC: 2.28; 95% CI: 0.03 to 5.69), followed by a significant decline from 2003 to 2013 (APC: −5.52; 95% CI: −6.39 to −4.88), significant increase from 2013 to 2021 (APC: 3.23; 95% CI: 2.52 to 4.91), and significant decline from 2021 to 2023 (APC: −5.08; 95% CI: −8.73 to −0.58) (Supplementary Table 3).
Smoking rate, a significant risk factor for AD, 27 also reduced during this period in the United States. Following 2013, the highest increment was observed among Black/African Americans owing to socioeconomic disparities in healthcare access, leaving certain groups more vulnerable than others.27,28 Between 1999 and 2003, the AAMR increased significantly (APC: 7.30; 95% CI: 2.33 to 17.72), followed by a significant decline from 2003 to 2014 (APC: −4.80; 95% CI: −7.66 to −3.51), significant increase from 2014 to 2021 (APC: 4.16; 95% CI: 1.45 to 12.10), and significant decline from 2021 to 2023 (APC: −9.24; 95% CI: −16.88 to −0.07) (Supplementary Table 3).
Furthermore, between 1999 and 2011, the AAMR showed no significant change (APC: 0.90; 95% CI: −0.15 to 4.13), followed by a significant decline from 2011 to 2014 (APC: −8.03; 95% CI: −10.88 to −1.68) and significant increase from 2014 to 2023 (APC: 2.14; 95% CI: 0.92 to 5.78) (Supplementary Table 3) among Asian or Pacific Islander individuals.
The increased availability of neuroimaging techniques such as magnetic resonance imaging and positron emission tomography, along with biomarker testing for beta-amyloid and tau may also have improved case detection rates and led to increased diagnoses of AD, contributing to the subsequent rise observed after 2013.
Regional disparities in AD incidence and mortality exist across the United States, with the Southern region showing the highest rates. Significant trends included an increase from 1999 to 2003 (APC: 4.23; 95% CI: 0.36 to 11.17), decline from 2003 to 2013 (APC: −6.18; 95% CI: −7.96 to −5.24), increase from 2013 to 2021 (APC: 3.68; 95% CI: 2.57 to 6.87), and decline from 2021 to 2023 (APC: −7.78; 95% CI: −13.95 to −1.06). Moreover, all census regions demonstrated declining mortality trends, with the Northeast showing the greatest reduction (AAPC: −3.93), followed by the South (−3.77) and Midwest (−3.06); the West exhibited the smallest decline (−2.53). This pattern suggests regional variation in the pace of improvement in AD–CVD outcomes. This is due to socioeconomic disparities, lower healthcare coverage, higher obesity rates, and a rapidly aging population with a declining birth rate. 29 The other regions follow the same national trend with similar fluctuation throughout the years, with the least mortality rate observed in the Northeast regions, owing to their better healthcare screening and diagnostic systems that make it easier to not only diagnose the disease earlier but also slow its progression. The Northeast also demonstrates higher utilization of nursing homes with better trained staff, which may substantially lower the risk of death due to fatal complications associated with AD such as dysphagia, pressure sores, and urinary tract infections (UTIs), as demonstrated by the significant decline in their AAMRs from 2002 to 2013 (APC: −5.97; 95% CI: −10.31 to −4.94).
Urban–rural disparities persisted, with metropolitan areas experiencing a more pronounced decline in mortality rates (AAPC: −3.37) compared with non-metropolitan areas (AAPC: −1.77), indicating slower progress and sustained burden in rural populations.
Non-metropolitan areas demonstrated consistently higher AAMRs than metropolitan areas, with peak rates observed in 2004 (30.4). This trend can be easily explained through the evident disparities between the two populations in terms of socioeconomic characteristics, limited access to specialized care and early diagnosis, fewer caregiving resources and support systems, and higher prevalence of risk factors. 30 Significant trends included an increase from 1999 to 2004 (APC: 2.04; 95% CI: 0.20 to 4.56), decline from 2004 to 2014 (APC: −5.37; 95% CI: −6.47 to −4.63), and increase from 2014 to 2020 (APC: 3.05; 95% CI: 1.36 to 5.40). For metropolitan areas, significant trends included a decline from 2003 to 2013 (APC: −5.34; 95% CI: −6.40 to −4.64) and increase from 2013 to 2020 (APC: 3.50; 95% CI: 2.32 to 5.05). (Supplementary Table 3).
This pattern further serves to highlight the differences in the quality of healthcare being offered in these regions.
A notable trend was observed in terms of place of death among patients with AD and CVD, with most deaths between 1999 and 2023 occurring in nursing homes (106,241), followed by the decedent's home (41,937), medical facilities (30,360), and hospice facilities (8386). Although a significant decline was observed in the deaths occurring in nursing homes and medical facilities, an increment was noted in deaths occurring in decedents’ home and hospice facilities, likely reflecting the recent preference reported for palliative and home-based care as opposed to aggressive treatment plans, with more emphasis on comfort-focused care. 31
Limitations
This study has certain important limitations. First, our analyses relied on death certificate data from the CDC WONDER database, which are subject to misclassification, underreporting, and variation in coding practices across regions and over time. The identification of AD and CVD as underlying or contributing causes of death may differ between certifying physicians and institutions, potentially introducing systematic bias in both absolute mortality estimates and observed temporal trends.
Second, the study population was restricted to individuals aged ≥65 years, which introduces left-truncation and potential survivor bias. Individuals who died before the age of 65 years were not captured, which may have led to an underestimation of variability and influenced temporal trend estimation, particularly in time-series modeling approaches.
Third, the database does not include key individual-level clinical and socioeconomic variables, including educational level, vascular risk factor burden, comorbidities, medication use, and access to care. The absence of these variables limits the ability to adjust for major confounders and introduces the possibility of residual confounding and model misspecification.
Fourth, our analytical approach required that both AD and CVD be recorded on the death certificate, which may have led to an underestimation of the true burden of disease where either condition is underdiagnosed or incompletely documented. Additionally, changes over time in diagnostic awareness, coding practices, and availability of neuroimaging and supportive care services may partially explain observed temporal patterns and cannot be fully disentangled from true changes in disease burden.
Fifth, the COVID-19 pandemic represents a major external disruption that may have influenced mortality patterns through indirect mechanisms such as healthcare system strain, delayed care, and competing risks. Although sensitivity analyses excluding the COVID-19 period demonstrated consistent overall trends, residual effects of this period cannot be entirely excluded.
Finally, the forecasting component using ARIMA models should be interpreted with caution. These models assume that historical patterns remain stable over time and do not account for structural changes, unmeasured confounding, and future public health interventions. Given the limitations in data quality, potential biases, and absence of key covariates, the projections presented are exploratory and hypothesis-generating rather than predictive.
Conclusions
In this nationwide analysis spanning 1999–2023, AD and CVD-related mortality in United States adults aged ≥65 years showed an initial rise, pronounced decline through the early 2010s, and subsequent resurgence by 2020, with only partial attenuation subsequently. The burden of death where AD and CVD are jointly implicated remains substantial and unevenly distributed, with persistently higher rates among women, non-Hispanic Black and White individuals, residents of the South and West, and those living in non-metropolitan areas.
Exploratory projections suggest that despite earlier gains, AD and CVD mortality will not return to their prior nadir and will continue to impose a stable or modestly rising burden over the next decade.
These findings underscore the need for integrated strategies that combine vascular risk factor control with dementia prevention and care initiatives. Outreach to rural communities and racially and ethnically minoritized populations should be prioritized. Equitable access to diagnostic services, stroke care, long-term care, and hospice should be ensured.
Supplemental Material
sj-docx-1-imr-10.1177_03000605261454837 - Supplemental material for Nationwide trends and forecasts in Alzheimer's and cerebrovascular disease-related mortality in the United States, 1999–2023: A CDC WONDER analysis
Supplemental material, sj-docx-1-imr-10.1177_03000605261454837 for Nationwide trends and forecasts in Alzheimer's and cerebrovascular disease-related mortality in the United States, 1999–2023: A CDC WONDER analysis by Ali Shan Hafeez, Saira Mumtaz, Laksh Kumar, Mubashara Amir, Rick Maity, Saad Ashraf, Aamir Khan, Muhammad Hassan, Asad Zaman, Muhammad Asad, Pramod Singh, Abdul Rafae Faisal and Arkadeep Dhali in Journal of International Medical Research
Footnotes
ORCID iDs
Ethical considerations
This study utilized publicly available, de-identified mortality data from the Centers for Disease Control and Prevention Wide-ranging Online Data for Epidemiologic Research (CDC WONDER) database. As the data are aggregated and contain no personal identifiers, this study is exempt from Institutional Review Board (IRB) approval.
Author contributions
Ali Shan Hafeez: Conceptualization, Data Curation, Formal Analysis, Methodology; Saira Mumtaz: Data Curation, Investigation; Laksh Kumar: Methodology, Software; Mubashara Amir: Investigation, Resources; Rick Maity: Supervision, Writing-Reviewing & Editing; Saad Ashraf: Methodology, Software; Aamir Khan: Visualization; Muhammad Hassan: Data Curation; Asad Zaman: Writing-Original draft; Muhammad Asad: Formal Analysis; Pramod Singh: Methodology, Software; Abdul Rafae Faisal: Supervision, Project Administration; Arkadeep Dhali: Supervision, Writing-Reviewing & Editing.
Funding
The authors received no financial support for the research, authorship, and/or publication of this article.
Declaration of conflicting interests
The authors declared no potential conflicts of interest with respect to the research, authorship, and/or publication of this article.
Data availability statement
Supplemental material
Supplemental material for this article is available online.
References
Supplementary Material
Please find the following supplemental material available below.
For Open Access articles published under a Creative Commons License, all supplemental material carries the same license as the article it is associated with.
For non-Open Access articles published, all supplemental material carries a non-exclusive license, and permission requests for re-use of supplemental material or any part of supplemental material shall be sent directly to the copyright owner as specified in the copyright notice associated with the article.