
Abstract
The Environmental Kuznets Curve (EKC) provides a theoretical framework for exploring the evolution of human–nature relationships. However, existing EKC-based studies often oversimplify human systems and natural systems, and few studies have conducted a multidimensional analysis of EKC characteristics. To address these limitations, this study conceptualizes the human–nature relationship as the interaction between human activity intensity and environmental quality, quantified using the Human Activity Index (HAI) and the Ecological Quality Index (EQI), respectively. Using panel data from 368 Chinese cities during 2000–2020, we construct composite indicators to characterize the multidimensional states of human and natural systems and apply the EKC framework to analyze their coupled dynamics. Building on the conventional EKC model, we further develop a set of EKC characteristic metrics to systematically describe transition timing, HAI–EQI interactions at the turning point, and dynamic patterns before and after the turning point. Cities exhibiting EKC-type relationships are subsequently classified into distinct human–nature transition pathways, and key driving factors and their heterogeneous effects are examined. The results show that although HAI and EQI increased in most cities, only 147 cities exhibited clear EKC-type trajectories, which can be further grouped into five distinct clusters based on EKC characteristics. Urban expansion, slope, greenspace, forest resilience, and elevation emerged as dominant drivers with heterogeneous influences on EKC dynamics. By extending EKC analysis from simplified indicators to a multidimensional and process-oriented framework, this study advances EKC interpretation beyond pattern identification and provides policy-relevant insights for differentiated urban sustainability strategies and coordinated environmental governance in China.
Keywords
Introduction
Since the Anthropocene, the impact and pressure of human systems on natural systems have intensified (Steffen et al., 2011; Waters et al., 2016). Studies indicate that 75% of the planet’s land surface is experiencing measurable human pressures (Venter et al., 2016). Environmental thresholds for biosphere integrity, climate change, land system changes, and biogeochemical cycles are approaching or have been exceeded (Chen et al., 2024; Rockström et al., 2023). Due to the diversity of human activities and the complexity of internal coordination mechanisms, the impact of human systems on natural systems varies significantly (Liu et al., 2007). For example, different types of production and livelihood activities, such as agriculture and livestock, mineral extraction, and transportation, have caused problems including vegetation destruction (Kelly and Ray, 2023; Sun et al., 2024), biodiversity decline (He et al., 2022; Secco et al., 2022), and ecosystem degradation (Kang et al., 2021; Liu et al., 2025). Meanwhile, cooperation among different groups and regions has the potential to promote scientific decision-making and systematic governance, thereby reducing human interference with nature (Arnold et al., 2022; Zhang et al., 2024). In the context of ongoing global change, global research projects, including the World Climate Research Programme, the International Geosphere-Biosphere Programme, the International Programme of Biodiversity Science, and the Earth System Science Partnership, have focused on exploring the human–nature relationship. These projects seek to promote rational decision-making through scientific research, enhance the efficiency and effectiveness of economic, social, and environmental governance, and contribute to the sustainable development of human and natural systems (Reid et al., 2010).
The human–nature relationship refers to the interactions between human systems, their diverse activities, and natural systems (Lu, 2002; Wu, 1991). Scholars in earth system science and sustainability science have proposed a range of analytical frameworks to conceptualize this relationship, including planetary boundary theory (Steffen et al., 2015), social–ecological system theory (Ostrom, 2009), metacoupling theory (Liu, 2017), and Environmental Kuznets curve (EKC) theory (Dinda, 2004). Among these, the EKC framework offers a dynamic perspective for quantifying how human activities and environmental conditions co-evolve over time. It suggests that environmental degradation initially intensifies with development and subsequently declines as economic growth enables technological progress and stronger environmental regulation.
Despite its widespread application, most EKC studies have relied on a simplified analytical paradigm in which both human activities and environmental conditions are represented by single-dimensional indicators. On the human side, complex human activity systems are typically approximated using proxy variables such as economic output (Ansari, 2022; Bimonte and Stabile, 2024), industrial value added (Aminu et al., 2023; Wang et al., 2017), land-use change (Wang et al., 2021), and nighttime light (Ngarambe et al., 2018; Zheng et al., 2024). Concurrently, natural system conditions are often characterized using single-dimensional indicators, such as pollutant concentrations or ecological measures targeting specific environmental elements (e.g., atmosphere, soil, vegetation, or water bodies) (Ansari, 2022; Cherodian and Fraser, 2024; Durmaz and Thompson, 2024; Zhang et al., 2022). While this framework has been effective in identifying broad empirical regularities, it inherently simplifies the human–nature relationship and constrains the ability of EKC analyses to reveal intrinsic nonlinear interactions between multifaceted human activities and multifunctional natural systems.
With growing demand for refined and place-based sustainability governance, EKC analyses have increasingly been conducted at subnational levels, including provincial (Li et al., 2020; Shahbaz et al., 2020) and city levels (He et al., 2021; Wu et al., 2025). Compared with national or provincial analyses, the city level provides a more suitable unit for identifying spatial heterogeneity, policy responsiveness, and differentiated transition pathways. However, existing city-level EKC studies still face two major challenges. First, despite progress in constructing comprehensive environmental quality indices using multi-source data, human activity systems are often represented by a single dimension (e.g., urbanization rate) (Sha et al., 2025), resulting in an incomplete depiction of human pressures on natural systems. Second, EKC analyses at the city level primarily focus on identifying the presence or absence of an inverted-U pattern, whereas systematic metrics for characterizing transition timing, turning-point conditions, and pre- and post-transition dynamics remain underdeveloped. Moreover, the driving mechanisms underlying heterogeneity in EKC characteristics have received limited empirical attention.
China has a large population and substantial resource demand, yet per capita resource availability remains limited. Harmony between humans and nature in China—a country with 1.4 billion people, accounting for 17% of the global population—plays a critical role in global sustainable development. Amid rapid economic development and accelerating urbanization, China has simultaneously implemented ecological governance measures, including ecological protection red lines, nature reserves, and ecological restoration programs. Existing studies indicate that the human–nature relationship in China is improving, with trends suggesting increasing harmony (Liu et al., 2023; Yang et al., 2024). Given pronounced spatial heterogeneity in natural, economic, and social conditions across China, understanding the evolution of the human–nature relationship at the city level remains a critical challenge. Accordingly, using 368 Chinese cities as the study area, this study aims to (1) construct comprehensive indicators for assessing human and natural systems; (2) identify human–nature relationship evolution pathways based on the EKC model and its characteristic metrics; and (3) identify key driving factors and spatial heterogeneity in EKC characteristics. By elucidating human–nature relationships to inform local governance in China, this study provides replicable indicators and metrics that can serve as a global reference for sustainable development.
Materials and methods
Study area and data sources
Considering data integrity and the need to achieve broad geographic coverage, we selected 368 cities as our sample. These cities include 336 administrative units at the prefectural level and above, as well as 32 county-level administrative units under the direct jurisdiction of provinces. They do not overlap spatially and are not administratively subordinate to each other (Figure 1). Overview map of the study area.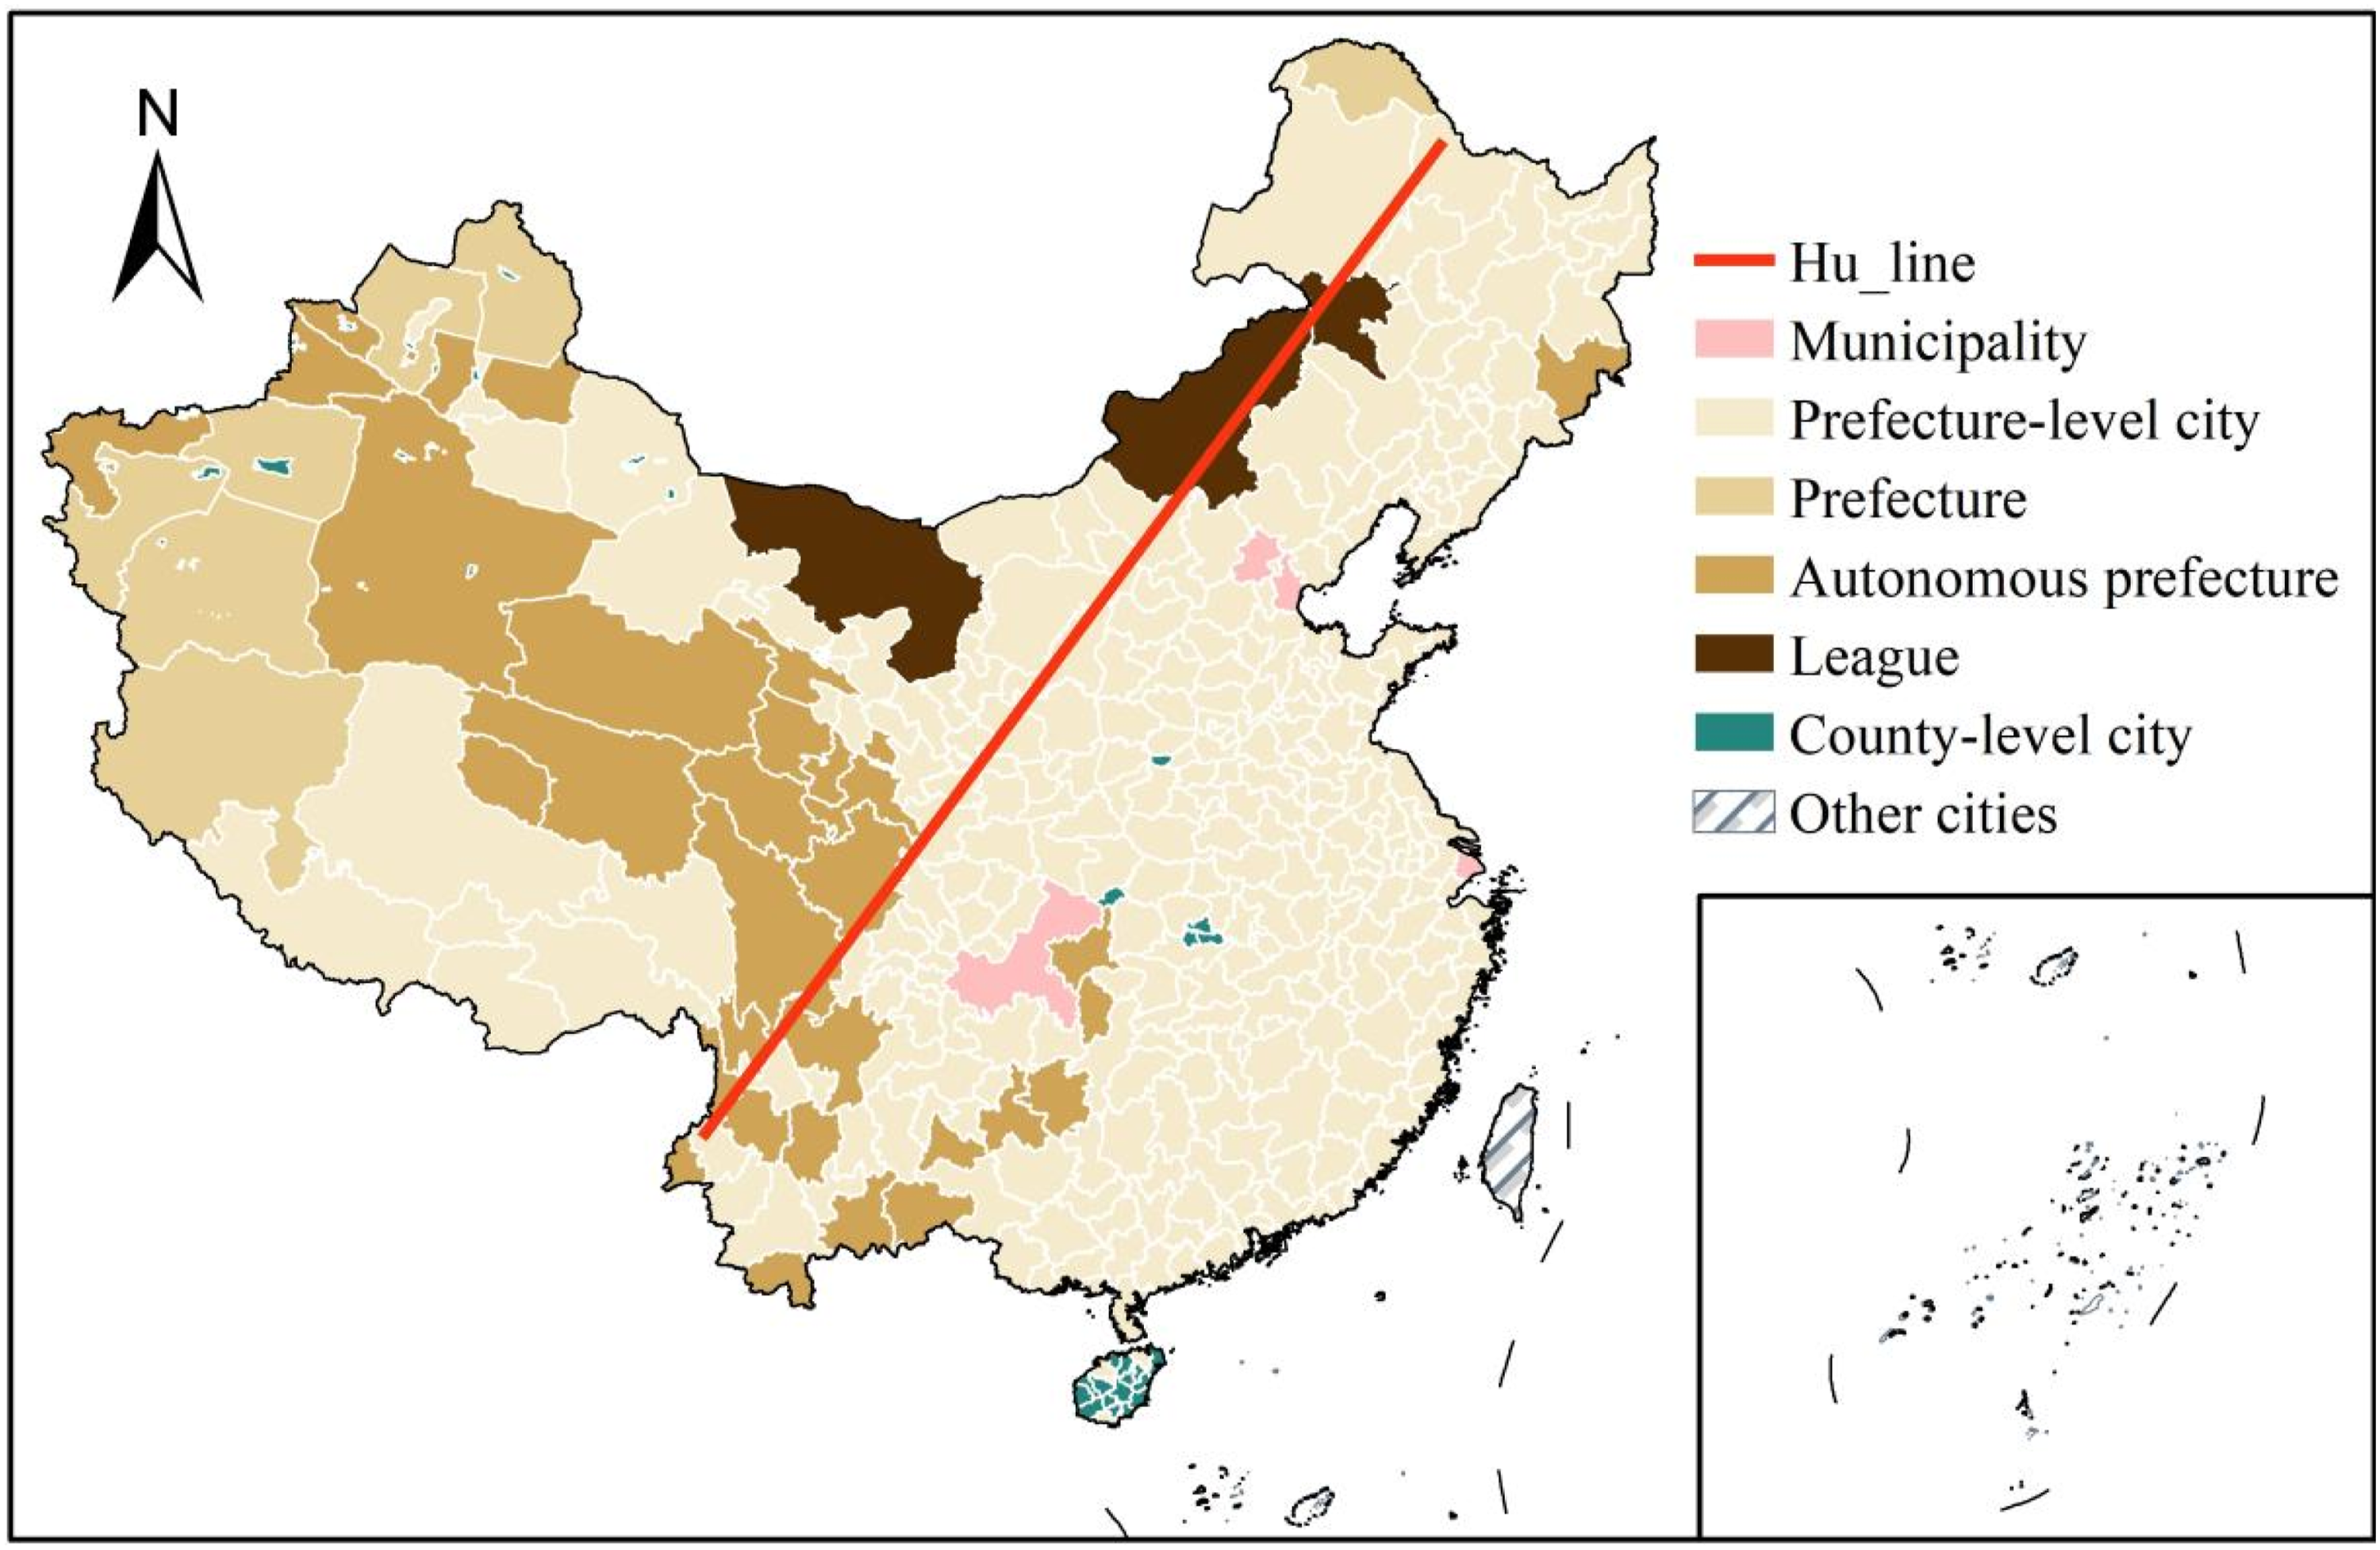
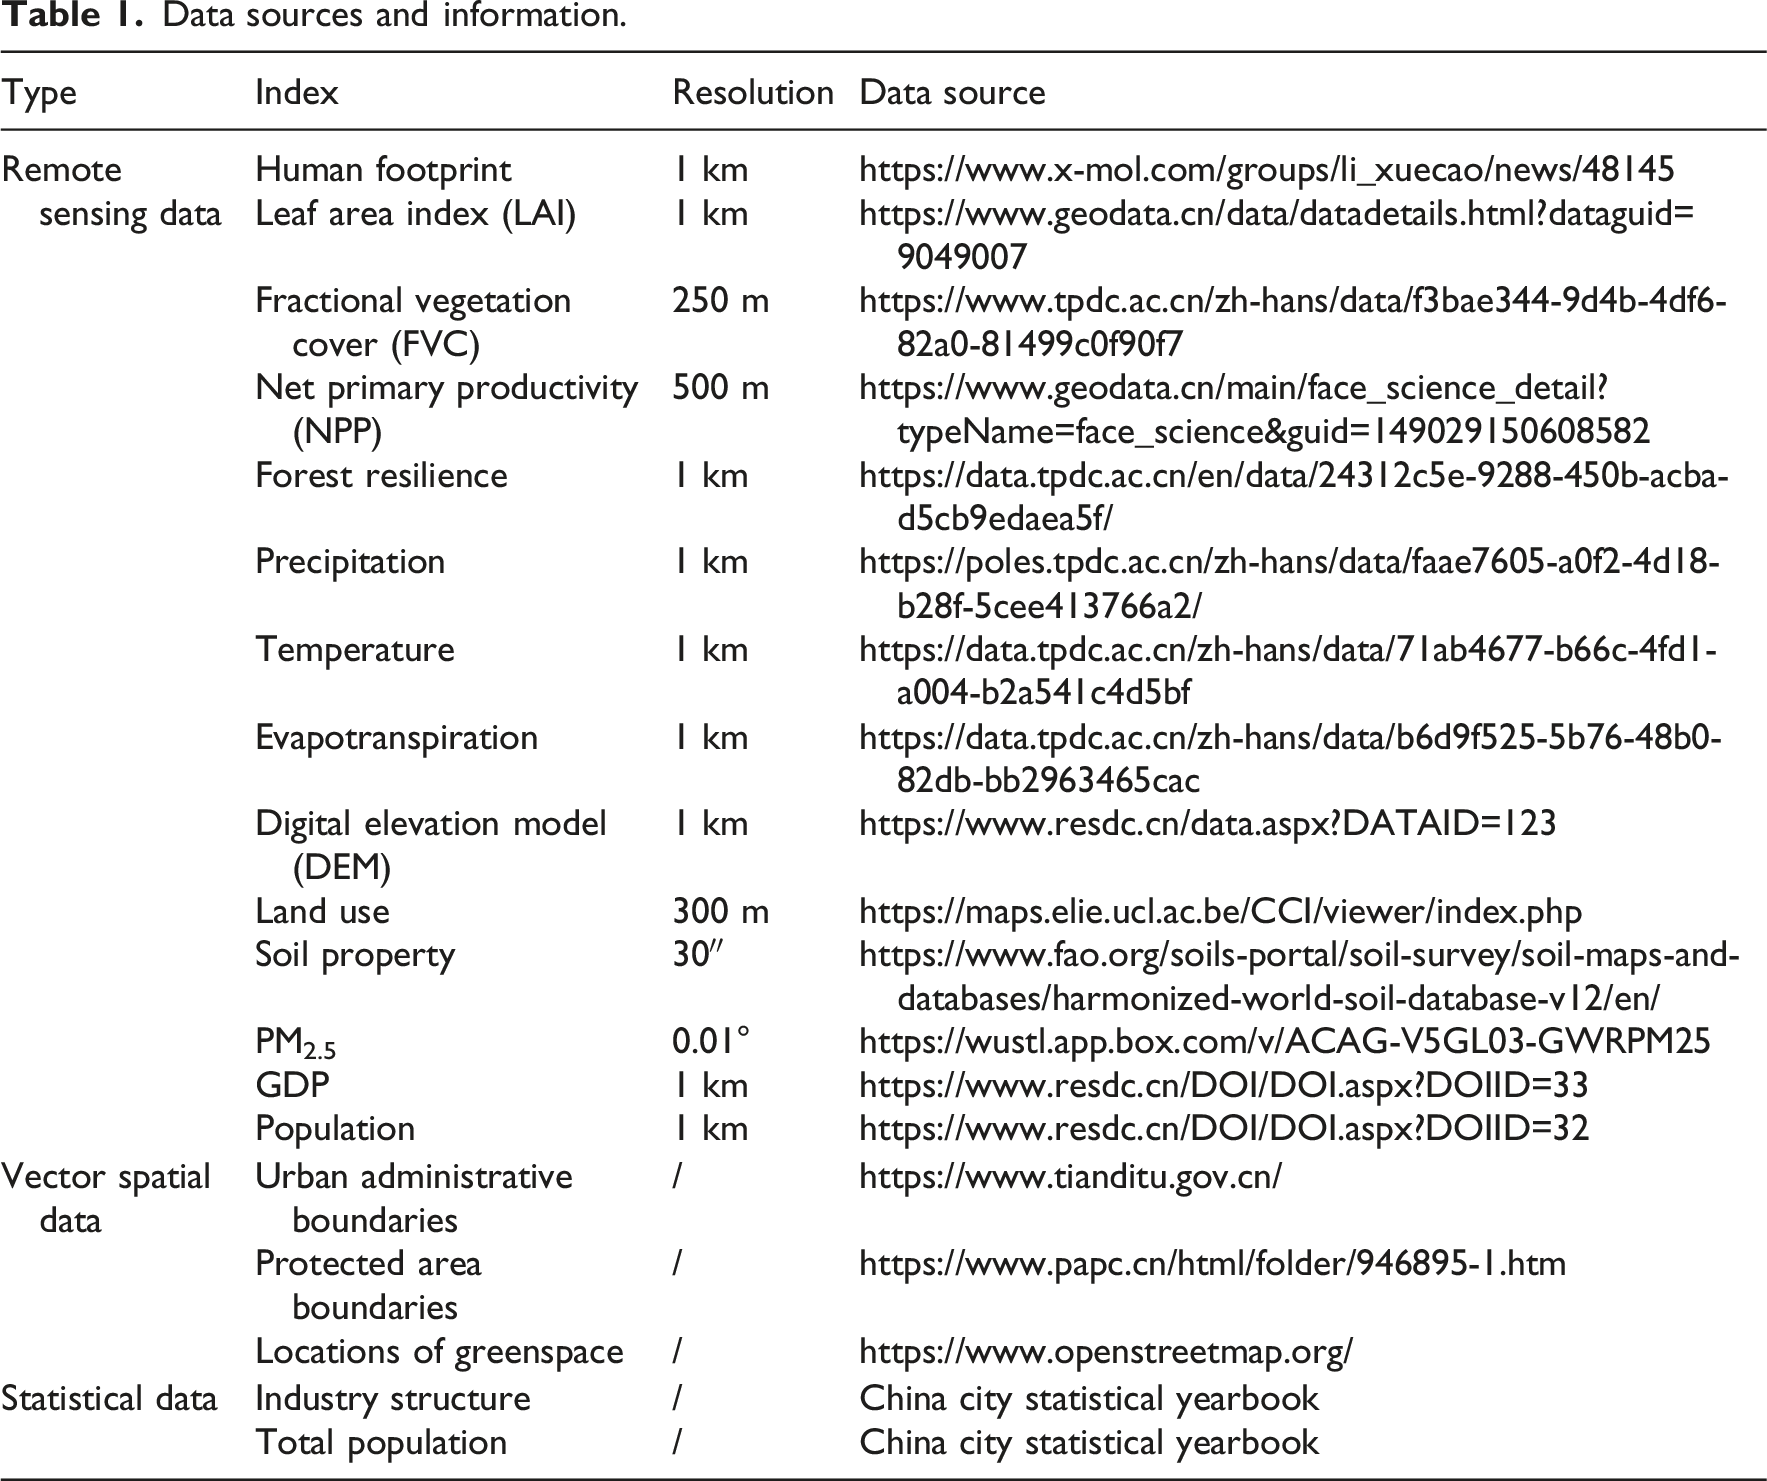
Data sources and information.
Assessment of the human and natural systems status
Human system status assessment using the Human Activity Index (HAI)
The human footprint dataset is a globally consistent and widely validated composite product for characterizing the intensity of human activities. It integrates eight components: built environment, population density, nighttime light intensity, croplands, pastures, roads, railways, and navigable waterways. Each component was preprocessed using standardized procedures, including geometric correction, cross-sensor calibration, and saturation adjustment. The dataset provides annual layers from 2000 to 2020, ensuring temporal consistency with the study period. Compared with conventional single proxies such as GDP or land-use indicators, this composite dataset provides a more comprehensive representation of the diversity and intensity of anthropogenic pressures. In this study, HAI was quantified using annual human footprint data. City-level mean values were extracted from gridded layers using the Zonal Statistics function in ArcGIS 10.3. HAI ranges from 0 to 50, where higher values indicate stronger overall anthropogenic activity intensity and lower values reflect weaker human influence. Importantly, HAI represents the relative intensity of human activities across space and time rather than absolute physical quantities.
Natural system status assessment using the Environmental Quality Index (EQI)
To assess natural system status from 2000 to 2020, we constructed an EQI. The EQI framework was developed in accordance with technical standards for ecosystem assessment issued by the Ministry of Ecology and Environment of China and relevant studies (Liu et al., 2023; Qian et al., 2023). It comprises three components: vegetation status, ecological functions, and air quality. Vegetation status was characterized using LAI, FVC, and NPP, reflecting vegetation greenness, structure, and productivity. Air quality was represented by PM2.5 concentration. These indicators were derived from existing annual gridded remote-sensing and reanalysis products that have been widely used and validated in previous studies, providing consistent temporal coverage from 2000 to 2020. Ecological functions were represented by two regulating ecosystem services: water yield and soil retention, estimated using the Water Yield and Sediment Delivery Ratio modules of the InVEST model. Detailed descriptions of modeling procedures, input data, and parameter settings are provided in the Supplemental Materials. All indicators were normalized to a standardized scale ranging from 0 to 100. PM2.5 concentration was treated as a negative indicator, and all others as positive indicators. EQI was calculated as the equally weighted mean of standardized indicators and subsequently aggregated from grid level to city level. Higher EQI values indicate better environmental quality, whereas lower values indicate poorer environmental conditions.
Trend analysis of HAI and EQI
This study employed the Theil-Sen and Mann-Kendall methods to analyze the changes in HAI and EQI at both raster and city levels. In the Theil-Sen method, α denotes the change slope. If α > 0, it indicates an upward trend in the HAI or EQI during the period; if α < 0, it indicates a downward trend (Sen, 1968). Mann-Kendall is a nonparametric method that is suitable for non-normally distributed data and has reduced sensitivity to outliers (Kendall, 1948).
EKC identification and extraction of characteristic metrics
The EKC describes the relationship between development intensity and environmental outcomes, typically exhibiting an inverted U-shape between economic growth and environmental degradation. Unlike the classical EKC, which describes an inverted U-shaped relationship between economic growth and environmental degradation, this study conceptualizes the human–nature relationship as a U-shaped relationship between HAI and EQI. This difference primarily arises from indicator selection. While traditional EKC studies employ environmental degradation indicators, this study uses an environmental quality index in which higher values represent better ecological conditions. Therefore, a U-shaped HAI–EQI relationship is conceptually consistent with the inverted U-shaped EKC when expressed in terms of environmental pressure.
This hypothesized U-shaped pattern reflects a stage-based evolutionary process of human–nature interactions. In the early stage of urban development, rapid increases in HAI—driven by urbanization, industrialization, and land conversion—tend to intensify pressures on ecosystems, leading to a decline in environmental quality. As development proceeds, structural transformation, technological progress, and the gradual strengthening of environmental governance may create conditions for a turning point. Beyond this threshold, further increases in HAI become increasingly decoupled from ecological degradation, as improvements in land-use efficiency, green infrastructure provision, and ecological restoration enable environmental quality to recover. This three-stage process—conflict intensification, transition, and coordinated development—provides the theoretical basis for expecting a U-shaped HAI–EQI relationship.
Based on this conceptualization, the human–nature relationship was quantified as the functional relationship between HAI and EQI at the city level. As EKC analysis focuses on the functional form and direction of relationships rather than absolute magnitudes, linear and quadratic regression models were employed to identify EKC-type dynamics. Accordingly, we fitted both linear and quadratic models between EQI and HAI for each city and used the coefficient of determination (R2) to evaluate model performance. This approach aligns with common practice in EKC studies using heterogeneous indicators (Sha et al., 2025). To identify EKC-type relationships, a threshold of R2 > 0.5 for the quadratic model was adopted. Rather than representing a strict cutoff, this threshold reflects a balance between inclusiveness and reliability in identifying meaningful U-shaped patterns. Sensitivity analysis across a wide range of thresholds (0.1–0.9) shows that the number of cities identified as exhibiting EKC-type relationships decreases systematically as the threshold increases. This pattern suggests that the strength of EKC relationships varies along a continuum, with lower thresholds capturing weaker or noisier relationships and higher thresholds isolating only strongly defined U-shaped patterns. In this context, selecting R2 > 0.5 allows for the identification of cities with moderately strong and interpretable EKC relationships, while avoiding the inclusion of spurious patterns associated with very low thresholds and the overly restrictive selection associated with very high thresholds. Therefore, this threshold provides a reasonable balance for analyzing the evolution of human–nature relationships in complex urban systems.
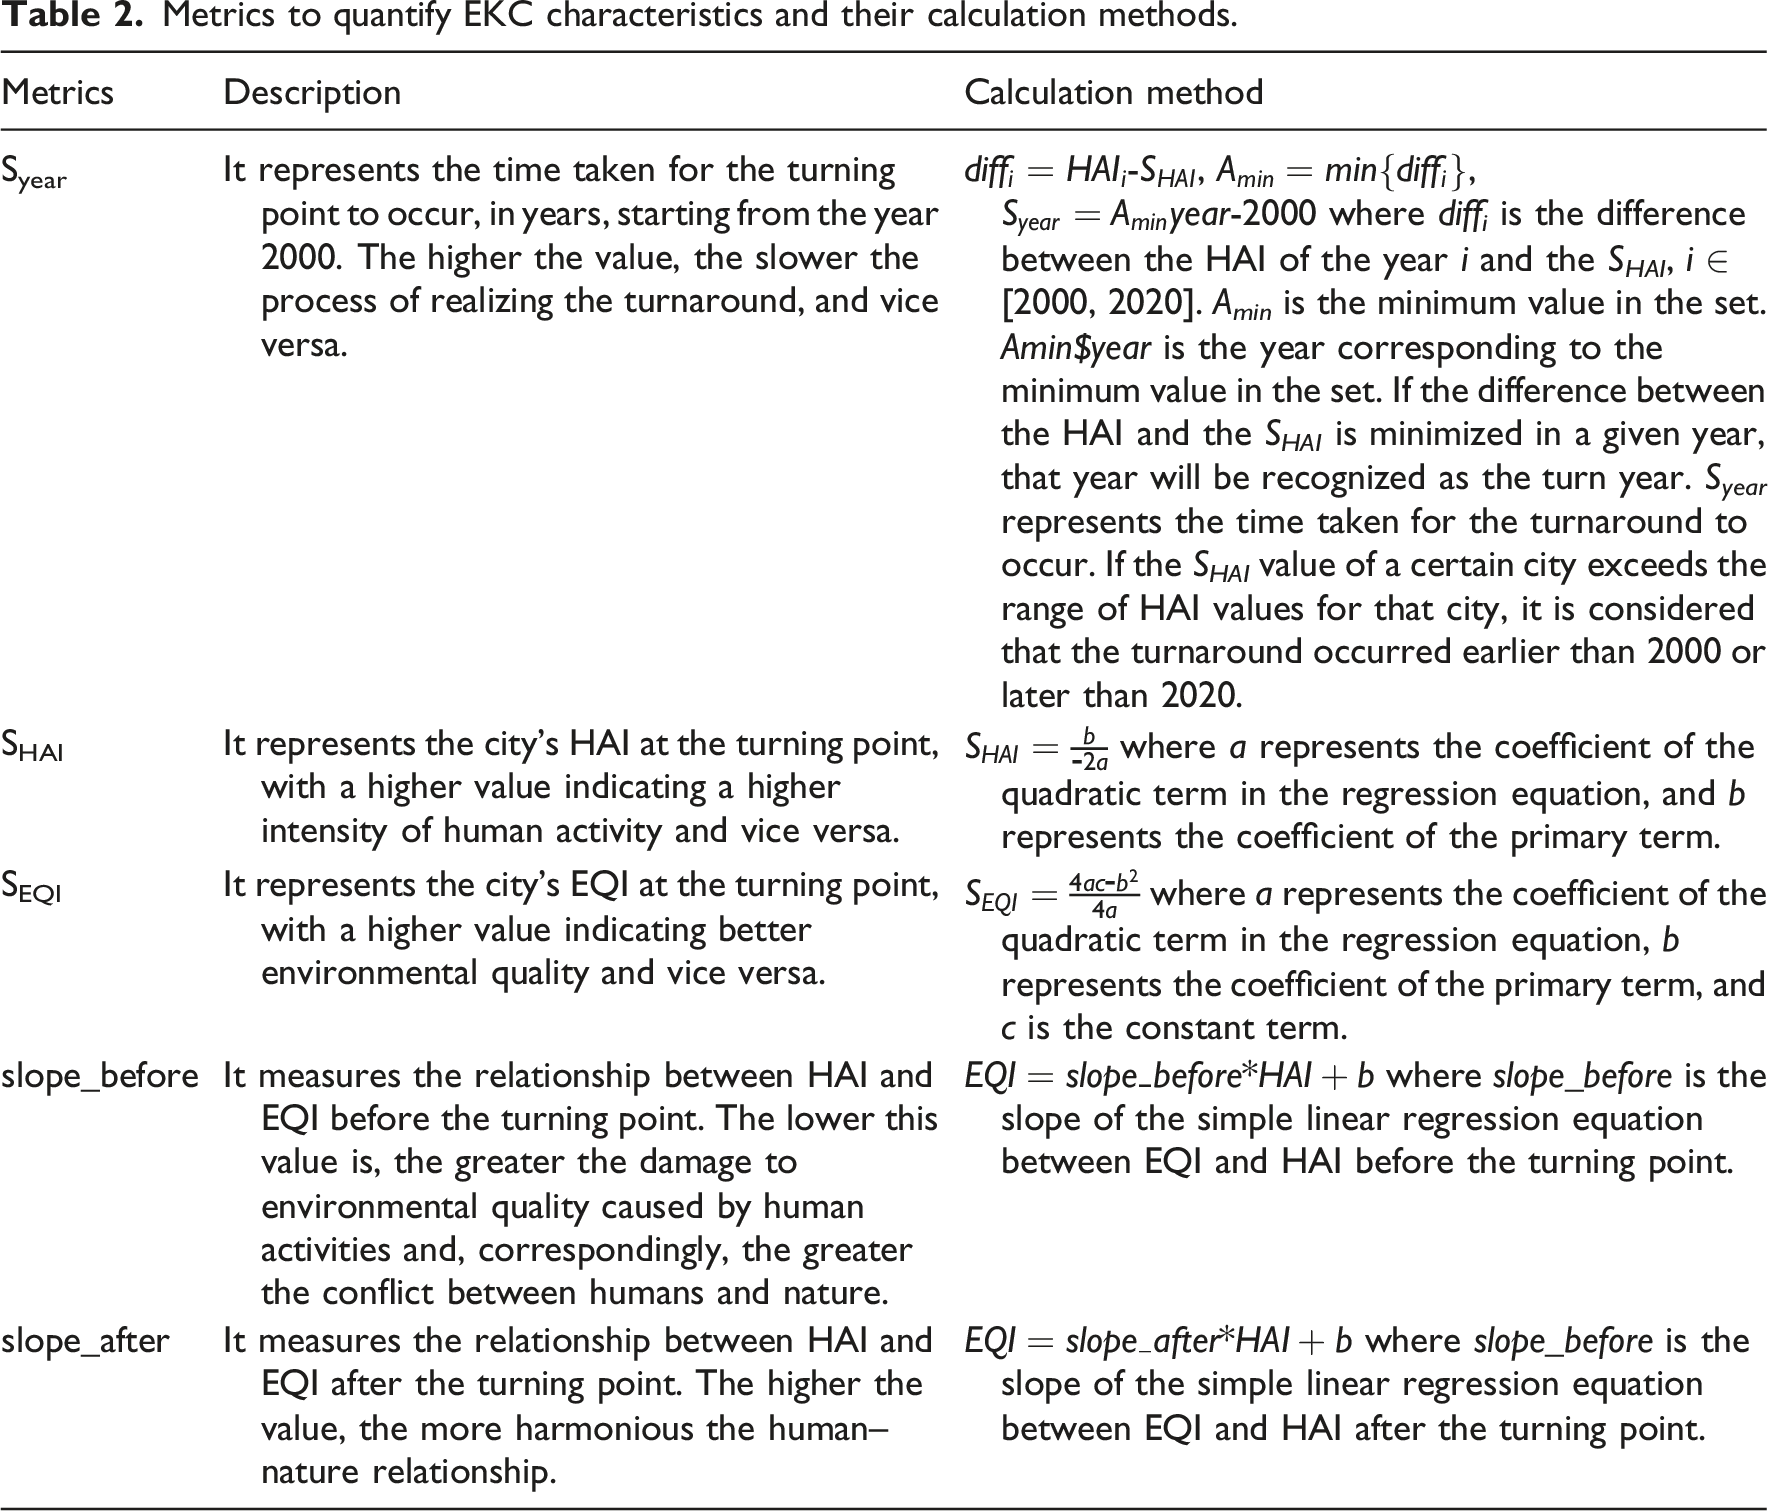
Metrics to quantify EKC characteristics and their calculation methods.
Identification of city clusters based on EKC characteristic metrics
After identifying the EKC and extracting the five metrics Syear, SHAI, SEQI, slope_before, and slope_after, we applied the K-means clustering algorithm (MacQueen, 1967) to classify EKC-conforming cities into distinct clusters. Clustering analysis was implemented in R using the stats package. To determine the optimal number of clusters, the elbow method was used, and the within-cluster sum of squares (WSS) was calculated for k ranging from 1 to 10. For each k, the K-means algorithm was run 25 times with random initializations, retaining the lowest WSS value to enhance stability. WSS values were plotted against k to generate the elbow curve. The optimal number of clusters was determined by visually inspecting the curve and identifying the k value at which marginal reductions in WSS became markedly less pronounced.
Analysis of drivers in the evolution of human–nature relationships
Rather than isolating individual effects, the Random Forest model was employed as a multivariate, nonlinear classification approach that accounts for interactions among multiple drivers. Drivers of the human–nature relationship were categorized into four dimensions: natural endowments, ecological governance, economic development, and land-use change (Supplemental Table S3). This classification is theoretically grounded: natural endowments define ecological baselines and carrying capacity; governance variables reflect policy interventions; economic indicators capture development pressures and structural transformation; and land-use metrics represent direct human appropriation of space and resources. To examine how these variables jointly influence city cluster classification, a Random Forest model (Breiman, 2001) was implemented in R using the randomForest package, with 500 trees. The number of candidate variables at each split (mtry) was set to the square root of the total number of predictors. Model performance was evaluated by randomly splitting the dataset into training (60%) and testing (40%) subsets, using out-of-bag (OOB) error, classification accuracy, and confusion matrices as metrics. Variable importance was evaluated using the Mean Decrease in Accuracy (MDA), which measures the marginal contribution of each variable to classification performance, conditional on the presence of all other predictors, rather than representing an isolated or independent effect. Higher MDA values indicate a greater contribution of the corresponding variable to overall classification performance. Based on the key drivers identified by the Random Forest model, generalized additive models (GAMs) were further applied to examine marginal response patterns of EKC characteristic metrics, clarifying the directionality and nonlinearity of individual drivers in a multivariate context (Wood, 2006).
Results
Spatial and temporal changes in HAI and EQI
Figure 2 shows the spatial patterns of HAI and EQI changes from 2000 to 2020. HAI showed no significant change across 59.46% of the study area, primarily in western China, including the Tarim Basin and northern Tibetan Plateau. Areas with a significant HAI increase accounted for 39.72%, mainly in the eastern coastal regions, North China Plain, and southern Tibetan Plateau, whereas only 0.82% showed a significant decrease (Figure 2(a)). Areas with a significant increase in EQI accounted for 54.81% of the study area, mainly in the Northeast China Plain, the Loess Plateau, and regions south of the Qinling–Huaihe Line, whereas 10.09% showed a decrease, concentrated in northwestern China and the Tibetan Plateau; 35.10% remained unchanged (Figure 2(b)). At the city level, HAI increased significantly in most cities, with only eight showing a decreasing trend. Of these, Shennongjia Forestry District and Enshi Tujia and Miao Autonomous Prefecture are in Hubei Province, while the remaining six are in Heilongjiang Province. EQI increased in most cities, whereas 10 cities in Xinjiang, Inner Mongolia, and Gansu showed a decline. Spatial and temporal changes in HAI and EQI. (a) represents the change in HAI; (b) represents the change in EQI. Pixels are classified as showing statistically significant changes when the absolute value of Z exceeds 1.96, corresponding to a 95% confidence level.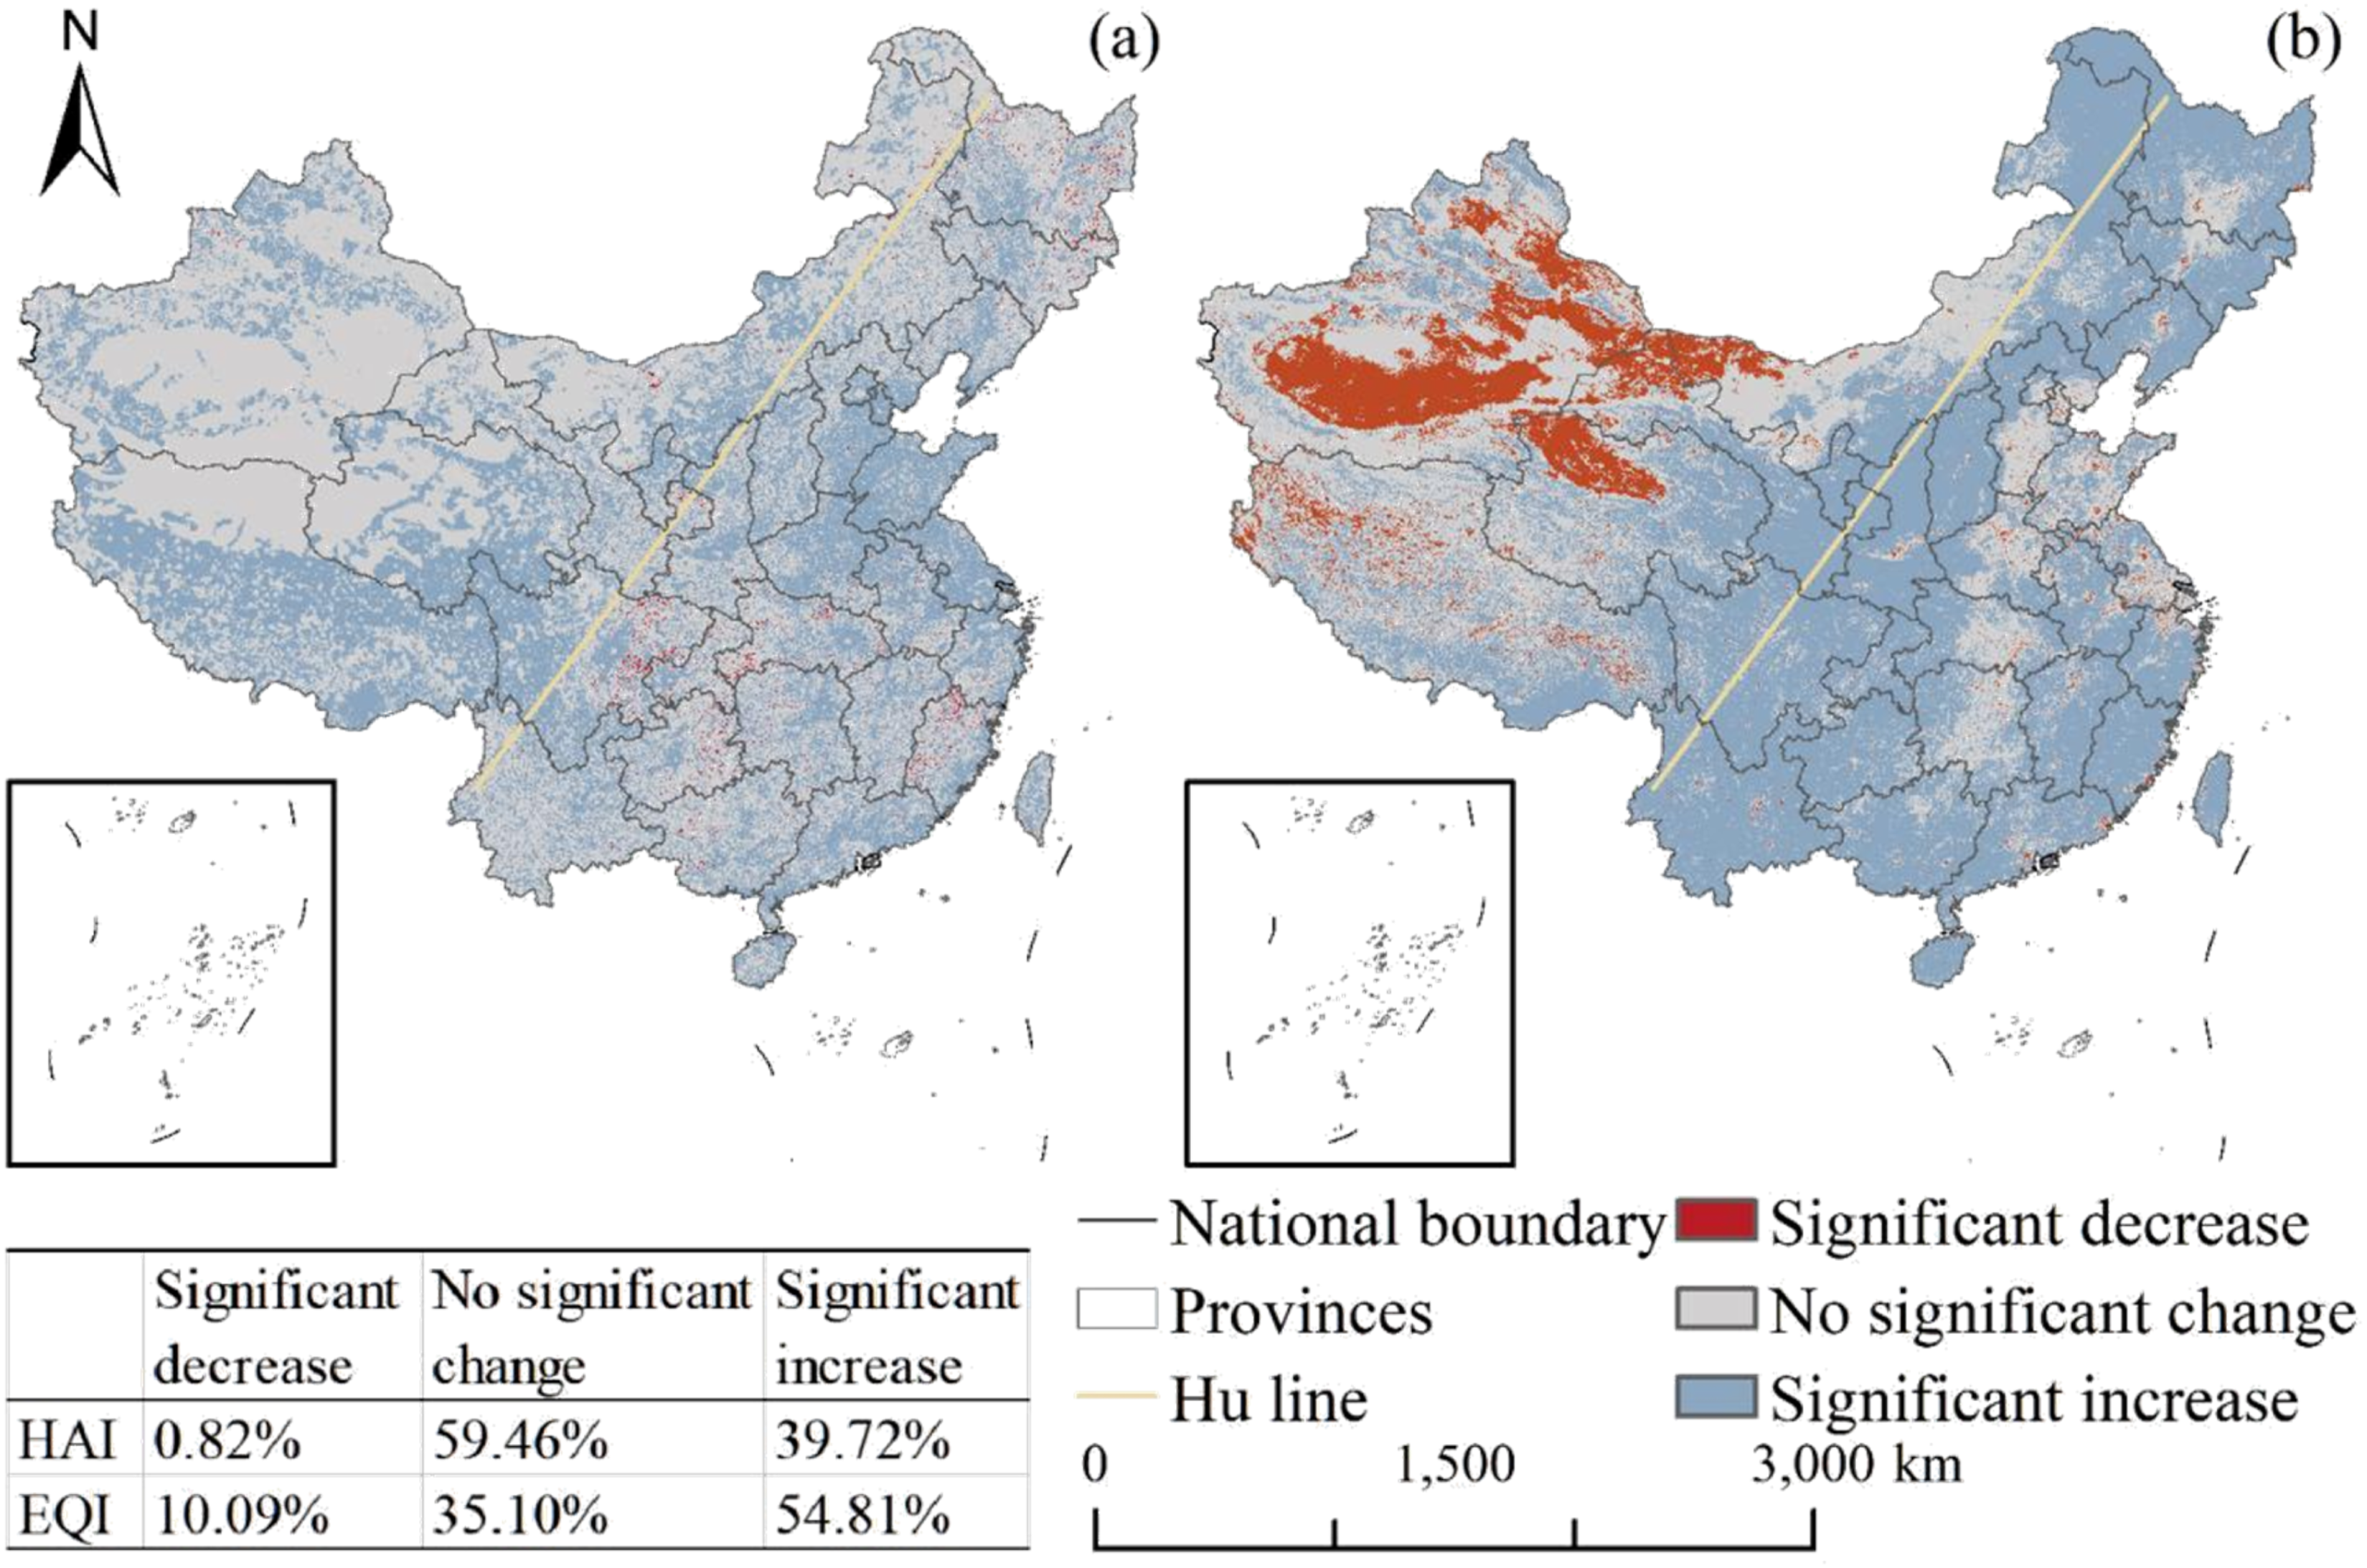
EKC identification results
Based on fitted HAI–EQI relationships from 2000 to 2020, 147 cities exhibited a U-shaped pattern under the criterion of R2 > 0.5, with the quadratic model outperforming the linear model. In contrast, 171 cities showed an inverted U-shaped pattern, while 50 cities exhibited a U-shaped pattern with low goodness of fit. Spatially, EKC-conforming cities were primarily located east of the Hu Line (Figure 3). Relationship between HAI and EQI for 368 cities. (a) shows the spatial distribution of cities that conform to the EKC hypothesis and those that do not; (b) shows the number of different types of cities; (c) shows the number of cities that conform to the EKC hypothesis and those that do not in each province. City_EKC represents cities that conform to the EKC hypothesis, City_NONE represents cities that do not conform to the EKC hypothesis, and City_Province represents provinces that conform to the EKC hypothesis.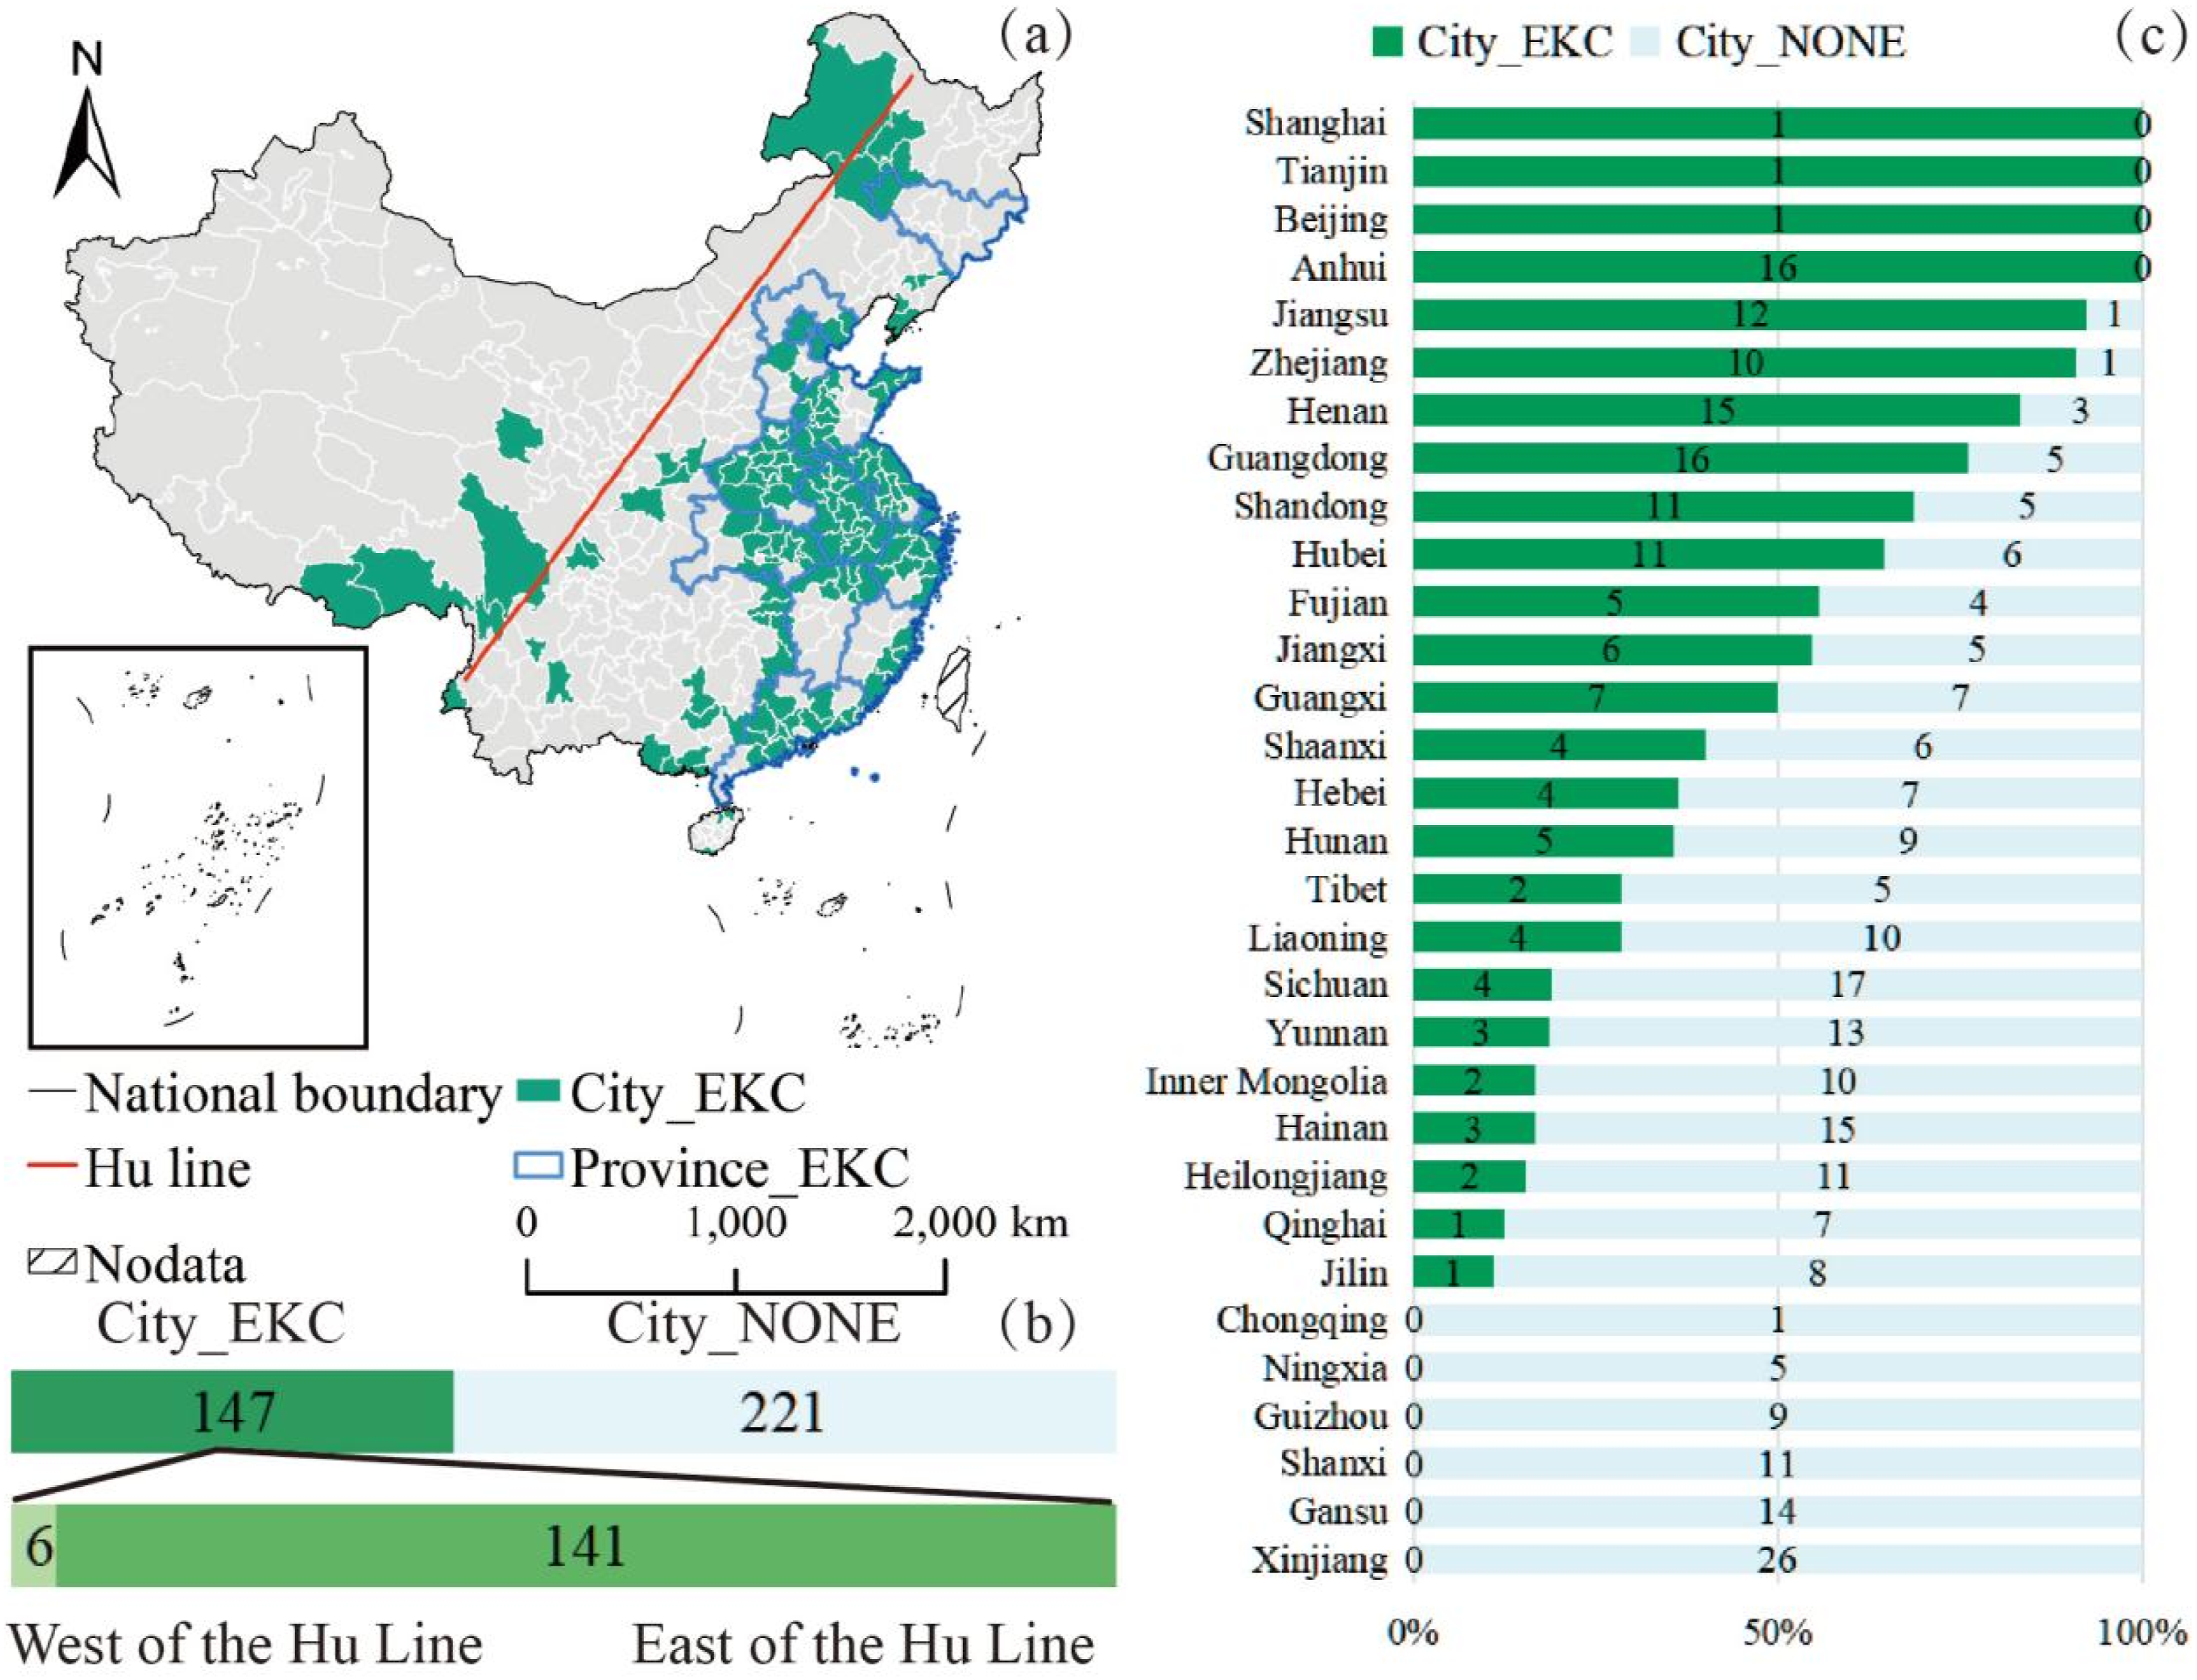
Comparisons between EKC-conforming and non-conforming cities reveal systematic differences in natural conditions, urban expansion, and socioeconomic characteristics (Supplemental Figure S1). EKC-conforming cities were generally associated with higher precipitation and temperature, while non-conforming cities tended to be situated in higher-elevation and steeper-terrain areas. On average, urban expansion rates were higher in EKC-conforming cities. Although non-conforming cities had higher per capita GDP growth rates, their overall per capita GDP levels remained lower than those of EKC-conforming cities in 2000 and 2020. Regarding ecological attributes, EKC-conforming cities had higher proportions of greenspace, whereas non-conforming cities had larger shares of protected areas and relatively higher forest resilience.
EKC characteristic metrics analysis
For the 147 EKC-conforming cities, analyses were conducted using the five EKC characteristic metrics defined in Table 2. Regarding timing, 65 cities reached a turning point before 2000; 47 cities had a Syear of 6 years or less, and 14 cities had a Syear of 10 years or more, primarily in Shandong, Henan, Jiangsu, and Hubei. Figure 4 illustrates HAI and EQI values at the turning point. HAI and EQI were categorized into five levels using the natural breakpoint method. 32 cities had relatively high SHAI values (mean = 28.84), primarily in eastern coastal regions or major inland urban hubs. In addition, 26 cities had relatively high SEQI values (mean EQI = 173.96). HAI and EQI correspond to turning points in different cities. (a) is the rank of HAI; (b) is the rank of EQI. Sixty-five cities with turnarounds earlier than 2000 are not included in the figure.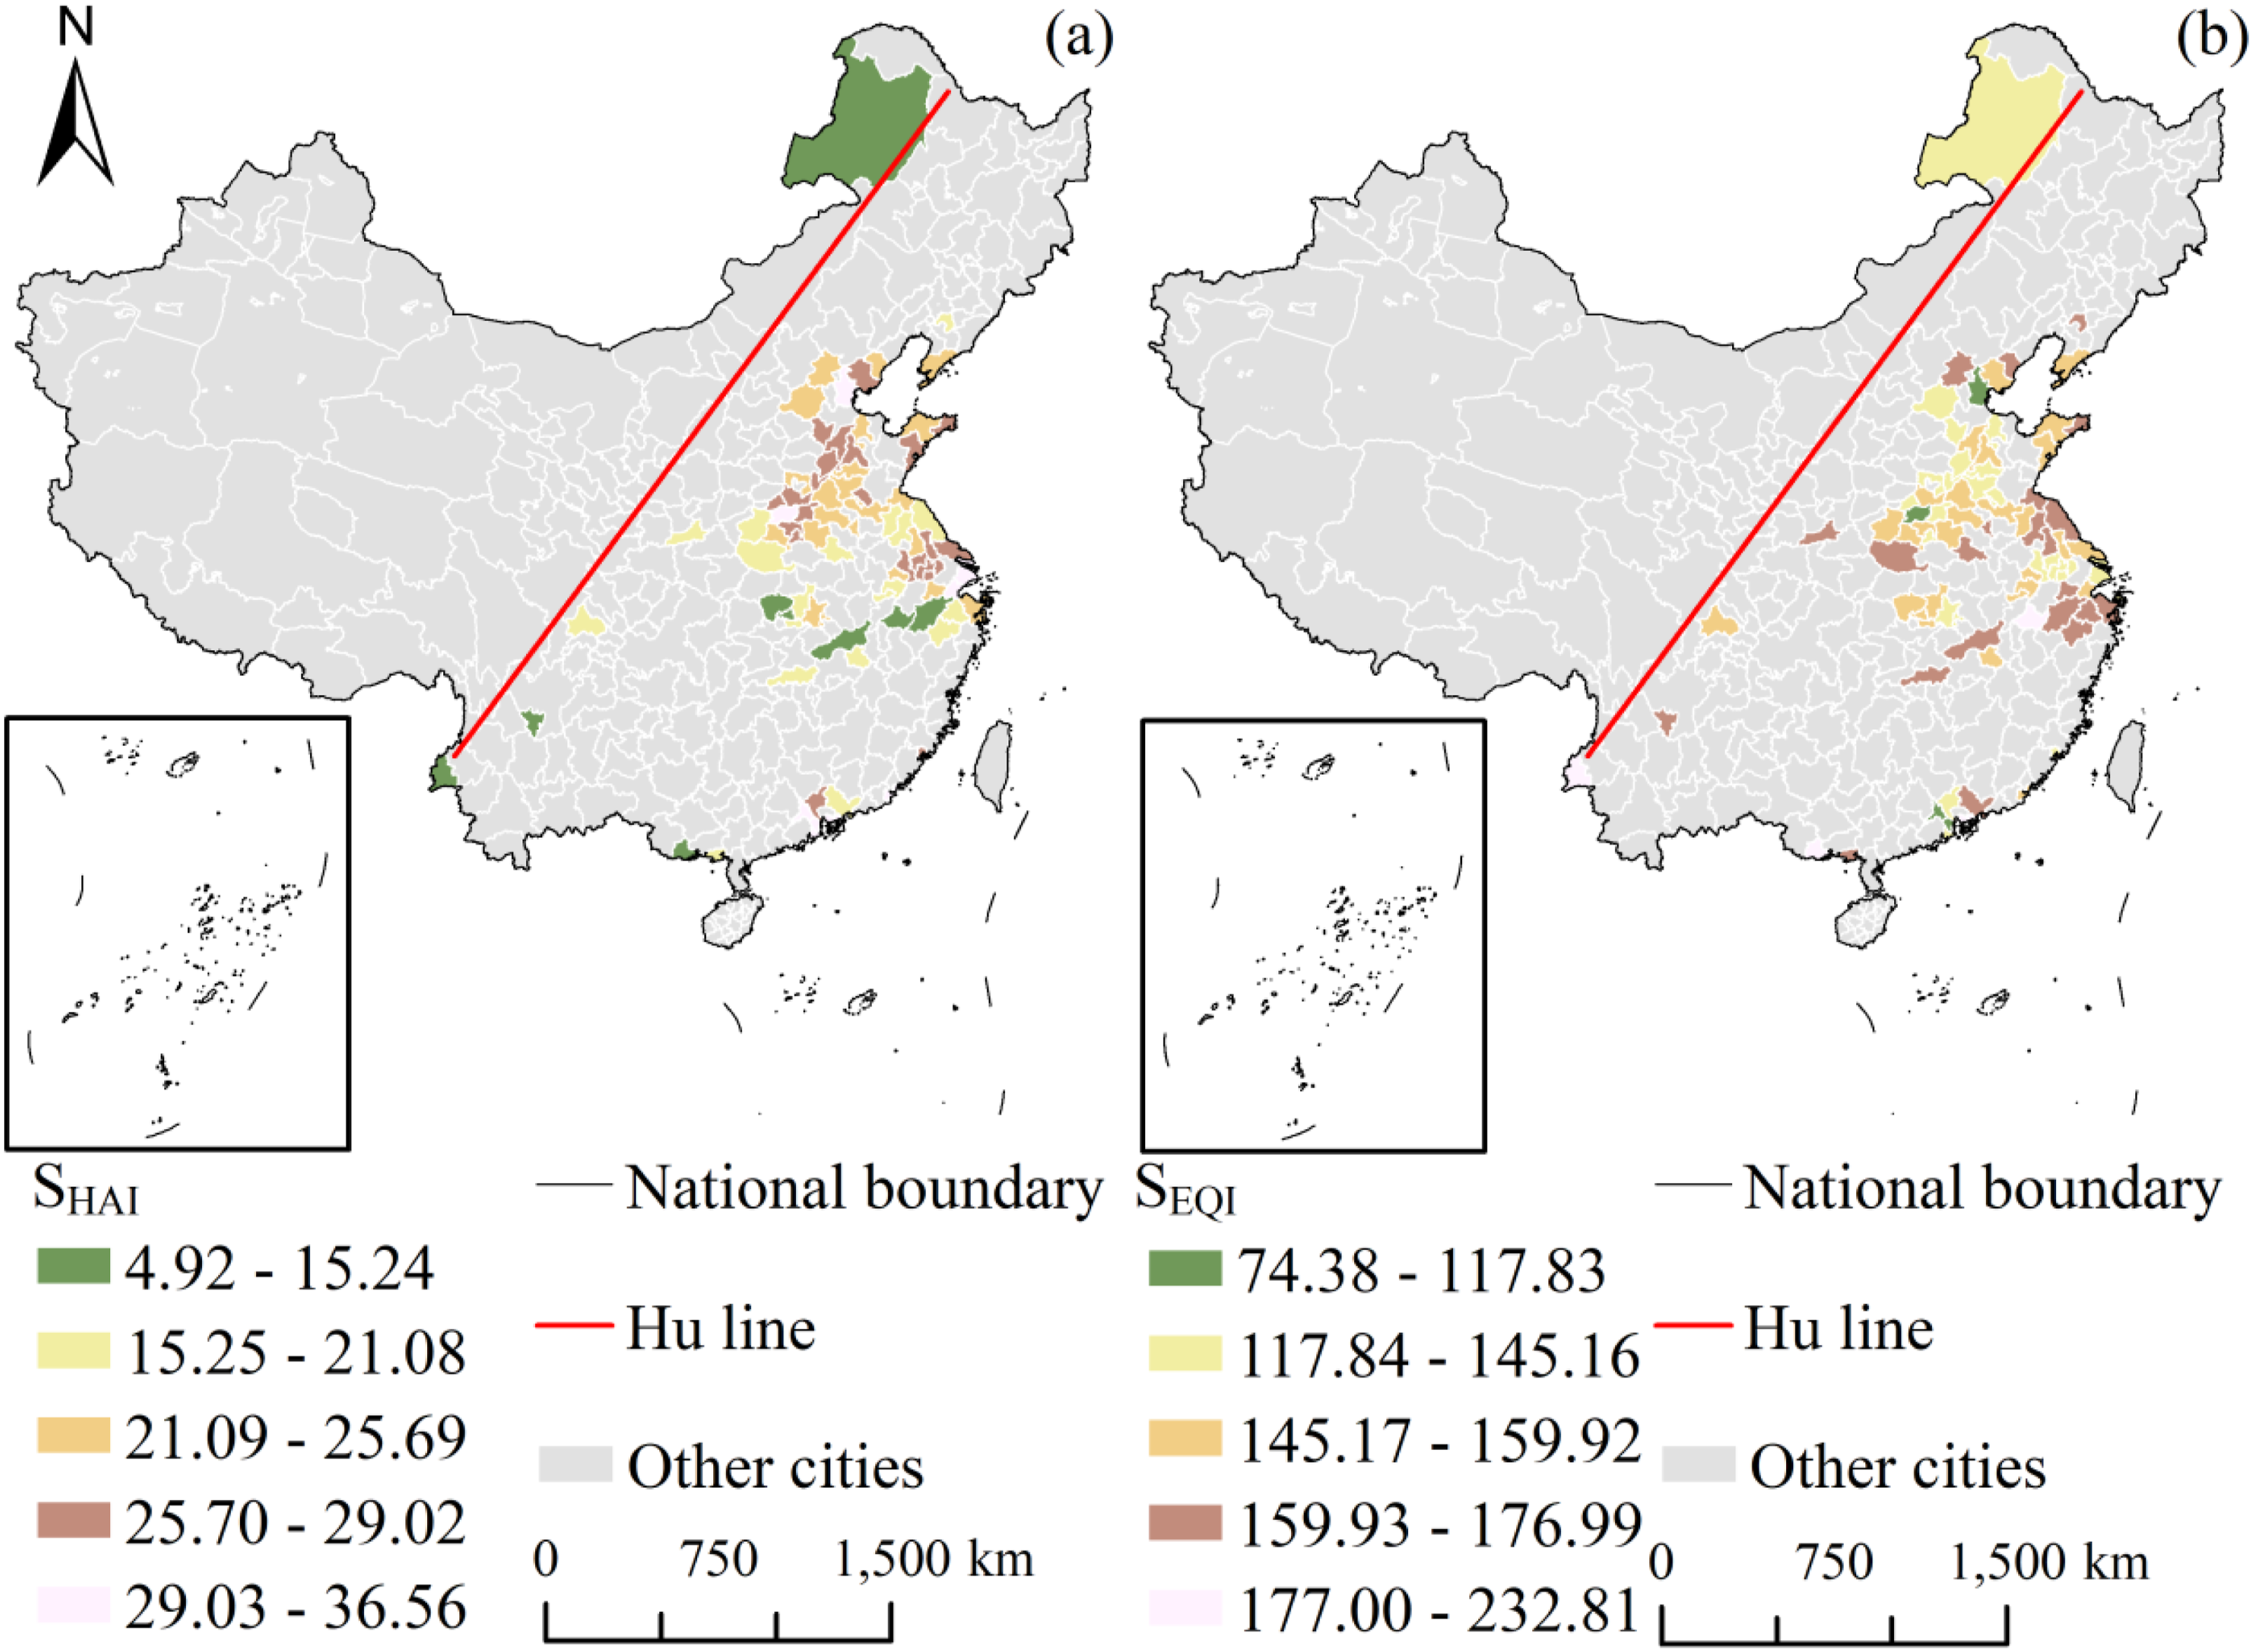
Taking the turning point as the segmentation threshold, linear regression analyses were conducted to examine the relationship between HAI and EQI before and after the turning point. Among the 147 cities, 65 cities with turning points occurring before 2000 and 10 cities with insufficient observations prior to the turning point were excluded. The remaining 72 cities were classified into five levels based on their regression slopes before and after the turning point (Figure 5). Before the turning point, EQI generally decreased as HAI increased. Cities classified at higher conflict levels (V conflict; n = 5) were mainly distributed in inland areas, with an average regression slope of −24.87. In contrast, cities at lower conflict levels (I conflict; n = 6) were primarily located in coastal areas and major river basins, with regression slopes ranging from −1.81 to −0.17. After the turning point, HAI and EQI exhibited a generally positive relationship. Cities with higher coordination levels (III, IV, and V coordination; n = 18) were predominantly located in inland regions. Shenzhen exhibited a relatively low slope before the turning point (slope_before = −2.90) and a much higher slope after the turning point (slope_after = 41.49) (red box 1 in Figure 5(b)–(c)). In comparison, several cities in northern regions exhibited relatively low slopes both before and after the turning point (red box 2 in Figure 5(b)–(c)). Slopes before and after turning points for 72 cities. (a) shows the location of cities capable of segmental regression; (b) is the slope before the turning point; (c) is the slope after the turning point.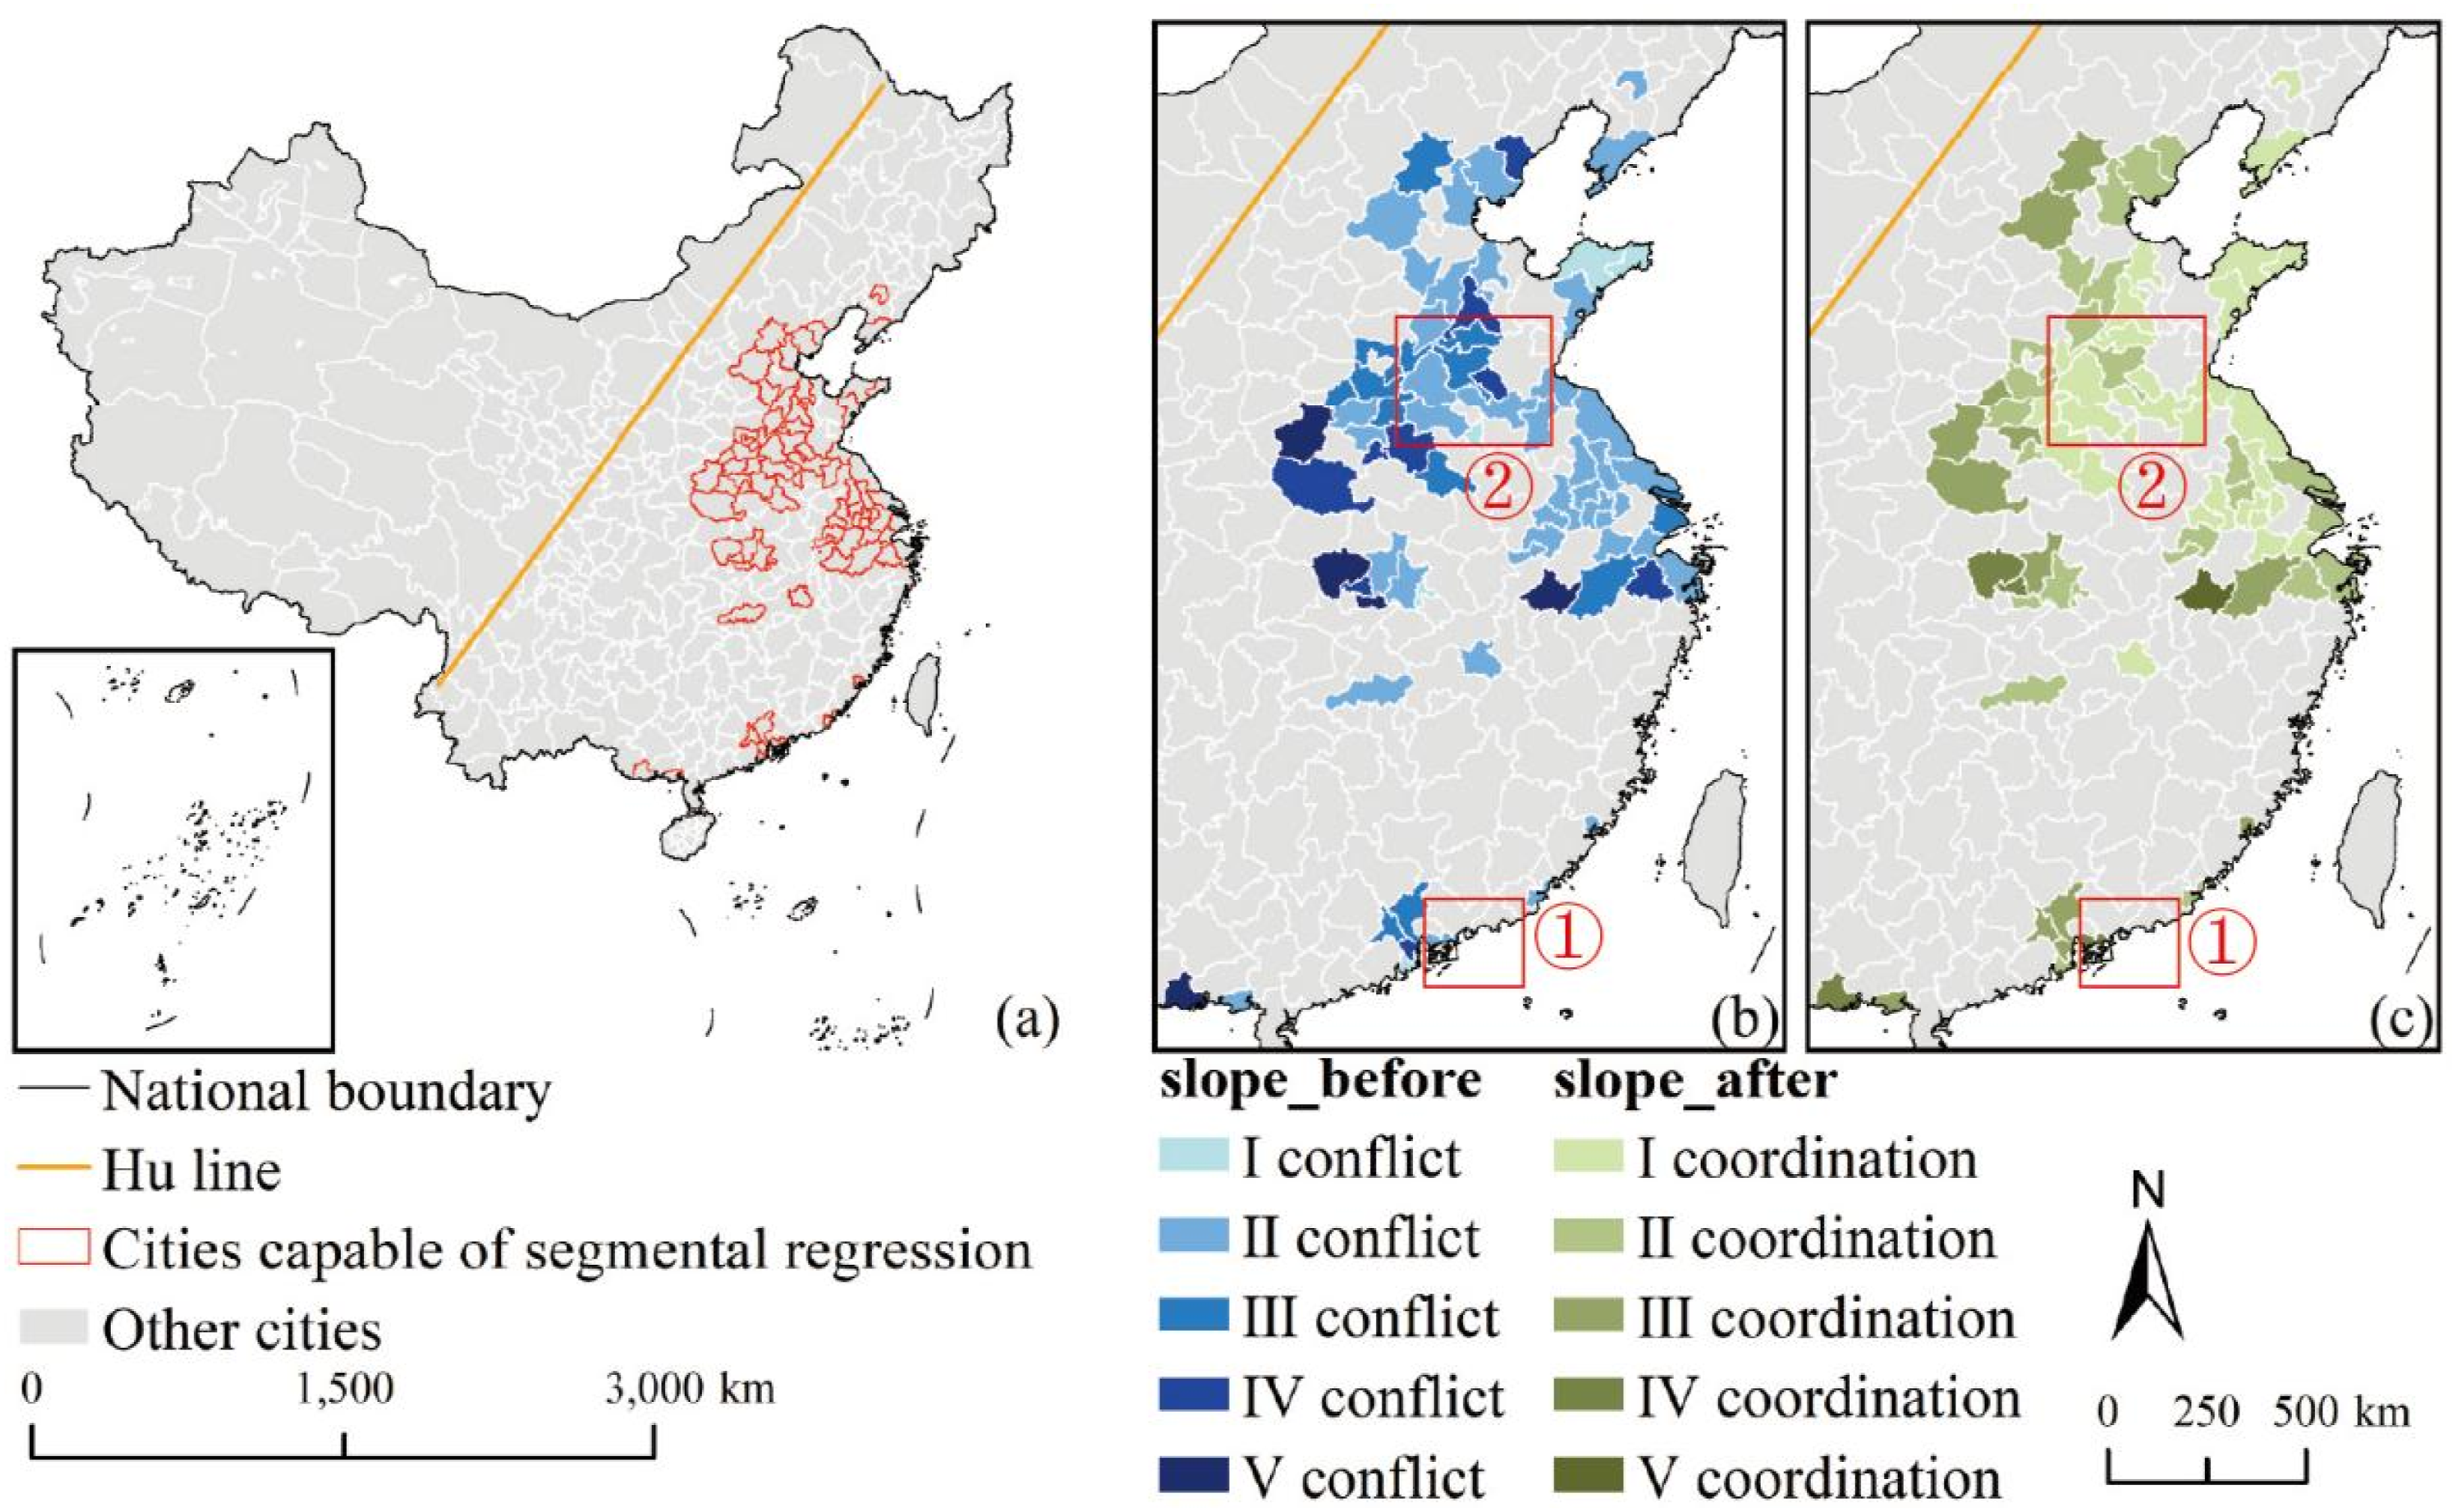
City cluster identification results
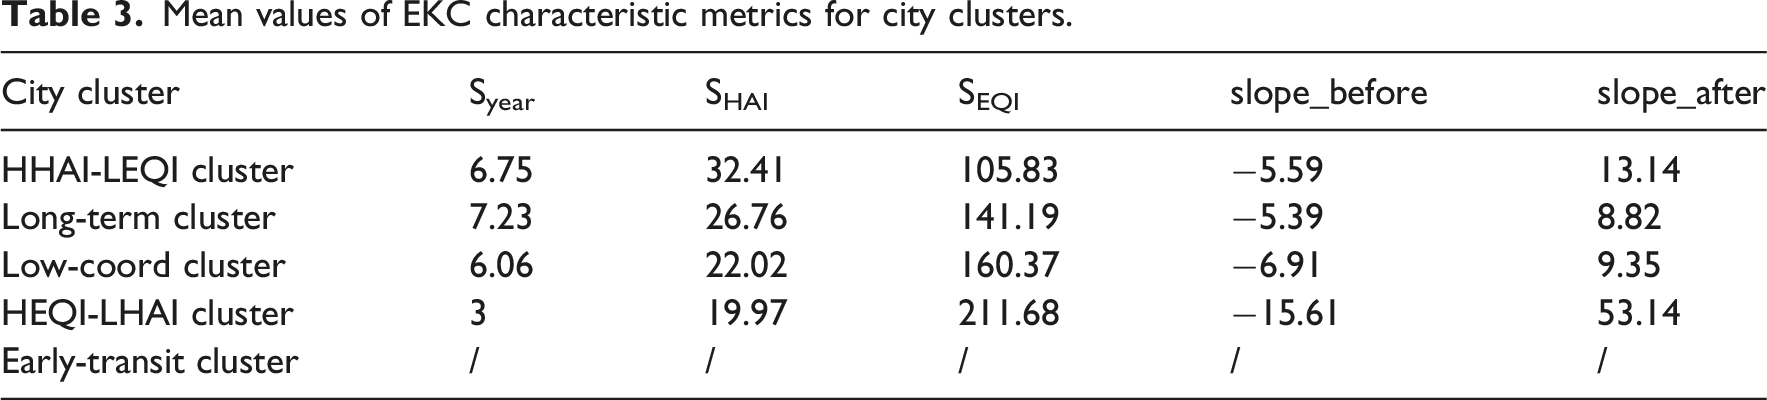
Of the 147 EKC-conforming cities, 75 were classified as the early-transit cluster due to very early turning points or insufficient pre-turning observations. The remaining 72 cities were clustered into four groups based on EKC characteristic metrics: the high HAI–low EQI cluster (HHAI-LEQI), the long-term transition cluster (long-term), the low-level coordination cluster (low-coord), and the high EQI–low HAI cluster (HEQI-LHAI) (Figure 6). Spatial distribution of city clusters and their EKC characteristic metrics. (a) shows the spatial distribution of city clusters; (b) shows the box-and-line plot of EKC characteristic metrics of city clusters. City clusters 1–4 are HHAI-LEQI, long-term, low-coord, and HEQI-LHAI clusters.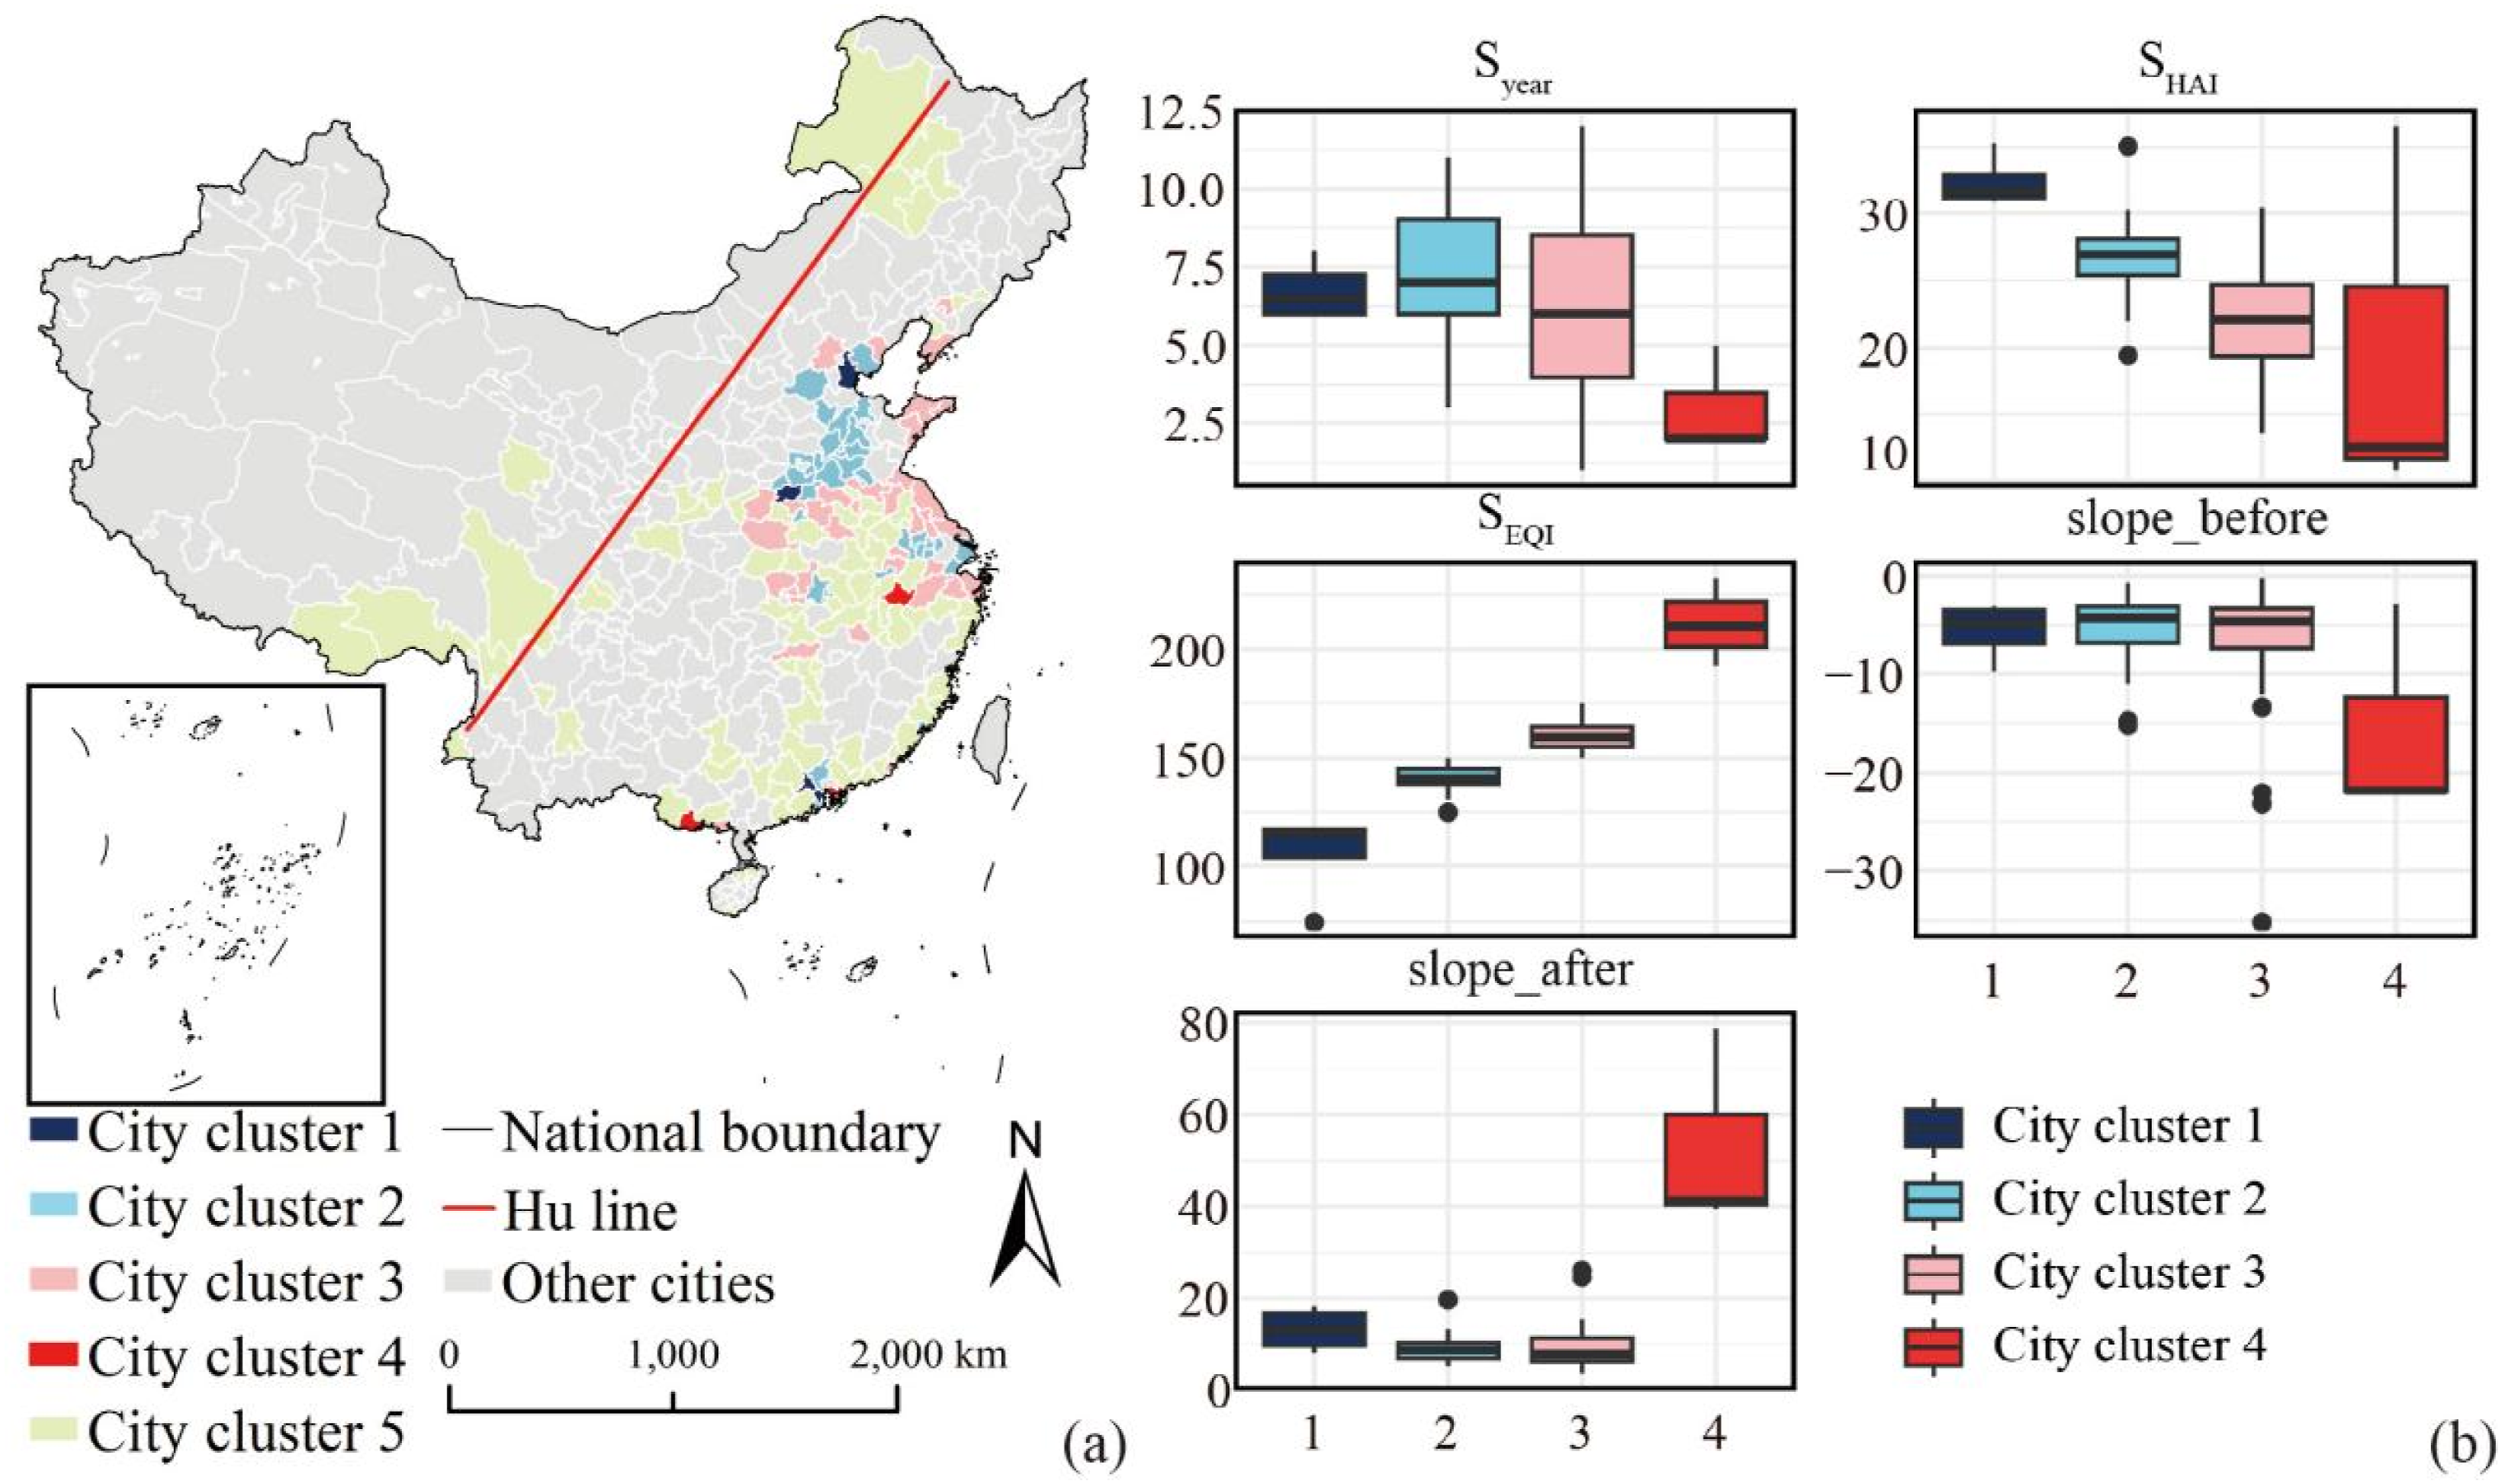
Mean values of EKC characteristic metrics for city clusters.
Drivers influencing the human–nature relationship
Based on the classification of 147 cities into five distinct urban clusters, Random Forest analysis was used to capture the combined effects of multiple drivers on the differentiation of human–nature relationship evolution pathways. The OOB error rate was 26.19%, which corresponded to an accuracy of 73.81%, indicating a reasonable fit to the training data. On the testing dataset, the overall classification accuracy reached 71.43%, suggesting good generalization performance. Although some degree of misclassification existed among clusters with similar or transitional characteristics, the model was able to effectively distinguish the major types of human–nature relationship dynamics. To provide a more detailed evaluation, confusion matrices are reported in the Supplemental Materials (Supplemental Table S4).
According to the variable importance ranking, urban expansion rate (urban_change), slope, greenspace, forest resilience (forest_res), and elevation (DEM) emerged as the five most influential factors contributing to cluster classification (Figure 7(a)). Comparisons across clusters revealed distinct configurations of key drivers, indicating that different combinations of topographic conditions, urban expansion intensity, and ecological attributes underlie heterogeneous transition pathways (Figure 7(b)). The HHAI-LEQI and HEQI-LHAI clusters exhibited contrasting driver configurations. Cities in the HHAI-LEQI cluster were generally characterized by higher urban expansion intensity combined with gentler slopes and lower elevation, whereas cities in the HEQI-LHAI cluster were associated with steeper terrain, higher elevation, and relatively limited urban expansion. The early-transit cluster showed slope and elevation levels comparable to those of the HEQI-LHAI cluster, together with moderate urban expansion, but was distinguished by the lowest proportion of greenspace among all clusters, suggesting structural constraints on ecological infrastructure provision. In contrast, the long-term and low-coord clusters were characterized by relatively flatter terrain and intermediate-to-high levels of urban expansion, ranking below the HHAI-LEQI cluster but above other clusters, while differing in greenspace provision, with higher levels observed in the long-term cluster than in the low-coord cluster. The importance of drivers in forming urban clusters and the levels of the top five drivers across the different city clusters. (a) is the importance of all drivers;(b) presents the top five drivers of importance across the different city clusters. City clusters 1–5 are HHAI-LEQI, long-term, low-coord, HEQI-LHAI, and early-transit clusters, respectively. PRE: annual average precipitation; TMP: annual average temperature; Forest_res: forest resilience; Greenspace: percentage of greenspace; PA: percentage of protected areas; GDP_change: growth rate of per capita GDP; GDP1_change: changes in the proportion of the primary industry; GDP2_change: changes in the proportion of the secondary industry; GDP3_change: changes in the proportion of the tertiary industry; Forest_change: change in forest coverage; Urban_change: changes in the proportion of urban land use.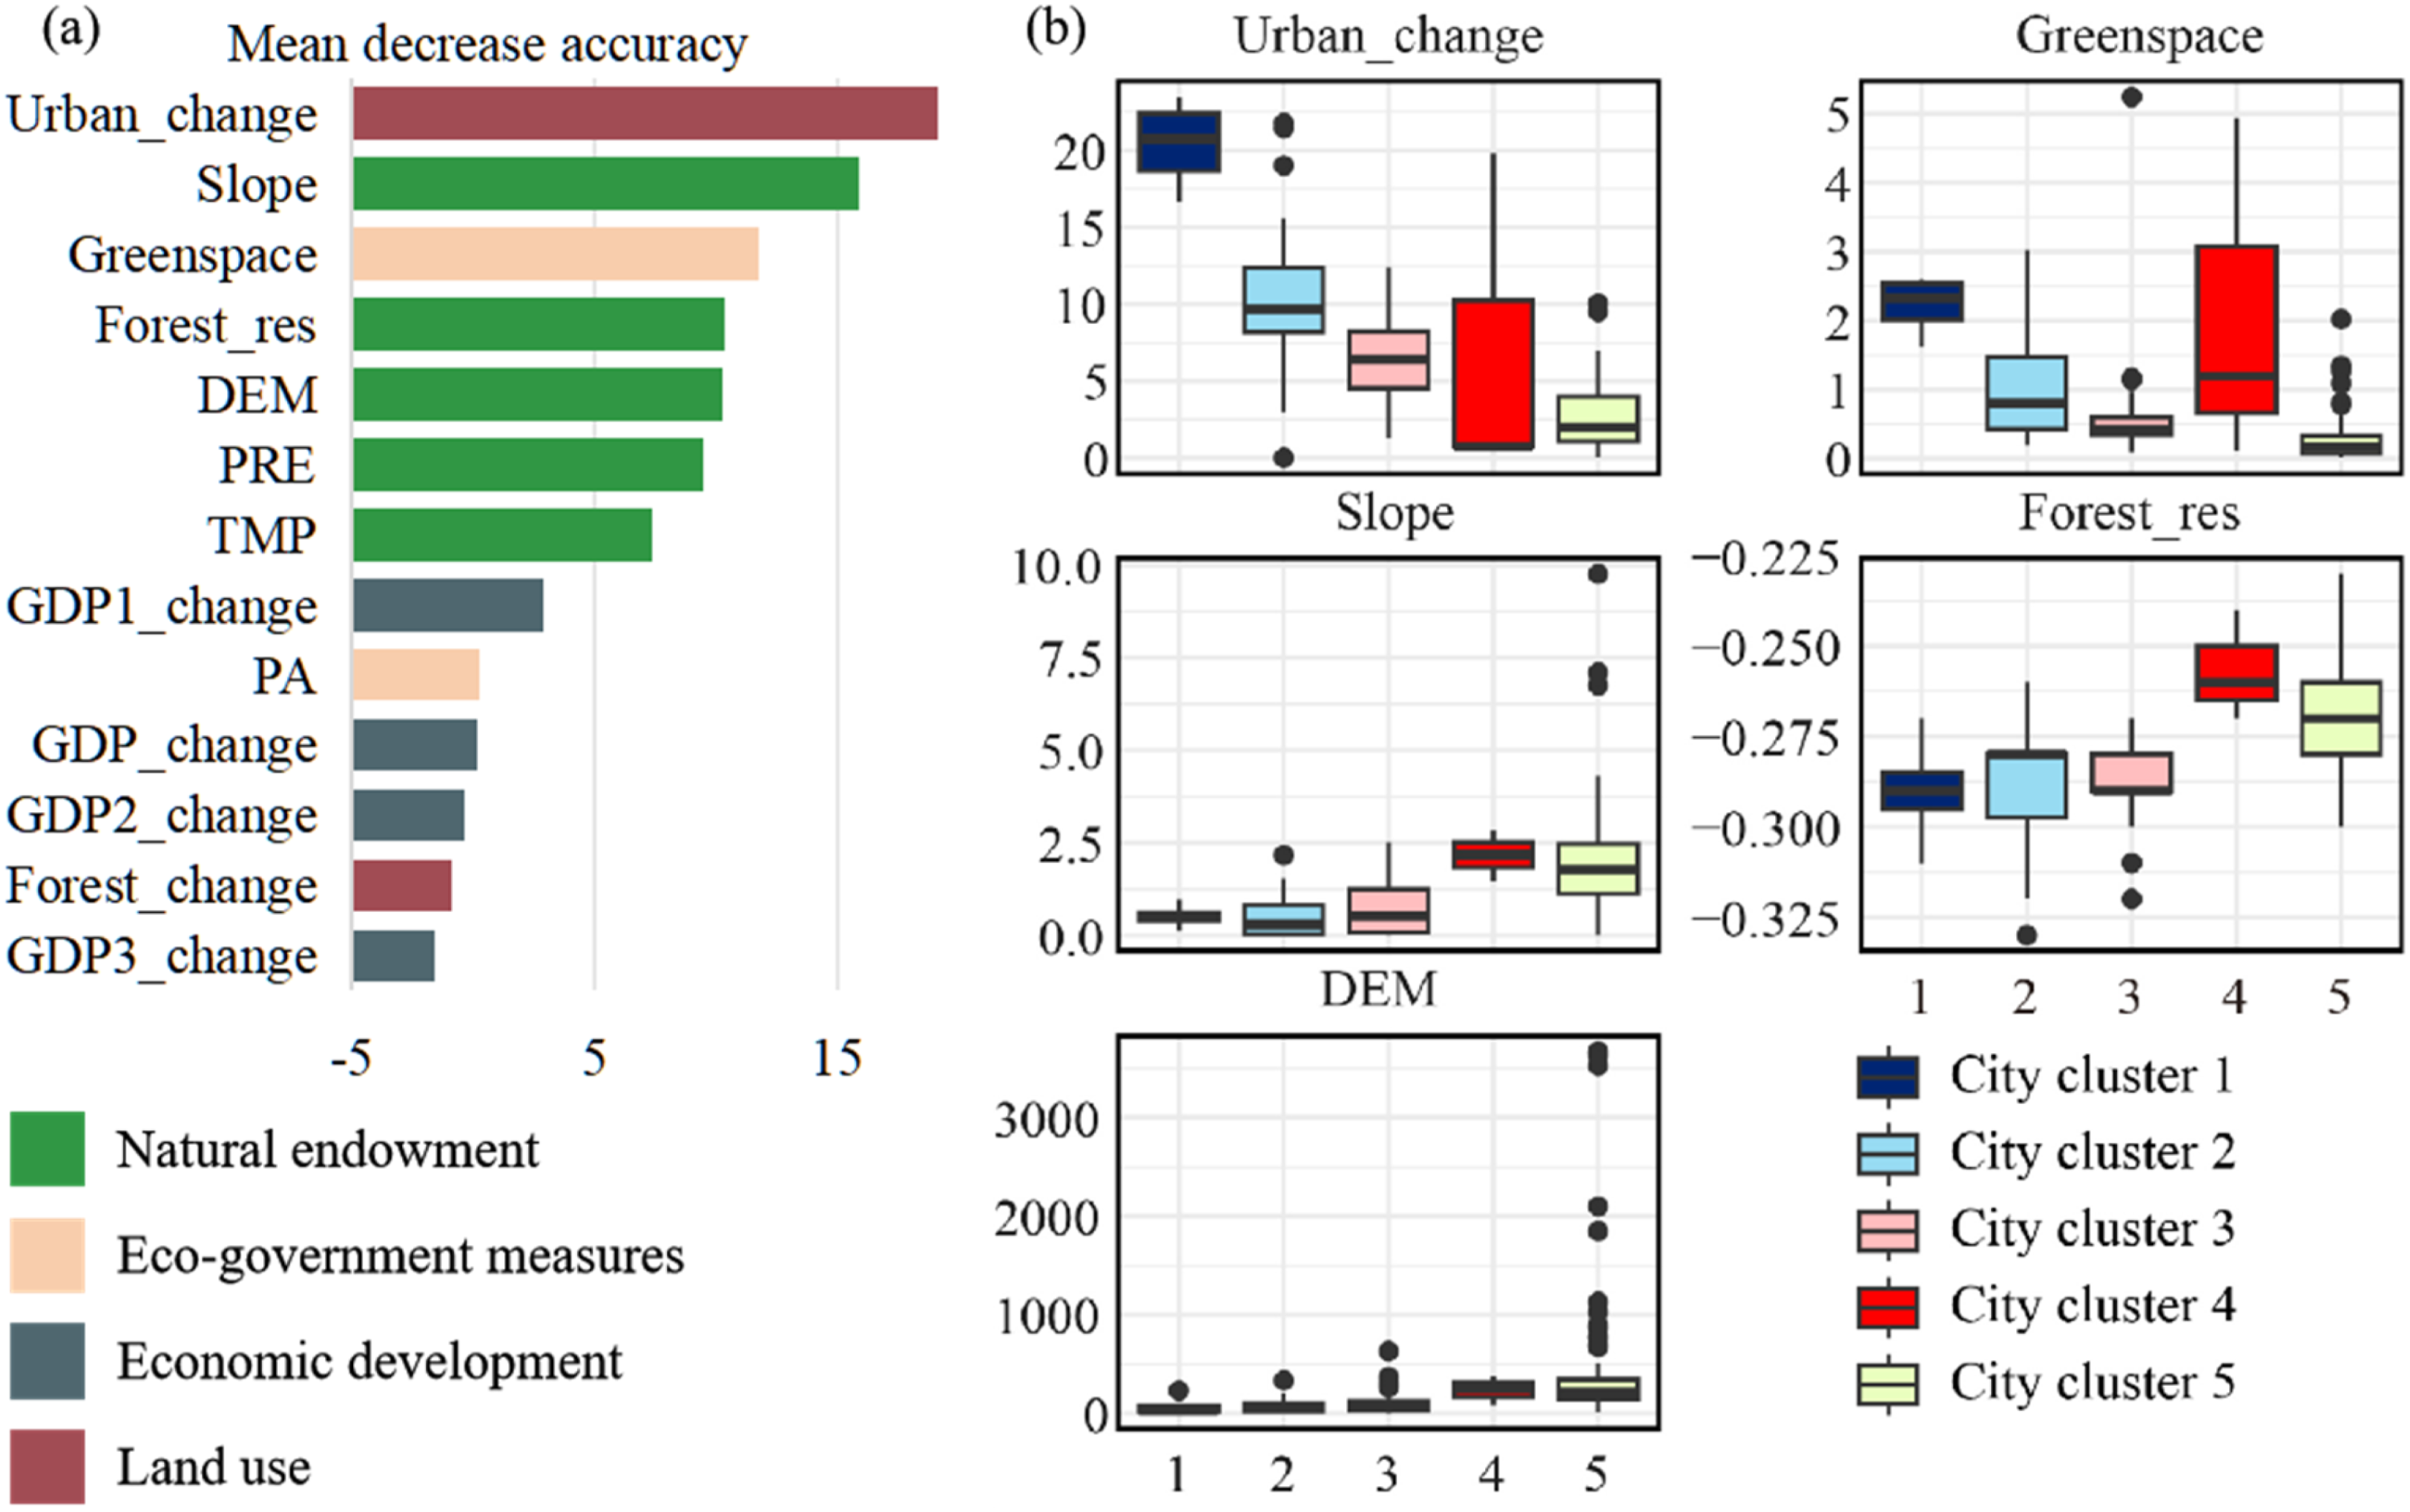
To further interpret how key drivers influence EKC characteristics within a multivariate context, generalized additive models were used to examine the marginal response patterns of EKC metrics to the five most influential variables (Figure 8). This analysis was conducted for the 72 cities belonging to clusters with clearly identified EKC features. The early-transit cluster was excluded because turning point metrics could not be reliably identified. The relationship between Syear and urban_change exhibited an inverted U-shaped pattern, whereas slope, greenspace, forest_res, and elevation showed monotonic negative relationships with Syear. Cities with gentler slopes and lower elevation tended to reach turning points under higher HAI and lower EQI, whereas cities with steeper terrain and higher elevation showed the opposite pattern. Higher forest_res values were associated with more negative HAI–EQI slopes before the turning point and increasingly positive slopes after the turning point, indicating stronger post-transition improvements in human–nature coordination in high-resilience regions. Response patterns of EKC characteristic metrics to top five drivers of importance.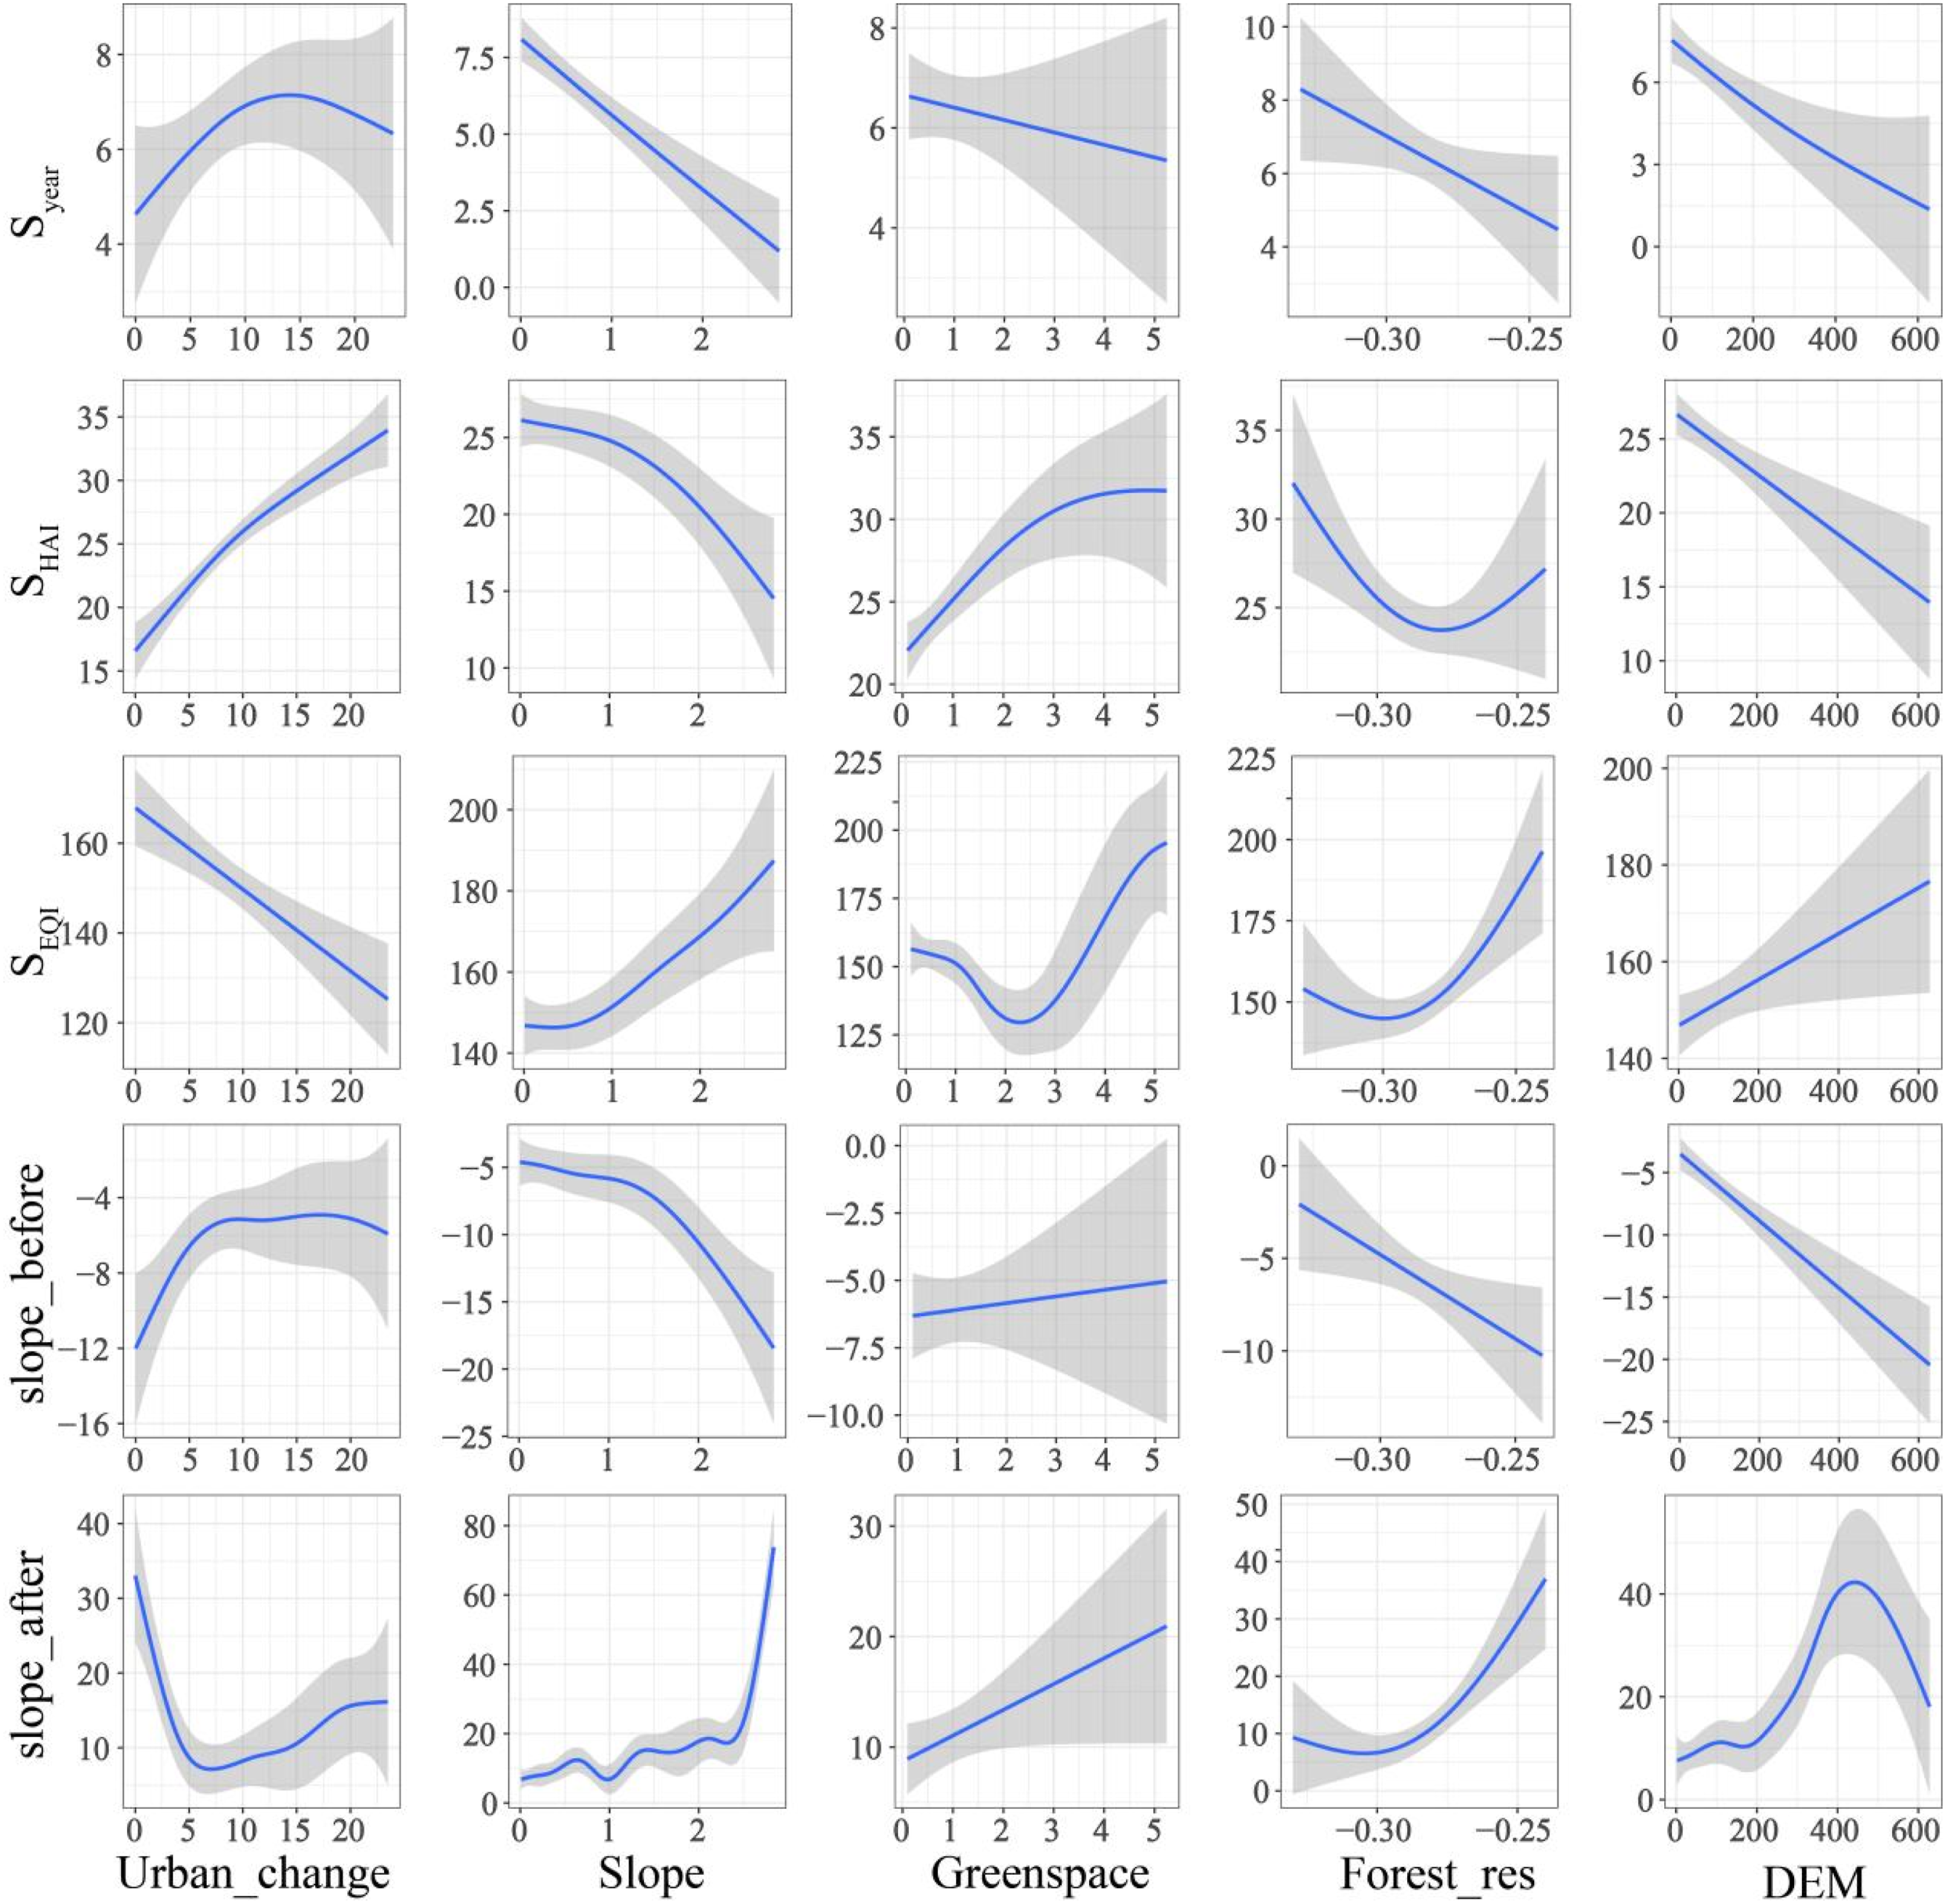
Discussion
Advantages of composite indicators over single metrics
The EKC hypothesis has been widely used to examine nonlinear relationships between economic development and environmental change. However, conventional EKC studies often rely on single indicators—such as GDP, emissions, or vegetation indices—to represent complex human or natural systems, which may obscure multidimensional interactions and result in scale-dependent or inconsistent EKC identification. By integrating HAI and EQI, this study operationalizes the EKC framework using composite indicators that capture both development intensity and ecosystem condition. HAI reflects socioeconomic activity and land-use pressure, whereas EQI synthesizes ecosystem state and resilience. Their joint use enables the EKC to be interpreted not merely as a growth–pollution trade-off, but as an evolving relationship between human activity intensity and ecological system performance. The consistent identification of EKC patterns at both city and provincial levels further demonstrates the robustness of this composite-indicator-based approach (Figure 3), extending the EKC from a single-metric paradigm toward a multidimensional diagnostic framework for analyzing human–nature interactions.
Beyond its relevance to China’s urban governance, this framework also provides insights for global audiences concerned with sustainability transitions under rapid urbanization. Many cities in developing and transitional economies face intertwined challenges of economic expansion, land-use transformation, and environmental stress, often in contexts where comparable single environmental or economic metrics are inadequate. The HAI–EQI framework offers a transferable and data-flexible approach to diagnosing transition timing, conflict intensity, and post-transition recovery across heterogeneous urban systems. In doing so, it reduces reliance on GDP-centric EKC interpretations and facilitates cross-regional comparisons of sustainability pathways, thereby supporting adaptive governance strategies in diverse urbanizing regions.
Differential human–nature relationship evolution pathways revealed by EKC characteristics
Analysis based on the EKC model indicates that cities exhibit heterogeneous evolution pathways in human–nature relationships, rather than following a single, uniform transition trajectory. Only 147 cities exhibited identifiable EKC patterns; these cities were typically located in low-elevation and low-slope areas with higher temperature and precipitation—conditions conducive to urban expansion and infrastructure development. These cities also experienced significantly faster urban expansion and maintained higher levels of per capita GDP, facilitating earlier structural adjustment and sustained investment in green infrastructure. In contrast, non-EKC cities were more often characterized by higher elevation and steeper terrain, more limited spatial capacity for expansion, and relatively lower levels of greenspace provision. Although some of these cities exhibited rapid economic growth rates, their overall development levels remained comparatively low, and development priorities tended to dominate environmental considerations. Under such conditions, human–nature conflicts persisted, and clear EKC-type transitions were less likely to emerge.
These findings also extend existing EKC-related studies in China. Previous research has primarily examined EKC-type relationships within major urban agglomerations or selected core cities—such as the Beijing–Tianjin–Hebei region, the Yangtze River Delta, the Pearl River Delta, and the Chengdu–Chongqing metropolitan area—and has consistently reported that economically advanced and highly urbanized regions are more likely to exhibit EKC-type environmental transitions (Pan et al., 2023; Sha et al., 2025). Our results are broadly consistent with this pattern, as many of the EKC-conforming cities identified in this study are located within or adjacent to these major urban systems. Building on this, the analysis further reveals a clear quantitative and spatial pattern at the national scale. Specifically, we identify 147 cities exhibiting EKC-type relationships, of which 141 are located east of the Hu Line and only 6 to the west. This pronounced spatial concentration indicates that EKC-type dynamics are overwhelmingly distributed in eastern China, providing direct evidence of a strong east–west differentiation in human–nature relationships. This pattern aligns with previous findings that EKC relationships are more likely to be statistically significant in eastern regions, whereas western regions tend to exhibit weaker or insignificant relationships (Zheng et al., 2024). More importantly, this study goes beyond existing research by providing a more detailed and process-oriented characterization of EKC dynamics. Beyond simply testing the existence of EKC patterns, this study extracts key transition characteristics, including the timing of turning points and the corresponding HAI and EQI levels, which are rarely quantified in previous research. This study thus provides a more spatially explicit and process-oriented understanding of multi-pathway human–nature transitions across China’s urban system.
Cluster-specific and regionally coordinated governance strategies
Early-transit cities reached turning points before 2002, indicating that adjustments in development patterns and environmental governance occurred at an early stage. These cities can be regarded as early movers in advancing human–nature coordination. Governance efforts should focus on maintaining policy continuity, strengthening long-term ecological performance monitoring, enforcing stable protection of ecological spaces, and promoting low-carbon lifestyles. Given that these cities are often characterized by relatively limited greenspace provision and moderate urban expansion, policy priorities should include institutionalizing ecological redline enforcement and integrating ecological performance into long-term urban planning to sustain early gains. By contrast, long-term transition cities required, on average, more than 7 years to reach turning points, reflecting relatively slow structural adjustments and prolonged exposure to human–nature tensions. Governance priorities should therefore emphasize accelerating industrial and energy restructuring, for example, through differentiated emission standards for high-energy-consuming industries, targeted subsidies for green technology adoption, and the phased elimination of outdated production capacity. In addition, interregional pollution-control mechanisms—such as joint air quality monitoring systems and cross-jurisdictional emission trading schemes—should be established to address spillover effects associated with industrial activities.
A different pattern is observed in the low-coord group. These cities reached turning points within a shorter period; however, post-turning improvements were limited, suggesting that transformation depth remained insufficient. Given their relatively flatter terrain and intermediate-to-high levels of urban expansion, these cities exhibit potential for rapid ecological recovery if governance interventions are strengthened. Specific measures include enhancing environmental enforcement capacity, increasing transparency and public participation in environmental decision-making, and developing green finance and ecological compensation mechanisms. Moreover, introducing ecological performance benchmarks for industrial parks and incorporating green infrastructure requirements into urban renewal projects could help elevate post-transition coordination levels.
Cities in the HHAI-LEQI cluster tended to initiate environmental governance under relatively high development pressure, with high urban expansion rates, gentle slopes, and low elevation. These conditions amplify the risk of ecological degradation if expansion remains unregulated. Strengthening ex-ante environmental constraints—such as ecological redline enforcement, land-use access control, and regulation of high-emission industries—may help shift governance from reactive intervention toward preventive management. More specifically, policy interventions should include establishing urban growth boundaries to strictly limit the spatial expansion of built-up areas, implementing minimum greenspace ratio requirements in urban planning, and prioritizing the redevelopment of underutilized land to reduce pressure on ecological land conversion. Conversely, the HEQI-LHAI cluster achieved transitions under lower development pressure and realized rapid ecological improvement afterward. These cities are typically characterized by steep slopes, higher elevation, and limited urban expansion, which naturally constrain development intensity. Consolidating these advantages may involve securing long-term ecological space protection, supporting eco-friendly industrial development, and promoting governance innovation and knowledge-sharing to extend successful practices. Given their favorable baseline conditions, these cities could serve as pilot areas for testing high-stringency ecological standards and nature-based solutions.
While the above strategies focus on intra-city or cluster-level governance, many environmental processes operate across administrative boundaries. Beyond cluster-specific strategies, regionally coordinated environmental governance is essential to address cross-boundary ecological processes and pollution spillovers. Drawing on China’s major regional development strategies, differentiated coordination mechanisms can be further developed. For example, in the Beijing–Tianjin–Hebei region, where air pollution exhibits strong regional spillover effects, joint prevention and control mechanisms—such as unified air quality standards, coordinated emission reduction targets, and shared monitoring networks—have proven effective in mitigating transboundary pollution. In the Yangtze River Economic Belt, ecological protection is integrated with economic development through basin-wide governance frameworks, including ecological compensation schemes between upstream and downstream regions and strict control of industrial relocation along the river. Similarly, the Yellow River Basin emphasizes ecological conservation under resource constraints, promoting water-use regulation, ecological restoration, and cross-provincial coordination to balance development and environmental protection. Building on these experiences, future governance strategies should focus on harmonizing environmental standards across jurisdictions, establishing cross-regional ecological compensation mechanisms, and enhancing data-sharing platforms for environmental monitoring and early warning. Such coordinated approaches are particularly important for urban clusters with strong economic linkages and shared ecological pressures.
Heterogeneous roles of key driving factors
EKC theory provides an effective framework for analyzing the evolution of human–nature relationships. Random Forest analysis identified urban expansion, the proportion of park greenspace, slope, forest resilience, and elevation as the most influential factors shaping EKC-based city clustering. Rather than operating uniformly, these drivers exerted heterogeneous effects on the timing, intensity, and quality of human–nature transition pathways. Natural terrain conditions fundamentally constrained development intensity and, in turn, influenced the level of human activity at which turning points occurred. Cities located in flat and low-elevation areas tended to experience higher urban expansion rates, reaching turning points under relatively high HAI and low EQI. In contrast, high-altitude and steep-slope cities faced natural limitations on construction suitability, resulting in lower expansion intensity and earlier transitions under comparatively lower development pressure. These findings indicate that topographic constraints indirectly regulate human–nature interactions by shaping development feasibility and spatial expansion patterns. Urban expansion played a pivotal role in determining transition timing. The inverted U-shaped relationship between expansion intensity and transition duration suggests that moderate expansion facilitates timely structural adjustment, whereas excessively rapid expansion delays transition by intensifying resource consumption and environmental stress. This finding highlights urban expansion as both a growth engine and a potential risk factor for sustainability transitions, depending on its scale and regulation.
Green infrastructure emerged as a consistent facilitator of improved transition quality. Higher proportions of park greenspace were associated with shorter transition durations, higher environmental quality at turning points, and faster post-transition ecological recovery. Beyond providing ecological functions, greenspace also reflects governance capacity in spatial planning and public service provision, indicating that investments in green infrastructure contribute to both environmental resilience and institutional modernization. Forest resilience exerted dual effects. High-resilience regions tended to experience stronger pre-transition human–nature conflicts, likely because resource-rich ecosystems attracted early development pressures. However, these areas also displayed rapid ecological recovery after turning points, underscoring the importance of ecological restoration potential in shaping post-transition outcomes.
Overall, the heterogeneous roles of key driving factors demonstrate that sustainability pathways are jointly shaped by biophysical constraints, development intensity, and governance capacity. Effective policy design therefore requires aligning land-use regulation, green infrastructure investment, industrial restructuring, and ecological restoration strategies with local driver configurations, rather than applying uniform transition models.
Limitations and prospects
This study inevitably has certain limitations. First, although the HAI and EQI provide a relatively comprehensive reflection of human and natural systems, they cannot fully capture all dimensions such as cultural ecosystem services or social well-being. Future research could incorporate additional complementary indicators to enrich the analysis. Second, the present work focused on the city level, which ensures policy relevance but may obscure cross-city linkages or finer intra-city variations. Subsequent studies may extend the analysis to multiple spatial levels, especially urban agglomerations, to provide more targeted guidance for regional governance.
Conclusions
This study provides an integrated assessment of the evolution of human–nature relationships across Chinese cities over the past two decades. By jointly evaluating human activity intensity and environmental quality, this study reveals that transitions toward more harmonious human–nature interactions are highly uneven across both space and time. From a theoretical and methodological perspective, this study advances the application of the EKC framework by shifting its focus from curve validation to process characterization. Through the construction of composite indicators for human and natural systems and the introduction of EKC characteristic metrics, the EKC framework is operationalized to capture the timing, intensity, and coordination of human–nature transitions. When combined with data-driven driver analysis, this approach enables the identification of heterogeneous transition patterns across cities, thereby extending the EKC framework from a descriptive hypothesis to a structured analytical tool. By linking EKC-based classification with key drivers of change, the proposed framework provides a practical basis for diagnosing development stages and supporting stage-specific sustainability interventions and offers a transferable approach for analyzing human–nature relationships in other rapidly developing regions.
Supplemental material
Supplemental Material - Exploring the evolution of the human–nature relationship through the environmental Kuznets curve (EKC): City-level evidence from China
Supplemental Material for Exploring the evolution of the human–nature relationship through the environmental Kuznets curve (EKC): City-level evidence from China by Chaoyue Yu, Weilong Kong, Shuocun Chen, Fangzhou Xia, and Zhengfeng Zhang in Progress in Physical Geography: Earth and Environment
Footnotes
Funding
The authors disclosed receipt of the following financial support for the research, authorship, and/or publication of this article: This research was supported by the National Social Science Fund of China (No. 21AZD041), Big Data and Responsible Artificial Intelligence for National Governance, Renmin University of China, and the Outstanding Innovative Talents Cultivation Funded Programs 2024 of Renmin University of China.
Declaration of conflicting interests
The authors declared no potential conflicts of interest with respect to the research, authorship, and/or publication of this article.
Supplemental material
Supplemental material for this article is available online.
References
Supplementary Material
Please find the following supplemental material available below.
For Open Access articles published under a Creative Commons License, all supplemental material carries the same license as the article it is associated with.
For non-Open Access articles published, all supplemental material carries a non-exclusive license, and permission requests for re-use of supplemental material or any part of supplemental material shall be sent directly to the copyright owner as specified in the copyright notice associated with the article.