
Abstract
The record-breaking 2023 Canadian wildfires attracted considerable attention; however, the bidirectional feedbacks between wildfires and meteorology remain unclear. Here, we use the fully coupled Weather Research and Forecasting model with Chemistry (WRF-Chem) to investigate the dynamic interactions among wildfire emissions, aerosol–radiation interactions (ARI), and meteorological responses during this extreme event. The model reasonably reproduced the key spatial and temporal characteristics of wildfire smoke aerosols. Results show that wildfire aerosols caused substantial shortwave radiative perturbations, characterized by strong surface and top-of-atmosphere cooling, with a domain-averaged 8-day mean shortwave radiative perturbation reaching −165 W m−2, and pronounced atmospheric heating of up to +140 W m−2. These effects spatially aligned with regions of elevated optical depth (AOD). The atmospheric heating, primarily driven by light-absorbing carbonaceous aerosols (CAs), enhanced atmospheric stability and suppressed turbulent mixing, while also leading to reduced cloud formation and drying of the upper troposphere. As a result of the enhanced stability, the planetary boundary layer height (PBLH) decreased locally by up to ∼500 m, accompanied by reduced near-surface wind speeds. Importantly, increased humidity and weakened winds suppressed fire potential, suggesting that dense smoke plumes modified local meteorology in ways that inhibited further wildfire spread. These findings highlight the critical role of fully coupled models in capturing the complex wildfire–aerosol–radiation–meteorology feedback loop and emphasize the importance of representing two-way fire–weather interactions in future wildfire prediction and mitigation efforts.
Introduction
Wildfires, defined as uncontrolled combustion in natural ecosystems, constitute one of four the major biomass burning types (Chen et al., 2017; Lecina-Diaz et al., 2021). In recent years, driven by anthropogenic global warming and internal variability of the climate system, the frequency of extreme wildfire events has increased worldwide: in 2023, Canada experienced unprecedented wildfire burn areas and carbon emissions; the European Union recorded the largest single wildfire in its history; extensive fires broke out across the Amazon Basin, including Brazil and Venezuela; and in 2025, large-scale wildfires occurred in California, USA (Jain et al., 2024; Jato-Espino et al., 2025; Kolden et al., 2024; Mataveli et al., 2024). These regional extreme wildfire events have had profound impacts that should not be underestimated. From a global perspective, the total burned area has declined by approximately 25% this century due to reduced savanna fires (Andela et al., 2017), however, the extensive burn areas associated with these extreme wildfire events at regional scales indicate that focusing solely on global wildfire trends may underestimate the impact and evolving characteristics of wildfire activity at the regional level (Jones et al., 2024).
During wildfire events, the combustion of vegetation causes severe disruption to ecosystems and human settlements. For instance, the 2023 Canadian wildfires forced the evacuation of approximately 232,000 people (Kolden et al., 2024). In addition to these direct impacts, wildfires release large quantities of smoke containing carbonaceous aerosols (China et al., 2013; Palm et al., 2020), which are mainly composed of black and organic carbon (Chung and Seinfeld, 2002) and initiate complex atmospheric interactions. These processes include aerosol-radiation interactions (direct effects), cloud microphysical modifications through cloud condensation nuclei activation (indirect effect), and affect cloud dynamics by changing atmospheric stability and humidity distribution (semi-direct effect) (Crippa et al., 2016; Huang et al., 2006, 2014). Collectively, these interactions influence not only fire behavior but also regional weather and climate anomalies (Huang et al., 2023).
Both observational evidence and model simulations indicate that, although meteorological conditions primarily control wildfire behavior, wildfire-emitted aerosols can subsequently modify local weather through radiative effects, thereby affecting wildfire development (China et al., 2013; Huang et al., 2023; Palm et al., 2020; Wu et al., 2025). For example, using climate model simulations of the 2019–2020 Australian fires, Wu et al. (2025) found that wildfire smoke induced more than −100 W m−2 of surface cooling, which suppressed fire emissions by lowering surface temperatures and wind speeds. Huang et al. (2023) studied the interaction between pressurized wildfires and weather in the U.S. West Coast and Southeast Asia, and found that radiative effects of soot aerosols altered the height of the boundary layer, causing surface drying and thus increasing wildfire emissions. The conclusions of the two studies were reversed, largely due to differences in water vapor distribution and sources in different regions (Huang et al., 2023), suggesting that weather is particularly important in influencing wildfires.
Most current research has focused on greenhouse gas emissions, long-range pollutant transport, and public health impacts of wildfires (Byrne et al., 2024; Cooper et al., 2024; Flannigan et al., 2005). A notable example is the study of record-breaking wildfires in Canada in 2023. Wildfires that were previously predicted to occur only later in the century erupted earlier in Canada (Flannigan et al., 2005), with a total burned area of 15 Mha and carbon emissions four times higher than Canada’s annual fossil fuel emissions (Byrne et al., 2024; Jain et al., 2024). Previous studies have examined the impacts of these wildfires on surface ozone concentrations in North America (Cooper et al., 2024), transboundary aerosol pollution (Wang et al., 2024), and even global greenhouse gas concentrations. However, despite extensive research on atmospheric composition and climate implications, limited attention has been paid to the dynamic interactions between wildfire smoke, radiation, clouds, and local meteorological conditions during active burning phases. Specifically, the effects of smoke-induced radiative perturbations and meteorological feedbacks on wildfire development remain poorly understood. The 2023 Canadian wildfires triggered six widespread air pollution events from April through October, with the fourth (July 12–19) being the most polluted burning more intensely (Wang et al., 2024). Focusing on the most intense burning phase of the 2023 Canadian wildfires (July 12–19), this study aims to address these knowledge gaps by investigating the coupled interactions among wildfire emissions, radiation, and meteorology.
Materials and methods
Model evaluation data
The online coupled meteorology and chemistry model of WRF-Chem (version 3.9.1) was used to simulate this wildfire event and to investigate the interactions between wildfires and weather. The model contains a variety of coupled physical and chemical processes (Forkel et al., 2015; Grell and Dévényi, 2002; Grell et al., 2005). Different physics configurations selected include the Morrison two-moment microphysics scheme (Morrison et al., 2009), the rapid radiative transfer model (RRTMG) for longwave and shortwave radiation schemes (Iacono et al., 2008), the Grell 3D cumulus scheme (Grell and Dévényi, 2002), the Noah land surface model land surface scheme (Chen and Dudhia, 2001), and the Yonsei University (YSU) planetary boundary layer scheme (Hong et al., 2006). Chemistry is configured with the Model for Ozone and Related chemical Tracers (MOZART) gas phase chemical mechanism with the Model for Simulating Aerosol Interactions and Chemistry (MOSAIC) (Emmons et al., 2010). The MOSAIC aerosol scheme used in this study employs the sectional approach to characterize the aerosol size distributions and maps them into four bins (Zaveri et al., 2008). MOSAIC simulates the major aerosol components, for example nitrates, sulfates, ammonium, black carbon, primary organic aerosols, and other inorganic aerosols (Zhao et al., 2010). The detailed model configurations are summarized in Table S1.
The analysis period spans from 12 to 19 July 2023, while the model was initialized 7 days earlier (5–11 July) as a spin-up period. The model domain includes 29 vertical layers from the surface up to 50 hPa and one nested horizontal domain with a resolution of 25 × 25 km, covering the major wildfire-affected regions in Canada (Figure 1(a)). The domain consists of 330 × 210 grid cells (west-east and north-south, respectively). To improve the initial chemical and boundary conditions, the Whole Atmosphere Community Climate Model (WACCM) (Gettelman et al., 2019) for simulation outputs (https://www.acom.ucar.edu/waccm/download.shtml), and the meteorological initial and boundary conditions were derived from the National Centers for Environmental Prediction (NCEP) final analysis data (https://rda.ucar.edu/datasets/ds083.2), which has a 1° × 1° horizontal resolution and 6 h temporal interval. Figure 1(b) shows the spatial distribution of wildfire occurrences during the study period. The blue rectangle indicates the core fire source region, which represents the main focus area of this study. (a) Map of the WRF-Chem simulation domain (D01; black line), with the locations of AERONET sites (red circles), meteorological stations (purple squares), and air quality monitoring sites (black triangles) used for model evaluation. (b) Spatial distribution of fire points (red dots) over Canada derived from MODIS satellite observations during 12–19 July 2023. The blue rectangular box represents the wildfire affected area (52°N–68°N, 110°W–130°W).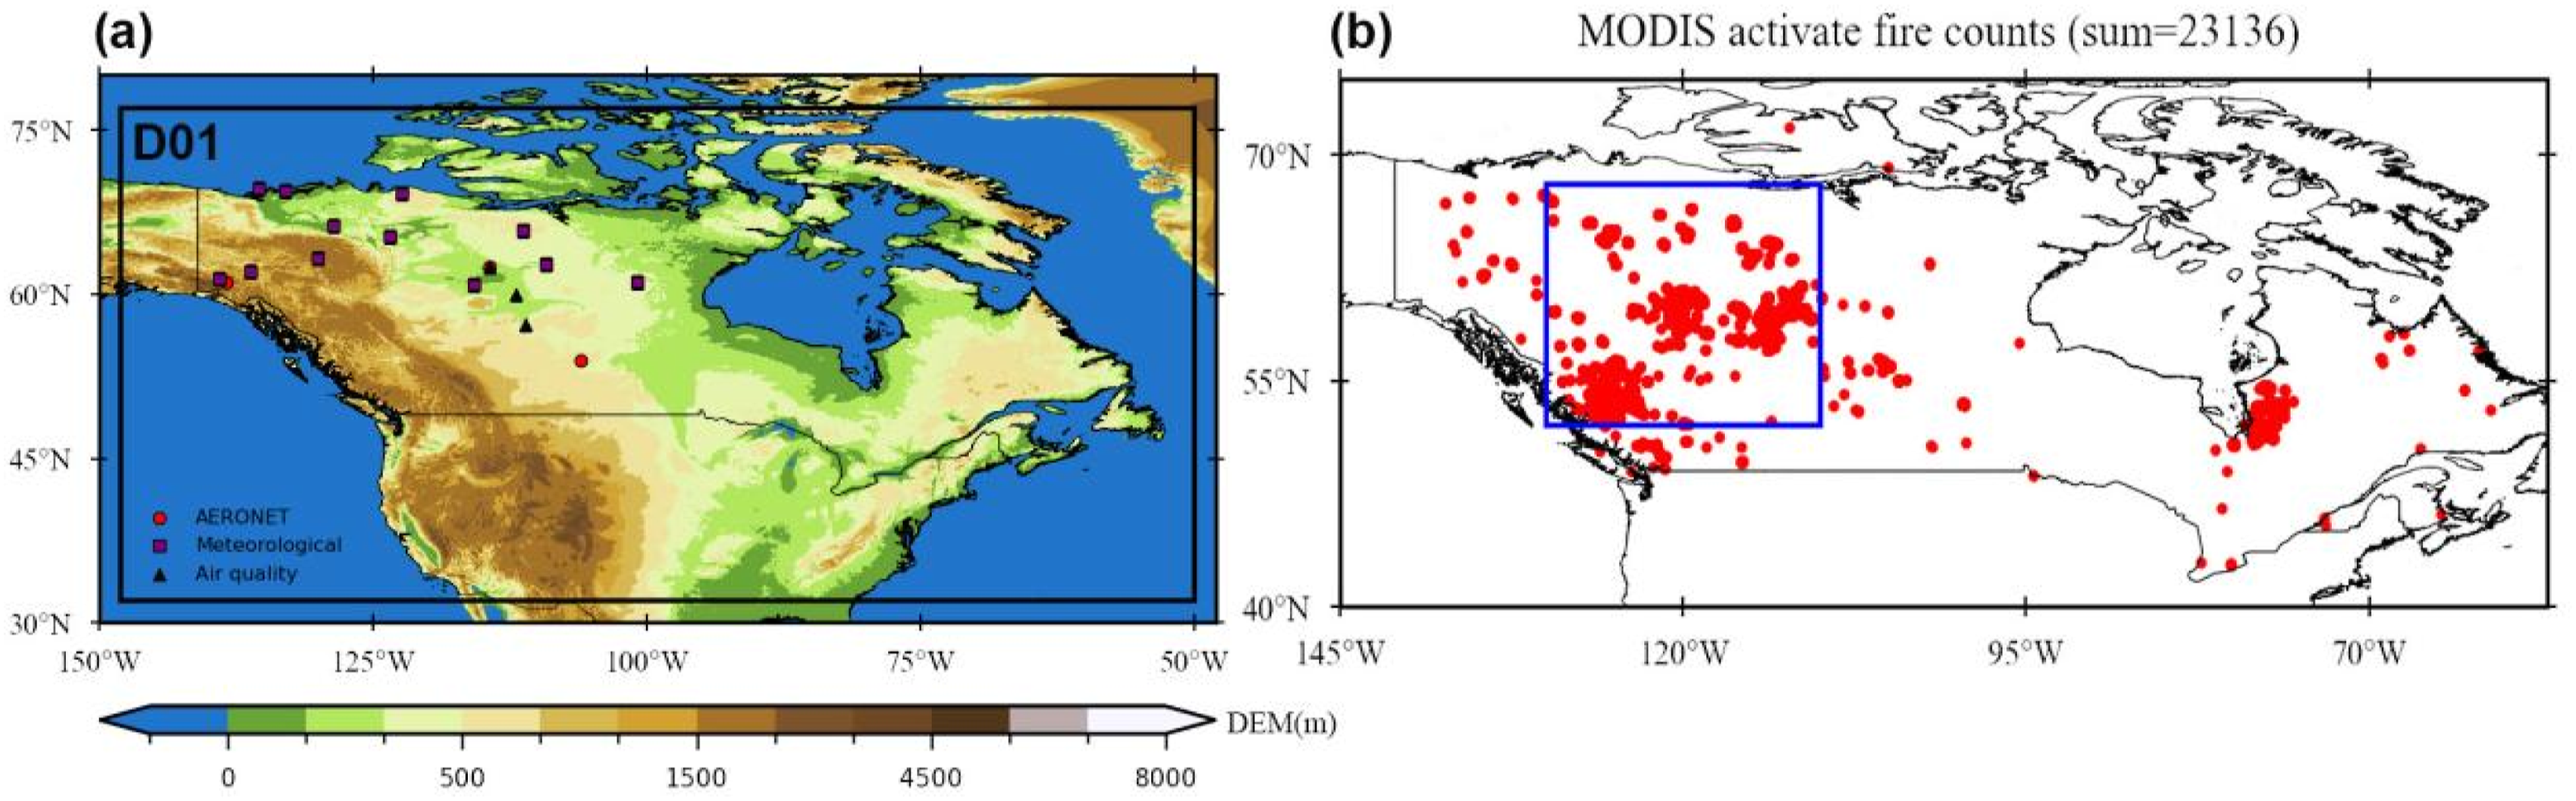
Anthropogenic emissions data from the Hemispheric Transport of Air Pollution emission inventory of Emissions Database for Global Atmospheric Research (EDGAR-HTAP) which provides estimates of monthly global anthropogenic emissions (Crippa et al., 2020), the Model of Emissions of Gases and Aerosols from Nature (MEGAN) was used to calculate biogenic emissions online within the model (Guenther et al., 2012). The biomass burning emission data were taken from FINN (the Fire Inventory from NCAR, https://www.acom.ucar.edu/Data/fire/). In this study, emissions data from FINN version 2.5 (FINN v2.5) were utilized, generated by a model that integrates satellite observations of fire locations and land cover with emission factors and fuel load estimates to produce daily high-resolution (1 km) gridded emissions for regional and global chemical transport modeling (Wiedinmyer et al., 2011, 2023).
Observations and other data
Observation
The meteorological simulation outputs from the WRF-Chem model using observed meteorological data, including 2-m air temperature (T2), 2-m dew point temperature (Td), and 10-m wind speed (WS10), obtained from NOAA’s National Climatic Data Centre (https://www.ncei.noaa.gov/maps/hourly/). Missing values were supplemented using observational data from neighboring time points. If neighboring time points also contained missing values for a given monitoring station, that station was excluded from subsequent data validation (Cao et al., 2016). Based on this approach, we successfully validated wildfire-related data from 12 monitoring stations in this study.
The Aerosol Robotic Network (AERONET, https://aeronet.gsfc.nasa.gov/) is a global shared network of ground-based aerosol observations established by NASA, with data derived from observations from automated solar photometers of uniform standards (Dubovik et al., 2000).The project is a common public domain database for aerosol research and characterization, validation of satellite inversions, and synergy with other databases. The AOD results from WRF-Chem were validated using AOD observations from three available AERONET sites.
Other data
The Clouds and the Earth’s Radiant Energy System (CERES) project, developed by NASA, provides comprehensive observations of Earth’s radiative fluxes. In this study, surface shortwave radiation simulated by WRF-Chem was evaluated using the CERES SYN1deg Level-3 product, which provides daily gridded surface radiative fluxes (https://ceres.larc.nasa.gov/Data/). The Modern Era Retrospective analysis for Research and Applications, Version 2 (MERRA2, https://daac.gsfc.nasa.gov/), provides traditional atmospheric products and chemical components, including aerosols and greenhouse gases, since 1980 (Buchard et al., 2017). With a spatial resolution of 0.625° longitude × 0.5° latitude, the accuracy of the product has been extensively evaluated, and are widely used to investigate and validate the interactions between aerosols and key physical processes within the climate system (Che et al., 2019; Zhang et al., 2023). In this study, the MERRA-2 instantaneous 3D aerosol product (MERRA2_inst3_3d_aer_Nv) was specifically used to obtain the carbonaceous aerosol mixing ratios for comparison with WRF-Chem simulated carbonaceous aerosols. Other MERRA-2 products, including meteorological variables and AOD, were also employed for supporting analyses. The fifth-generation European Re-Analysis (ERA5, https://cds.climate.copernicus.eu/cdsapp#!/home) provides hourly global reanalysis data from January 1940 to the present, including atmospheric, terrestrial, and oceanic climate variables (Hersbach et al., 2020). It is commonly employed to analyze both historical and contemporary weather and climate conditions. In this study, the above reanalysis data were utilized to analyze the spatial distribution of meteorological variables during the wildfire event, in conjunction with those simulated by the WRF-Chem model. Moreover, the spatial distribution of WRF-Chem aerosols was evaluated using the AOD data product from the MODIS Aqua Level-3 daily gridded aerosol product (MYD08_D3, Collection 6.1, https://ladsweb.modaps.eosdis.nasa.gov/search/order/) and the aerosols index (AI) of the Ozone Monitoring Instrument (OMI, https://disc.gsfc.nasa.gov/) (Justice et al., 2002; Torres et al., 2007).
Methodology
Two comparative experiments were implemented to investigate wildfire impacts on radiative balance, meteorological parameters, and atmospheric stability: (1) The control simulation (CON) incorporated all emission sources, whereas (2) the sensitivity simulation (SEN) excluded biomass burning emissions. The differential response (CON−SEN) isolates the radiative effects attributable to wildfire aerosols and their subsequent meteorological feedbacks.
The development and spread of wildfires determine smoke emissions, which further affect local air pollution and thus weather conditions. To assess the influence of weather condition changes on wildfire activity, we calculated the Large Fire Potential (LFP) (Rolinski et al., 2019) and Canadian Forest Fire Weather Index (FWI) (Wagner, 1987).
The large fire potential index (LFP) evaluates the risk of persistent high-intensity fires driven by meteorological changes, with values ranging from 0 to 20, where greater values correspond to greater fire sustainability risks. It is calculated using the formula:

The Canadian Forest Fire Weather Index (FWI) system consists of six components that account for both fuel moisture conditions and the influence of meteorological factors on fire behavior. The detailed calculation of the FWI index has been described in previous studies (Wagner, 1987). In this study, the fire indices are driven by either reanalysis data or meteorological simulations from WRF-Chem.
Wildfire evolution is closely linked to meteorological conditions, and previous studies have employed fire weather indices to quantify the relationship between wildfire emissions and meteorology, demonstrating a reasonably strong linear relationship between the two (Huang et al., 2023; Wu et al., 2025). Following the same rationale, we calculated the correlations between the fire weather indices (FWI and LFP) and the concentrations of carbonaceous aerosols (CAs) and PM2.5 (Supplementary Figure S1). The results show that FWI exhibits correlation coefficients of 0.63 and 0.58 with PM2.5 and CAs, respectively, while LFP shows corresponding correlations of 0.60 and 0.55. These results indicate that, within the study region, fire weather indices are moderately correlated with pollution intensity, supporting their interpretability as proxies for wildfire activity in the absence of fully coupled fire–atmosphere modeling.
Radiative effects (RE) is defined as the perturbation of radiative fluxes at the top of the atmosphere (TOA) and at the bottom of the atmosphere (BOT), along with the perturbation of the radiative heating and cooling of the atmosphere (ATM) when specific aerosol species are removed. The RF is computed as (Jin et al., 2024):

Results
Model evaluation
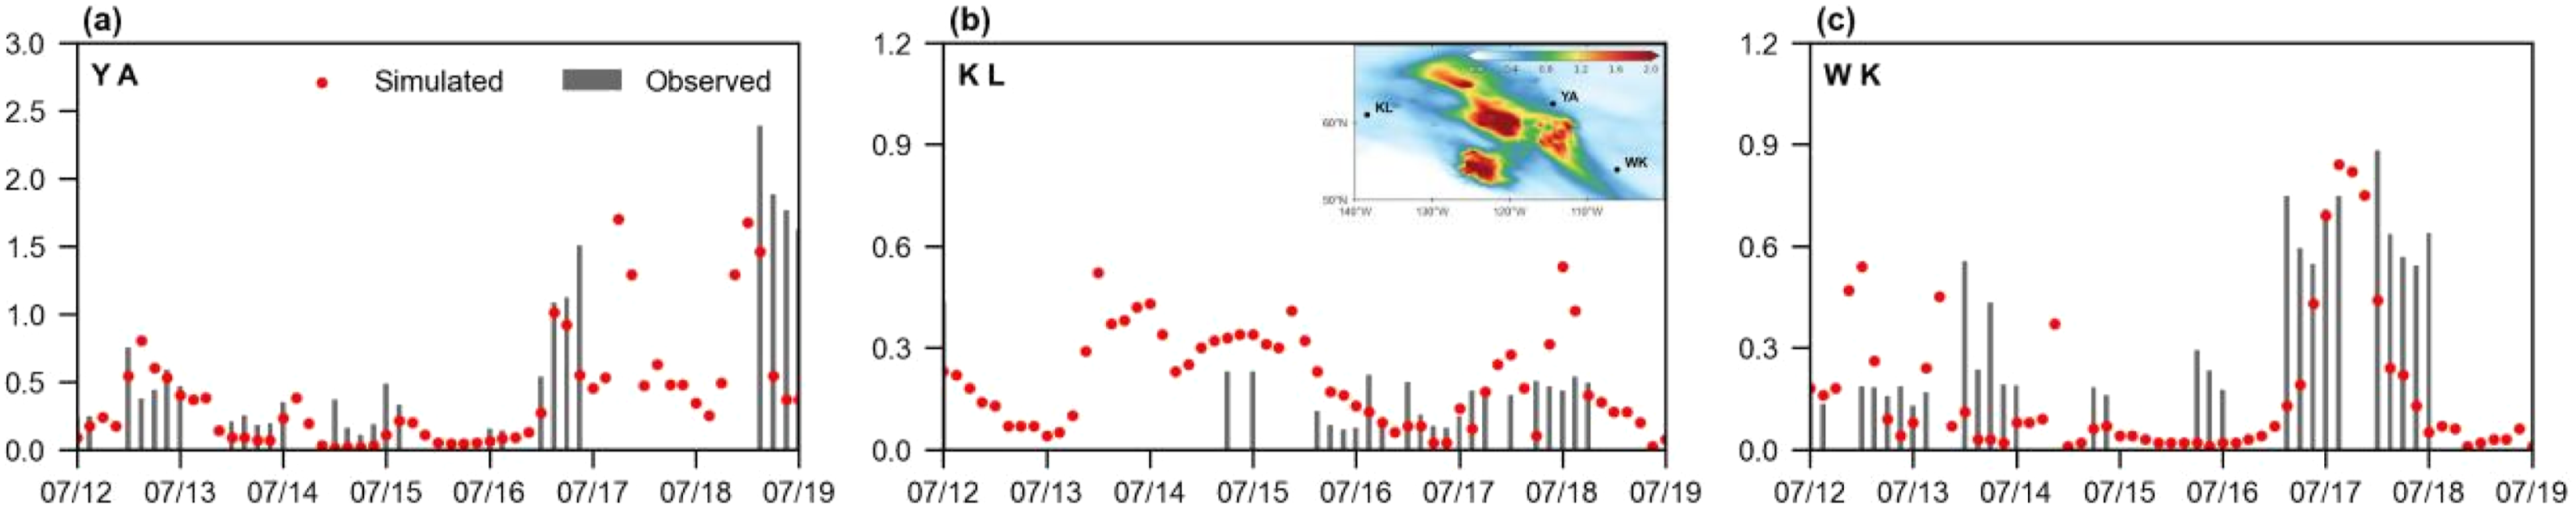
The model’s capability to realistically simulate wildfire events plays a critical role in accurately assessing wildfire-induced radiative effects and meteorological perturbations. Figure 2 presents the spatial distribution of 550 nm aerosol optical depth (AOD) and carbonaceous aerosols (CAs) concentrations during the simulation period. Satellite observations (Figure 2(a2)) indicated that intense wildfire activity and associated soot emissions primarily occurred over northwestern Canada, with the emitted aerosols forming a distinct northwest-to-southeast transport band. Along this transport path, AOD values declined from >2 near the fire source to approximately 0.4 within the 52°N–68°N, 130°W–110°W region. Both MERRA2 (Figure 2(a3)) and WRF-Chem (Figure 2(a1)) reproduced this transport pattern well, capturing the spatial gradient and magnitude of the smoke plume. In addition, WRF-Chem equally well reproduced the spatial distribution of CAs concentrations (Figure 2(b1)) compared to MERRA2 (Figure 2(b2)). Although some of the aerosol signals in the model are masked by the observations, the absorbing aerosol index (AI) from OMI (Figure 2(b3)) further supports the plausibility of the simulated CAs distribution during the wildfire episode. Figure 3 shows the temporal variation of AOD at 550 nm, as validated against AERONET observations at three sites with valid records. Both simulations and observations captured the timing and intensity of the aerosol peaks, especially near the fire source (Figure 1(b)), where the correlation coefficient (R) reached 0.79, indicating strong agreement. The validation of aerosol spatial distribution in WRF-Chem simulation. (a1) Time-averaged spatial distribution of 550 nm aerosol optical depth (AOD) simulated by the WRF-Chem model averaged over 12–19 July 2023. The black rectangles marked as (a) (52°N–68°N, 110°W–130°W) represent the main areas where wildfires occur, (a2) Time-averaged MODIS, and (a3) time-averaged MERRA2 from July 12 to 19, 2023. (b1) Time-averaged spatial distribution of carbonaceous aerosols (CAs) simulated by the WRF-Chem model during the same period (units: ppbm), (b2) time-averaged CAs from MERRA-2, and (b3) time-averaged aerosol index (AI) retrieved from OMI for the same period. Time series of daily average AOD (550 nm) simulated by WRF-Chem (red dot) and AERONET sites (gray column). (a) The Yellowknife Aurora site; (b) The Kluane Lake site; (c) The Waskesiu site.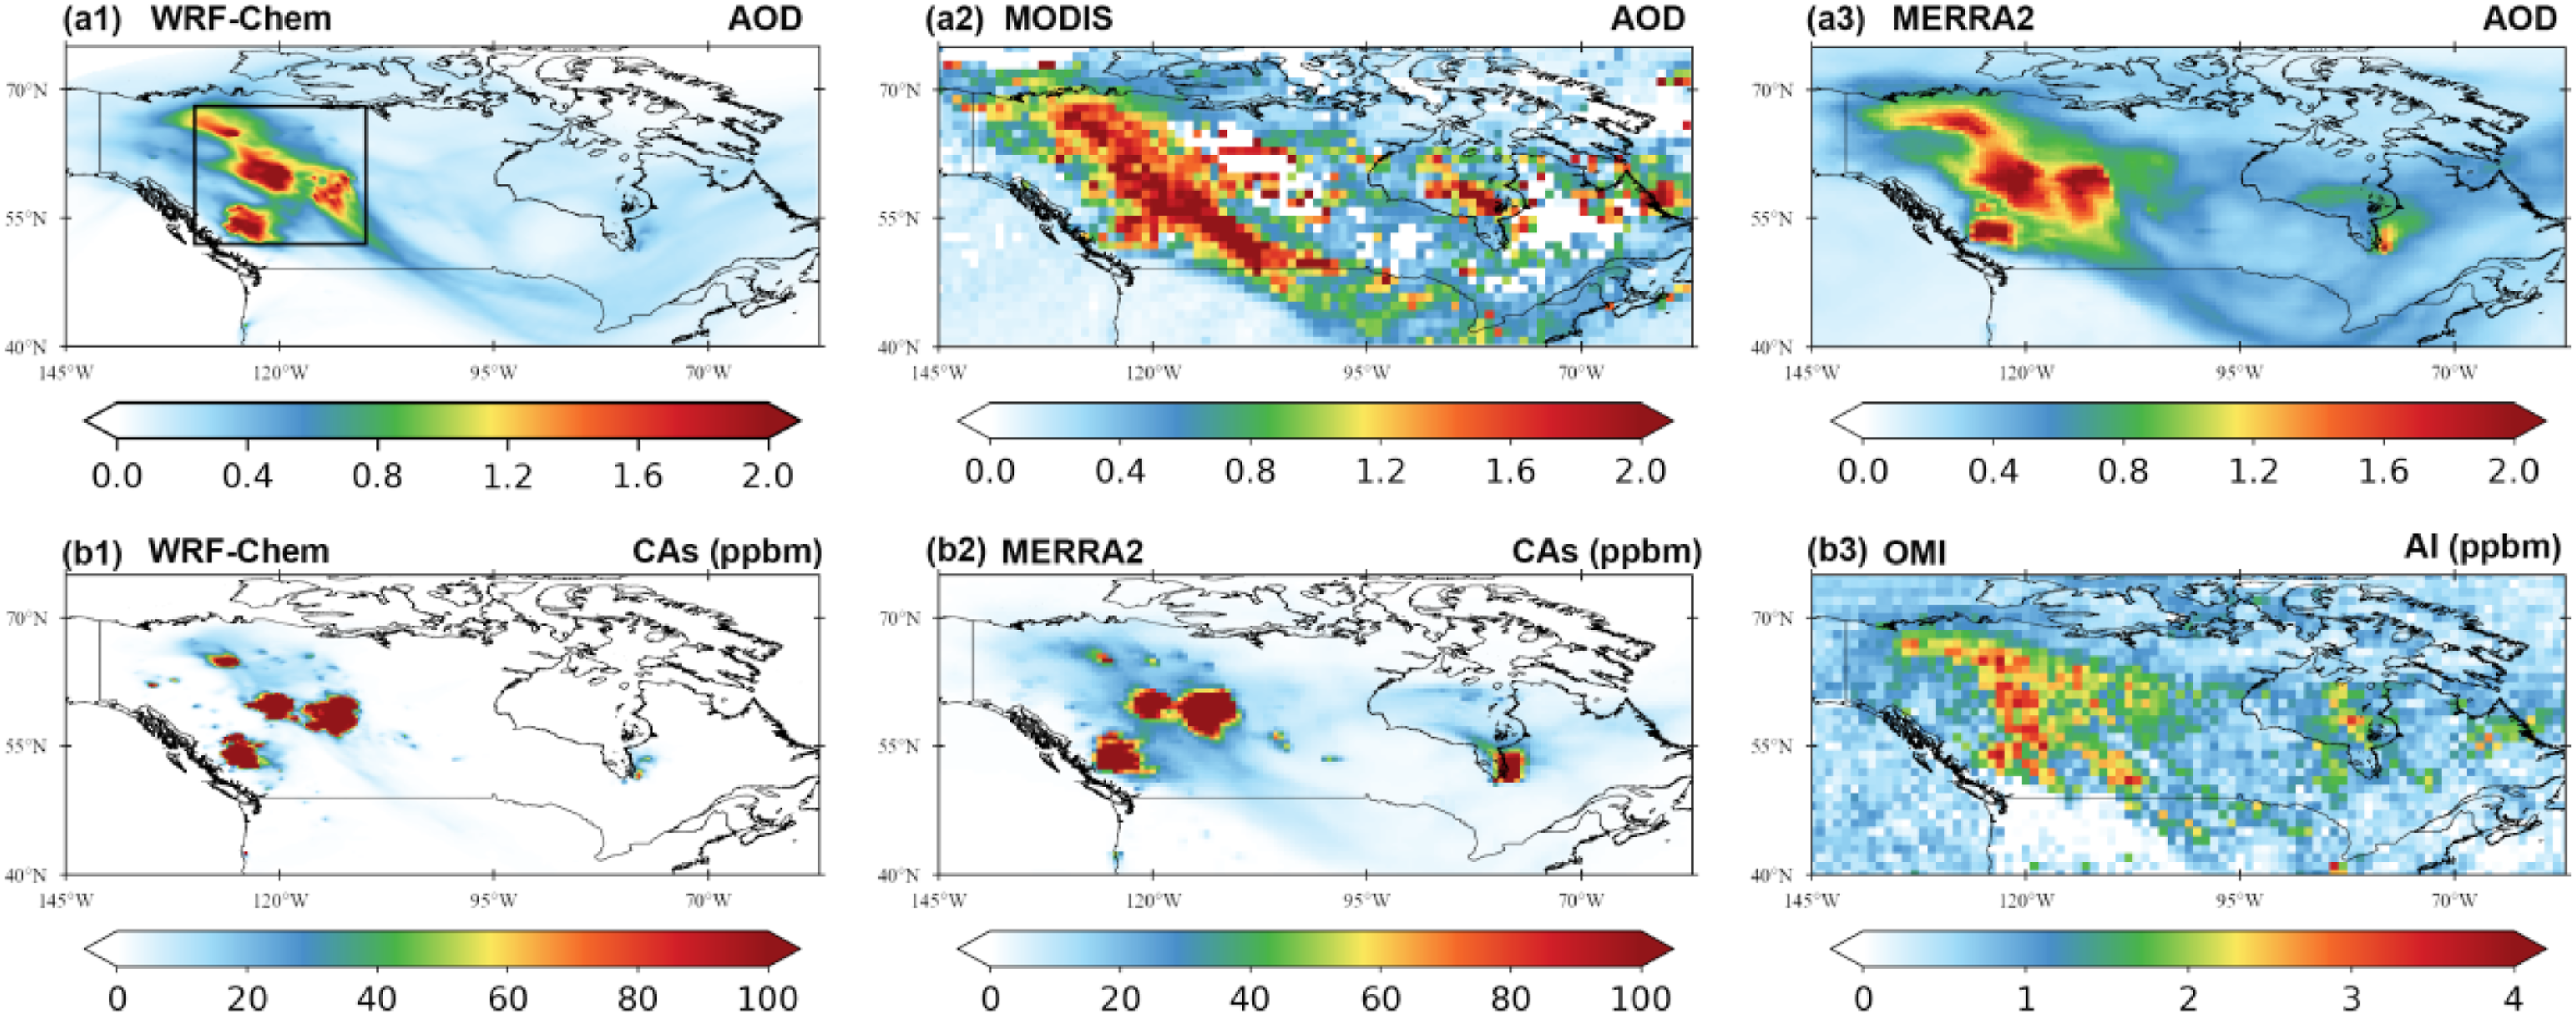
The performance of WRF-Chem in simulating near-surface meteorological variables was further evaluated using observations from 12 NOAA meteorological stations. The simulated 2-m air temperature and 2-m relative humidity (Figure 4) closely matched observations, with correlation coefficients of 0.97 and 0.95, respectively, and deviations within acceptable limits. The 10-m wind speed also exhibited a reasonable agreement (R = 0.85), although some discrepancies were observed. The root mean square error (RMSE) for WS10 was 0.57, and the mean bias (MB) was −0.36, both within acceptable thresholds (Yang et al., 2022). Meanwhile, the bias in WRF simulated near-surface wind speed has been commonly reported in previous studies, which may be attributed to the model’s limitations in accurately representing urban surface characteristics (Li et al., 2015; Qiu et al., 2017; Zhang et al., 2010). Furthermore, Figure S4 in Supplementary evaluates the spatial distribution of key meteorological variables simulated by WRF-Chem, using reanalysis data from ERA5 and MERRA2 as references. The model reasonably reproduced the spatial patterns of the meteorological fields during the wildfire period. Overall, the simulation reproduced both the temporal and spatial characteristics of meteorological conditions and aerosol distributions with high fidelity. Comparison of 3-hourly observed and simulated surface meteorological variables of (a) 2 m temperature (T2), (b) 10 m wind speed (WS10), and (c) 2 m relative humidity (RH2), averaged over meteorological 12 observation stations.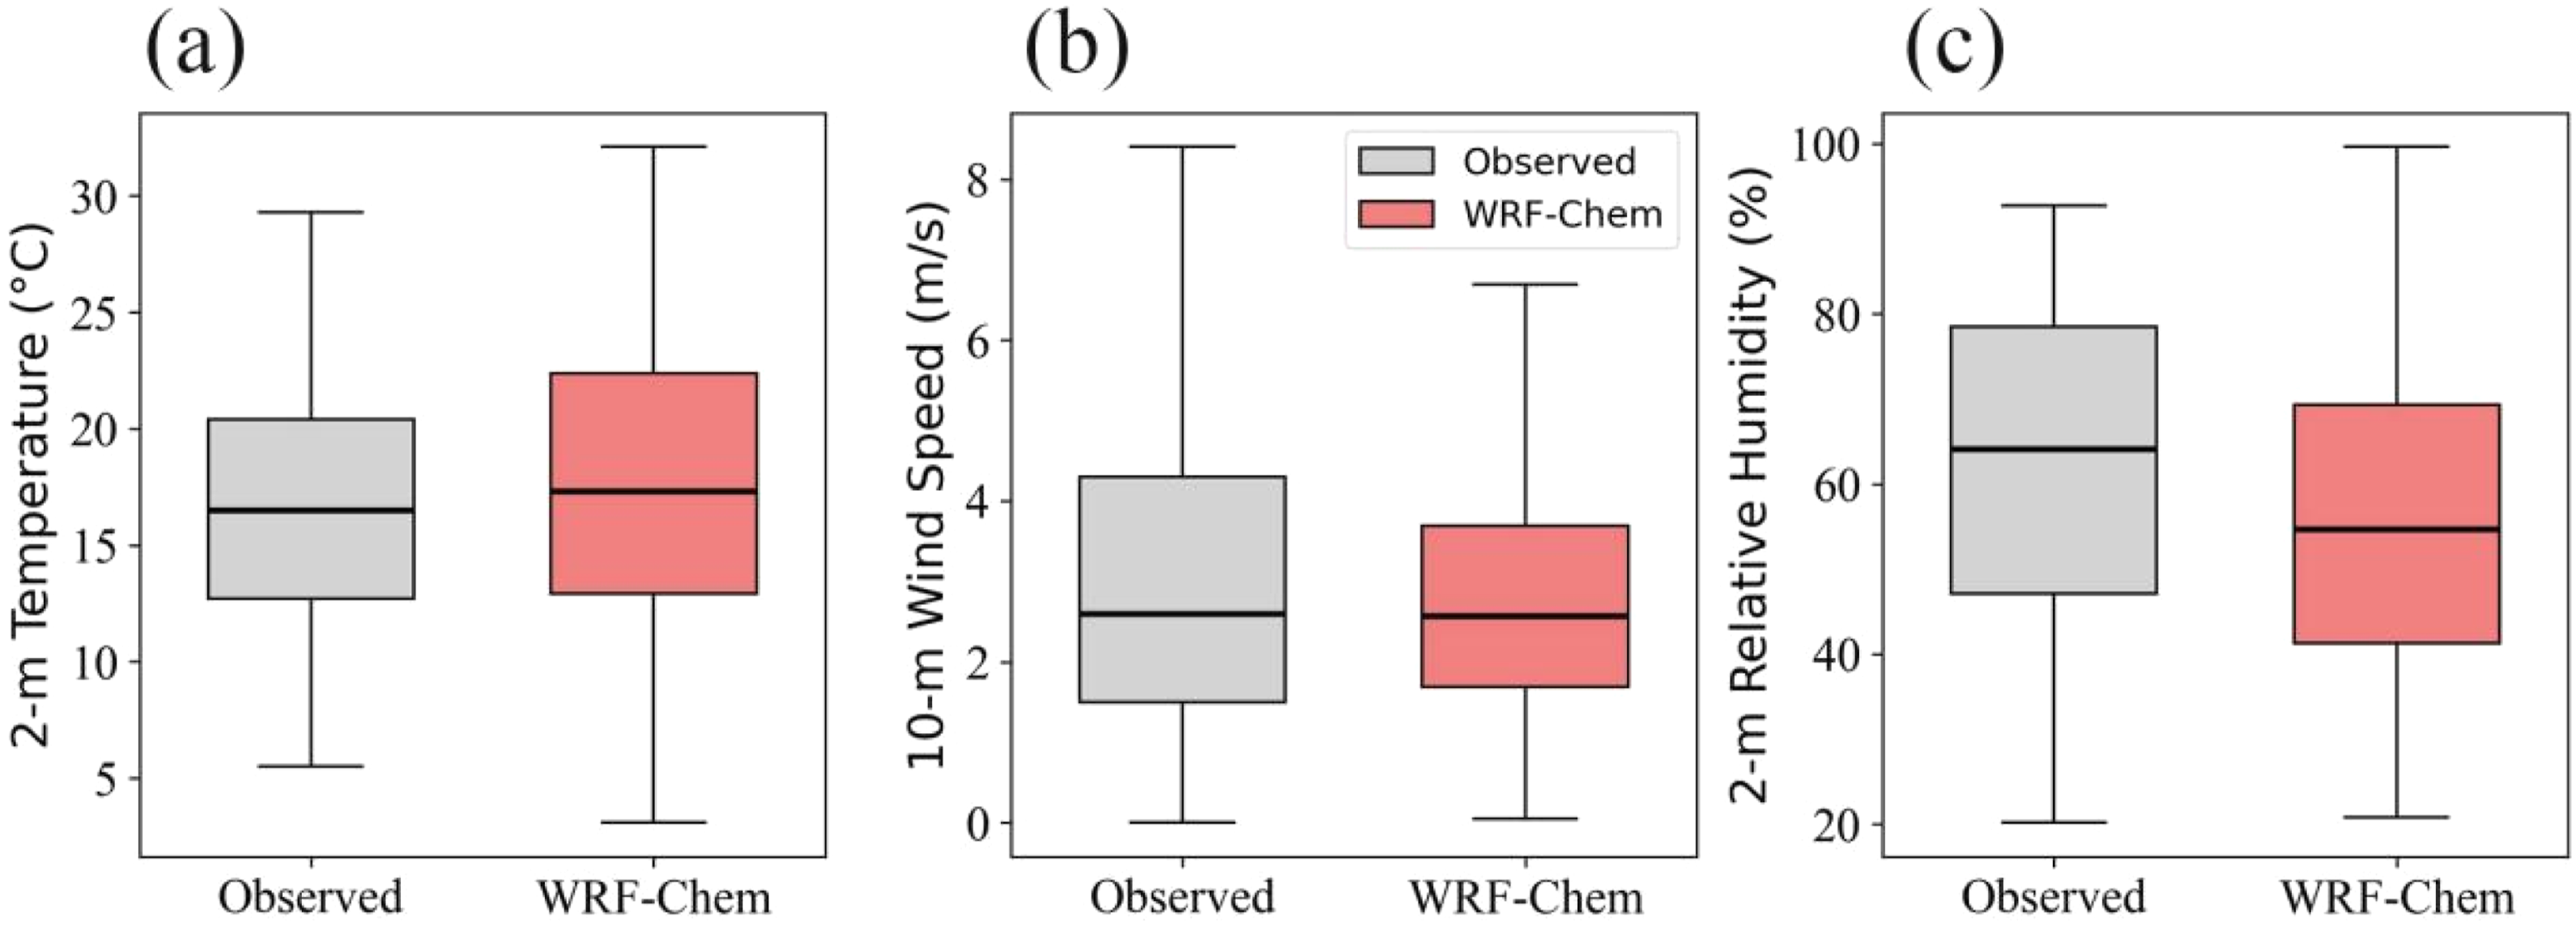
In addition to aerosols and near-surface meteorology, WRF-Chem’s simulated shortwave (SW) surface radiative fluxes and planetary boundary layer height (PBLH) were evaluated against CERES SYN1deg Level-3 data (Supplementary Figure S2) and ERA5 reanalysis (Supplementary Figure S3), respectively. While slight overestimations occur in some regions, the model successfully captures the overall spatial patterns, temporal variability, and wildfire-induced perturbations, confirming its reliability for analyzing aerosol–meteorology interactions. A sensitivity test removing non-absorbing smoke confirmed that the observed atmospheric heating is primarily driven by absorbing wildfire aerosols (Supplementary Figure S5), further supporting the model’s ability to reproduce aerosol–radiation–meteorology interactions.
Wildfire effects on radiation
Radiative effect (RE) is a standard metric commonly used to quantify the impact of aerosols on weather and climate at both regional and global scales. Wildfires emit large quantities of carbonaceous aerosols—primarily black carbon (BC) and organic carbon (OC)—which interact locally near the source regions and are subsequently lofted into the atmosphere. BC contributes to atmospheric warming by absorbing solar radiation and thereby reducing the energy reaching the surface, whereas OC enhances the reflection of solar radiation at the top of the atmosphere, leading to a cooling effect in both the atmosphere and at the surface. Considering aerosol–radiation interactions, this study examines the radiative effect of wildfire aerosols on shortwave (SW) radiation at the bottom of the atmosphere (BOT), within the atmosphere (ATM), and at the top of the atmosphere (TOA). Figure 5(a)–(c) presents the spatial distributions of average wildfire-induced SW radiative perturbations (calculated as the difference between CON and SEN experiments) at BOT, ATM, and TOA over the simulation period. Across Canada, aerosols exhibit a net warming effect within the atmosphere, while RE at both the surface and TOA is negative. The horizontal pattern of RE closely resembles the simulated aerosol optical depth (AOD) distribution (Figure 2), especially over the central and western Canadian regions near the wildfire sources (55°N–65°N, 125°W–105°W). Differences in wildfire-induced radiative and dynamical responses between WRF-Chem simulations with and without biomass burning (BB) emissions (CON−SEN) during July 12–19, 2023.(a)–(c) Differences in average shortwave (SW) RE (W m−2) at the bottom (BOT), within the atmosphere (ATM), and at the top of atmosphere (TOA), (d) Difference in heating rate (RH, K d−1) at 600 hPa, (e) Vertical cross-section along the wildfire center (red line in (d)) showing differences in heating rate (HR, K d-1), (f) Same as (e), but for vertical wind (m s−1).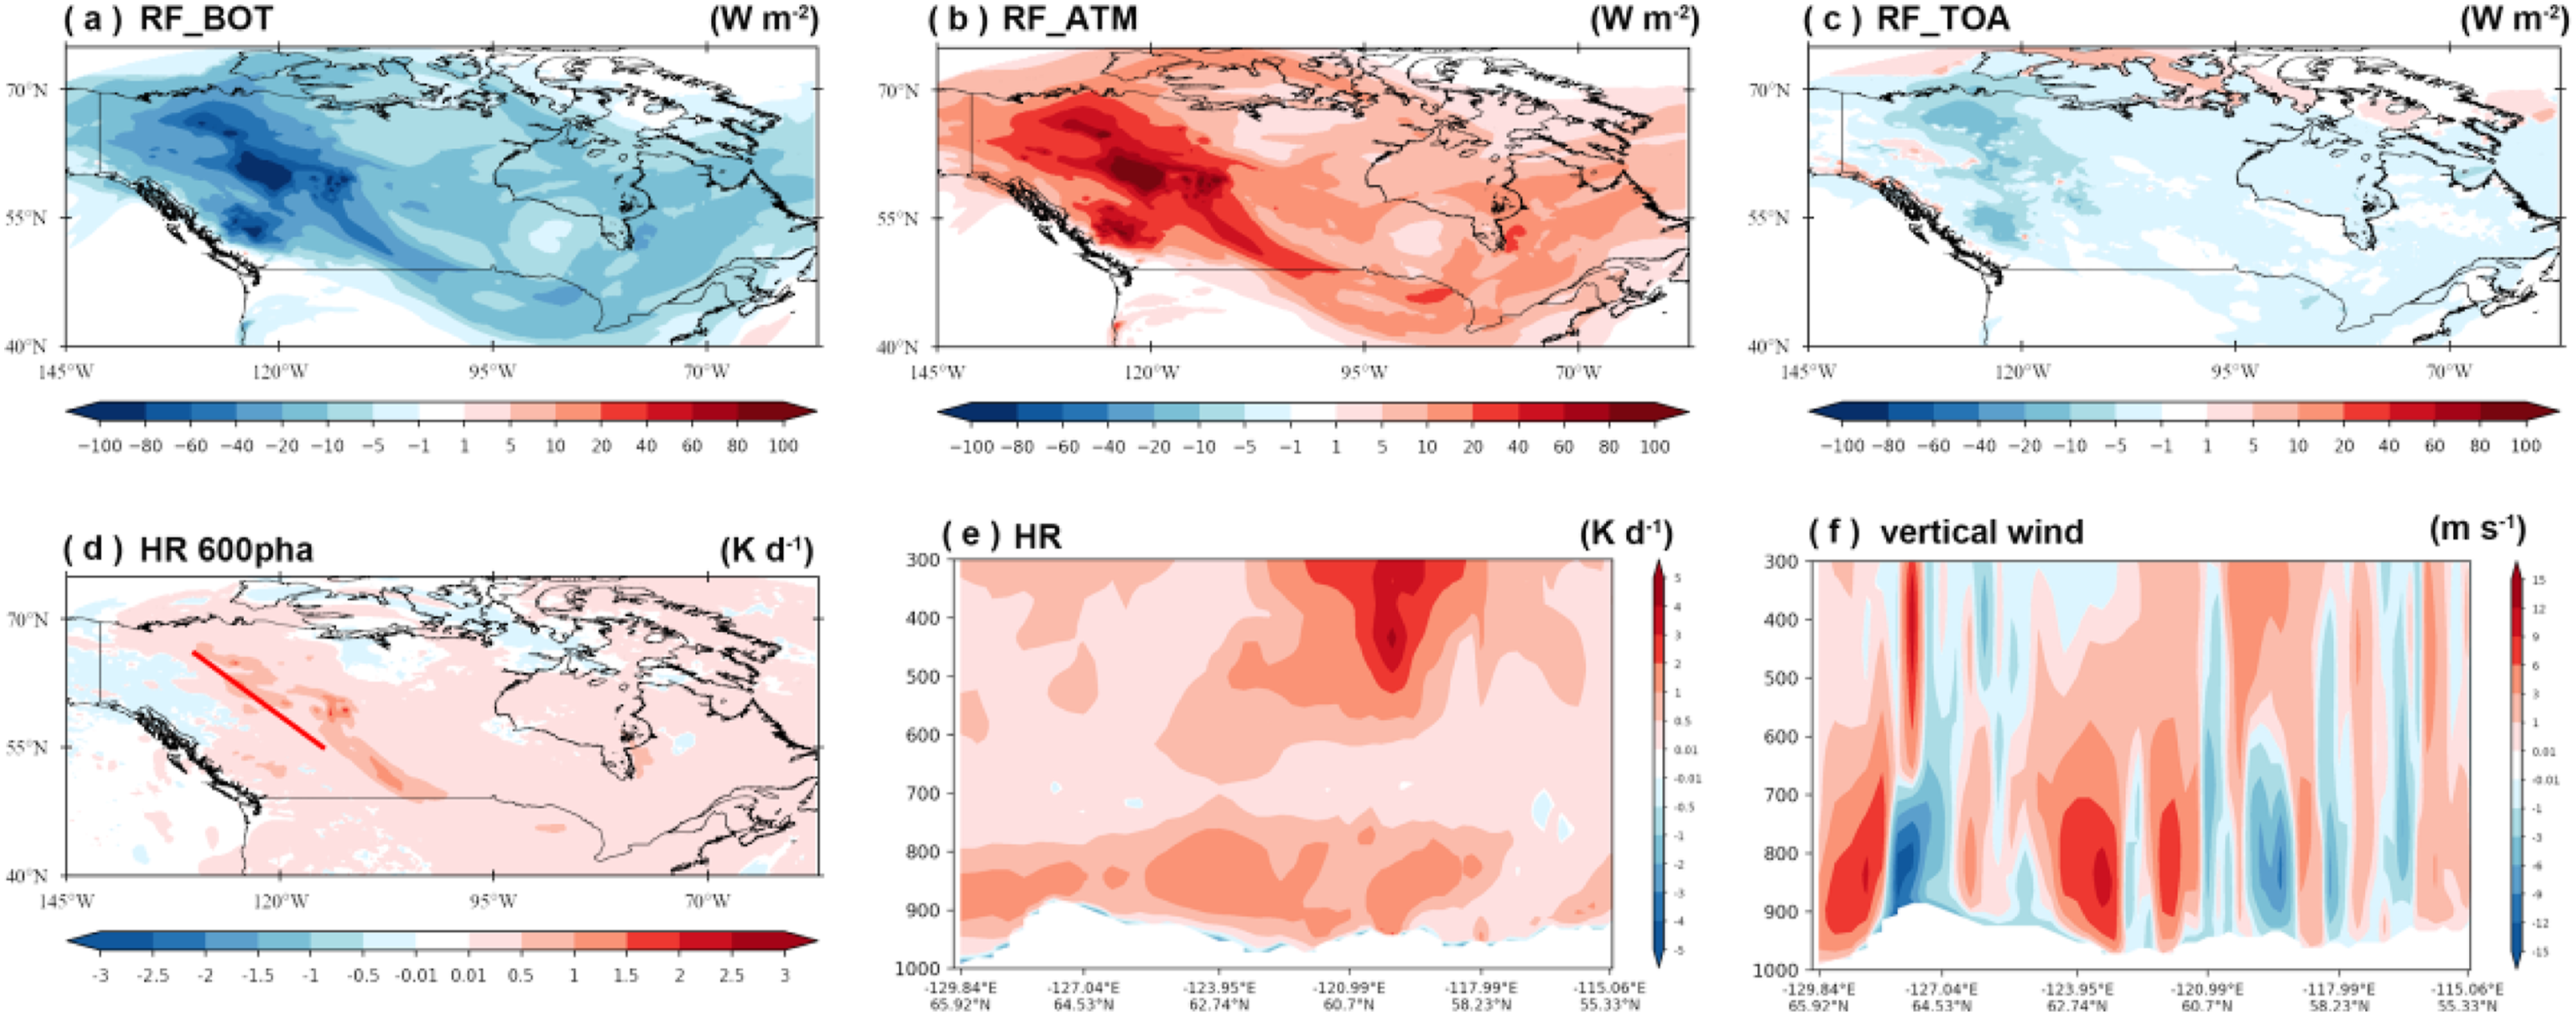
At the surface (Figure 5(a)), the most intense radiative perturbations occurred over British Columbia and its surrounding areas, with maximum negative RE reaching −165 W m−2. Due to atmospheric transport, the radiative impacts extended eastward to Alberta, Saskatchewan, and Manitoba, where RE values typically ranged between −20 and −60 W m−2. In the atmosphere (Figure 5(b)), carbonaceous aerosols from wildfire smoke induced significant heating, with maximum atmospheric RE values up to 140 W m−2 over British Columbia and adjacent regions, mirroring the spatial distribution of surface RE. To validate the atmospheric heating effect induced by wildfires, Figure 5(d) shows the heating rate (HR) at 600 hPa. A positive HR is evident across much of Canada, with spatial patterns aligning well with the RF distribution. In particular, the hatched areas highlight regions where wildfire-induced heating exceeds +0.5 to +1.5 (K day−1). A vertical cross-section of HR within this area (Figure 5(f)) indicates strong upward motion (positive vertical velocity) over most of the region. This meteorological condition facilitated the vertical lifting of carbonaceous aerosols, enhancing solar absorption aloft and producing positive heating rates throughout the upper troposphere (Figure 5(e)). Notably, at the wildfire core region near 120°W, 60°N, the RH exceeded +5 (K day−1) between 400 and 300 (hPa). At the TOA (Figure 5(c)), wildfire aerosols exerted a negative SW, manifesting as a net cooling effect. Downwind of the fire sources, particularly in northern British Columbia, the TOA RF reached as low as −19 W m−2, consistent with the aerosol dispersion pathway and radiative response.
The direct radiative effects of wildfire aerosols can alter surface temperature and convective processes, thereby influencing cloud development and cloud water content—a phenomenon known as the semi-direct effect. In this context, changes in cloud cover often dominate the net aerosol–radiation interactions. To further investigate the mechanism by which wildfire-induced cloud changes affect surface energy budgets, we analyzed the vertical distributions of cloud fraction (CF), total cloud water mixing ratio (QCLOUD + QICE), and water vapor mixing ratio (QVAPOR), as shown in Figure 6, respectively. In the vicinity of the wildfire center in and around British Columbia, significant reductions in CF (Figure 6(a)) and cloud water content (Figure 6(b)) were observed during the burning period. Concurrently, changes in QVAPOR (Figure 6(c)) indicate that the upper atmosphere became substantially drier, with maximum decreases in water vapor mixing ratio reaching −2.9 g kg−1. This reduction in cloud-related variables can be attributed to two key mechanisms: (1) the heating of the upper troposphere by absorbing carbonaceous aerosols and (2) suppressed vertical moisture transport from the surface. Together, these processes led to a notable decrease in cloud cover and liquid/ice water content over the wildfire region, ultimately resulting in enhanced atmospheric warming and surface dimming. This is reflected in the localized RE changes, where surface (BOT) RE decreased and atmospheric (ATM) RE increased by more than 100 W m−2 over the fire-affected areas. Differences in cloud and thermodynamic properties between WRF-Chem simulations with and without biomass burning (BB) emissions (CON−SEN) during July 12–19, 2023. (a)–(b) Differences in cloud fraction (CF, %) and mixing ratios of cloud water + ice (QCLOUD + QICE) and water vapor (QVAPOR, g kg−1).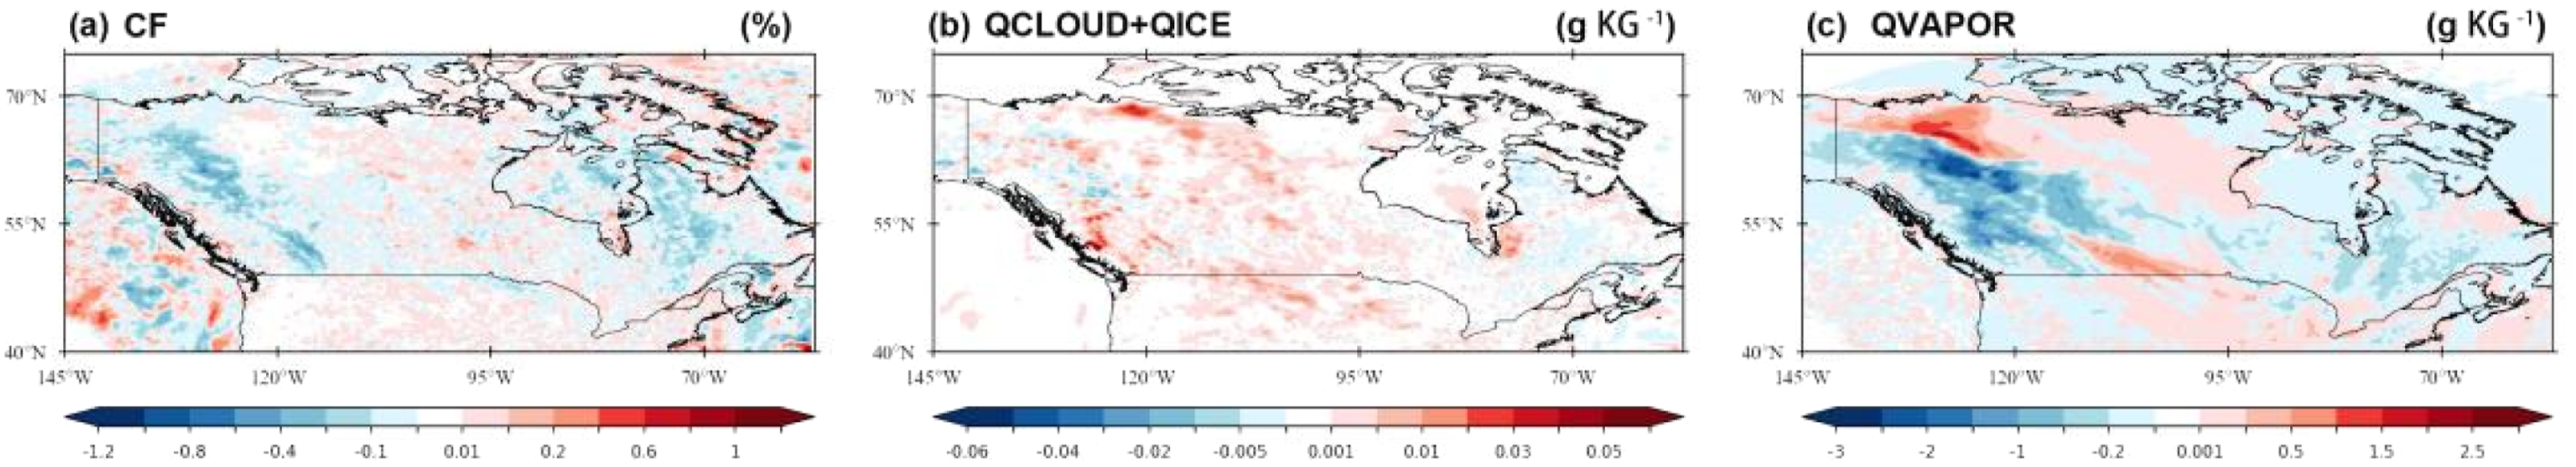
Wildfire–meteorology interactions
Carbonaceous aerosols (CAs) emitted from wildfires absorb substantial solar radiation, heating the atmosphere while reducing downward shortwave radiation reaching the surface. The impact of this effect on surface temperature largely depends on the spatial distribution of the pollutants. Our results show that the region of maximum aerosol optical depth (AOD; located near 40°N, 145°W), aligns closely with significant negative surface temperature anomalies (−3 to −0.1°C; Figure 7(a)), indicating a marked surface cooling driven by the reduction in incoming shortwave radiation due to wildfire smoke. In addition to radiative cooling, wildfire aerosols also perturb atmospheric dynamics and thermodynamics by altering radiative effects and advective heat transport. These changes modulate atmospheric stability and circulation. Figure 7(b) and (c) presents the spatial distribution of changes in 10-m wind speed (WS10) and planetary boundary layer height (PBLH), respectively. The strong thermal anomalies and enhanced vertical velocity in the mid-troposphere (Figure 5) suggest that aerosol-induced heating increased local atmospheric instability, thereby disturbing regional circulation patterns. As a result, the PBLH decreased by approximately 25–400 m in most regions, and by as much as ∼500 m near the fire sources. Simultaneously, WS10 showed a widespread decline, with reductions exceeding 0.4 m s−1 in fire-affected areas (Figure 7(b)). The spatial patterns of PBLH changes are strongly associated with the distributions of 2-m air temperature and surface wind speed, both of which are critical for turbulent mixing. The reduction in PBLH limited vertical pollutant dispersion, while lower surface wind speeds suppressed horizontal transport, jointly promoting the near-surface accumulation of pollutants. Continuous emissions of smoke aerosols further increased atmospheric pollutant loading. These aerosols enhanced atmospheric stability by modifying the radiative balance, thereby suppressing boundary layer development and weakening surface winds. Such processes established a positive feedback loop between pollution buildup and meteorological degradation, forming a coupled wildfire–meteorology–pollution feedback mechanism that significantly intensified the air quality impacts of the wildfires. (a-e) The average changes of temperature anomaly at 2 m (T2, units: °C), wind speed anomaly at 10 m (WS10; units: m s−1), planetary boundary layer height anomaly (PBLH; units: m), fire danger index anomaly (FWI), and large fire potential index anomaly (LFP) in July 12 to 19, 2023 simulated with and without BB emissions (CON−SEN). And (f) the daily variations of LFP (blue line) and FWI (red line) averaged over the Canada (marked as the black rectangle in Figure 1(b): 52°N−68°N, 110°W−130°W).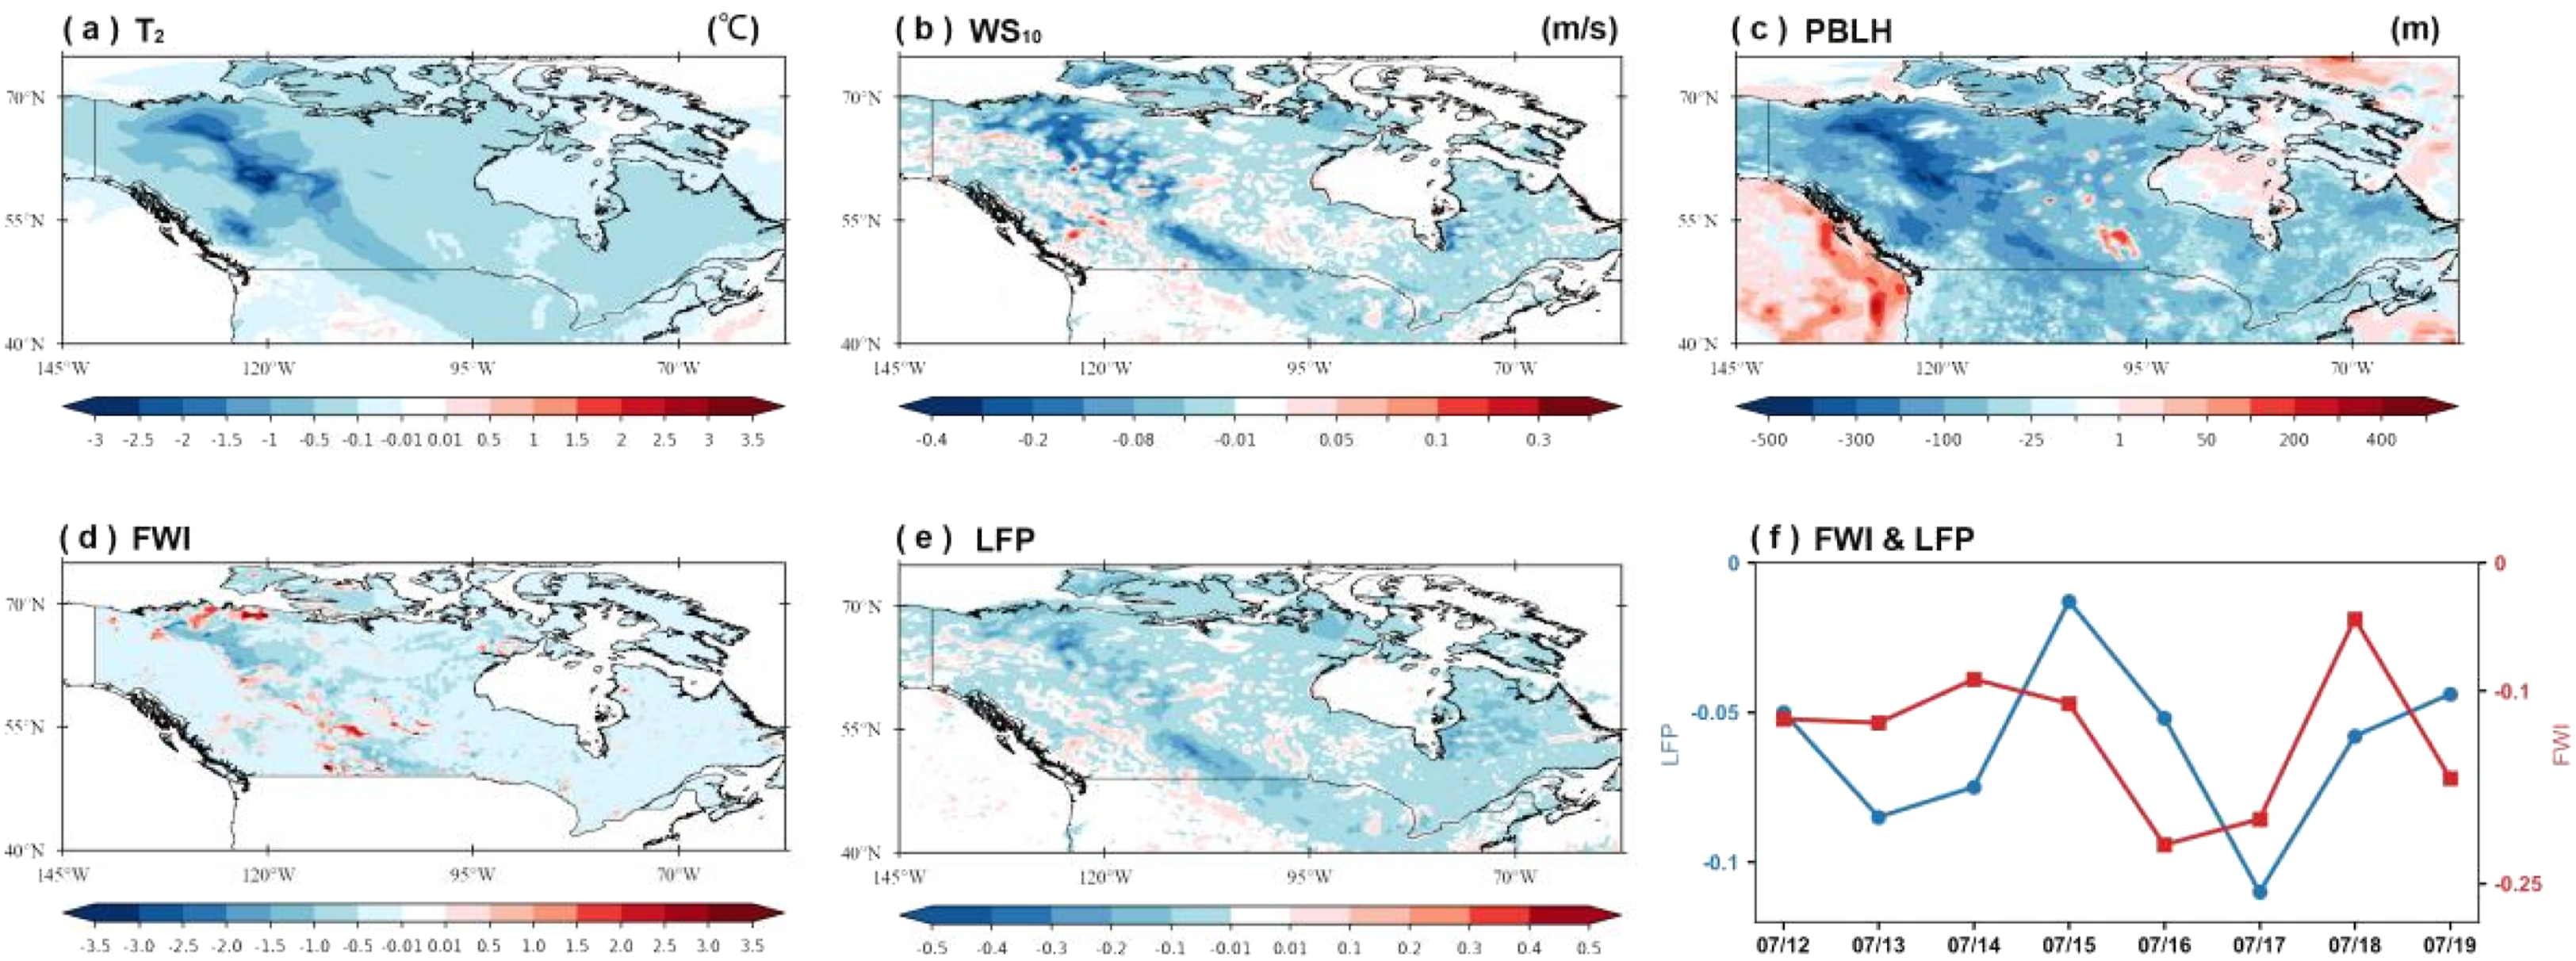
To investigate the potential feedback of altered meteorological conditions on wildfire behavior, two commonly used fire weather indices were analyzed: the Canadian Forest Fire Weather Index (FWI) and the Large Fire Potential Index (LFP), which incorporate key meteorological variables such as humidity, wind speed, and temperature. Figure 7(d) and (e) shows that FWI exhibited a widespread negative anomaly across Canada, with values decreasing by up to −2, while LFP showed mixed anomalies—positive in some areas near the fire source but predominantly negative across the domain. The spatial distribution of FWI closely resembles that of 2-m temperature and near-surface water vapor mixing ratio, suggesting that humidity played a dominant role in controlling fire potential. In contrast, FWI more closely aligns with changes in WS10, highlighting the importance of wind in fire spread. Collectively, both indices indicate that the aerosol-induced meteorological changes suppressed fire activity. Notably, our findings are consistent with those of Wu et al. (2025), who used WRF-Chem to assess the meteorological response to the 2019 Australian wildfires. Moreover, the persistent negative anomalies in FWI and LFP during the peak fire period further corroborate the presence of a negative feedback between extreme fire emissions and subsequent weather conditions.
Discussion
Meteorological conditions play a critical role in the development of regional extreme wildfires. Huang et al. (2023) reported that in Southeast Asia, wildfires disrupted moisture transport from the South China Sea, leading to near-surface drying and consequently enhancing wildfire emissions. In contrast, Wu et al. (2025) found that in Australia, wildfires enhanced northwesterly moisture transport, resulting in increased near-surface humidity that suppressed further fire activity. In this study, meteorological conditions were found to reduce wildfire potential over Canada, as reflected by decreases in fire weather indices. However, compared to lower-latitude regions such as Australia and Southeast Asia, high-latitude areas like Canada are characterized by inherently limited moisture availability (Dai, 2006). We suggest that the increase in near-surface humidity simulated during this extreme wildfire event was primarily controlled by anomalous local circulations induced by wildfire activity. This regional difference led to distinct feedback mechanisms between smoke aerosols and local meteorology. Specifically, our results indicate that radiative heating from wildfire smoke aerosols enhanced atmospheric stability, inhibited convective development, and reduced both planetary boundary layer height (PBLH) and near-surface wind speeds. These changes suppressed the vertical transport and dispersion of local moisture, causing moisture accumulation within the near-surface layer. This finding suggests that in high-latitude regions lacking significant external moisture input, wildfire-induced circulation anomalies relative to the no-FINN baseline simulation play a key role in shaping fire–meteorology feedbacks. Therefore, future studies of regional extreme wildfires should explicitly consider how local meteorology modulates wildfire emissions and associated aerosol–radiation–cloud interactions.
Although WRF-Chem captures the spatial and temporal variability of wildfire smoke, the simulated AOD over Canada is underestimated relative to satellite and reanalysis products, likely due to uncertainties in fire emissions, plume injection heights, aerosol aging processes, and aerosol optical properties (Hu et al., 2016). While this bias affects the absolute aerosol loading, our analysis relies on differences between simulations with and without wildfire emissions, ensuring the robustness of the main conclusions. Nevertheless, the underestimated AOD likely leads to conservative estimates of aerosol radiative effects and the associated smoke–meteorology feedbacks.
It should be noted that this study does not include feedbacks of smoke aerosols on wildfire emissions via precipitation changes. Wildfire emissions were prescribed using an external inventory and were therefore insensitive to aerosol-induced precipitation anomalies. Previous studies have shown that such precipitation responses can either suppress or enhance fire activity, leading to additional positive or negative feedbacks (Konovalov et al., 2024; Liu et al., 2024). As a result, the fire–meteorology feedbacks quantified here may represent a conservative estimate. Future studies incorporating fully coupled fire–atmosphere models are needed to explicitly capture this pathway.
In this study, secondary organic aerosol (SOA) formation via aqueous-phase glyoxal uptake is represented within the four-bin MOSAIC aerosol scheme, which uses a sectional approach to simulate major aerosol components, including sulfate, nitrate, ammonium, black carbon, primary organic aerosol, and SOA. Aerosol–radiation interactions (ARI), including both direct and semi-direct radiative effects of wildfire smoke, were explicitly considered and form the primary focus of the present analysis. Compared with the effects of wildfires on shortwave radiation, changes in longwave radiation are relatively small in our simulations (Figure S6); therefore, this study primarily focuses on the shortwave radiative effects of wildfire smoke. Aerosol–cloud interactions (ACI) are also represented; however, their impacts are not explicitly isolated or quantified. Brown carbon was not explicitly represented, and organic carbon emissions from biomass burning were treated as non-absorbing primary aerosols. While the four-bin configuration is widely used (Huang et al., 2023; Jin et al., 2024; Wu et al., 2025) and sufficient for capturing relative radiative and meteorological responses to wildfire emissions, it may introduce some uncertainty in absolute aerosol optical properties and shortwave absorption.
This study employed the WRF-Chem model to simulate the coupled interactions among wildfire emissions, meteorological conditions, and radiative processes. However, the dynamic feedbacks between fire emissions and meteorology were not fully captured due to the reliance on externally prescribed emission inventories, which prevented the realization of true online coupling between fire processes and atmospheric conditions (Huang et al., 2023; Wiedinmyer et al., 2023). This limitation may lead to underestimation of the regulatory effects of wildfire emissions on local meteorology. In a fully two-way coupled modeling framework, meteorological responses to smoke aerosols—such as surface cooling, enhanced near-surface humidity, and weakened winds—would likely feedback to further suppress fire spread and emission intensity. Consequently, among smoke-induced meteorological anomalies identified in this study may be even more pronounced within a fully coupled fire–atmosphere system. In the absence of explicit fire–meteorology coupling, fire weather indices were used in this study as proxies for fire activity. Although this approach assumes a linear relationship between fire weather indices and wildfire behavior, introducing certain uncertainties, its parameterization principles are consistent with those of many existing fire models (Tian et al., 2022; Yue et al., 2024) while simplifying the computational process. Future work should consider integrating parameterized or dynamic fire modules within atmospheric models to enable two-way coupling between emissions and meteorological conditions, thereby providing a more comprehensive simulation of extreme wildfire evolution. In this study, due to the inability of WRF-Chem to represent fire–meteorology feedback processes, fire weather indices were used as proxies for fire activity.
Conclusion
This study comprehensively examined the dynamic interplay between wildfire emissions, aerosol-radiation interactions (ARI), and meteorological responses during a major wildfire event over Canada. Using the WRF-Chem model, validated against multiple observational datasets, we evaluated the model’s capacity to reproduce key features of wildfire-induced aerosol and meteorological changes. The results demonstrated that WRF-Chem effectively captured both the spatial and temporal variations of aerosol optical depth (AOD) and carbonaceous aerosol (CAs) concentrations, as well as near-surface meteorological variables. The model simulations revealed that wildfire smoke substantially altered shortwave radiative effect at the surface (BOT), within the atmosphere (ATM), and at the top of the atmosphere (TOA), with distinct regional patterns linked closely to AOD distributions.
Our findings highlight the significant atmospheric heating induced by absorbing aerosols, particularly black carbon, which enhanced upper tropospheric warming and altered local thermodynamic structures. This radiative heating suppressed cloud formation by reducing both cloud fraction and cloud water content, and dried the upper atmosphere through inhibited vertical moisture transport. These semi-direct effects intensified atmospheric stability, resulting in reduced planetary boundary layer height (PBLH) and weakened near-surface winds. Consequently, the dispersion of smoke aerosols was limited, exacerbating pollutant accumulation near the surface and reinforcing the feedback between pollution buildup and meteorological degradation.
Importantly, this study also explored how aerosol-induced meteorological perturbations feed back into wildfire behavior through fire weather indices such as the Canadian Forest Fire Weather Index (FWI) and Large Fire Potential (LFP). Results showed a general suppression of fire potential due to increased humidity and reduced wind speeds, indicating a negative feedback loop whereby intense wildfire smoke reduces the likelihood of further fire spread by altering the local meteorological environment. These findings are consistent with similar studies on other wildfire events and reinforce the critical role of smoke-aerosol interactions in shaping not only air quality but also fire evolution.
Overall, this work underscores the importance of fully coupled atmosphere-chemistry models in understanding the complex feedback mechanisms linking wildfires, aerosols, radiation, and meteorology. It also emphasizes the need for further research into how these processes vary across regions with different moisture regimes, synoptic patterns, and emission characteristics. Future efforts should integrate parametrized or dynamic fire models with atmospheric simulations to better capture the bidirectional feedbacks between wildfire emissions and meteorological conditions, particularly under a warming climate where extreme fire events are expected to become more frequent and intense.
Supplemental material
Supplemental Material - Interactions among smoke, radiation, and meteorology in the Canadian wildfires
Supplemental Material for Interactions among smoke, radiation, and meteorology in the Canadian wildfires by Ming Zhang, Yiqiang Tu, Lunche Wang, and Qian Cao in Progress in Physical Geography: Earth and Environment.
Footnotes
Funding
The authors disclosed receipt of the following financial support for the research, authorship, and/or publication of this article: National Natural Science Foundation of China (42171386; 42471024).
Declaration of conflicting interests
The authors declared no potential conflicts of interest with respect to the research, authorship, and/or publication of this article.
Data Availability Statement
The global monthly fire location product is available from the University of Maryland website (ftp://fuoco.geog.umd.edu). The NCEP FNL data are available at https://rda.ucar.edu/datasets/. The FINN emission inventory data are obtained from https://www.acom.ucar.edu/acresp/dc3/finn-data.shtml/. The MEIC emission inventory data are obtained from https://www.meicmodel.org/. The observed surface meteorological data are obtained from NOAA’s National Climatic Data Center (![]() )
)
Supplemental material
Supplemental material for this article is available online.
References
Supplementary Material
Please find the following supplemental material available below.
For Open Access articles published under a Creative Commons License, all supplemental material carries the same license as the article it is associated with.
For non-Open Access articles published, all supplemental material carries a non-exclusive license, and permission requests for re-use of supplemental material or any part of supplemental material shall be sent directly to the copyright owner as specified in the copyright notice associated with the article.