






Abstract
This paper proposes an efficient Gorilla troops-inspired algorithm to cope optimal power flow (OPF) problem considering uncertainty of renewable energy sources (RES). The problem is formulated as large-scale constrained optimization problem with non-linear characteristics. Its degree of complexity increases with incorporation of intermittent energy sources, making it harder to be solved using conventional optimization techniques. However, could be efficiently resolved by nature-inspired optimization algorithms and solvers. The objective function is the overall cost of system, including reserve cost for over-estimation and penalty cost for under-estimation of two types of PV-solar and wind energy. To demonstrate the consistency and robustness of the developed algorithm a case study on the modified IEEE 30-bus system and and Adrar’s power network (isolated grid) is carried out. Simulation results show the capability of GTO to find high quality optimal feasible solutions and ranked first among the compared algorithms, and so, over different function landscapes.
Keywords
Introduction
Optimal power Flow (OPF) is one of primordial tools of electric power systems, offering electric power at minimum-cost and high quality. In short, it’s the backbone of electric grids due to the important role that plays in maintaining operational reliability and economics of power systems. OPF master objective is to find optimal adjustment of the decision variables so that a selected objective function is optimized while satisfying different physical and operational-constraints inflicted by electric power grid (equality and inequality constraints). The most commonly objective-function is minimization of overall generation cost. However, other functions are minimization of gas emission, real power loss, voltage stability-index (VSI), and bus voltage-deviation [1]. While used control-variables are: active power of generators outputs, generator voltages magnitudes, positions of the transformer taps, and contributions of the compensators in terms of reactive power.
In traditional electric networks, study of OPF was based on the conventional power generators which run on fossil-fuels. However, with electricity market liberalization, and integration of renewable energy sources (RESs), study of OPF is becoming more complicated leading in raise the complexity of its objectives, significantly. This is due to the diverse functions based on the variability and uncertain used in its problem formulation. The prime objective behind incorporation of renewable generators (WG + SG) in the grids is to reduce the active power losses in transmission lines in improving the reliability and quality of electric grids. Also they reduce environmental pollution (Biswas et al., 2017). In addition, with increasing of injected power from RES, specifying optimal contribution of each generator in the system is necessity. Thus (Also), energy management and optimal scheduling of different resources could facilitate diverse missions of electric power system operator, ultimately reducing total generation electricity cost.
In the few past decades, numerous conventional optimization techniques have been applied to solve different versions of OPF problem. The conventional solvers are the Newton method (Bjelogrlic et al., 1990; Santos and da Costa, 1995), non-linear programing (NLP) (Luo and Semlyen, 1989) and interior point methods (Momoh and Zhu, 1999). Despite the fact that some of abovementioned methods have excellent convergence characteristics and some of them are usually suitable for industry applications. However, they have some weaknesses, which are summarized as follows:
Sensitivity to the initial search point, that is, they might converge easily to local solutions as may converge to global ones.
Lack of flexibility with respect to practical systems, that is, each method is suit for a specific problem formulation in its proper objectives and/or constraints.
Besides the inflexibility aspect, they also encounter a huge difficult to set of uncertain and stochastic problems, such as OPF with application of renewable generation.
Therefore, developing new and effective optimization methods is necessity in effort to overcome the shortcomings of the traditional optimization techniques’ (Hinojosa and Araya, 2013). Thanks to the computational intelligence schemes and open access to optimization techniques have liberated considerable researches in the field of meta-heuristic algorithms to solve complex optimization problems during first decade. These optimizers have ability to provide near-global solutions and capability to escape local ones, avoiding in premature convergence. Many meta-heuristic optimization algorithms have been implemented to cope with classical OPF problem like improved version of PSO (Singh et al., 2016), moth swarm algorithm (MSA) (Mohamed et al., 2017), improved bacterial forging method (IBF) (Amjady et al., 2012), teaching-learning-based optimization (TLBO) technique (Bouchekara et al., 2014), backtracking-search algorithm (BSA) (Chaib et al., 2016), improved colliding-bodies optimizer (ICBO) (Bouchekara et al., 2016), and adaptive multiple teams perturbation-guiding Jaya (AMTPG-Jaya) algorithm (Warid, 2020). While aforementioned references are limited on the thermal power generators only. In the few past years, a system with mixed resources involving thermal, wind and solar generators have been studied in quest of provide electrical energy at minimum generation-cost with high-quality. As mentioned earlier, electricity market allows the incorporation of renewable energy sources into the electricity grids in order to minimize the environmental problems and enhancement of load relief on a transmission lines as well system voltage profile control by transmission line active power losses reduction. In that context, a few works have been published in literatures. For instance in Elattar and ElSayed (2019) modified Jaya algorithm is applied to solve OPF incorporating RES considering four different objective functions to improve recorded results against other optimizers while the RES is modeled as a negative load, but any forecasting technique was not employed to forecast wind and solar photovoltaic power output. The results show outperforms of MJAYA on the basic Jaya as well on other existing algorithms. Biswas et al. (2018) proposed an adaptive version of differential evolution-based technique (SHADE) to solve OPF problem in a system involving renewable power generators. To forecast wind power and solar-photovoltaic production, authors used weibull and lognormal probability-distribution-functions (PDF). In addition, the feasibility of results was discussed and checked that all control variables fell inside the allowed limits. Thus, findings clearly show the efficacy of the proposed model, but, unfortunately, it was applied only on medium-sized test system, IEEE 30-bus. In another publication Elattar (2019) proposed modified version of the moth swarm algorithm to solve OPF problem of combined heat and power system with presence stochastic wind farm. The model is well presented and results were discussion but only for IEEE 30-bus system in which feasibility of solution of large-scale test system IEEE 118-bus were not discussed. As well, application of suggested model on a practical power grid was not conducted. (Ullah et al. (2019) provide a new hybrid optimization algorithm PPSOGSA for OPF solution considering renewable energy generators. The model of stochastic behavior is based of PDF scheme. The results amply show the superiority of proposed hybrid method against basic PPSO and GSA. Again, however, the algorithm was not examined by applying it to real/large-sized power system. In Chang et al. (2014), evolutionary particle swarm optimization (EPSO) algorithm was used for solving OPF problem in a wind-thermal power system. The suggested wind model is based on the up-spinning and down-spinning reserves of the production units. But, the approach was also evaluated only on modified IEEE 30-bus system and large-scale power systems were not taken into consideration when validating the proposed model. A modified cuckoo search optimization technique employed for OPF solution incorporating wind power was proposed in Mishra et al. (2015). The proposed stochastic model of wind generation is based on the Weibull PDF. Again, however, the simulation was also conducted only on standard medium-sized test systems.
In view of aforementioned works, published results are promising and encouraging. But bear in mind that in spite of all efforts carried out in this area since half-a-century ago, topic is remains open for research and also worthy of further attention. On the other hand, despite the success of many optimization methods in realizing satisfactory results, but still suffer from some limitations and shortcomings as far as their susceptibility of falling into local optima and the difficulty of tuning the main intrinsic parameters. More precisely, none of them can guarantee finding the optimal solution for all optimization problems. Moreover, application of these algorithms on larger scale or real-sized electric grids is uncommon. Consequently, these gaps give an opportunity to suggest or develop effective meta-heuristic techniques able deal different OPF formulations.
In this paper, GTO algorithm is proposed to deal with OPF problem in the presence RES and different objective functions. The proposed technique is examined on the modified- test system IEEE 30-bus and real power system of Adrar located at isolated site in Algerian desert. In addition, penalty function method (PF) method is used herein to handle different constraint of stochastic OPF problem. In June 2021 a novel metaheuristic algorithm titled Gorilla troops optimizer (GTO) has been proposed by Abdollahzadeh et al. (2021), which simulates the social organizations of gorillas in forest. GTO has excellent randomness properties, which makes it search for all optimal solutions in the search-space without trapping into local-optimum. In addition, it has a simple concept and is easy to implement.
Problem formulation and objective functions
The main objective of OPF is to find the optimal settings of control-variables so that the specified objective-function is minimized while satisfying all constraints imposed (equality and inequality). Mathematically is formulated as follows:
where
Objective functions
In this work, three objectives will be minimized, cost, power loss, and gas emissions of thermal units.
Thermal power only units
Fuel cost of thermal power units can be described as (Elattar, 2019)
For more realistic pattern and precise modeling valve-point effect scheme is considered. The cost function C under valve-point loading rewritten as follows:
Where
Since wind and solar generators does not require any fuel like conventional thermal generators, cost-function evaluation of the wind and solar obey of some norms. The first norm is direct-cost for wind generator
where
Under the uncertainties, there are two possible scenarios: (1) if actual power-delivered by the wind farm or solar generator is less than the estimated-values, this scenario called as overestimation of power, herein the system operator needs to the spinning reserve to ensure uninterrupted supply to the consumers. The cost of committing the reserve production units to meet overestimated quantity is named as reserve-cost (Biswas et al., 2017). The reserve cost for wind and solar power units is written with following equations:
where
Contrary of overestimation, the second scenario called the under estimation of wind/solar power plant. In this scenario the actual power produced is higher than the estimated one, yielding the surplus power. This situation requests introduce the penalty cost against each surplus amount of power, where expressed by the following equations.
where
It is important to indicate that the cost evaluation for wind generator and solar PV unit are depends on the wind Weibull probability-distribution-functions (PDF) and solar radiation by lognormal PDF respectively (Sulaiman and Mustaffa, 2020).
Where
Conventional thermal power generators emits harmful gases into the environment such as
Second objective function Minimize-
where
Power network monitoring and control has acquired great significance in the design, planning, and operation of modern electric power systems throughout voltage stability enhancement in an effort to get more information’s on the voltage drops especially with penetration of renewable energies. The operating interval of index L was set in [0, 1]. So, third objective function minimizes the voltage-stability-index in the transmission grid can be formulated as follows:
where
Y1, Y2, Y3, and Y4: are the sub-matrices of the system
Where
System constraints
Equality-constraints: Are the power flow equations which are given below
Inequality constraints: Represent the limits applied on the following variables
Security constraints
Equations (19)–(21) are the active power limits of conventional power-plants, wind and solar power generators, respectively. equations (22)–(25) are the reactive power capabilities of conventional power-plants, wind-/solar generators and shunt reactive power sources.
Equation (26) shows the constraints applied at the generators voltage, whereas equation (27) represents the voltage limits constraining load-buses, NL being the number of load-buses. Security-Constraints of: tap changing transformer and line capacity are given by equations (28) and (29), respectively. NTL is the number of lines in the electric grid.
In handling constraints, one of the first widely adopted approaches employed is static-penalty function method. If the constraints are violated, a large penalty term is added to the objective-function to punish these violation, thus guaranteeing the feasibility of solutions.
GTO-based proposed algorithm
In June 2021 a novel metaheuristic algorithm titled Gorilla troops optimizer (GTO) has been proposed by Abdollahzadeh et al. (2021), which simulates the social organizations of gorillas in forest. Its life style is based on five strategies, which ordered as follows: migration to other unknown regions, moving toward other group of gorillas, migration into direction of determined position, adhering silver-back, and competition for adult-females. These strategies are employed to explain the optimization process which based on the exploration and exploitation phases. Exploration phase uses the three first aforementioned mechanisms, while latter two mechanisms which are: adhering silver-back, and competition for adult-females are dedicated to explain exploitation phase (Abdollahzadeh et al., 2021). One of the most interesting characteristics of gorillas is that they very intelligent in which last study finds today’s gorillas may be smarter than human. They can use simple tools and learn sign language. Such characteristic guarantees a smart exploration that allows to discover different regions in search-space while avoiding to falling into local optima. Each individual in the gorillas group has a specific task’s to accomplish, for instance Silverback is the leader element in group, which plays an important role in the group by making all the decisions, takes responsibility for the group’s safety well-being, mediates the fights, determines the movements of group, and guides the gorillas to food-sources. (Abdollahzadeh et al., 2021)
In the GTO algorithm, each gorilla represents a possible solution to the optimization problem, and the best- candidate solution is regarded as a silverback-gorilla. For better understanding the optimization process of GTO, different mechanism in exploration and exploitation abilities are described below.
Exploration phase
All gorillas in GTO are considered as candidate solutions of problem, and at every optimization process stage, the Silver-back gorilla is considered as the best candidate solution. Exploration stage is based on three different behaviors, which are: migration to a non-identified position for raising exploration ability of GTO. Gorillas movement’s with others gorillas for balancing exploration and exploitation, and migration in an identified location’s direction to enhance the GTO capability to search for various optimization-spaces.
When (p) superior of random value (rand), only migration to a non-identified position is chosen. When rand≥0.5, gorilla’s movement’s toward others ones is ensured. However, when rand <0.5, a migration in an identified location’s direction is selected. These three behaviors to the exploration framework can be mathematically formulated by the following equation:
Where
where the current iteration and the maximum number of iteration are indicated by
In ending stage of exploration phase, the cost of all solutions is evaluated, and if the cost of
Exploitation phase
At the exploitation stage, two strategies are executed which are track the silver-back and competition on adult-females. Based on the comparison selection between the value of
The leader of the group is the silverback, which is the responsible on other individuals and guide them toward different food sources. This behavior is chosen when the value of parameter C is greater or equal than setting parameter W. It can be represented mathematically by equation (36). Figure 1, shows how the location of search agent vectors shifts during the exploration stage.
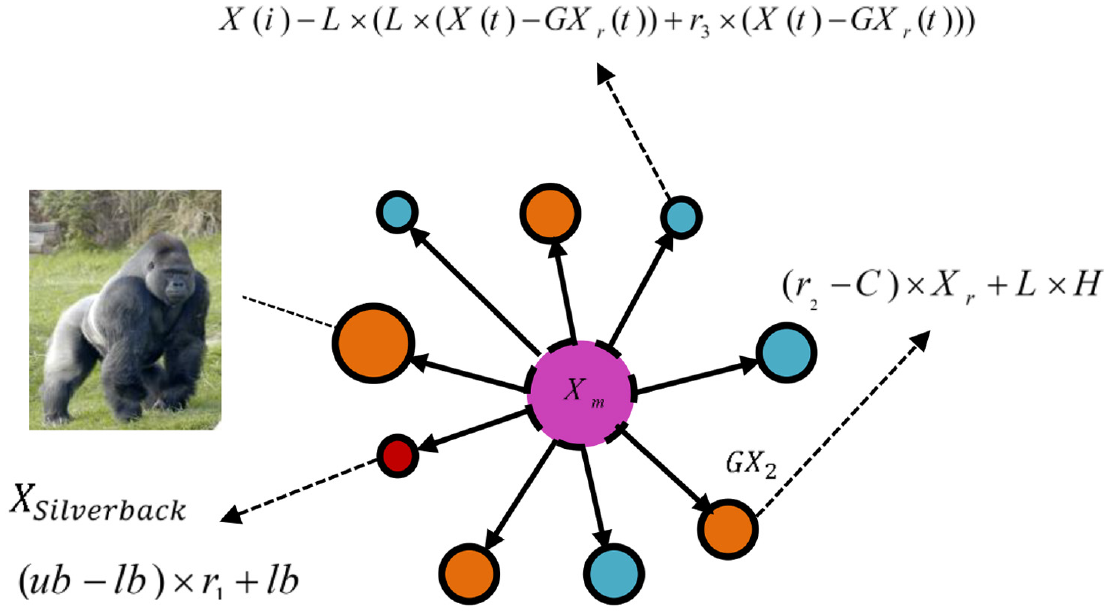
Example of overall directions in the stage of exploration (Abdollahzadeh et al., 2021).
Where
In equation (39),
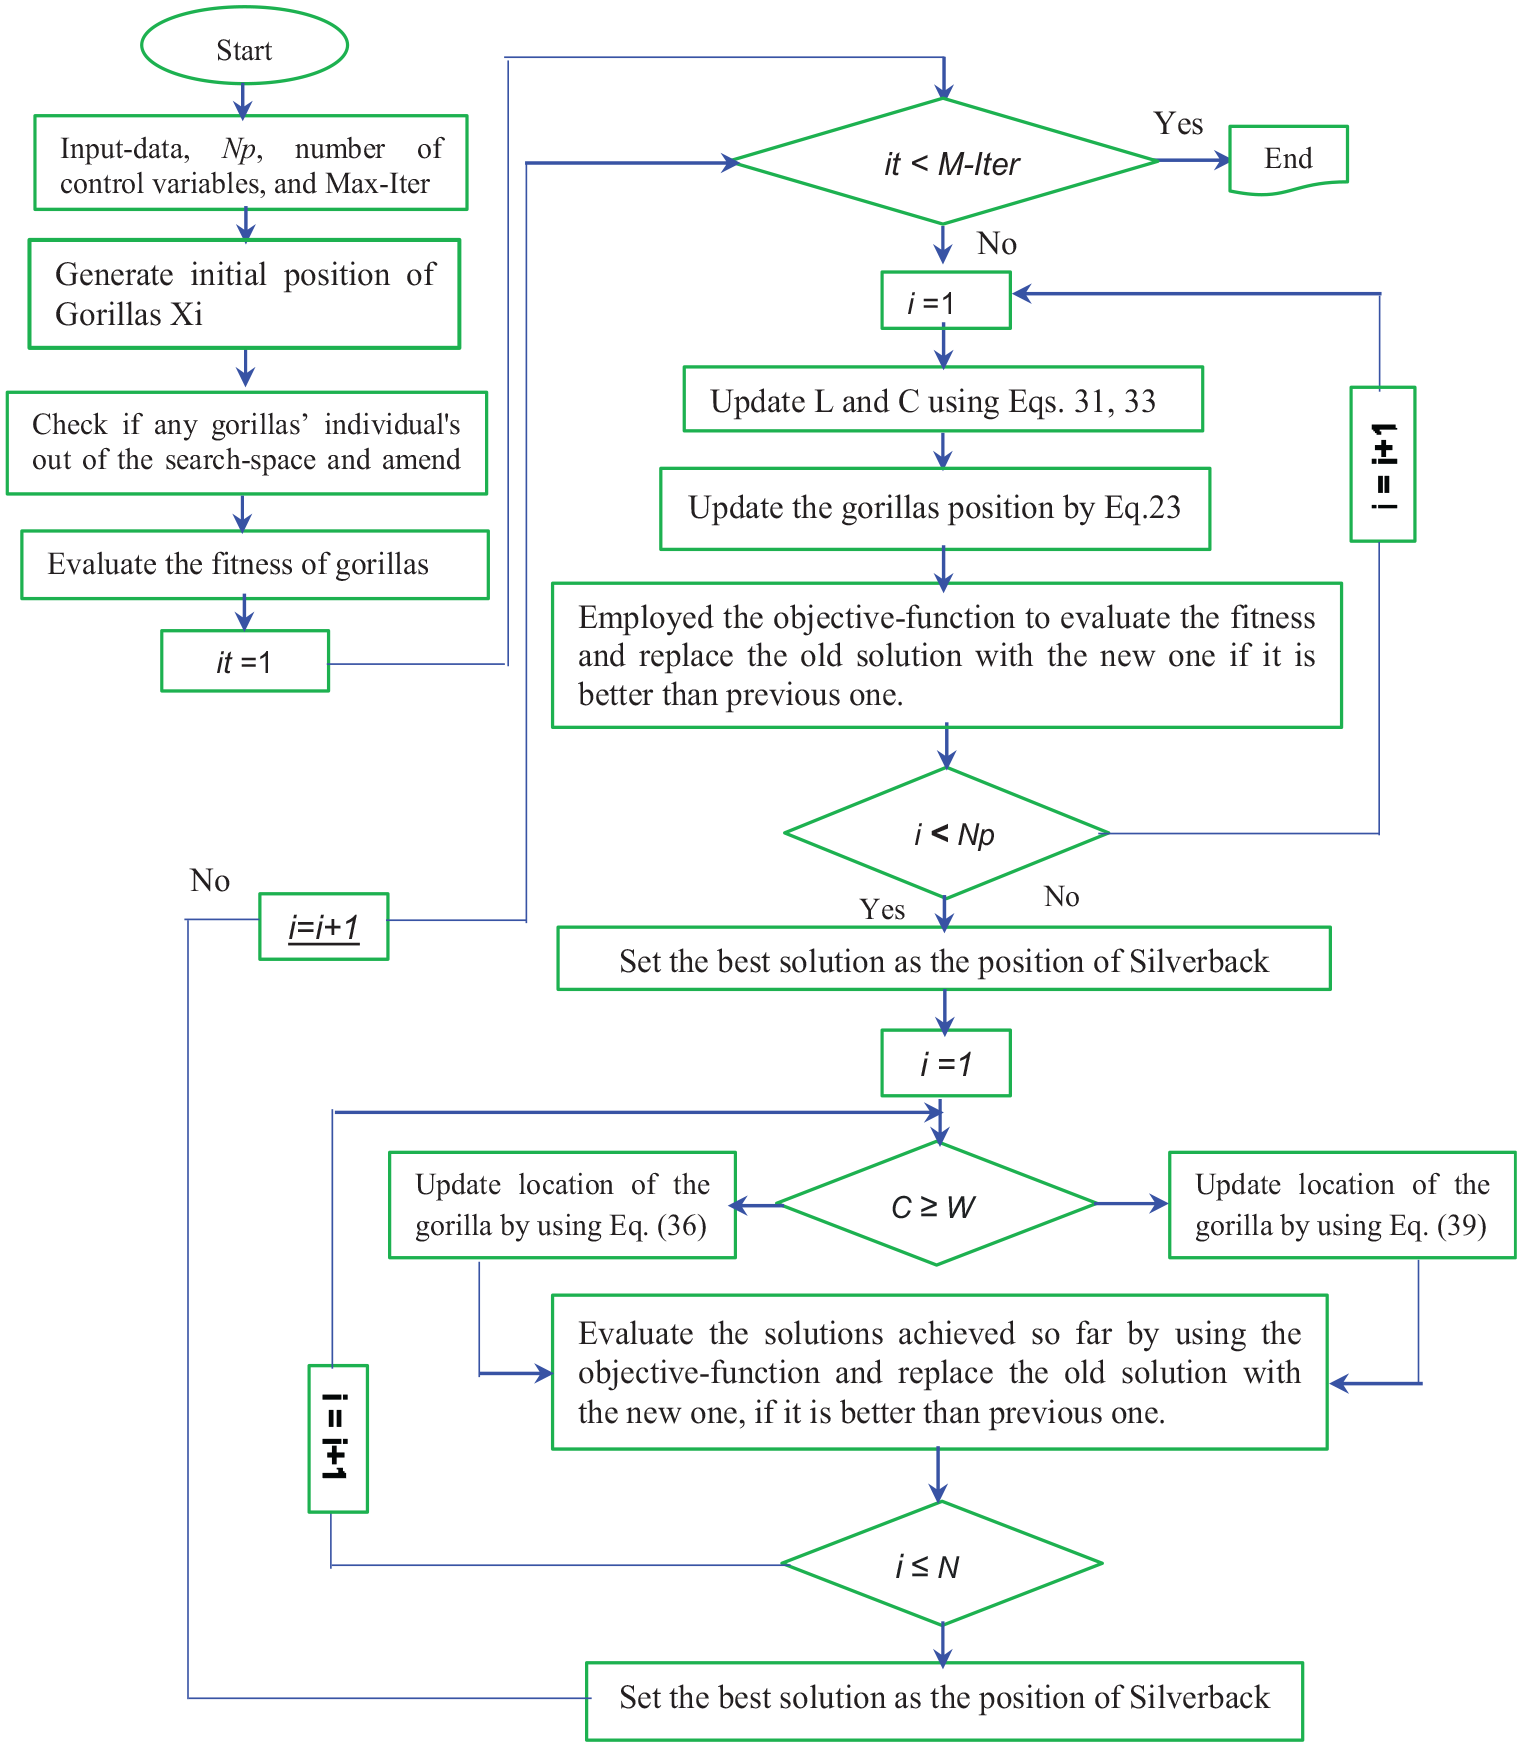
Flowchart of GTO algorithm.
Simulation result and discussions
Test system I: Modified IEEE 30-bus test system
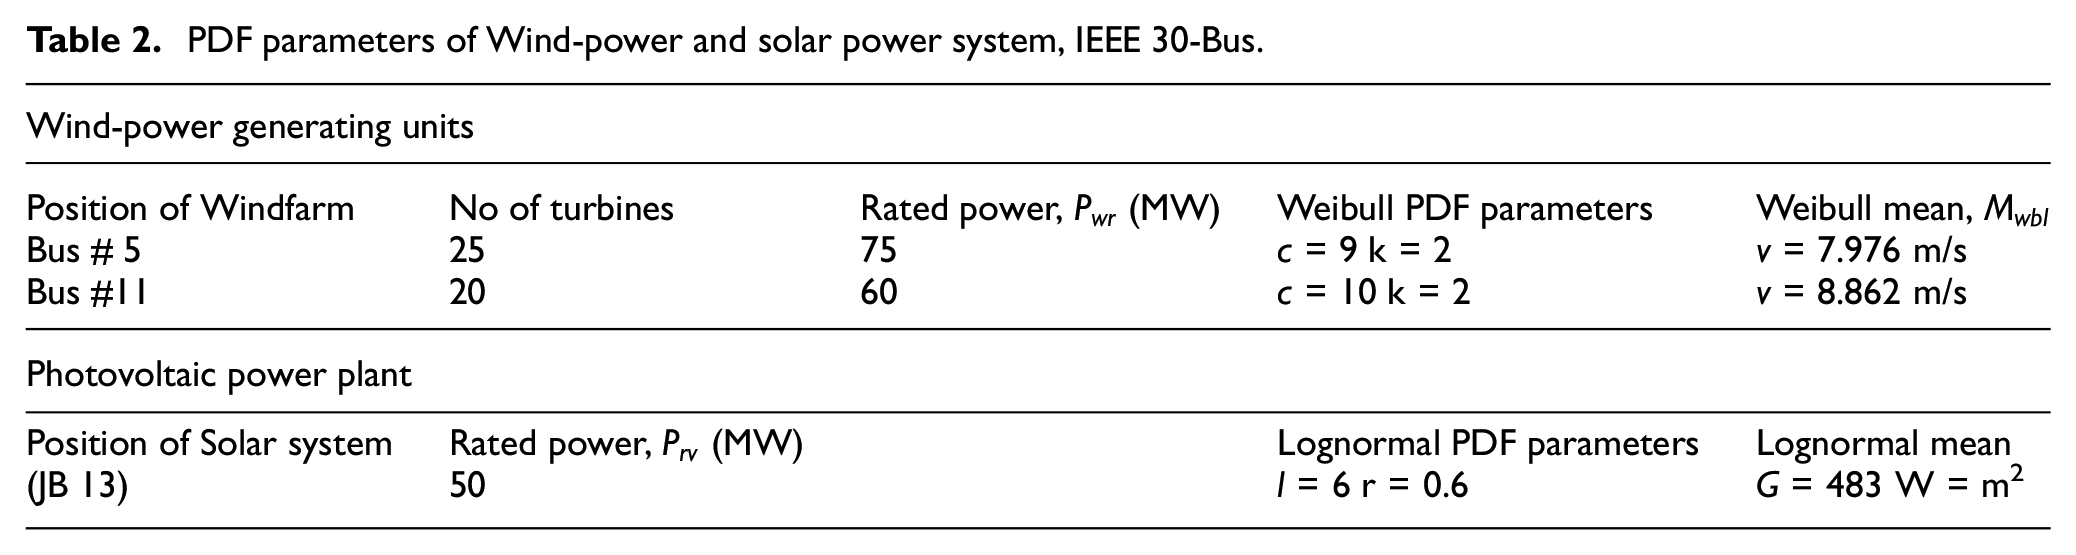
In this section, the proposed GTO is applied to some cases of OPF problem, and some other algorithms are selected for comparison with GTO to further validate its performance. To test the capacity and feasibility of the proposed GTO algorithm in solving stochastic OPF problem, it examined on the modified IEEE 30-bus test system under different scenarios. The modification is to insert two wind generators at buses #5 and #11along with one solar generator at bus #13. All data ca be retrieved in Sulaiman and Mustaffa (2020) and Zimmerman et al. (2011). All implemented algorithms have been coded and solved under Matlab R2014a platform, and run on an Intel® Core™ i5-4300U 2.50 GHz 4.00 GB RAM personal computer. For all selected cases the population-size is set as 30 individuals; the maximum number of iterations is fixed 300 for IEEE 30-bus and 200 for Adrar power network. Moreover, to demonstrate the consistency and robustness of GTO, 30 independent runs were conducted for each case and the best value of the objective-function obtain with corresponding control-variables are registered. Table 1 reports description of all test-systems characteristics used in this article. For the purpose of a fair comparison, all control variables of test systems were considered as continuous. Table 2 gives description of renewable energy source characteristics used herein.
Electric power-networks characteristics description.

PDF parameters of Wind-power and solar power system, IEEE 30-Bus.
Simulation results of test system I
Results on case 1
In this case, the objective-function is minimization of the total cost of generation. Obtained findings by using proposed algorithm GTO are based on the Weibull PDF parameters. Figures 3 to 5 represent Weibull fitting and wind distribution obtained from the simulation of 8000 Monte Carlo scenarios, while the stochastic power-output of solar photovoltaic unit is illustrated by Figure 6. Table 3 gives all PDF parameters used of renewable energy sources.
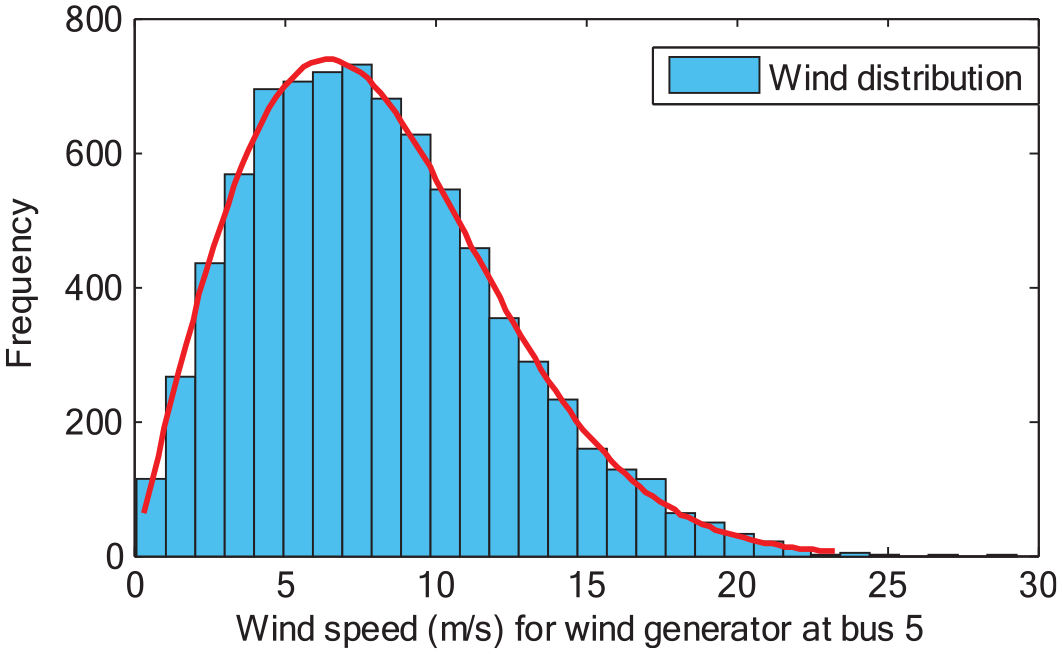
Wind speed distribution for wind-power Generator#1 at bus 5(c = 9, k = 2).
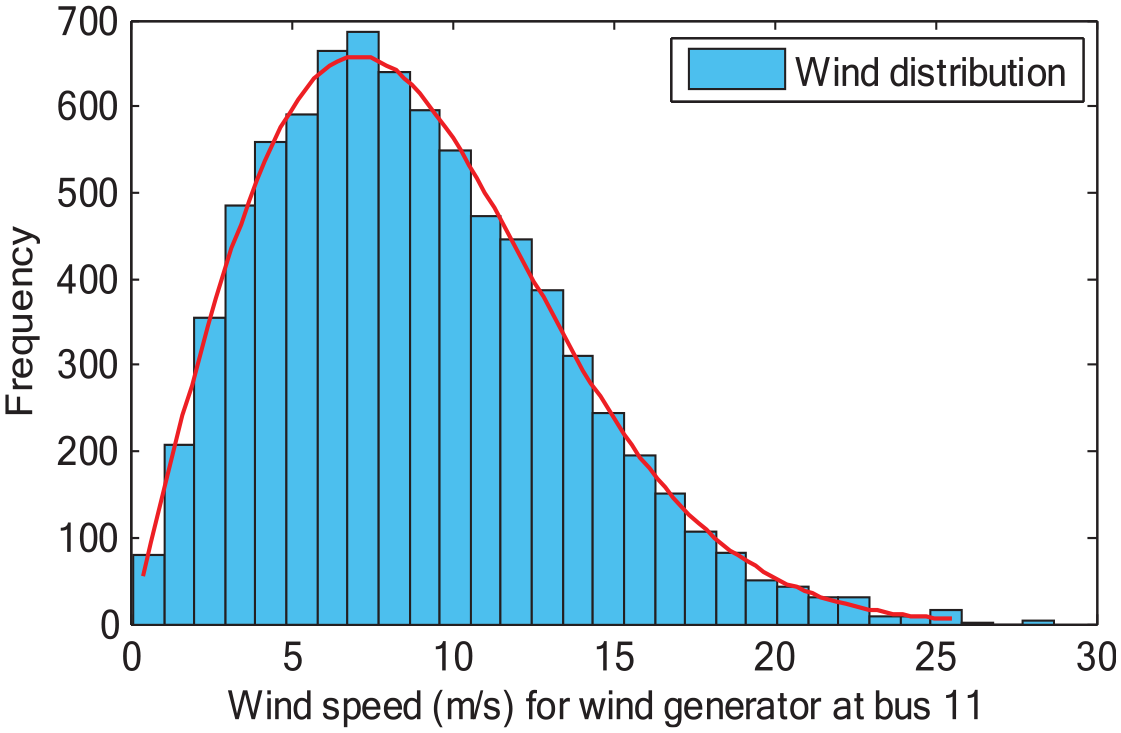
Wind speed distribution for wind-power Generator#1 at bus 11(c = 10, k = 2).
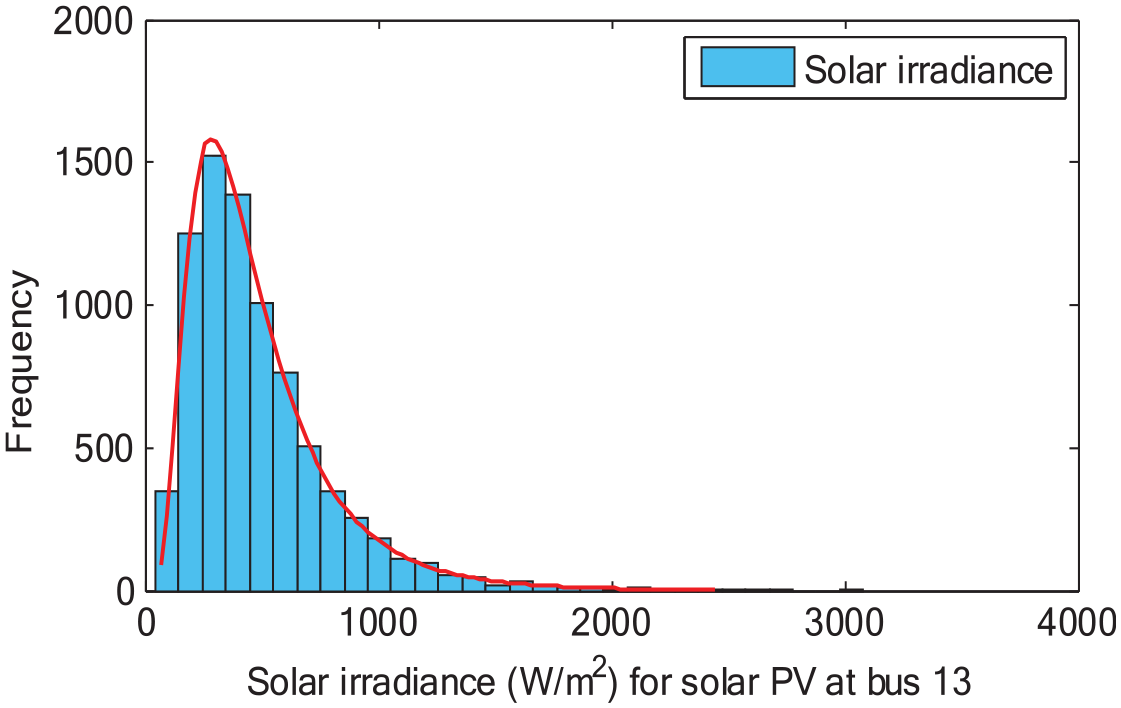
Distribution of solar irradiance or solar PV generator at bus (μ = 6, Y = 0.6).
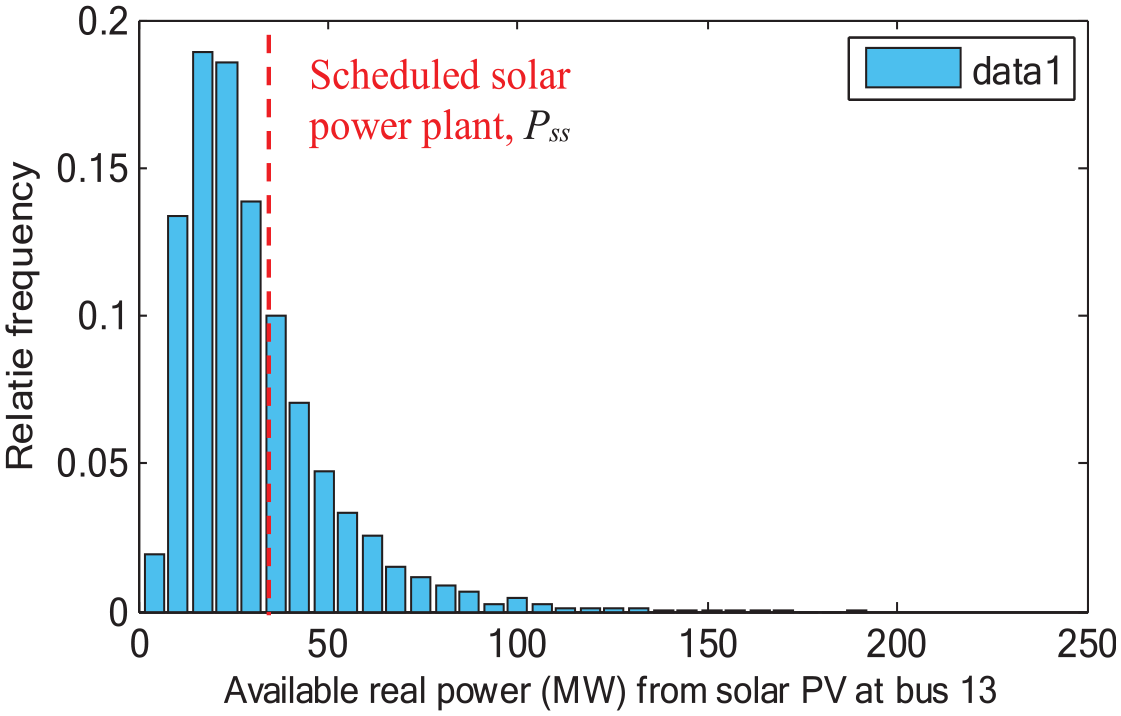
Real power distribution (MW) of solar PV at bus 13.
Optimal results comparison for different algorithms for IEEE 30-bus Case 1.
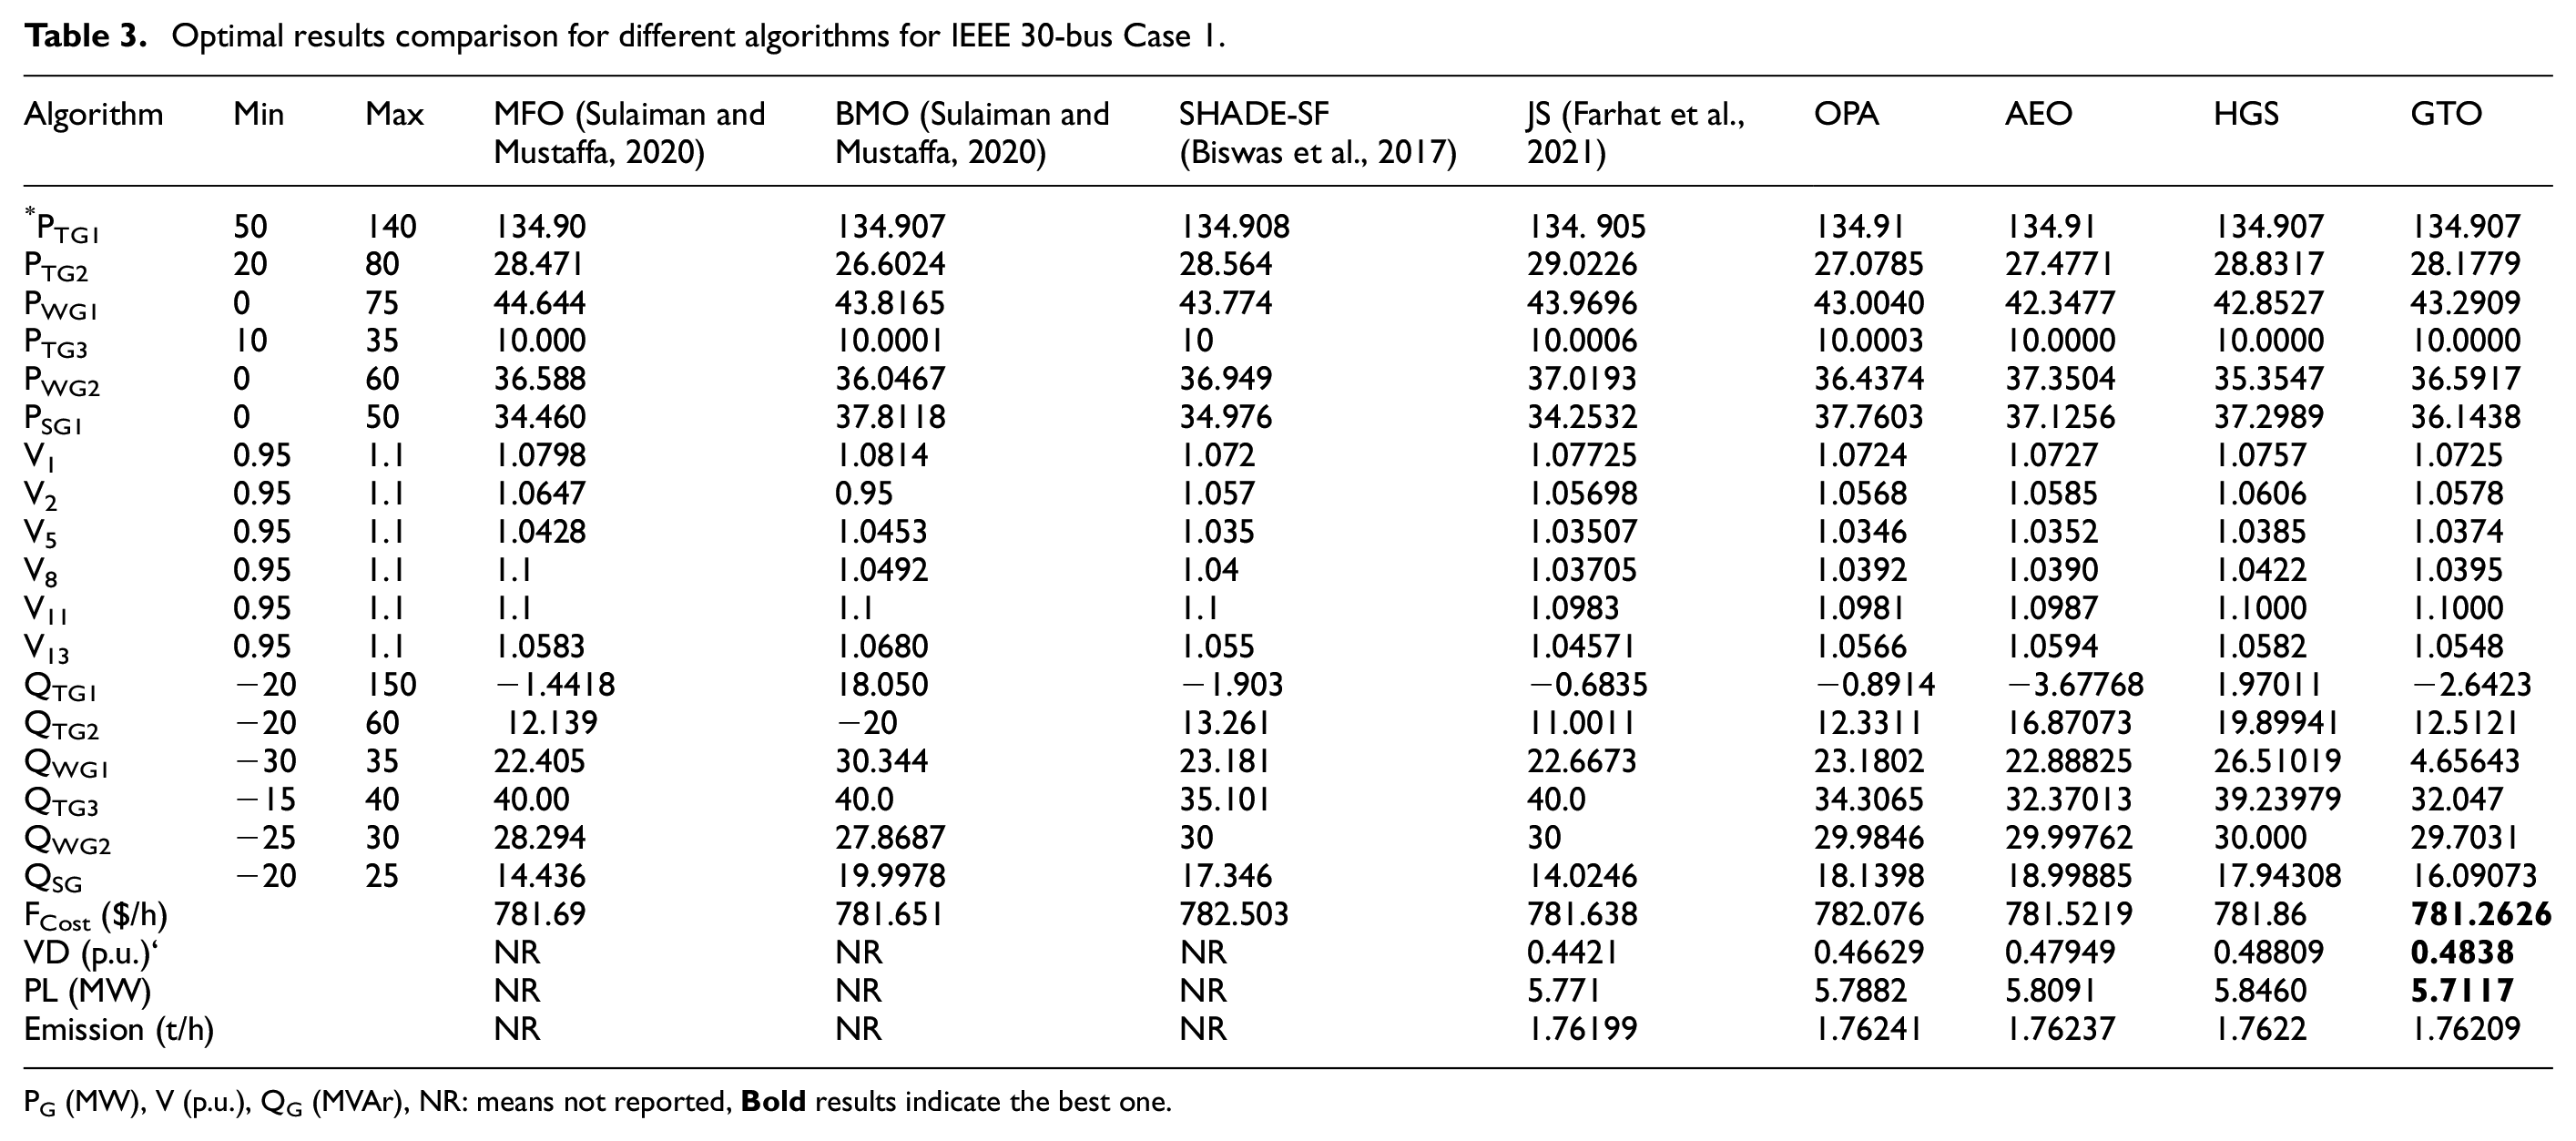
PG (MW), V (p.u.), QG (MVAr), NR: means not reported,
The maximum, minimum values of control variables and detail optimal results are shown in Table 3. That reflect the better performance of GTO in solving the stochastic OPF problem. Figure 7 illustrates comparison between the convergence curves of different OPF optimization algorithms.
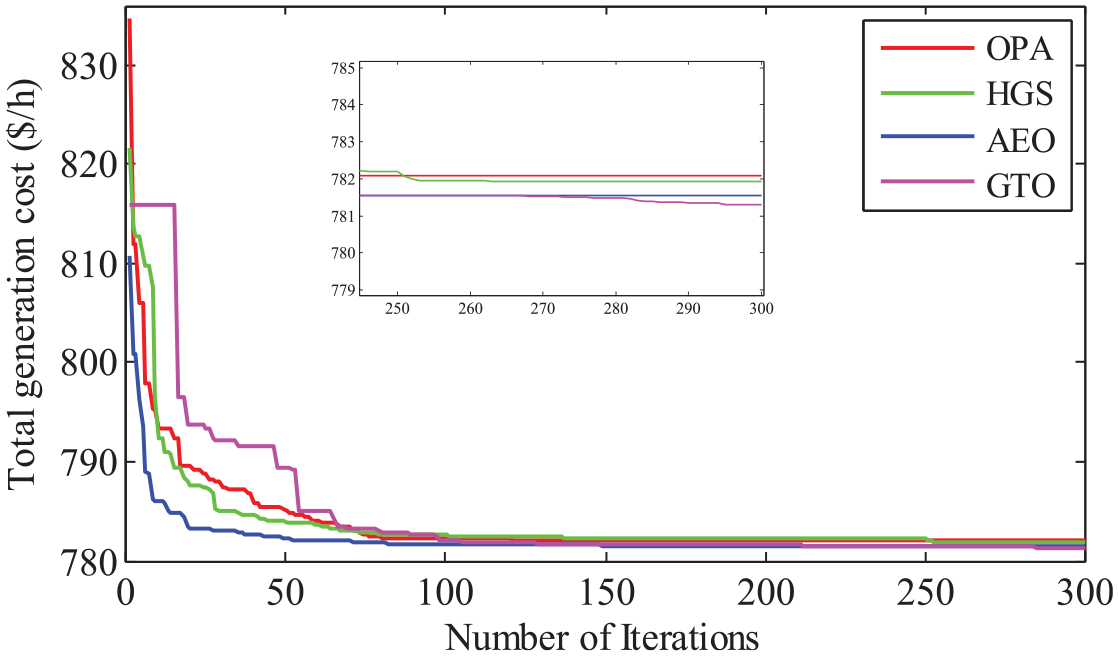
Convergence curves of different optimization techniques for case1.
Numerical results of case 1 show the effectiveness of GTO algorithm, rapid convergence, and high-solution quality when comparing it with other optimization methods. The minimum value of total generation cost achieved by GTO is 781.2626 MW. Consequently, GTO exceeds all published algorithms and all other applied optimization techniques. It is worth to note that PWG1 and PWG2 indicate the scheduled powers from wind generators #WG1 and #WG2, respectively. The emission rate is calculated by using the optimal scheduled power of thermal generators, where reserve is assumed an alternate source that does not add to the emission. From Table 3, it can be seen that the proposed GTO reached the smallest cost with 781.2626 $/hour, and outperformed all optimization techniques, PSO (784.3400 $/hour), TLBO (782.6767 $/hour), SHADE-SF (782.50 $/hour), JADE, NBA (784.038), ALO (782.81 $/hour), jellyfish (781.6387 $/hour), artificial ecosystem optimizer (781.5219 $/hour), and hunger games search (781.86 $/hour) as well as vs. a recently optimization technique which introduced October 1, 2021 entitled, orca predation algorithm (782.0760 $/hour).
Based on the results obtained in the literature regarding solution of classical OPF problem and Table 3, we can state that with insertion of renewable energy sources, the total generation-cost decreased from 800.00 $/hour as a reference cost to 781.2626 $/hour, that is, around 18.7 $/hour. More precisely, if every hour can save the cost of 18.7 $, and the operating time per-year is supposed as 7500 hours, then operating time from the propose optimizer GTO can save 140,250 Dollars in total every year. Consequently, the insertion of wind generators and solar power plant significantly contributes on the reduction on total fuel cost compared with the original system configuration (i.e. without RES).
Case 2: Optimized-cost against reserve-cost
In second case, all parameters are retained the same as in case 1 except reserve cost-coefficients. These coefficients for both wind generators and solar photovoltaic unit are varied by discrete-step of 1 starting from 4 to 6, that is, =4, (case2-a), = 5, (case2-b) = 6, (case2-c). The penalty cost-coefficients for all intermittent sources are similar to the first case. The optimal power scheduled of generators is presented by bar graph in Figure 8 and compared with those found for the base case (case 1). For clarification purpose, Case 2-a describes case when reserve coefficient
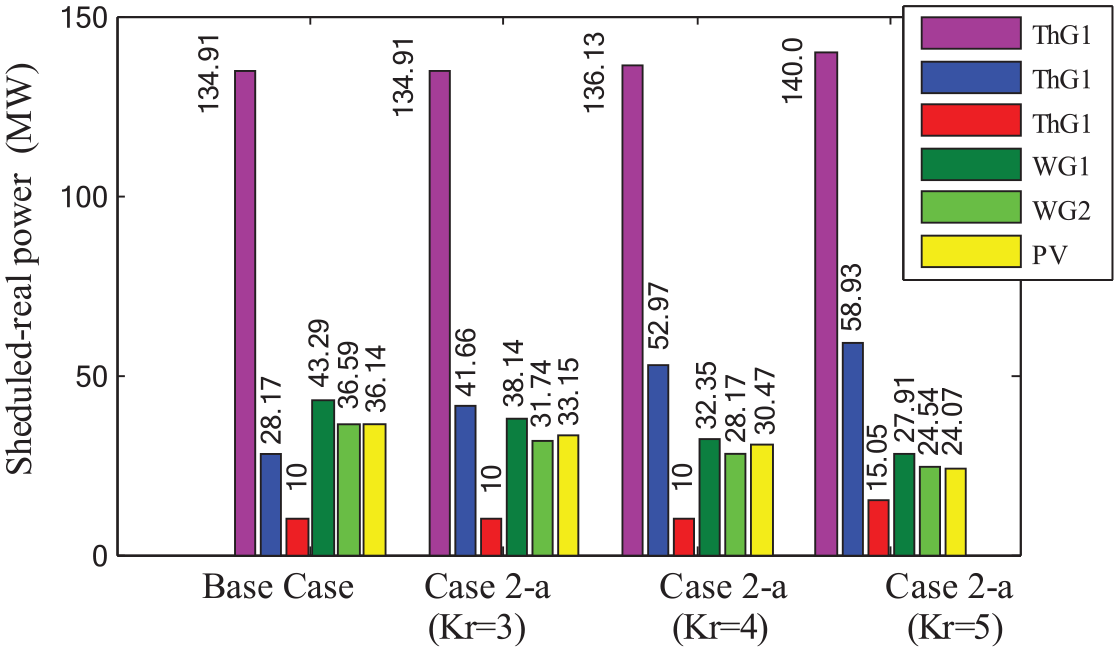
Optimal scheduled active power against reserve cost coefficient (case 2).
This shortage in power automatically compensated by thermal generators which result in increasing the cost of thermal power generators due to the increase of the output power illustrated in Figure 8. In summary, total generation cost raises with the increase in the reserve-cost coefficient.
Figure 9 presents voltage profile of load buses for all sub-case 2 and case 1. it can be seen that all the voltages are within the limits predefined by the system-operator.
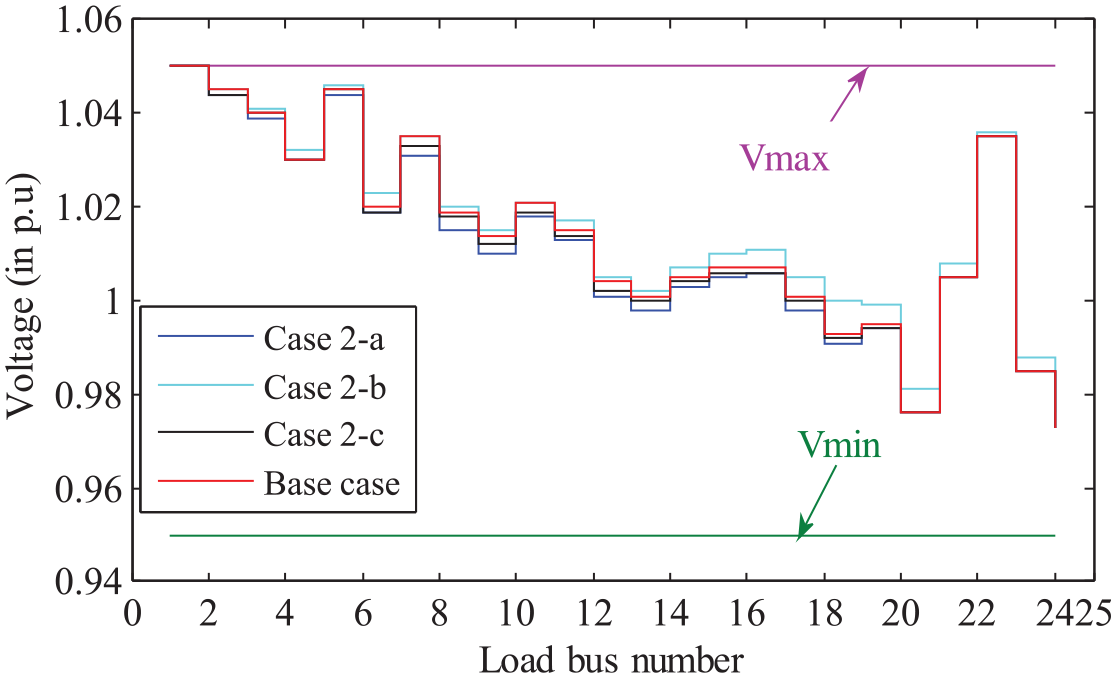
Voltage profiles in load-buses for case 2.
Case 3: Optimized-cost against penalty-cost
Unlike to the second case, in this case study, all parameters of reserve cost are keeping as in first case excluding penalty cost-coefficients. Coefficients of penalty-cost for all wind generators and photovoltaic power plant are raised from 1.5 to 5 by the following order, that is, = 3 (case 3-a), = 4 (case 3-b), = 5 (case 3-a). The optimal power scheduled of six-generators is represented by bar-graph in Figure 10 and compared with those found for the case 1 in the same figure.
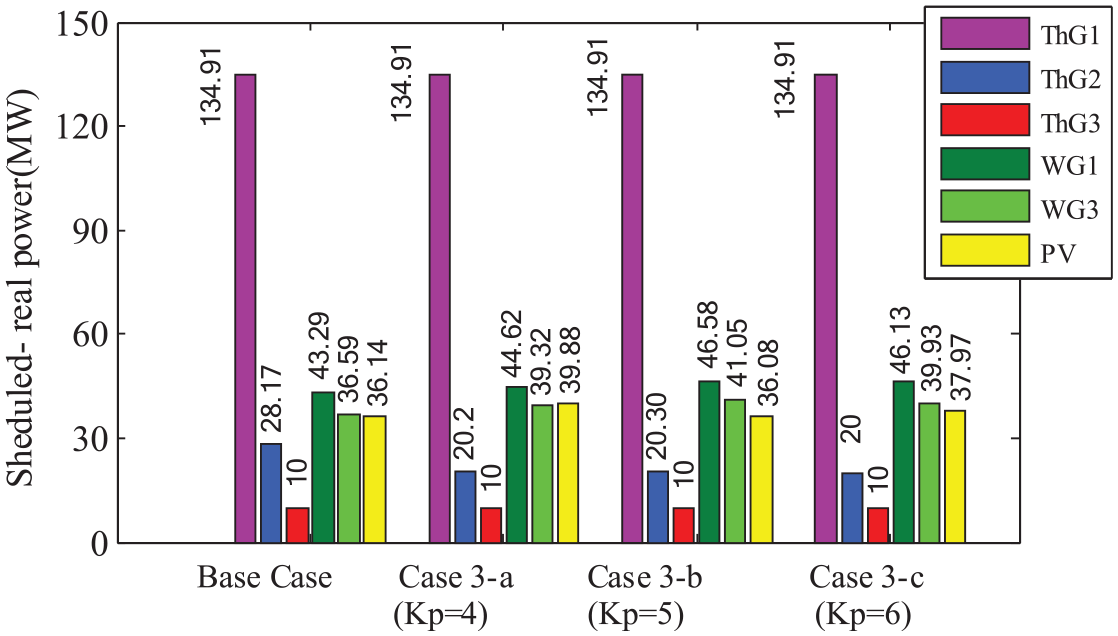
Optimal scheduled active power against penalty cost coefficient.
When penalty cost coefficient increases, the optimum power scheduled from wind and solar PV generators increases too, leading to decrease the output of thermal generating units with a not uniform manner. This different can be justified by the economic dispatch between three thermal generators, in which considerable part of power is dispatched on the generator which having the lower production cost. On the other hand, the scheduled output for all renewable energy sources also seems not to uniform, which can be interpreted by the highly nonlinear relation between PDF and reserve / penalty cost of both solar and wind generators. It is also seen that the thermal generators cost (ThGx) is constant and a steady rise in total cost is observed.
Figure 11 illustrates the schedule reactive power of generators, for sub-cases of third case. By comparing obtained the reactive power displayed in Figure 11 with their imposed upper and lower limits, generators ThG3 and WG2 operate at maximum limits of reactive capability for many cases. So, following the reactive power constraints is a must. Consequently, achieved results confirm that the proposed solver is able to maintain the solution feasibility.
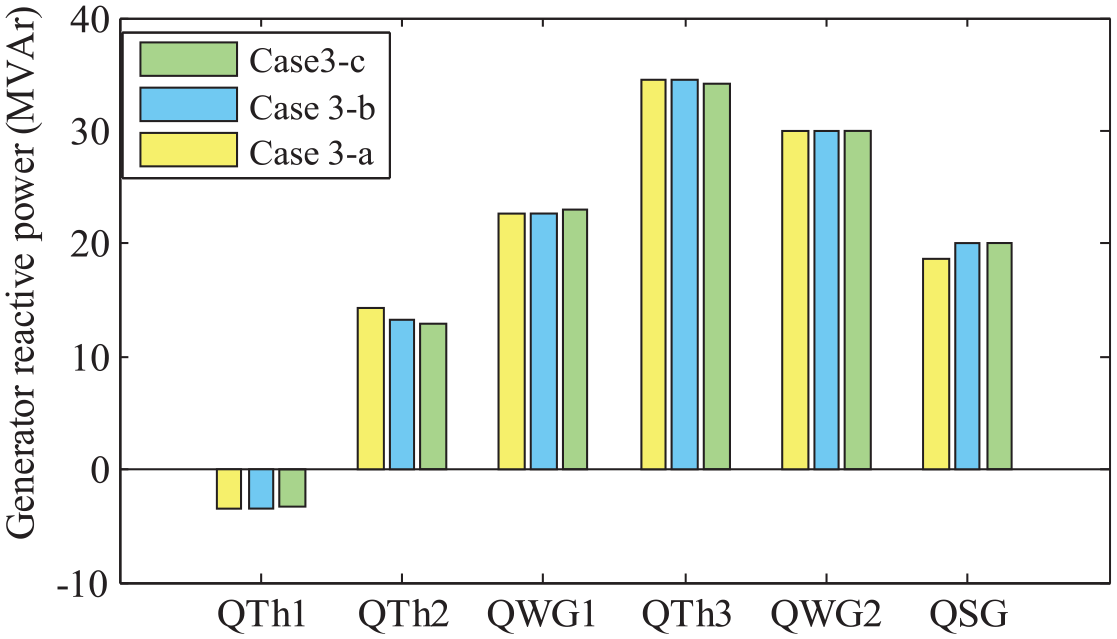
Schedule of generator reactive power for sub-cases 3.
Test system II: Adrar’s power network (APN) DZ 26-bus
To evaluate applicability of the GTO on the practical power system, Adrar’s power network (APN) 28-bus (Makhloufi et al., 2016) has been considered as test system. Adrar’s power network (APN) is situated in the southwest of Algeria, is isolated grid from the Algerian power grid. It designed to meet the local energy demand in the isolated-site, with a total peak-load up to 291.2 MW, operated in summer 2015. The latter system consists of seven gas turbines based power plants (ThG) with a total capacity of 425.6 MW and two kinds of renewable energy sources, wind farm with capacity of 10.2 MW along with a PV solar generator with 20 MW, respectively. The slack-bus is Bus no 19. All data of test system are available in (Naidji and Boudour, 2020). Therefore, there are a total of 18 variables to be optimized, including nine active power of generators, and nine voltage magnitudes of generators. The Gamesa G52–850 kW machines has been set as convenient turbines for this site, where wind farm feed the 30/220 kV sub-stations of Adrar, Kaberten and Timimoun. Its characteristics are: Rated power,
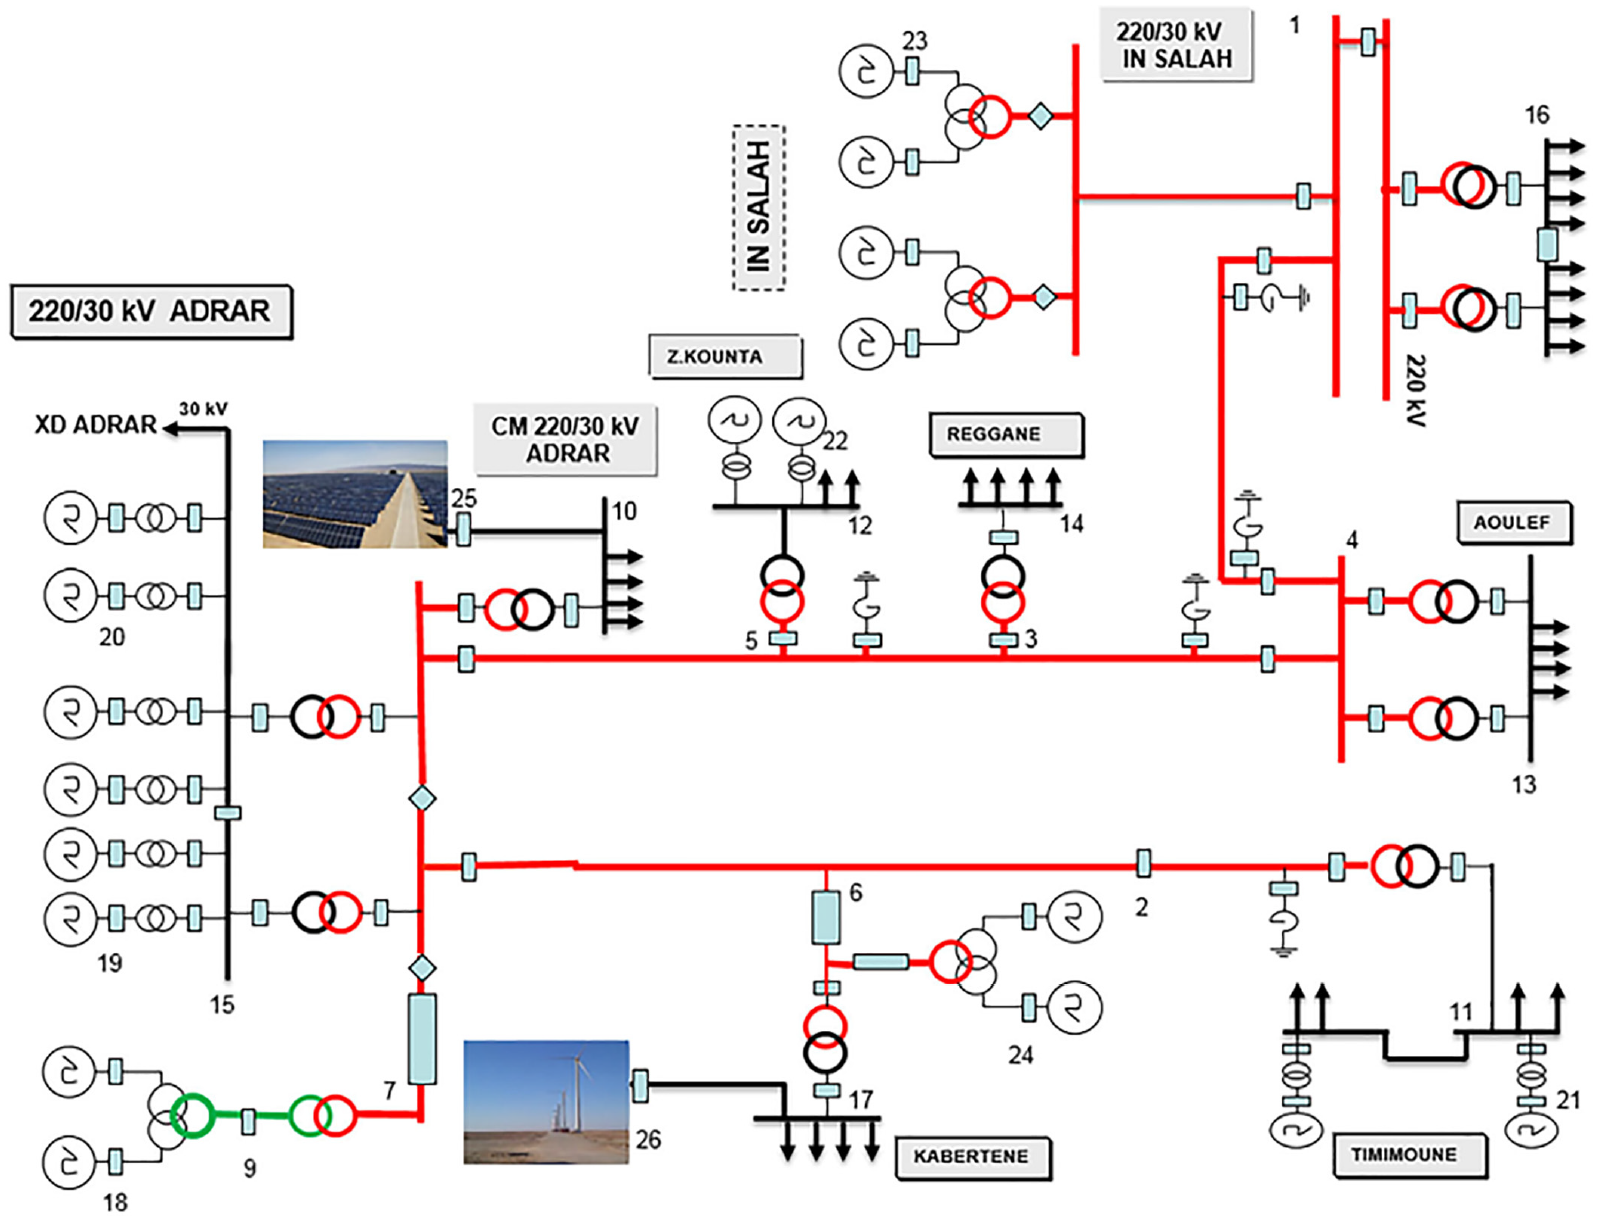
Single line diagram of Adrar’s power network.
The wind characteristics at Adrar region as follow: mean wind speed of 7 m/s for 10 m height, making this zone best in terms of wind energy potential in Algeria during all the year (Diaf and Notton, 2013; Naidji and Boudour, 2020). Minimum and maximum of active and reactive power of the generators for this test system is given in Table A1 at Annex. The present study aims to solve real world problem, which is finding the solution of optimal power flow problem in Adrar power network using meta-heuristic optimization techniques.
To this end, four algorithms utilized to optimize different objective-functions under different system constraints. Two cases are considered herein, with these objective functions, case 1—minimization of total generation cost given by equation (12); Case 2—is dedicated to voltage stability index minimization equation (14).
Results on case 1 of test system II
At this case, the objective-function (12) is minimized. The optimal results obtained by the proposed GTO algorithm and other methods, shown in Table 4, which are the best results achieved over 30 independent test runs. The findings clearly show that the proposed GTO provides high quality and stable solutions in comparison with other metaheuristic algorithms. The optimal settings of control variables significantly reduced total generation cost. Also, it is worth noted that all specified constraints are met, which is reflect the feasibility of solutions.
Optimization Results of the stochastic OPF in the Adrar’s power network.
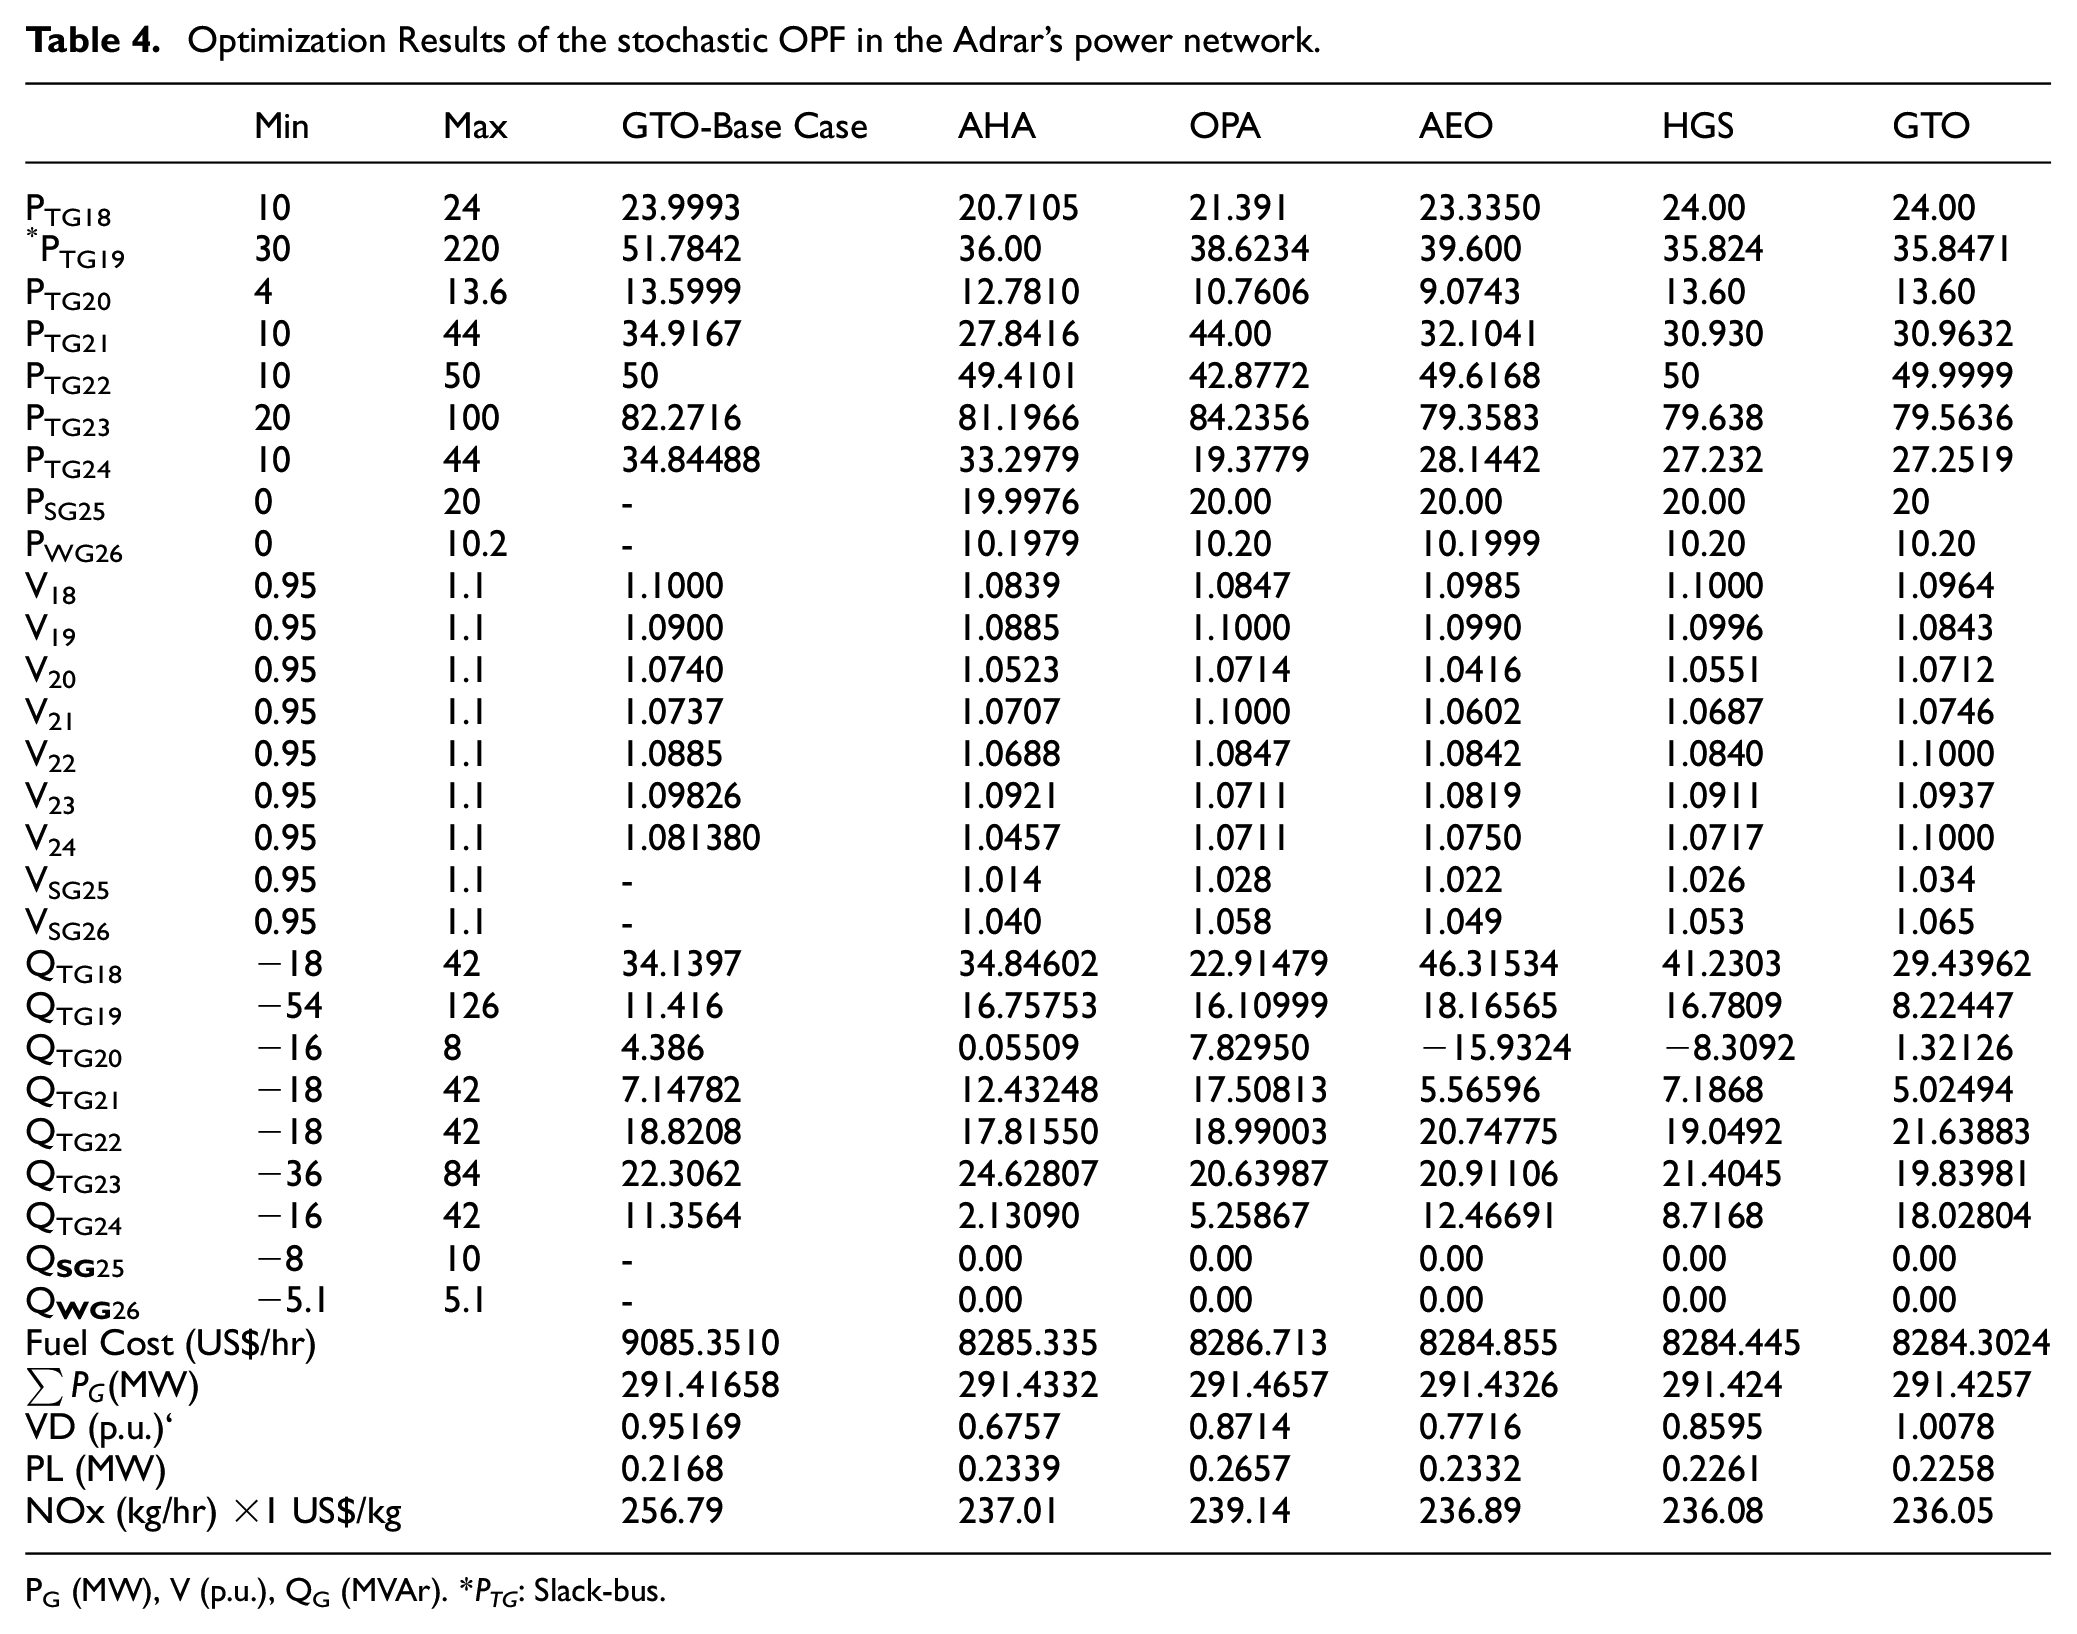
PG (MW), V (p.u.), QG (MVAr). *PTG: Slack-bus.
Figure 13 represents Weibull fitting and wind distribution obtained from the simulation of 8000 Monte Carlo scenarios, while lognormal PDF of solar irradiance and the stochastic power-output of solar photovoltaic unit are illustrated by Figures 14 and 15, respectively. The spotted line illustrates the scheduled power supposed to be delivered to the grid by the solar-PV generator. The limits on all control variables are listed in the table of results.
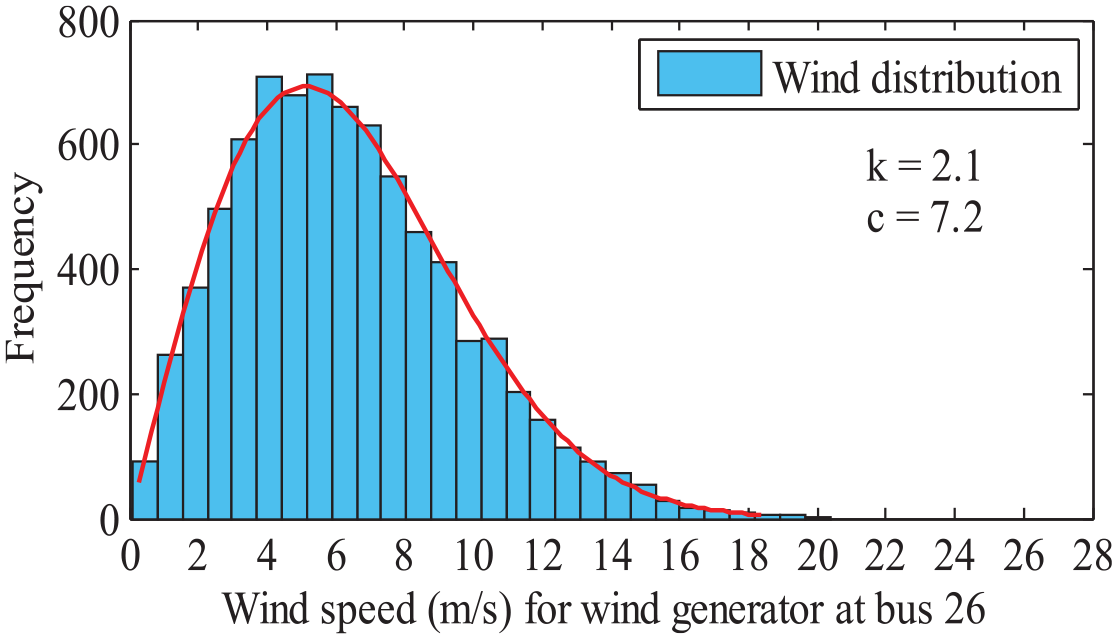
Distribution of wind speed for wind power generator 1 at bus 5 (c = 7.2, k = 2.1).
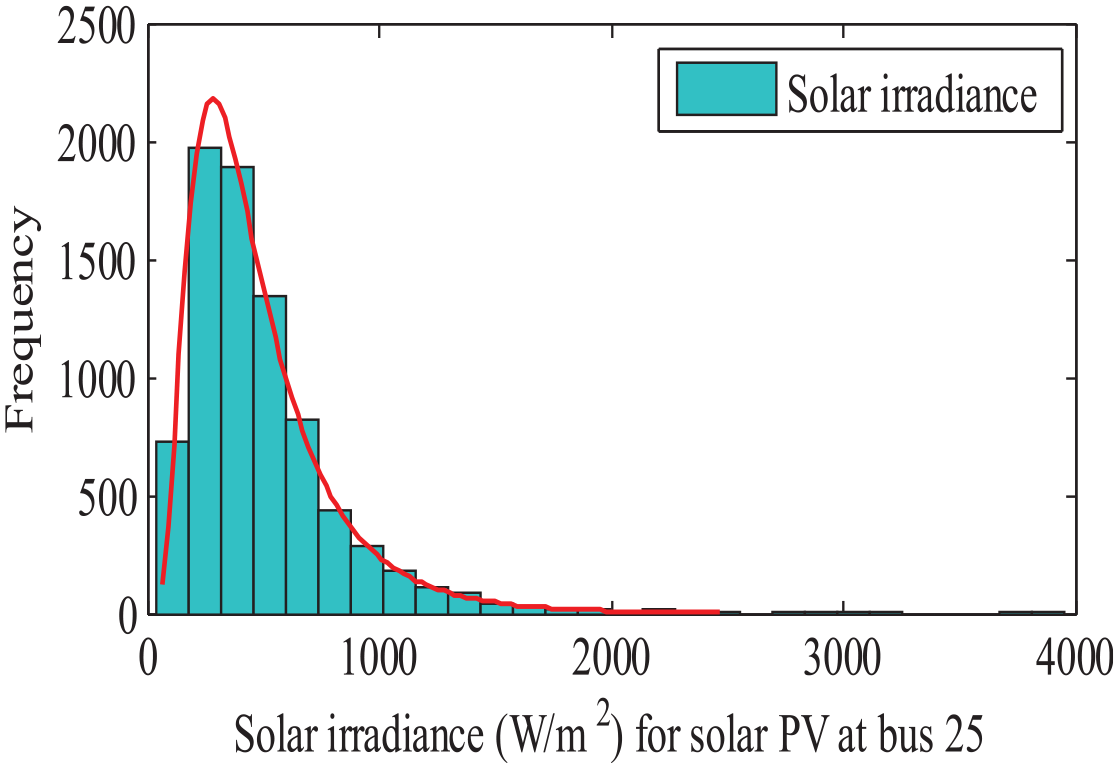
Distribution of solar irradiance or solar PV generator at bus #25.
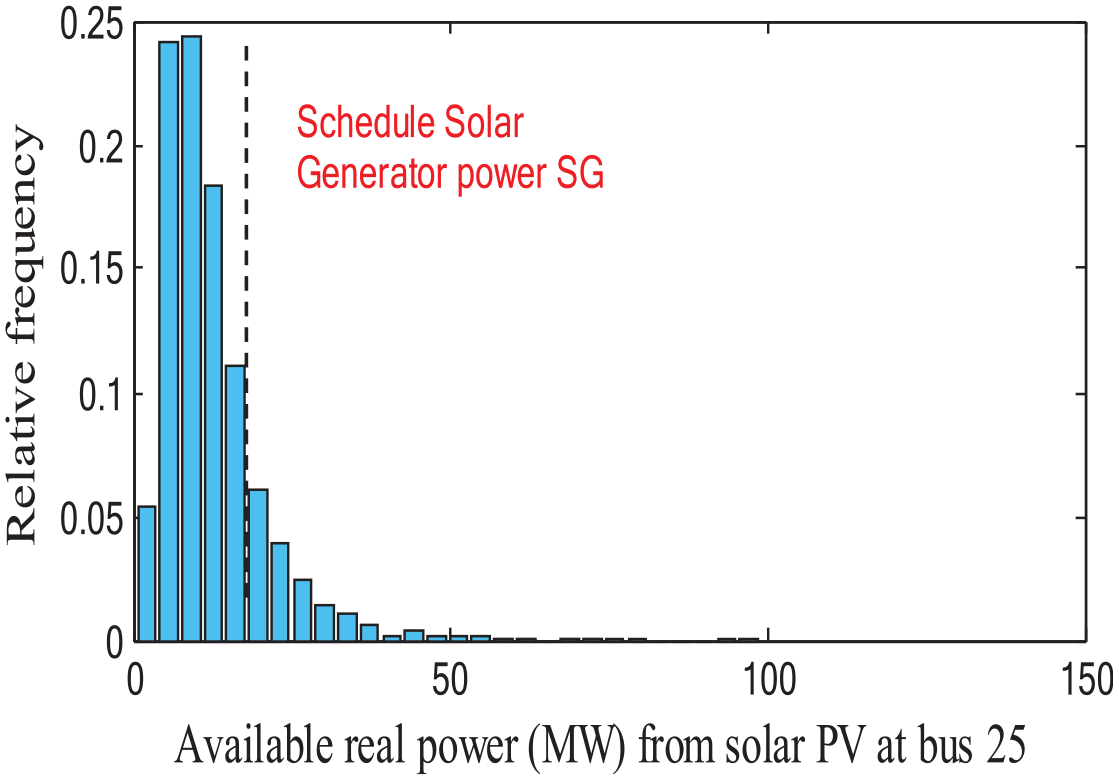
Real power distribution (MW) of solar PV at bus #25.
Figure 16 provides comparison of convergence characteristics for different solvers. Comparing the results given Table 4 (GTO-Base Case) and GTO with RES, it is evident that the total generation cost decreases significantly whith integration of RES into grid. Moreover, rate of NOx emissions decreased too from 256.7 kg/hour to 236 kg/hour, with up to 20 kg/hour. More precisely, if each hour can clean 20 kg of atmospheric pollution from NOx emissions, and the operating time per-year is supposed as 5500 hours, then pollution rate decreased up to 150 tons every year. The explanation is that the hybrid generation system highly contributes to reduce atmospheric pollution with compared with the classical generation system (i.e. without RES). In addition, the total generation-cost decreased from 9085.35 US$/h as a reference cost to 8284.3 (US$/h), that is, around 801 US$/hour, that is, up to 4.40 million US$ per year. Base case reports the simulation without considering renewable energy sources. In this case study, minimization of total generation cost is performed and the obtained results were listed in the first column of Table 4.
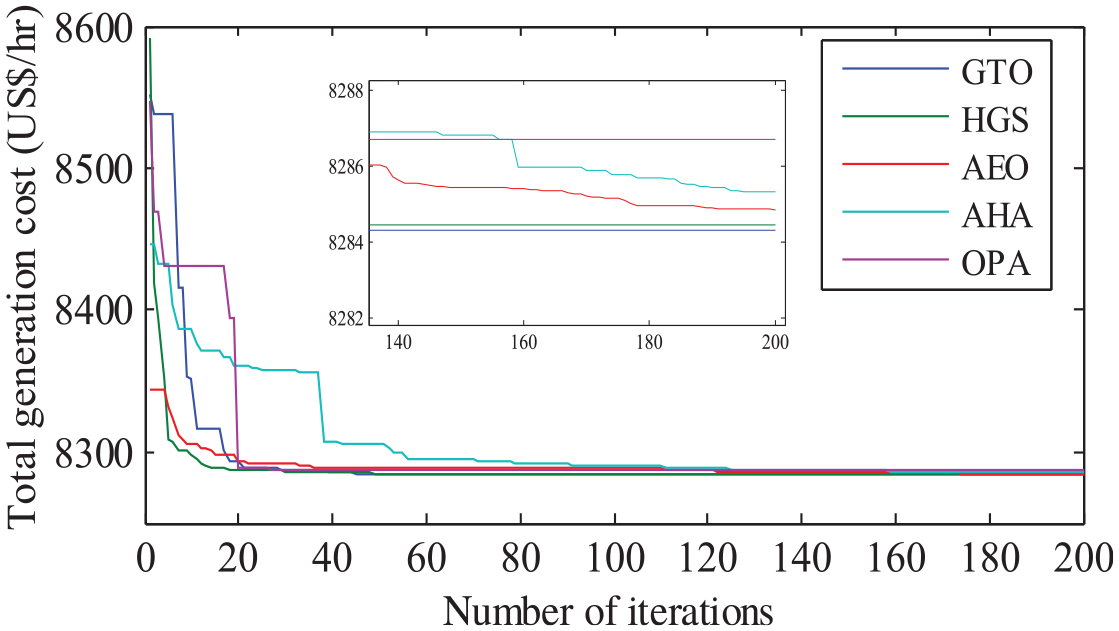
Comparison of convergence curves.
Results on case 2 of test system II
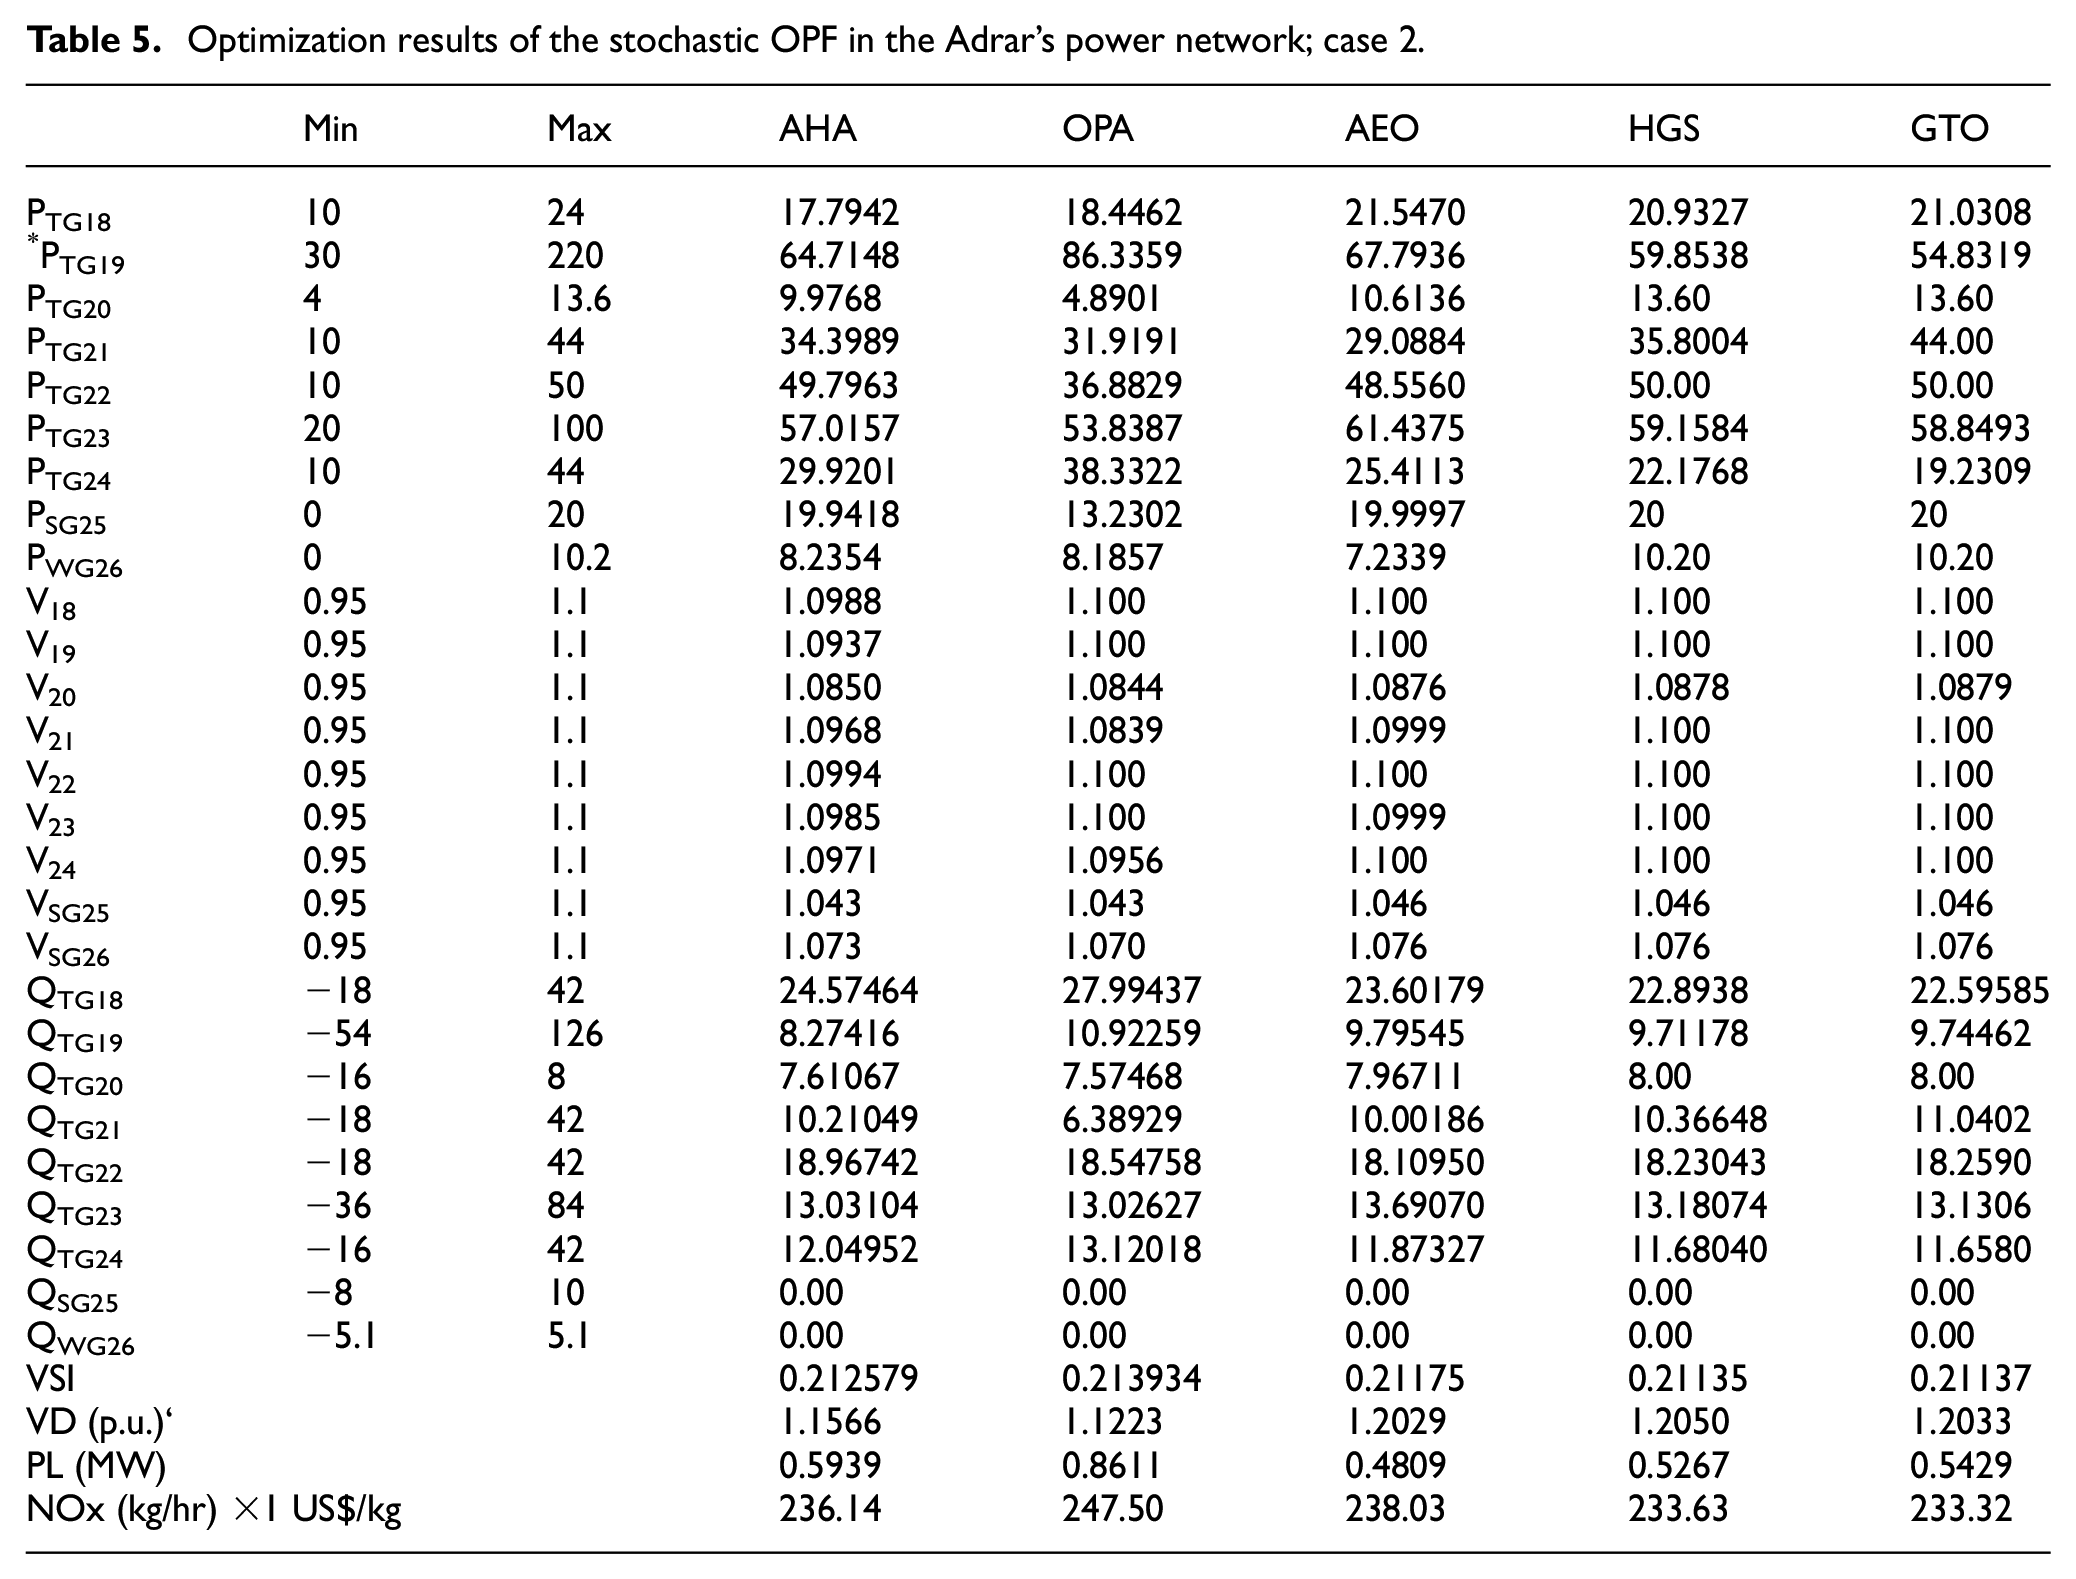
In this case, the voltage stability index given by equation (14) is minimized. The optimal control variables obtained from different methods as well as the PLoss, VD, and NOX emissions, shown in Table 5. The findings clearly show that the proposed GTO outperformed all other applied optimizers in terms of VSI enhancement and solution convergence. From numerical results can see that both of hard and soft variables are within admissible limits, reflecting the feasibility of solutions. Figure 17 describes voltage profile for case 2 of Adrar’s test system. Voltage deviation and VSI were reduced by 72.48% and 17.56% respectively compared with the base case. As a result, even with the realistic power network, the GTO algorithm gives the best adjustment of control variables and converges well to the optimal solutions. In short, it has been also proven that the proposed GTO is more suitable to solve stochastic OPF than the other optimization technique, in which it can not only benefit from best solutions, but more importantly guarantee the feasibility of solutions achieved in two test power systems.
Optimization results of the stochastic OPF in the Adrar’s power network; case 2.
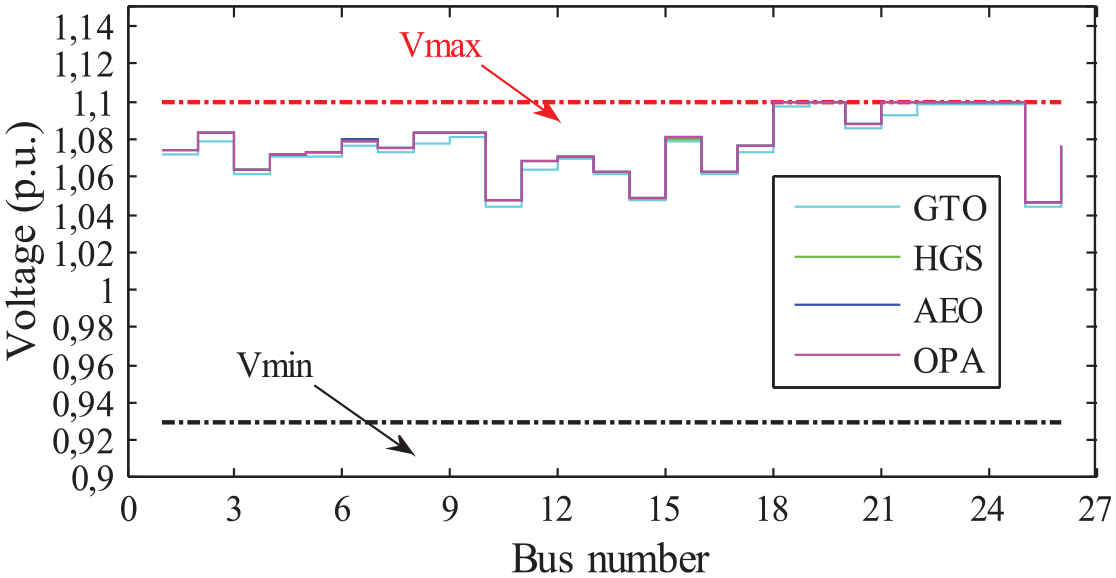
Solution of voltage profile for both cases of test system II.
Conclusion
This article presents an efficient and robust gorilla troops-inspired algorithm to solve the stochastic optimal power flow (OPF) problem in the modern power system. Uncertainty nature of both solar PV power plant and wind energy sources have been modeled based on the Weibull and lognormal PDFs distribution, respectively. To investigate the performance of GTO algorithm, three optimization techniques: HGS, AEO, and orca predation algorithm- (OPA) are applied on the modified IEEE 30-bus test system and a real isolated power network DZ-26 bus in the Adrar region. Numerical results of GTO algorithm are compared with the findings found by three optimization algorithms and by other competitive algorithms in the literature. The results revealed that the GTO significantly gives a superior solution, while insuring the feasibility of solutions, where outperformed AEO, JS, HGS, OPA and AHA methods in the base case and other sub-cases whatever the constraints of test system. The findings suggest that the proposed GTO algorithm can be successfully applied to solve highly nonlinear problems and real world problems.
Footnotes
Appendix
Acknowledgements
The authors deeply appreciate the support of “Electric Operator System” of Algeria for providing access to the Adrar power system data. To Memory of my Supervisor in PhD dissertation, Prof., Tarek Bouktir my, I ask Allah Almighty to forgive and have mercy upon him, pardon him and make honorable and grant him the highest degrees in Jannah.
Declaration of conflicting interests
The author(s) declared no potential conflicts of interest with respect to the research, authorship, and/or publication of this article.
Funding
The author(s) disclosed receipt of the following financial support for the research, authorship, and/or publication of this article: This research was funded by Ministry of Higher Education of Algeria and scientific research progects PRFU-2021 (Grant no. A01L07UN100120210002). The research of Dr. Souhil Mouassa has received a support from the higher polytechnic school of Linares, University of Jaen-(Spain).
