
Abstract
Highway functional classifications (FCs) were first created in the Federal-Aid Act of 1921. The purpose of FC of highways is to ensure that national and state highway systems provide both mobility and accessibility for the public. The system created has worked reasonably well over the course of the last 100 years. But problems are occurring and it is time to consider new ways to implement road classification systems. The 1921 legislation established a national system of highways which included a federal aid and primary system for the United States. The national system has greatly enhanced users’ ability to travel long distances by land and to move products from the factory and farm to customers throughout the U.S. much more quickly and cheaply than before. But times have changed and economic growth is being threatened by delays in adding to, improving, and modifying the 3.5 million mi highway network. Both urban and rural daily traffic delays are common. Modification and changing FC of roads take years to finalize. Progress must be improved for continued national transportation success, local growth, and world competitiveness. But even with the willingness to make enhancements in how FCs are managed and modernized, the question is, can the U.S. continue its national economic success? This article will describe two recommendations that if implemented will ensure continued transportation growth and success while taking into account the needs of users at all road levels.
Keywords
The U.S. transportation system has experienced four unique periods since its inception in 1776. Until the early 1900s, most travel was performed using bicycles, boats, and horses. In fact, trails and not roads were common for most users and boats were relied on for moving heavy products because road surfaces could not be relied on. The advent of cars and trucks made land transportation unsafe, partly because horses became spooked with the presence of loud vehicles, resulting in surface transportation safety suffering greatly. Herbert Hoover as secretary of commerce in 1924 ( 1 ) created the National Conference on Street and Highway Safety and a second transportation safety conference in 1926. Because of the great growth in motor vehicles, traffic crashes had become a national problem. However, sponsoring these two conferences soon led to the creation of the AASHTO Green Book, the Manual on Uniform Traffic Control Devices, Uniform Vehicle Code, and the National Traffic Laws and Ordnances. In 1944 President Truman signed the legislation to create the National System of Interstate Highways and in 1956 President Dwight D. Eisenhower signed the Federal-Aid Highway Act which created the initial funding ( 2 ). The Interstate system has had a huge impact on the how U.S. surface transportation has expanded and changed. Subsequent to the safety conferences and the initiation of the federal aid system in 1921 the Bureau of Public Roads, the Federal Highway Administration, and state departments of transportation (DOTs) have together used a highway functional classification (FC) system to create a balanced distribution and arrangement of three road classification systems, known as primary arterial, collector, and local road systems. The purpose of these classifications is to create good travel mobility and easy accessibility for all communities in the U.S.
FCs have continued to be the primary process for managing the U.S. highway transportation network. While the primary objective of FC is to manage the road network, the FHWA uses it as a major component of how federal funds are distributed to state (DOTs). The objective of FC is to create and maintain a distributed road network that provides both mobility and accessibility without overlap while also promoting sound economics and road asset management.
Over the years FCs have not changed much and they have remained mostly as they began. They are an “interconnected network of facilities channeling traffic in both directions from Arterials to Collectors, then to Locals and back again” ( 3 ). In Figure 1, “The Arterials (represented by black and blue lines) only connect to other Arterials. Collectors (represented by the red lines), only connect to Arterials or other Collectors. Lastly, Local Roads (represented by the green lines) can connect to any type of roadway” ( 3 ). Reference ( 3 ) provides more detailed guidelines on how road connectivity is managed for both rural and urban roads.
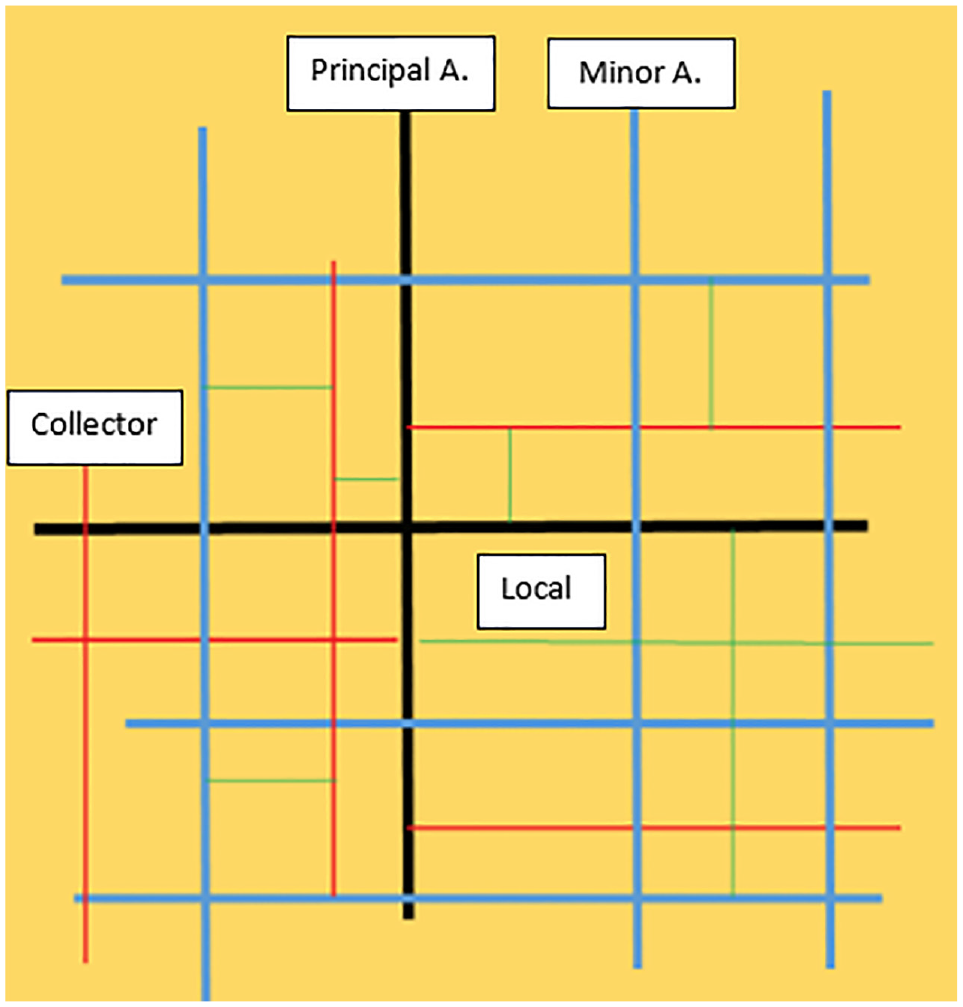
Illustration of arterials, collectors, and local roads connectivity.
Since 2018 two reports on FC have been developed, NCHRP Report 855, and web-only Report 230 ( 4 , 5 ). Report 855 focuses primarily on expanded functional classification (EFC) and Report 230 focuses on the history and components of FC. These reports go into great detail but when all is said and done they are explanations of design differences of road types. Their common element is road design with minimum to no explanation of user/customer expectations of the various road types within networks. Report 855 outlines proposed concepts for EFC but they involve minimal or no updating of the metrics used in FC, namely volume or average daily traffic (ADT) and design speed. Unfortunately, neither ADT nor design speed address the impact on and relationship to numerous other metrics including user safety, infrastructure human factors, changes in road cluster environments, modal impacts, and so forth. Even “safe design speed concepts” fail to consider infrastructure human factor differences between road segments or clusters ( 6 ).
NCHRP 855 discusses how FC could be expanded to include more road classifications than at present used ( 4 ). Currently there are three classifications plus the Interstate system; however, under NCHRP 855 arterials would be divided into (a) primary arterials and (b) minor arterials, making a total of four classifications: principal arterials, minor arterials, collectors, and locals ( 4 ). But the EFC is much wider than that because it proposes to broaden the network to include bicycles and pedestrians, with three facility type subgroups embedded with five layers of topographical features (rural, rural town, suburban, urban, and urban core).
The bicycle facility subgroups are CC (citywide connector), NC (neighborhood connector), LC (local connector) and a separation from traffic level, classified as H (high with physical separation), M (medium with space), and L (low with no separation) ( 4 ).
The pedestrian facility groups are based on pedestrian traffic level, facility width, and whether the pedestrian facility is separated from the roadway. Specific classifications include pedestrian traffic levels—P1 (rare/occasional), P2 (low), P3 (medium), P4 (high)—and pedestrian facility width—site specific, or Min (minimum, Wide (greater than minimum), or Enhanced (wide for large congregating pedestrian groups). The report states, “Pedestrian facility separation should be considered in conjunction with driver target speeds” ( 4 ). The objective of the EFC is to permit bicyclist and pedestrian to be included as additional travel modes.
Examination of NCHRP 230 and 855 shows that they describe what FCs are, how they are used, and the principles they address. Neither of these reports mentions user needs; instead both reports make comparisons of different roads within the highway system and only use ADT and speed as design metrics. They are essentially planning documents that are used to classify roads by an overall network category. Fortunately there are far greater differences in road design than volume/ADT and speed. Workload (WL) will be used later in this paper to identify appropriate road metrics beyond speed and ADT.
In ensuring public mobility and accessibility the only two metrics used in the current FC are ADT and speed. Unfortunately, neither the FC nor the EFC classification scheme includes a broader set of user metrics or even human factors. Road users are the benefactors of the road network and they must be recognized. The objective of this paper is to show how road user workload, a quantified metric for human factors (HF), can be included within the FC.
Basic Concerns with Only ADT, Speed Metrics, and User Tasks
FC and EFC must clearly present to those reviewing proposed changes to existing road systems how the candidate changes affect not only existing roads but also proposed new roads. The issue is how road users will manage their information and control tasks on the original and competing new facilities. User workload, such as information processing and vehicle control tasks, will be improved to an acceptable level and thus be a benefit to the overall system roadway network. Researchers such as Wickens et al. ( 7 ) have undertaken research on user information processing, action taking, multitasking, and workload, and the HF Guidelines report presents over 20 chapters and 100 guidelines relating to human factor issues concerning design, traffic engineering, and application tutorials ( 8 ). Also of importance is what the safety impact will be on the proposed new roads or modified existing roads. The National Highway Traffic Safety Administration recently published that in 2022 there was an increase in highway fatalities to 42,915 (estimated) on U.S. highways even though ADT decreased ( 9 ). The following sections will discuss metrics and candidate enhancement approaches to modify FC and EFC with the goal of making road improvement decisions that include user safety. The key to this process is to recognize the importance of including new FC and EFC metrics for both new and upgraded roads as compared with existing facilities.
A Practical Interpretation of Workload
Psychologists have developed WL definitions for numerous interpretations. According to David Weedmark “workload means different things to different people and the amount of work one has and one's productivity are influenced by many different factors” ( 10 ). Senders’ WL definition is “a measure of the ‘effort’ expended by a human operator while performing a task, independently of the performance of the task itself” ( 11 ). The time to complete tasks is often the criterion used to measure WL. However, driving tasks are often spontaneous and involve many visual and performance tasks in milliseconds. The tasks can involve many fixed and moving objects which further complicate the quantification of user WL. But an easy, relatively simple, procedure has been used by Tignor ( 12 ). It involves using metrics to quantify the road infrastructure in both user static and dynamic conditions. This method is described in detail below and in an earlier TRR paper ( 12 ).
Previous WL principles have not been used in highway design and operations because of the concept’s complexity and its sometimes competing and overlapping multifaceted findings. Its complexity has not been explained to highway agencies, or easily understood, or presented to highway designers for implementation. WL is a definition and has no explicit value. It is a nominal descriptor without scaling. But WL can be given a grouping for aiding identification, and it has been used widely in the other industrial settings like the design of aircraft, submarines, nuclear power stations, and so forth. Tignor’s simplified example illustrates how WL can be used to enhance the EFC development.
Why Include Additional Metrics
The purpose of the FC is to ensure a transportation network that is efficient and economical for road users and taxpayers. In 1921 when the system was initiated the primary travel mode was by highway vehicle, but times have changed and experience has shown that network modifications are needed to successfully deliver successful transportation for multiple travel modes.
Given limited funds and insufficient rights-of-way and incorporation of multiple modes, the network must recognize the needs and the unique operational needs of all mode users. An EFC will improve funding programming, operations, and safety ( 4 ).
Broader metrics can be incorporated in EFC which recognize all modes—motor vehicles, bicycles, pedestrians, and transit. The existing metrics are only volume/ADT and speed. While these metrics are minimally suitable for motor vehicles they are not at all descriptive for bicyclists and pedestrians. Other metrics are needed to be really descriptive of adequate space required, variance of operations, descriptive user interactions, and network safety, and for future modal success as envisioned by private users and business. The challenge is to identify and quantify each of the transportation modes with metrics as a key part of the FC so agencies clearly know whether their road classification applications can be successful.
Federal, state, and local agencies use FC in numerous ways for making decisions on how road networks can deliver mobility and accessibility. Included are safe roads, complete street designs, future planning efforts, and financing. FC becomes more complicated in EFC with the addition of bicycles, pedestrians, transit, and light-rail to the overall transportation network. The addition of these modes is not discussed in the EFC but they can and need to be accommodated.
Tools are now available to aid FC that were not available at the start in 1921. Tools like Google Earth, layered GIS systems, and computer data applications such as Microsoft Excel are now readily available that were not available in earlier years. GIS and lidar data gathering is a prime example. State DOTs are effectively employing these tools to show the level of use and regional variability associated with many metrics (speed limits, 24 h pedestrian and bicycle counts, sidewalk inventory, traffic volumes, etc.). Virginia DOT, for example, has an excellent system of “GIS layers and databases available via its ArcGIS Online account” ( 13 ). A few of the GIS layers are for bicycles, FC, levels of service, census, and so forth.
What is not in the layers is information on traffic operations, and user workload metrics (neither static nor dynamic) which are descriptive of the quality and difficulty of traffic demand, stress, and traffic flow encountered by users regardless of the mode ( 14 ). Quantified metrics aid in distinguishing service between existing and proposed roads and the demand presented by other needed modes.
“Static WL” (SWL) features are fixed permanent components that do not change but are a part of the infrastructure, such as vertical and horizontal curves, signage, bridge structures, and intersections. “Dynamic WL” (DWL) features are what users experience when traveling—for example, moving bicycles, pedestrians, vehicles traveling in the same or opposite directions, passing vehicles, traffic queues, operating traffic signals, and so forth. All of these types of metrics can be quantified and will vary according to the type of road classification. Static and dynamic metrics are measurable, not subjective metrics like those used in present and proposed EFCs. Specific quantified metrics add user meaning, strength, and value to FC, and they are user-focused, a key benefit to understanding road networks. WL metrics should be used to help in varying types of roads’ FC, but SWL and DWL metrics are in neither the current nor the expanded FC.
WL for Highway FC
SWL can be determined fairly easily; it is really an inventory of the infrastructure. The individual metrics can be quantified using a road audit, Google Earth, and even drones when available. DWL metrics are a little more rigorous to obtain but conceptually they are easy. DWL can be obtained by an instrumented vehicle, or even simulation. In a recent paper, Tignor used Google Earth and the Interactive Highway Safety Design Model (IHSDM) to obtain quantification SWL and DWL data, respectively, for WL analysis and interpretation ( 12 ). Identification and removal of infrastructure-user issues are important during EFC discussions.
A “cluster analysis” approach is proposed for obtaining WL for road network FC. Consider an arterial road segment of a road between intersections 1 and 2 with two sections, called clusters A and B. The public has complained in local newspapers and on radio and television about significant traffic and geometric safety and operational deficiencies (see Figure 2). It has been proposed that the arterial road FC be upgraded to be eligible for increased funds for improvement.
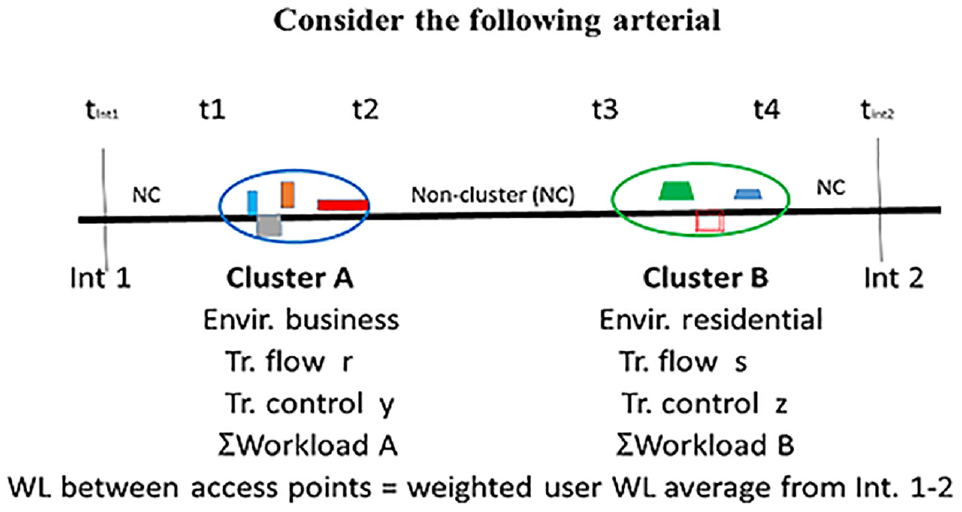
Cluster and non-cluster illustration.
Each cluster is followed by a non-cluster which means the geometric and traffic conditions within the cluster are believed to be different from the upstream cluster. This situation is really an alternating recurrence or renewing of clusters. Users’ operating time between the cluster and non-cluster are renewal occurrences which have different frequency, time duration, and WL. As will be shown, WL and quantified metrics can be meaningful aids for decision makers to assess whether the road segment differs from nearby roads in the network and from proposed new or modified roads.
A WL analysis can be undertaken by quantifying the workloads by clusters and non-clusters. Consider the section of road illustrated in Figure 2 which has a cluster A followed by a non-cluster A. Simply, “cluster A” is potentially different from “non-cluster A” from the user WL perspective. The WL will be the sum of the SWL and DWL, each of which has its own metrics; they are illustrated later with an example of the two-lane SWL and DWL analysis concept. The Figure 2 WL concept comes from reference ( 12 ).
Before proceeding further a few cautions should be addressed about choosing WL for the analysis. A psychologist’s use of WL differs from how highway engineers use it. Some systems use WL as a ‘positive’ attribute and others make a smaller contribution, with some incorrectly thinking it is a ‘negative’ attribute. In addition, a psychologist’s WL is embedded with many conflicting or competing hypotheses that remain to be resolved before highway designers can fully adopt it. Clearer modal guidance is needed in how user WL can be implemented by highway designers for use on the entire U.S. highway EFC network. This paper’s highway use of the term WL is deliberately much simpler to understand. It is based on whether the elements have a “presence” within users’ visual field of a road infrastructure feature or component users must interact with by investing their thoughts (in seconds or less) without consideration of the type of outcome. While this highway definition is not the traditional WL definition, remember David Weedmark’s statement that “workload means different things to different people” ( 10 ). The analysis focus is on assessing how well clusters and non-clusters function with users employing both static and dynamic WL metrics. For example, designers, when serving as a virtual user, can assess WL by clusters, identify potential system user-stress imbalances, and identify alternative designs. (A virtual designer hypothesizes that they are a real driver or user and then questions how they would react to the proposed design.) Within the highway network there are high-volume Interstates, other arterials, two-lane roads, county roads, and urban city streets. All cluster metrics will vary and each has design and operational limitations, with space being a major consideration. For example, urban city streets’ space limitations are a major constraint when it comes to serving at the same time trucks, cars, buses, street cars, bicyclists, pedestrians, and so forth. How land use and system performance are considered and employed are also important but those discussions are not included in this paper. Some countries have already addressed this quite successfully.
Determining SWL and DWL for FC and EFC
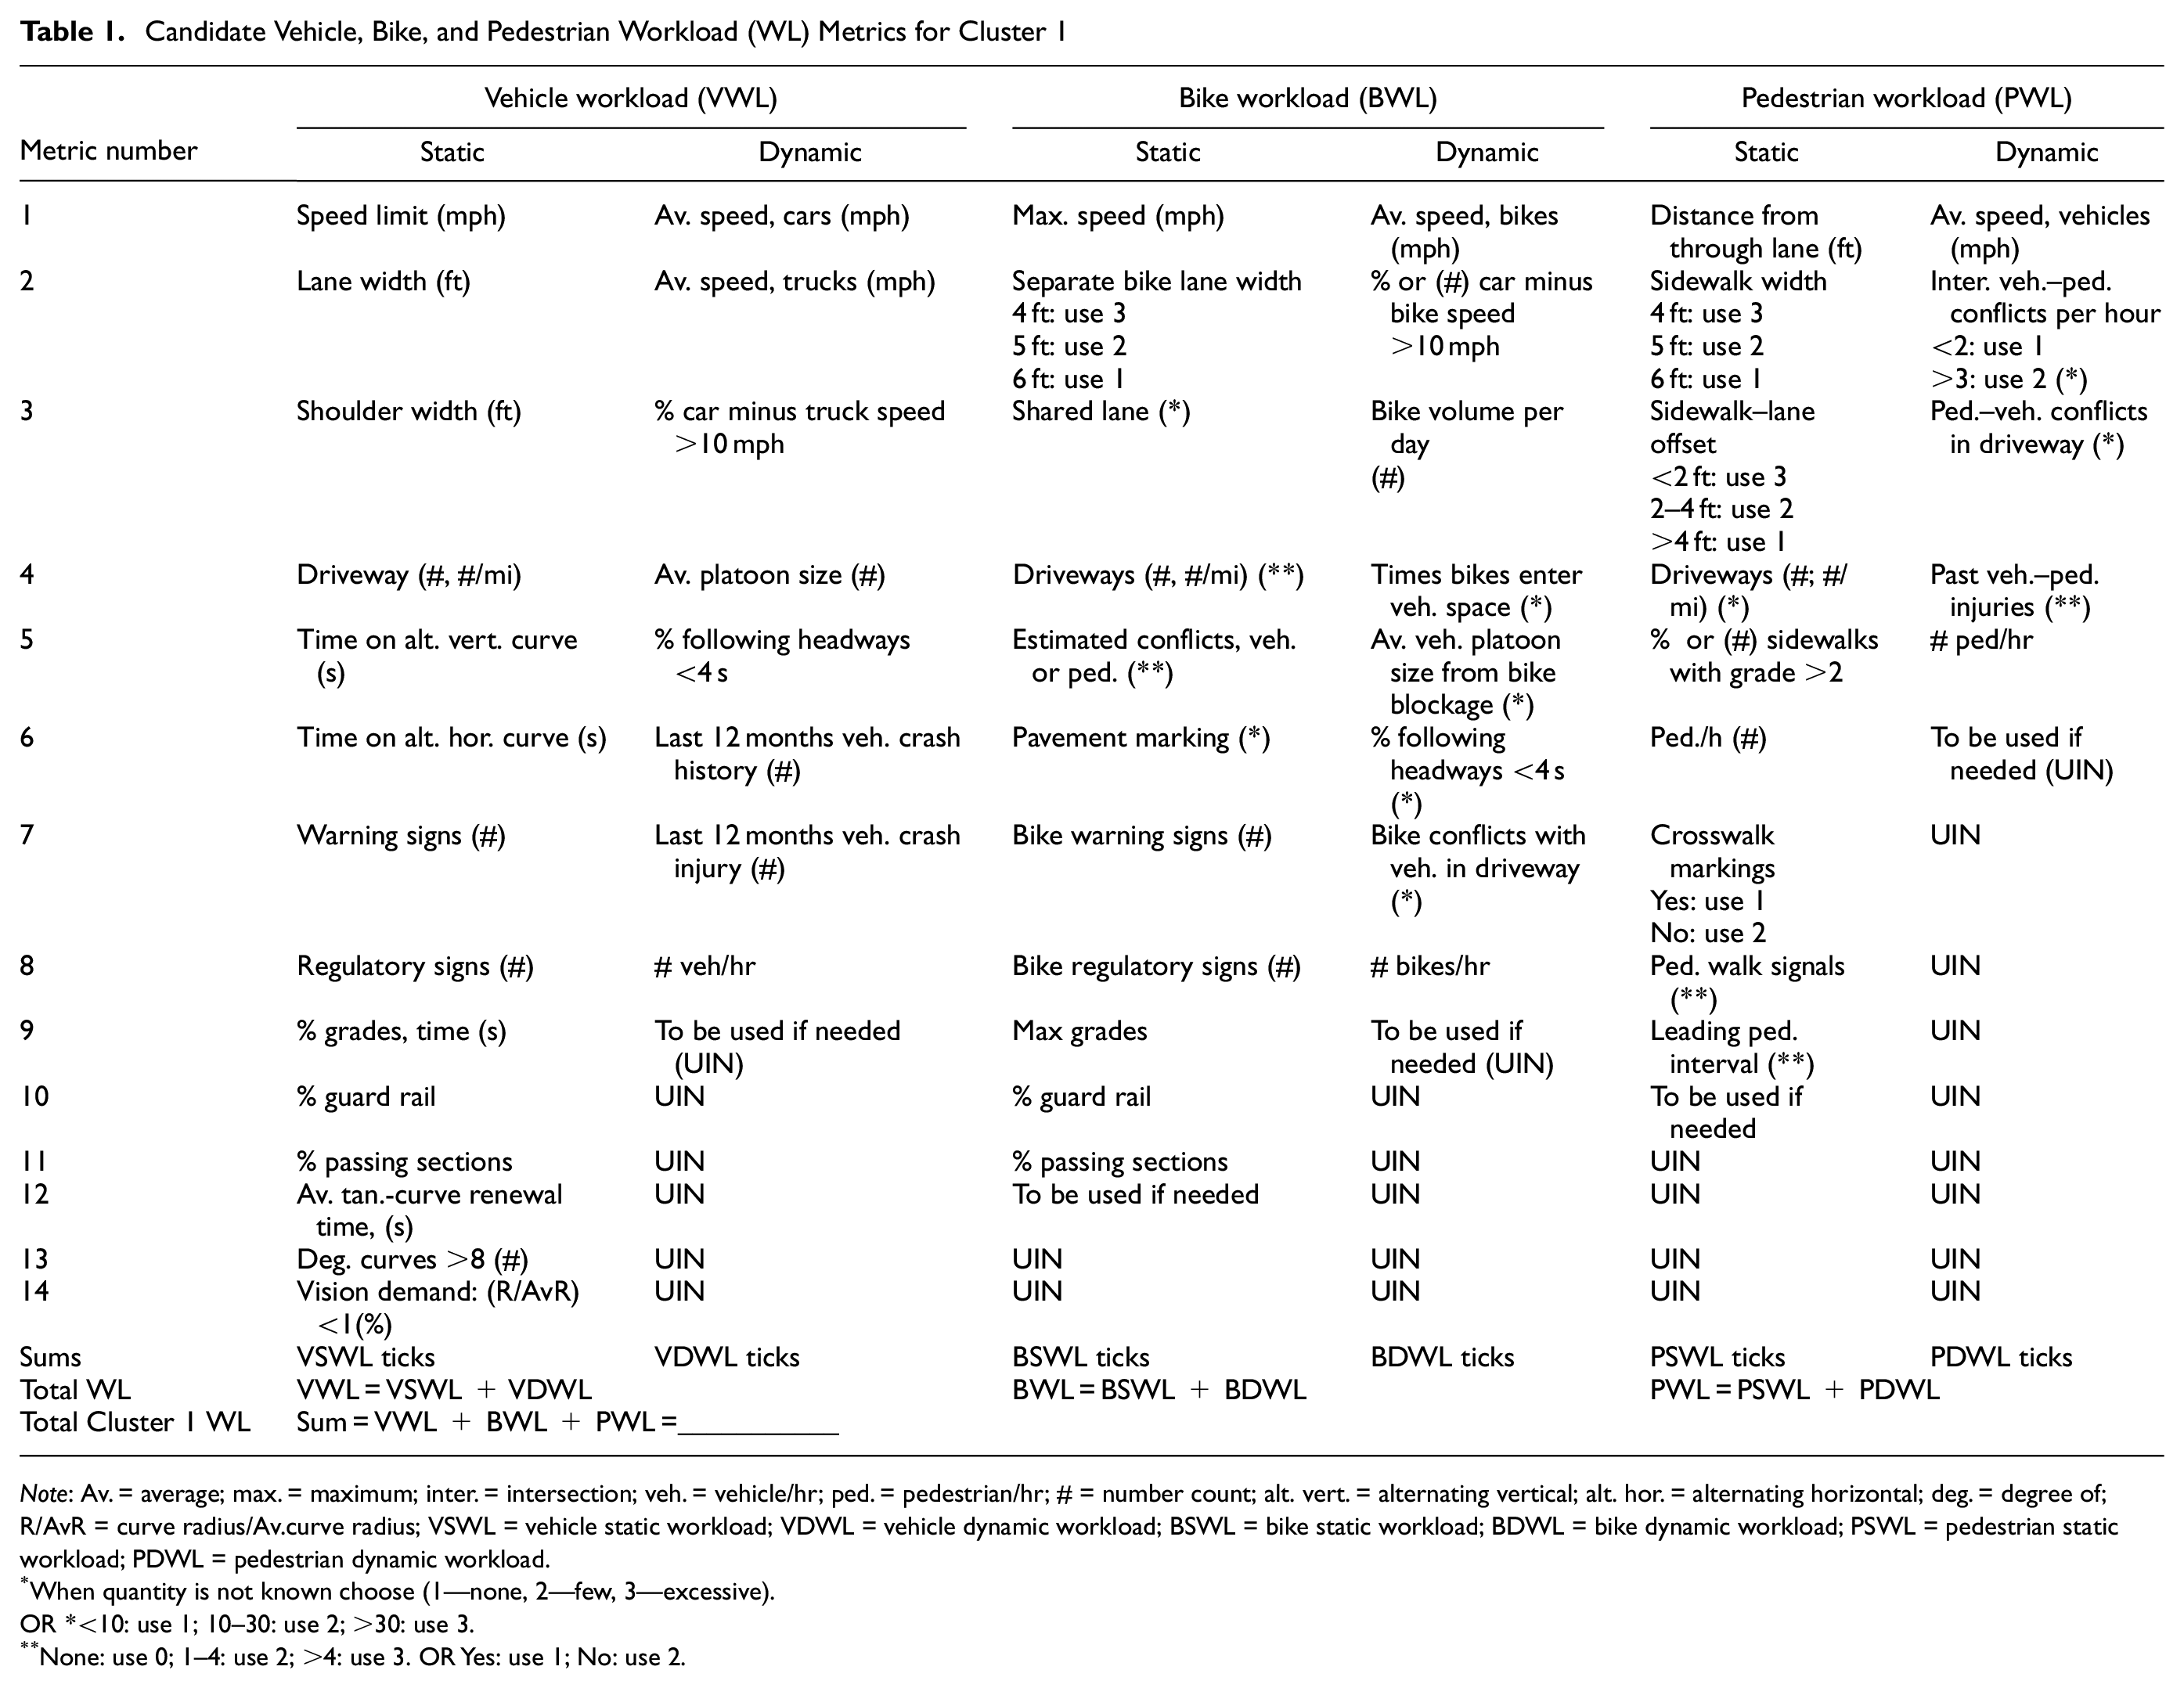
Table 1 suggests candidate metrics suitable for each type of WL where the rows, for the clusters and non-clusters, are from 1 to x as needed for total WL (TWL) estimation of a hypothetical two-lane rural road. Collectively Table 1, when completed, will identify “static, dynamic, and vehicle, bike, and pedesrian WL” metrics where the sum row is a count of “ticks” (numbers of metrics shown in bold) of the critical WL by column metrics per cluster ( 12 ). Many of the metrics are from reference ( 12 ), but some come from previous Texas Transportation Institute (TTI) researchers ( 15 – 17 ). A cell tick will represents the presence of user-stress points encountered or situations within a cluster or segment. Cell ticks and segment sums will be illustrated fully in the following example from Snake Hill Road ( 12 ). For background, Messer, and others, discussed various geometric features and created, based on design experience, subjective values for some geometric design elements ( 15 – 17 ). Note the metrics in Table 1 are unique to the specific transportation mode.
Candidate Vehicle, Bike, and Pedestrian Workload (WL) Metrics for Cluster 1
Note: Av. = average; max. = maximum; inter. = intersection; veh. = vehicle/hr; ped. = pedestrian/hr; # = number count; alt. vert. = alternating vertical; alt. hor. = alternating horizontal; deg. = degree of; R/AvR = curve radius/Av.curve radius; VSWL = vehicle static workload; VDWL = vehicle dynamic workload; BSWL = bike static workload; BDWL = bike dynamic workload; PSWL = pedestrian static workload; PDWL = pedestrian dynamic workload.
When quantity is not known choose (1—none, 2—few, 3—excessive).
OR *<10: use 1; 10–30: use 2; >30: use 3.
None: use 0; 1–4: use 2; >4: use 3. OR Yes: use 1; No: use 2.
The metrics in Table 1 will be discussed first. There are 14 and eight static and dynamic vehicle metrics, respectively. Other metrics can be used when they are available or if the listed ones are not desired. It is the analyst’s choice. Table 1 also identifies candidate metrics for bike and pedestrian modes. Again, the designer or other engineer may select those metrics in Table 1 or provide their own if available and pertinent. WL tables are created for both clusters and non-clusters for estimating section TWL.
In cluster and non-cluster table rows, the metric having the “most” demanding WL occurrences will be shown in
A single estimate of WL for X sections of road for use in either an FC or an EFC can be obtained by taking a weighted travel time average of TWL of all clusters from 1 to X as obtained from Table 2.
Total of All Workloads (WL): Vehicle, Pedestrian, and Bicycle for n Clusters
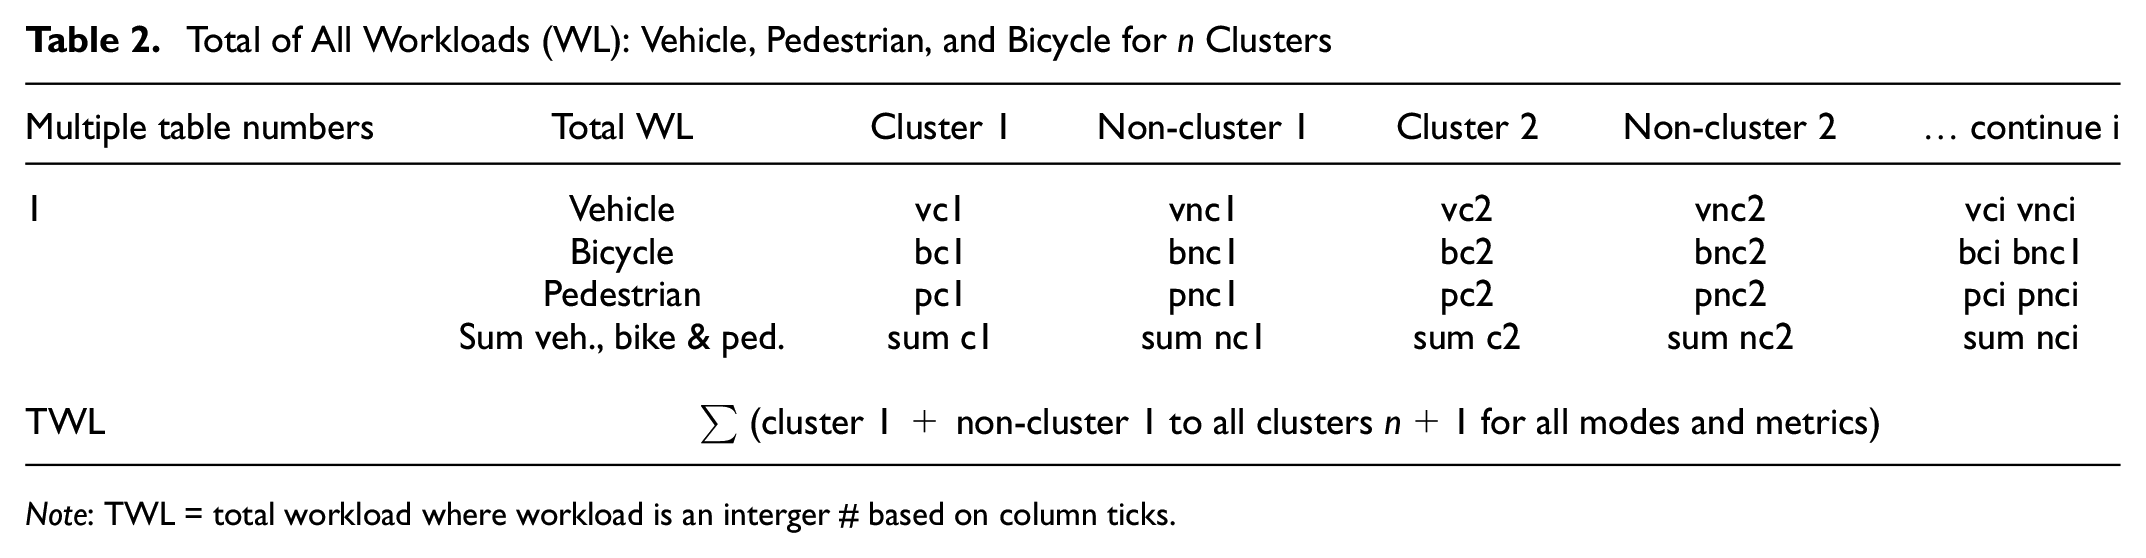
Note: TWL = total workload where workload is an interger # based on column ticks.
Note example “metrics” for road elements like intersections, roundabouts, or road transitions are not included in Table 1. Practicing road designers and traffic engineers would create metrics for those elements that cause significant operational and design differences for all modes whether they be vehicles, pedestrians, or bicycles. The width and placement of roundabout pedestrian crossings, sidewalks and trail visibility, warning device presence, signal timing, and so forth should have associated and unique metrics.
Integration of Road User Vehicle WL with Bicycle and Pedestrian Modes
The bicycle and pedestrian modes use different infrastructure features and metrics, as shown in Table 1. If a WL comparison between an existing or candidate road were being envisioned the TWL could be assembled to include vehicles, bicycles, and pedestrians for all clusters and non-clusters into a single summary WL table like Table 2.
The entire estimate of the segment WL can be obtained by adding all total WLs from each table created and then placed in Table 2.
Table 3 is a vehicle workload (VWL) example of Tables 1 and 2 from reference ( 12 ) showing how cell “ticks” are used in identifying the segments (columns) having the highest stress or WL. A cell tick represents the presence of the metric within the cluster or road segment. Individual ticks do not have a higher or lower scalar value; ticks only represent their ‘presence’. The column sums represent the frequency of the metrics by cluster or road segment which aids the road designer and traffic engineers in comparing road segments and making design or operational adjustments as they deem appropriate to prevent large WL inconsistencies users may otherwise be confronted with. As research progresses, designers may agree on a level of high or unacceptable TWL which really means the users environment may be in a state of flux, a stressful situation, and unsafe. Until then the merit of the TWL is in the metrics used and not the magnitude of the scale.
Snake Hill Road Vehicle Static Workload Stress Ticks Example by Road Segments (or Clusters)
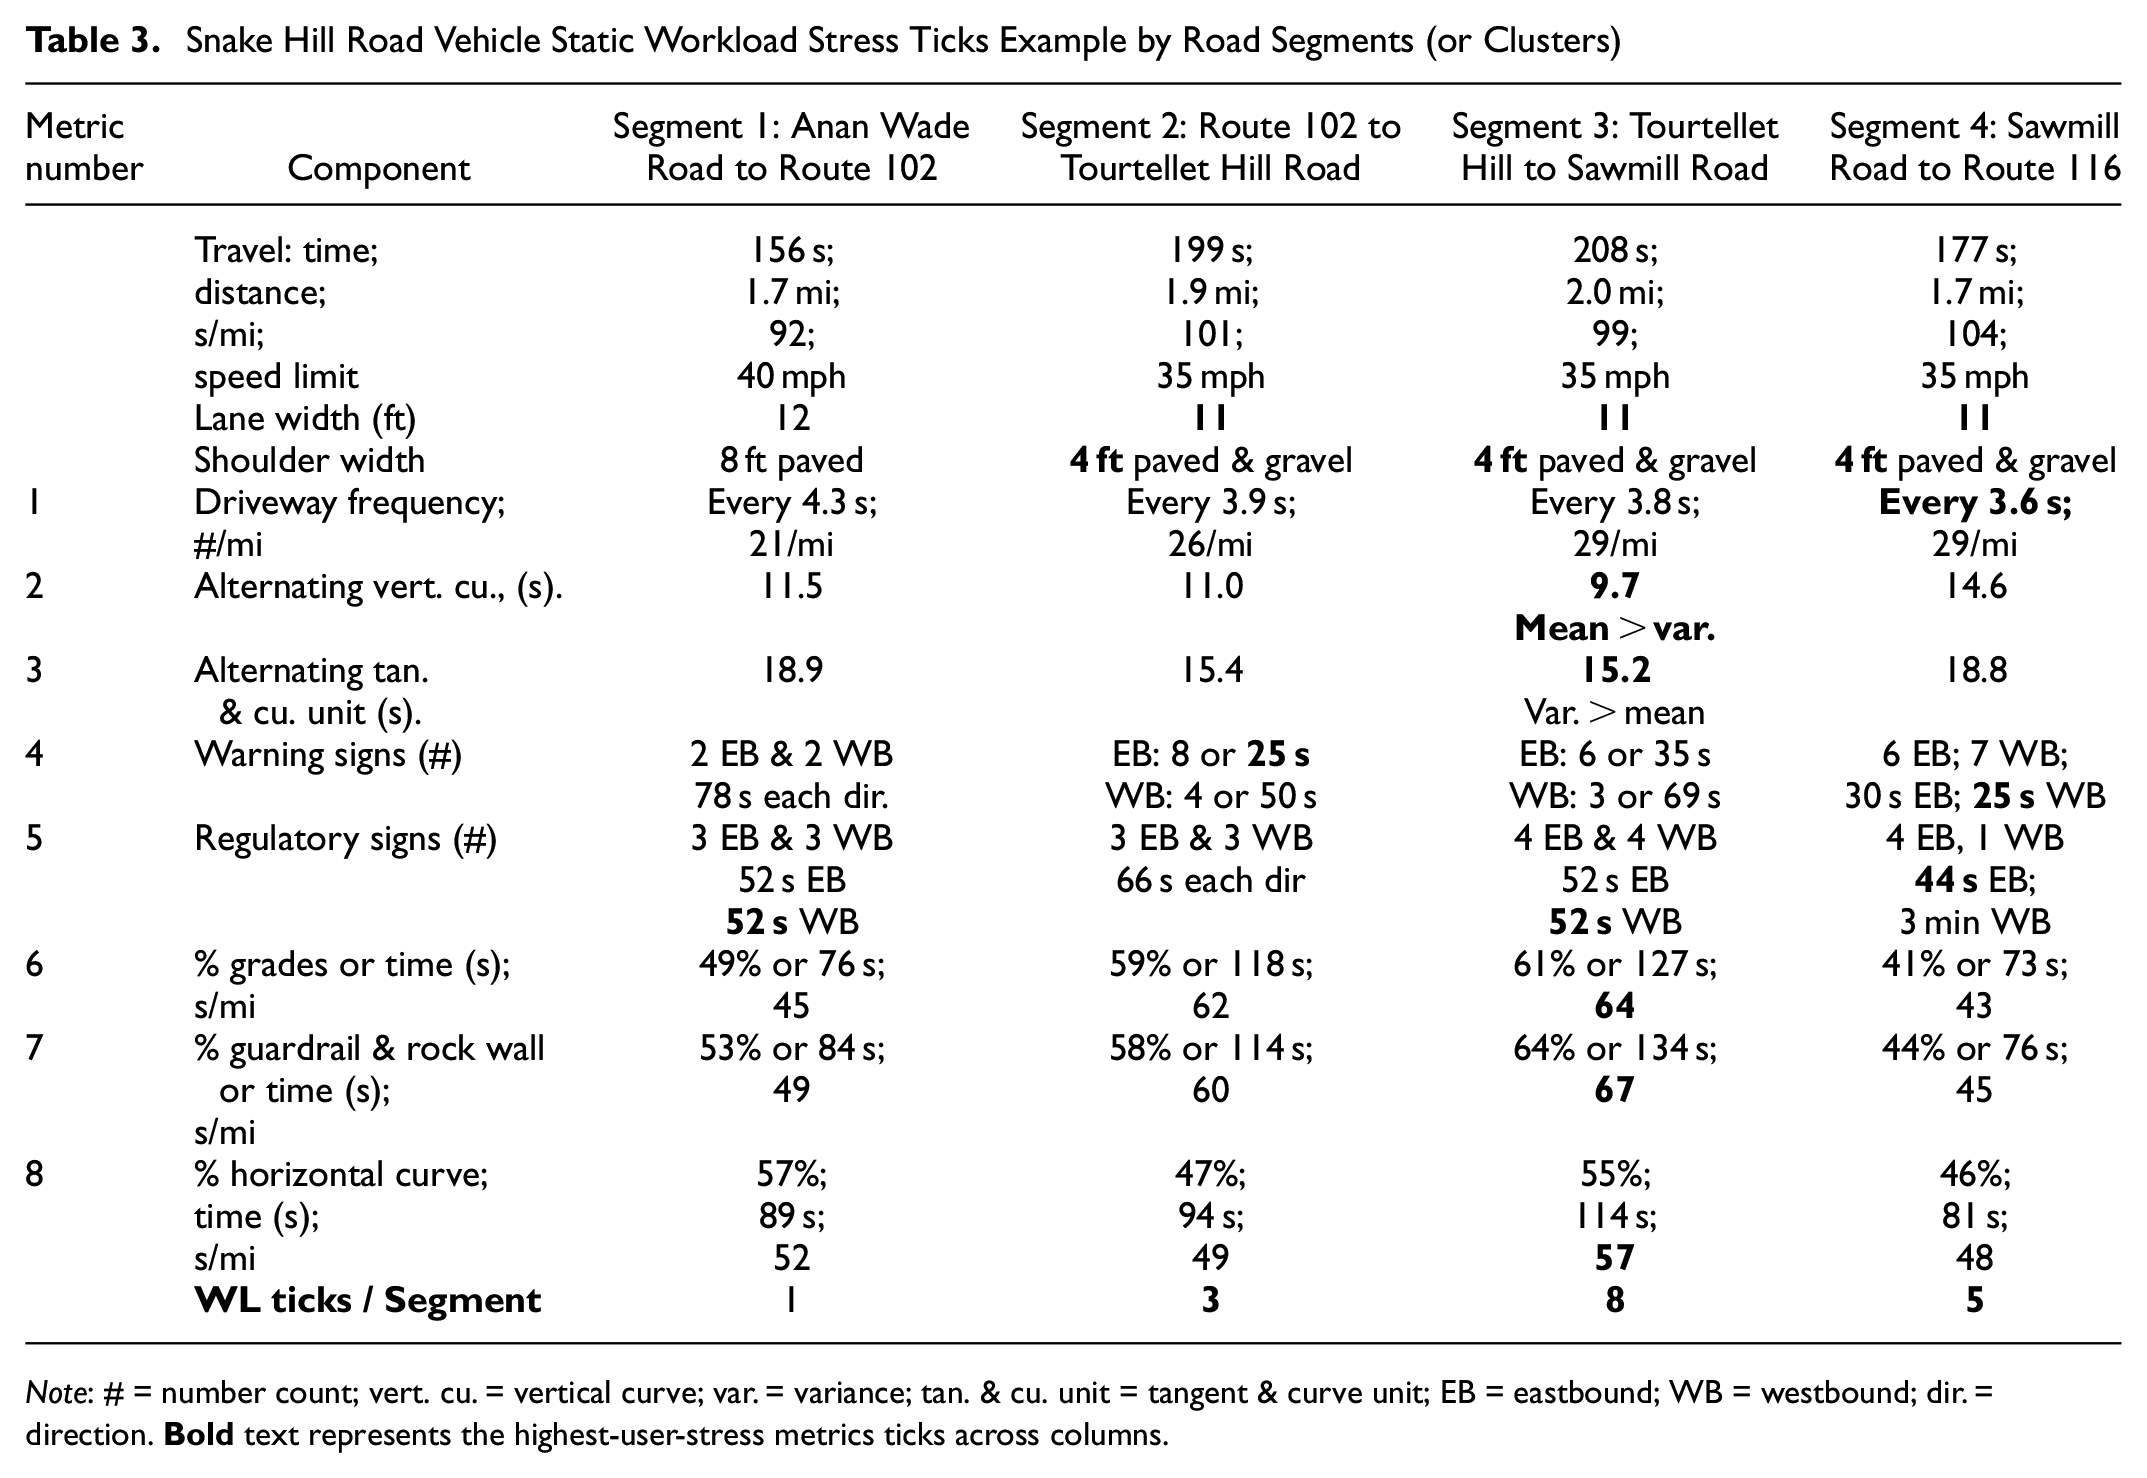
Note: # = number count; vert. cu. = vertical curve; var. = variance; tan. & cu. unit = tangent & curve unit; EB = eastbound; WB = westbound; dir. = direction.
Collectively Table 3 identifies eight “static VWL” metrics where the last row is a count of “ticks” or numbers (shown in bold) of the critical WL metrics by segment. Segment 3 has the highest presence of identified and quantified (eight) infrastructure demands (TWL) placed on road users by the road designers. Snake Hill Road, Table 3, only addressed static VWL and did not have bicycle or pedestrian modes ( 12 ).
Sometimes DWL may require an instrumented vehicle, or even simulation. David Stanek and Charles Alexander reported on a VISSIM simulation in which they simulated a signalized intersection having four types of bicycle phases (leading interval, right turns yielding to pedestrians, all-protected, and right-turning vehicles protected) ( 18 ). They presented delay findings but none on WL.
If neither pedestrian nor bicycle simulations are available, DWL can be ignored and the SWL can be used for both the existing road and the proposed new candidate or modified roadway. They then would be used for the WL comparisons; but it is preferable to have DWL values even if they must be estimated with ordinal values.
It should be recognized that Table 1 metrics do not include “infrastructure-user errors.” Several metrics do address crashes and injuries because they are more easily obtained. Once reliable metrics are available for identifying sources of errors, the associated metrics for them should be included. The metrics shown in Table 1 are those that are now recognized by DOT engineers and designers and can be relatively quickly incorporated into the proposed WL procedure described here. Other yet undiscovered metrics will occur and they too can then be incorporated as WL metrics.
Also, specific metrics for intersections, lane drops, roundabouts and other unique design features are not addressed in this paper because they are just an expansion of the WL procedure being introduced. Unique metrics for those features would probably be created by the analyst if they were a part of the cluster and non-cluster study.
Creation of a Functional Identification Number Concept for the New EFC
In keeping with good HF principles, it is proposed that a “functional identification number” (FIN) be created to quickly describe for reviewers how road users are affected by static and dynamic demands. As an example, the Dewey Decimal Classification system is used in more than 140 countries to track and locate all kinds of publications on thousands of topics and classifications ( 19 ). Its topics are highly variable and unique in some ways similar to highways and road classifications. A vehicle identification number (VIN) is another type of classification system.
The FIN code (Figure 3) will have quantitative metric cells for each mode (vehicles, bicycle, and pedestrian) so they can be collectively assessed with the user demand characteristics (using the FIN codes) for competing, nearby roads in the network. The FIN cell values will be based on the SWL and DWL metrics and TWL assessments as described above. These static and dynamic WL metrics will greatly enhance the value of competing proposed EFC plans for the road users.
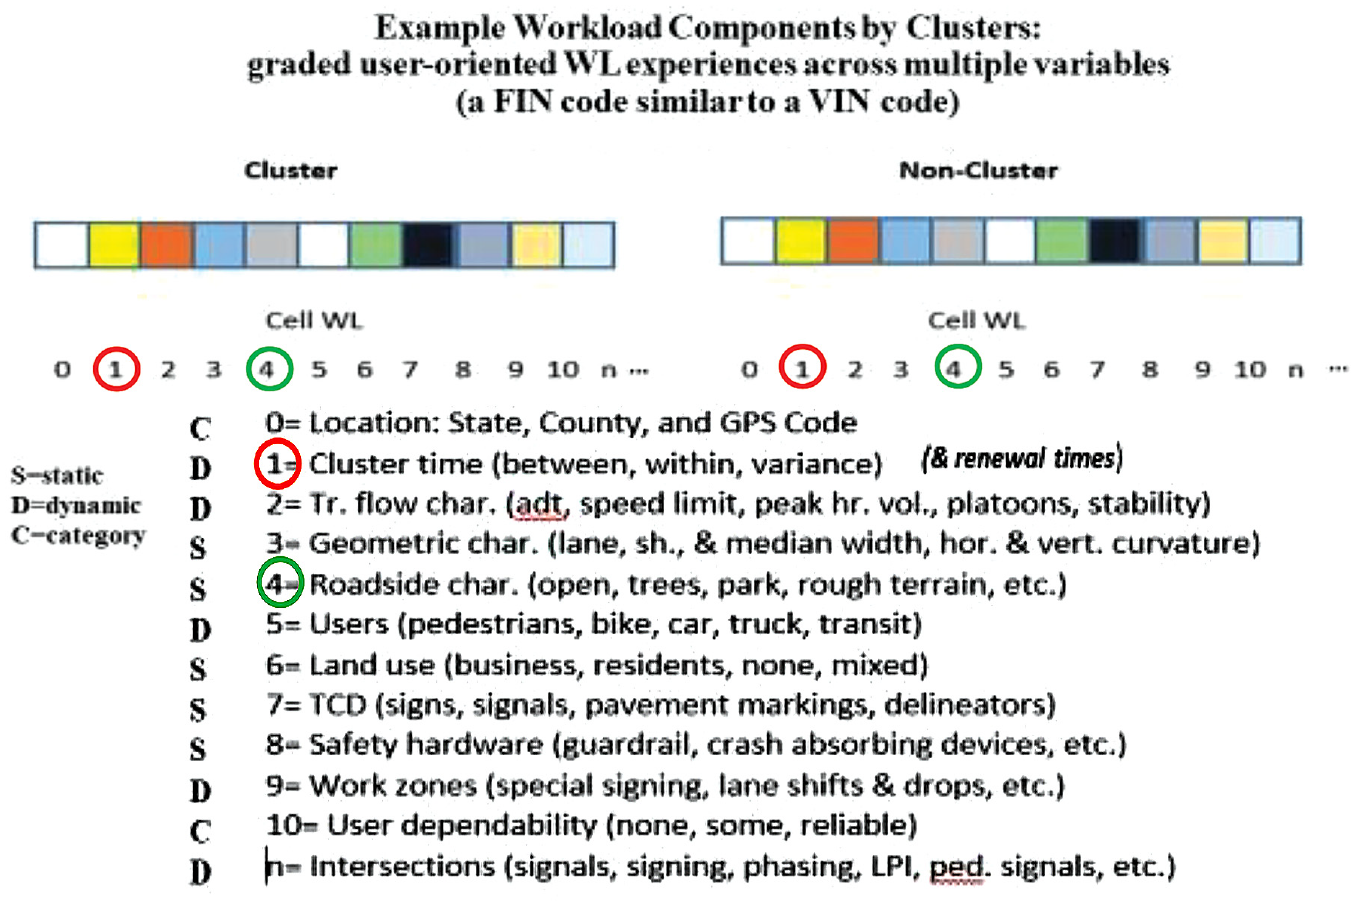
FIN example coding.
The FIN code for both highway clusters and non-clusters uses the same configuration, as illustrated in Figure 3. Each mode has SWL and DWL Also each cell is unique and can have multiple variables embedded in the cell code. For example, cell 1 (red circle) suggests there are three components for cluster time (average time between, average time within the cluster, and variance between). The code for cell 1 (red circle) will have three parts, one number for “between,” another number for “within,” and finally “variance between clusters”; thus a code (200 50 10) would be understood as 200 s (for the average travel time between the cluster and next non-cluster), 50 s (the average travel time within the cluster), and 10 s (the variance). Other cells would be unique relative to how many components they would have. For example, cell 4 (green circle) roadside has multiple choices roadside (open, trees, park, rough terrain). The code for cell 4 could be a single number representing the individual choice, code 1 for “open,” code 2 for “trees,” and so forth. The type of coding for the individual cells can be designed by the agency.
The FIN cells for the bicycle and pedestrian modes would likely be simpler because of the smaller set of dynamic operational data, but the metrics used would be like those shown in Table 1 as available.
Implementation Considerations
Implementation of the cluster and non-cluster WL approach described in this paper is new to many readers and some may think it is unnecessary, but our focus is on improving highway and user safety. The paper’s goal is to more closely integrate and quantify the role of the human user in the infrastructure design process. The implementation process not only permits but it encourages design and traffic engineers to create additional metrics they think will help quantify how all modal users (vehicles, pedestrians, and bicyclists) interact with the infrastructure. This seeks to improve the safety and performance of the road user modal infrastructure system.
The application of this WL methodology rests more on the experience of the engineer than on WL as defined by psychologists. Engineers trained in traffic stream flow, and other traffic engineering and highway design should know the terminology of the field and be able to identify metrics, when needed, that describe what is happening relative to SWL and DWL. No special HF training is required for smart, practicing highway engineers. SWL is more of an inventory of the frequency and type of metrics that would be relevant to understanding what the users must contend with. DWL is related to how the modal traffic interacts with the infrastructure with moving traffic. Psychologists are not typically trained in these areas. One area of future needed research is on developing a WL scoring scale but that will come much later as new research is completed. Also, metrics other than those included in this paper could be identified, researched, evaluated, and finally integrated into the quantified analysis process described in this paper.
The immediate objective is to recognize that traffic management and road safety, whether in new or upgrade designs, and road safety audits address modal users and how well they interact with the infrastructure, and vice versa, and how the system performance can be quantified/measured.
The February 2022 issue of the ITE Journal gives a good review of many issues facing the implementation of the Infrastructure Investment and Jobs Act (IIJA) ( 20 ). It emphasizes many components including congestion relief, work zones, vulnerable road users, safe routes to schools, complete streets, financial planning, travel demand and forecasting, environmental reviews, and so forth. While FCs are not explicitly addressed, much of the federally funded highway and transportation network is greatly affected ( 4 ). The focus of the IIJA bill is on delivering improved transportation service to a broad range of users ( 20 ). The EFC needs to reflect and can incorporate features that permit users of the national road network to benefit from the IIJA. This can be done by embedding WL and FIN into implementing delivery of the IIJA to the U.S. transportation network. This is not to say implementation of the WL and FIN approaches will be quick, but it can be done as other U.S. federal aid approaches have been initiated, namely, through demonstrations and over time. Not all roads in the U.S. network would require WL and FIN components but certainly those major roads and subnetworks of road should. The FIN with some WL metrics will improve how adjoining roads within a network of roads will directly affect the user needs in FC. Current FCs do not show the impact. At best the FC impact is now a subjective assessment of the expected impact. An understanding of user needs and safety is a key focus of the IIJA and it should be addressed.
The above WL and FIN discussion may suggest to some readers that only WL metrics are to be included in cells of the FIN. That is not the case because the cells can use various types of metrics. For example, some cells could be to reflect the kind of operational support users seek. FIN cells could represent whether the road is or is not associated with types of funding, connected intersection control, experimental projects, bicycle networks, pedestrian networks, truck routes, permanent counting stations, shared use operations, and so forth. State agencies would have the opportunity to set out how they want the FIN cells designed, metrics used, and how many FIN cells to use.
It is suggested that one or several demonstration projects be initiated to design and evaluate how a small network of roads within a common geographic area would develop and use WL and FIN in conjunction with the EFC process and how it aids the upgrading and/or modifying of roads or routes being considered for potential classification changes. After the demonstration is completed further expansion could be considered for the entire U.S. road network.
Implementation of this approach has the potential to improve overall user experience in traveling the U.S. network while more efficiently applying federal funds to where and how they will provide the highest user acceptance at the least expense.
The title of this paper is “Enhancing Highway Functional Classifications with Road User Demands,” but it could have been “Ultimate and Intermediate Enhanced U.S. Road Functional Classification.” As the paper developed it became fairly obvious to the author that considerable research, discussion, and planning is needed before the approach presented could be fully implemented. An alternative would be to proceed with a reduced, intermediate version of either or both of the WL analysis and the FIN proposals as discussed. The goal is to include recognition of users in the EFC, which is not discussed in NCHRP 855. Without the “users component” in the process the EFC is “business as usual,” which is a disservice to improvement in the U.S. highway network. WL directly recognizes “users” as part of the highway network.
Summary
The original 1921 purpose of FC of highways was to ensure that the national and state highway systems provided both mobility and accessibility for the public. The system created has worked reasonably well over the course of the last 100 years. But operational and safety problems are occurring and it is time to consider new ways to implement road classification systems.
The relative recent growth of the bicycle and pedestrian transportation modes has created the need to enhance the FC system to accurately represent the U.S. transportation network. The original classification of three road systems is thought to be inadequate and should be expanded to four classifications (principal arterials, minor arterials, collectors, and locals) to protect the goal of having balanced distribution of roads, modes, travel mobility, and easy accessibility for all users of the transportation network within the U.S. ( 4 ).
The objective of this paper is to show how the FC system can be expanded and enhanced by incorporating user WL and FIN. These inclusions are not intended to frustrate DOT managers and users but to aid them when adding or modifying roads within the network through the incorporation of more information about how road users expect the system of roads to operate for all modes. The paper is conceptual and a stepping stone that state agencies can use to transition from the current FC to a more robust EFC to reverse the increase in highway fatalities and better serve the transportation system.
Introduction of WL through the use of FIN permits agencies to consider directly the user impact of static and dynamic metrics on system operations with the combined use of all three modes, vehicles, pedestrians, and bicycles. At present the existing FC and also the proposed EFC system, as explained in NCHRP Report 855, only use subjective information when reviewing new or modified road classifications. Road users are the benefactors of the road network and user needs must be recognized by incorporation of human factor metrics with information on how existing roads function and how enhanced classifications will improved their travel and operations.
This proposed system would greatly enhance the present common use of only two FC metrics, ADT and speed. EFC decisions can then be based on user operations that are in keeping with user expectations, available funding, needs, and highway safety. Given that this proposed approach differs from the present FC system it is recommended that several DOT-designed demonstration projects be conducted before national implementation.
The suggested highway applications presented in this paper are certainly different from those presented in NCHRP 230 and 855 which do not focus on the importance of a robust recognition of the infrastructure-user’s needs. This paper describes a first step, a preliminary, simplified highway application of WL which is appropriate for use in the EFC system. The WL analysis in this paper was preceded by two other works. The first was an unpublished report for use by Rhode Island DOT and Federal Highway Information titled “Application of Data Driven Safety Analysis to Highway Safety - Part 1” by Tignor et al. (21). The second reportreference (12) is a published version of the Rhode Island report. These reports present a new opportunity for highway designers and traffic engineers to use WL which has not been available because previous WL research concepts have been previously limited and nether understood nor implemented. The good news is that two recent international.
Footnotes
Acknowledgements
Special thanks go to Warren Hughes, Ken Kobetsky, Hemanus Steyne, Jeff Shaw, Dr. Richard Pain, and Dr. John L. Campbell for their thoughts and comments.
Author Contributions
The author confirms sole responsibility for the following: study conception and design, data collection, analysis and interpretation of results, and manuscript preparation.
Declaration of Conflicting Interests
The author(s) declared no potential conflicts of interest with respect to the research, authorship, and/or publication of this article.
Funding
The author(s) received no financial support for the research, authorship, and/or publication of this article.