






Abstract
The objective of the present study is twofold: firstly, to evaluate the influence of asphalt emulsion properties on the fluidity characteristics of cement asphalt mortar (CAM) for high-speed railway (HSR) track systems; and secondly, to propose a testing protocol that effectively differentiates the asphalt emulsions suitable for CAM with respect to fluidity requirement, considering specific requirements for the application. The study involved assessing CAM fluidity under various emulsion formulation variables, including the pH, residual asphalt content, and emulsifier dosage. In addition, three different test methods were evaluated for their suitability as the protocol for asphalt emulsions evaluation for CAM production in HSR applications. The results showed that the pH of the asphalt emulsion significantly affects the fluidity of the CAM, with cationic emulsions demonstrating less stability because of high alkaline conditions of CAM, while anionic/non-ionic emulsions exhibited stable fluidity. Fluidity in CAM is observed when an asphalt emulsion possesses an optimal micelle concentration, which effectively resists coagulation. The findings emphasize the importance of considering both upper and lower limits for residual asphalt content in emulsion specifications for CAM production. Emulsifier dosage also played a role, with high emulsifier dosages leading to high fluidity in CAM. The study introduced a fluidity ratio test as a suitable method for selecting asphalt emulsions for CAM production for HSR track systems.
Cement asphalt (CA) composites, known for their combination of strength from cement and flexibility from asphalt, are versatile for construction applications. In the context of high-speed railway (HSR) infrastructure, a specific CA composite named cement asphalt mortar (CAM) has gained prominence because of its role as a damping layer that efficiently absorbs the noise–vibration–harshness (NVH) component generated by high-speed wheel loading ( 1 ). Originating from the pioneering efforts of the Japanese railways and subsequently adopted in China, CAM technology has demonstrated superior track geometry stability, reduced structural height, low maintenance requirements, and enhanced damping properties compared to conventional ballasted tracks ( 1 – 3 ).
CAM is described as a multi-phase multi-component material consisting of cement (C), asphalt emulsion (AE), water (W), sand (S), and chemical admixtures, and it is categorized into two types: CAM I and CAM II, based on the A/C ratio, that is, the mass of asphalt divided by the mass of cement ( 4 ) where A is the emulsified asphalt solid residue. CAM I (asphalt, A/C: 0.6–1.2) refers to a material with a low elastic modulus, as used in the Shinkansen slab track in Japan. On the other hand, CAM II (A/C: 0.2–0.6) represents mortar with a high elastic modulus, utilized in the BÖgl slab track system in Germany. In situ, the mortar is poured between the track slab and track bed through an inlet valve ( 1 ). For the purpose of this study, CAM I is the main focus, which will be referred to as CAM here.
To ensure successful application, technical requirements as per Japanese specifications and the China Railway Track System (CRTS I, 2008) mandate that the fluidity measured as flow time for pouring application should fall within the range of 16–26 s, with a minimum fluidity time (workable time) of 30 min ( 5 ). Fluidity, in this context, refers to the ability of the mortar to spread to the corners of the slab without external vibration or compaction. The time duration during which the flow time of CAM maintained in the range of 16–26 s is defined as the working time, and a longer working time allows for extended on-site application, and for successful CAM application. A working time exceeding 30 min is specified ( 5 ). This parameter adds complexity to material design and proportioning, with the primary challenge being the compatibility between cement and AE ( 6 ).
When cement and AE are mixed, various scenarios can lead to the demulsification of AE. These scenarios include rapid hydration of cement resulting in water loss and reduced interparticle distance between droplets, ion concentration from cement hydration causing precipitation of anionic emulsifiers over asphalt droplets, and the highly alkaline medium generated by Ca(OH)2 from cement hydration destabilizing the cationic emulsifier system ( 7 – 9 ). These scenarios ultimately lead to the loss of workability and constructability of CAM. Thus, the production of CAM presents a unique challenge concerning emulsion selection, requiring careful attention to ensure optimal performance. Unlike traditional road construction applications that utilize AE with limited active filler dosage in cold mix technology ( 6 , 10 ), CAM demands a carefully tailored emulsion formulation because of its higher active filler content. For CAM production, it is currently recommended to use a slow-setting AE ( 5 ).
The existing protocols for slow-setting AE selection, established by the American Association of State Highway and Transportation Officials (AASHTO), European Standard (EN), and Indian Standards (IS) ( 11 – 13 ), primarily address coagulation concerns related to active filler dosage and pre-water addition in road applications. However, the production of CAM requires a distinct approach because of its composition with high active filler content and specific functional requirements for use in HSR track systems. Therefore, understanding the interaction of the AE with the active filler and the subsequent breaking mechanism becomes crucial to ensure successful CAM production.
The International Union of Pure and Applied Chemistry (IUPAC) defines the breaking of emulsions as the sum of all the events leading to the transformation of droplets into a final film ( 14 ). Coalescence is then defined as a step in the breaking process of an emulsion where individual droplets merge to form larger drops. For AEs to break on interaction with a mineral, they should lose their stability, resulting in droplet coalescence. However, the stability of AE is not well defined. It is either the resistance of asphalt droplets against sedimentation or its breaking behavior. Current specifications for the selection of slow-setting AE define an emulsion as “stable” considering the sedimentation aspect. The physical meaning of the storage stability test relates to the particle size of the asphalt droplet and its settling velocity, governed by Stoke’s law ( 15 ).
From a physicochemical point of view, emulsion stability is obtained when the repulsive forces overcome the attractive forces. The repulsion forces are generated because of the polar head group on the emulsifier ( 16 ). Contrary to this, asphalt droplets tend to coalesce when the attractive forces overcome the repulsion forces. This means that the polar head group on the droplet is neutralized because of the interaction with a mineral ( 17 ). Figures 1 and 2 illustrate the structure of the AE system and the selective adsorption mechanism between cement and AE, respectively. As seen in Figure 1, when an emulsifier is added to water, they form an aggregate structure with its tail group in the core and head group exposed to water. These aggregates of molecules are called micelles and act as a reserve charge system for the AE. The concentration of micelles formed depends on the critical micelle concentration (CMC), which can be defined as the minimum concentration of emulsifier molecules in a solution at which micelles start to form. The higher the concentration of emulsifier above the CMC, the higher the micelle formation and, thus, the higher the physicochemical stability of the emulsion. In this landscape, the breaking of emulsion is a consequence of droplet charge neutralization. In the case of AE interaction with active fillers like cement, the charge neutralization occurs because of the adsorption of asphalt droplets onto the cement grains. Over-stabilized emulsions with a higher concentration of micelles, acting as reserve charges, resist droplet charge depletion for a longer duration. It is seen that the hydrating cement phase produces negatively charged silicate hydrates (C-S-H) and positively charged aluminate hydrates (aFt). Owing to the mutual attraction between the ionic asphalt droplets and the cement hydrates, there is selective adsorption of cationic emulsion over the silicate hydrate phase and anionic emulsion over the aluminate hydrate phases ( 18 ). This interaction is illustrated in Figure 2. Therefore, attempting to control the breaking of emulsion amounts to understanding the rate of adsorption and the rate at which charges on the droplet deplete.
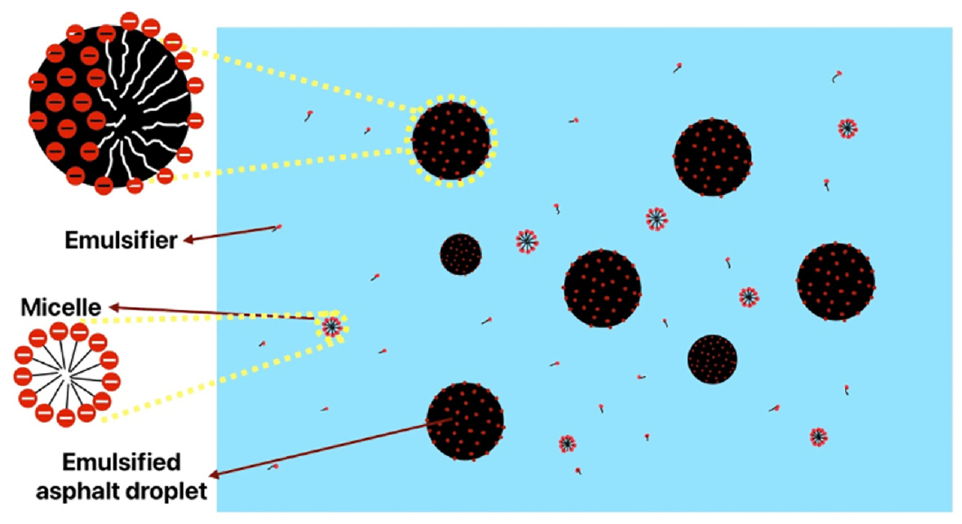
Illustration of the structure of anionic asphalt emulsion.
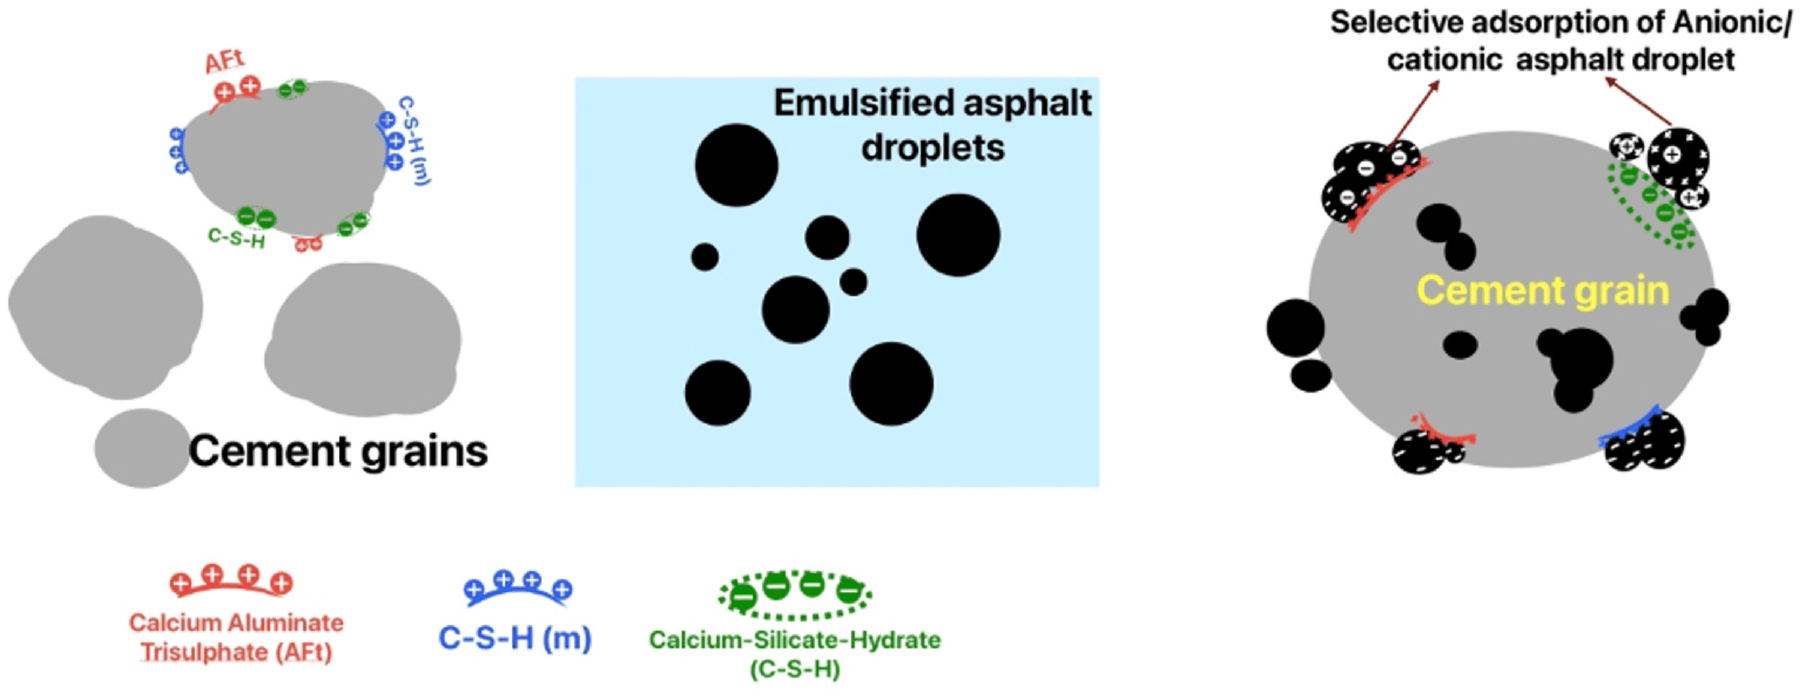
Adsorption mechanism of asphalt droplets over cement.
Li ( 19 ) categorized the adsorption process of asphalt droplets on cement by evaluating the adsorption rate as the amount of asphalt adsorbed over a cement grain divided by the total asphalt content in the paste phase. Based on the observation, the adsorption rate was categorized into four stages: dissolution adsorption, competitive adsorption, accelerating adsorption, and saturation adsorption. In stage I, the initiation of asphalt droplet adsorption over the cement grain is observed, followed by stage II, which results in reduced adsorption of asphalt droplets because of the competitive adsorption of reserve emulsifiers. In stage III, the adsorption of asphalt droplets onto cement accelerates as a result of the complete consumption of reserve emulsifiers and, finally, in stage IV, the adsorption reaches saturation. Another mechanism involved in the breaking of slow-setting AE is the depletion of water in the emulsion through evaporation, as observed in cold asphalt mixes. This leads to a reduction in interparticle distance, causing attractive forces to overcome repulsive forces.
The current standard test methods for AEs formulated for cold mix road applications focus on physicochemical stability through the stability to mixing with cement test. This test measures an emulsion’s ability to mix with portland cement without breaking. However, existing protocols, such as AASHTO T59, EN 12848, or IS 8887, are designed to quantify coagulation by residue on a sieve for diluted AEs in a high-water dilution medium. To accurately assess the suitability of AEs for CAM production, which involves higher cement and finer sand content and has longer working time requirements, more relevant test protocols are needed than the current methods. An alternative protocol that can account for emulsion stability under the effect of cement after mixing is the breaking value test by the mineral filler method, as specified in EN 13075-1:2016. This test method quantifies the “breaking value” as a dimensionless number representing the amount of reference filler in grams required to coagulate 100 g of AE. It considers a longer interaction period, but one drawback is that the coagulation point is subjectively determined. The test can effectively differentiate among rapid-setting, medium-setting, and slow-setting emulsions. However, it may not be able to differentiate between two slow-setting emulsions because of its subjective nature. Ouyang et al. ( 20 ) conducted a study on demulsification by examining the viscosity of CA paste using a parallel plate rheometer. They suggested that the viscosity of CA paste can be a dependable indicator of coagulation. However, using a rheometer to measure viscosity as the standard testing protocol may pose certain challenges for end users with respect to feasibility and practicality.
Motivation and Objective
The flow time of CAM is crucial, as it determines the ability of mortar to pour, spread, and adequately fill in a narrow gap of 50 mm between the concrete road bead and track slab. Several factors, such as emulsifier dosage in relation to CMC, selective adsorption of asphalt droplets over cement grains, constituent proportions, sand grading, and surrounding temperature, influence the flow time of CAM. Understanding and controlling these parameters are essential to ensure the proper application of CAM. The production of suitable AE considering all these influencing factors poses significant challenges for formulators. Among these factors, achieving compatibility between cement and AE emerges as the most critical aspect, requiring a comprehensive understanding and effective control of the kinetics involved in the breaking of AE. Moreover, the absence of a relevant testing protocol for AE selection concerning the flow time requirements of CAM further complicates the process, making it challenging to accurately quantify compatibility.
The primary objective of this research study is to evaluate the influence of various properties of AE on the flow time properties of CAM. In doing so, the study aims to propose a standardized testing protocol that can be adopted by practitioners for selection of the type of emulsion, optimal asphalt concentration in the emulsion, and appropriate emulsifier dosage to achieve specific requirements for HSR applications. This is achieved by systematically evaluating the sensitivity of various parameters of asphalt emulsion, such as the emulsion type, emulsifier dosage, residual asphalt content, and so forth, to the flow time properties of CAM; this study aims to enhance the formulation process.
Materials and Methodology
Materials
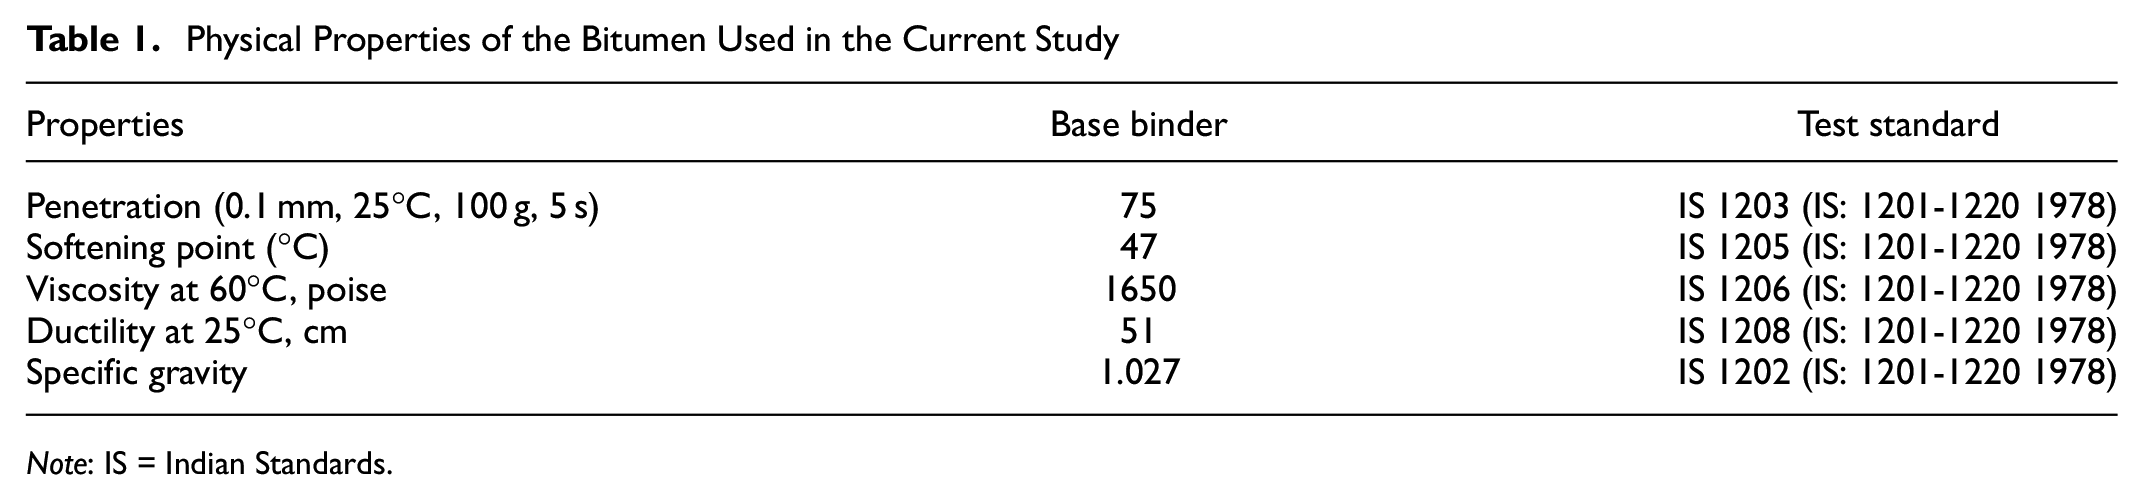
In conventional AE applications, such as cold mix and spray applications, cationic slow-setting emulsions are commonly employed because of their versatility with different aggregates. However, for CAM applications that demand low flow time and longer working time, the selection of an appropriate emulsion type and formulation becomes critical. In this study, multiple AE formulations were adopted with a base binder whose physical properties and corresponding test protocol are presented in Table 1. AEs of cationic and anionic types were produced to assess how different formulation parameters affect the fluidity and fluidity time properties of CAM.
Physical Properties of the Bitumen Used in the Current Study
Note: IS = Indian Standards.
The CAM production process involved blending graded sand with specific inorganic and organic binders, namely ordinary portland cement (OPC) satisfying a minimum strength requirement of 53 MPa, along with slow-setting grade AE. Natural river sand, which was oven-dried at 105°C for 24 h, was utilized in the study. It possessed a fineness modulus (FM) of 1.6 and a specific gravity of 2.663. The nature of the sand is evaluated through X-ray diffraction (XRD). Qualitative analysis was performed to identify the crystalline phases. Each diffraction peak position and intensity are like the fingerprint of a particular crystalline phase. On comparing with the reference mineral database, the sharp crystalline peaks observed as seen in Figure 3 were assigned. The distinct peaks observed at diffraction angles of 26.6° and 50° are attributed to the quartz phase (SiO2), while the peak at 21° corresponds to microcline (SiO3O8). To evaluate the nature of river sand (acidic or basic), phase quantification was carried out by X-ray fluorescence (XRF) and the results are listed in Table 2. A SiO2 content of above 63% categorizes the mineral as acidic ( 21 ). Analysis of the XRD and XRF data indicates that quartz is the predominant phase present in the sand used in the study.
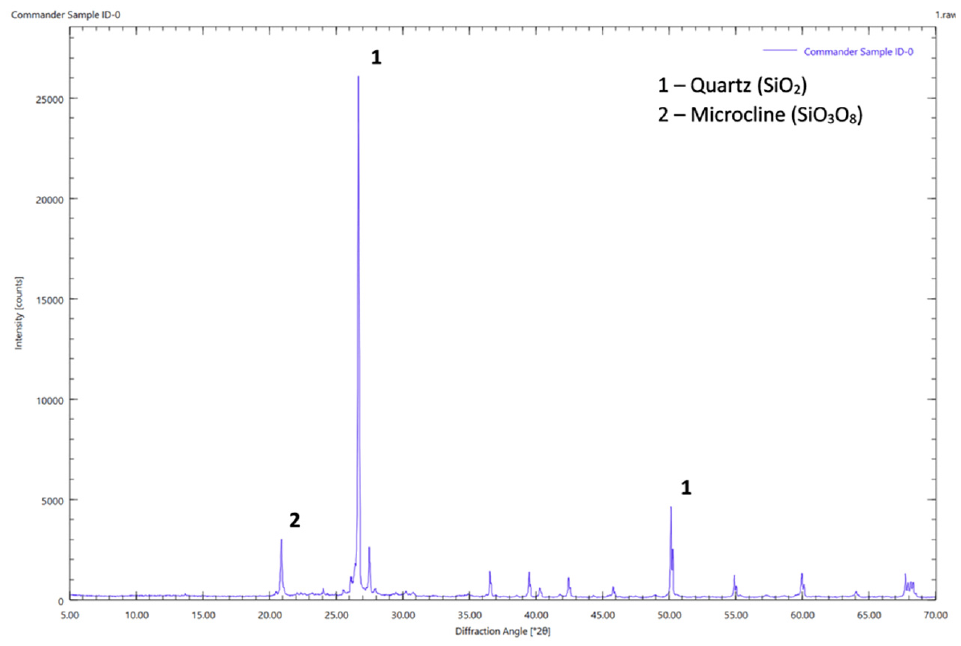
X-ray diffraction (XRD) pattern of river sand used in the present study.
Chemical Composition of River Sand (wt %) Obtained from X-Ray Fluorescence Analysis

The cementitious component involved OPC and a shrinkage-reducing agent (SRA) in the ratio of 0.9:0.1. OPC having a strength grade of no less than 53 MPa was used and its properties are provided in Table 3.
Properties of Ordinary Portland Cement (OPC) Used in the Present Study
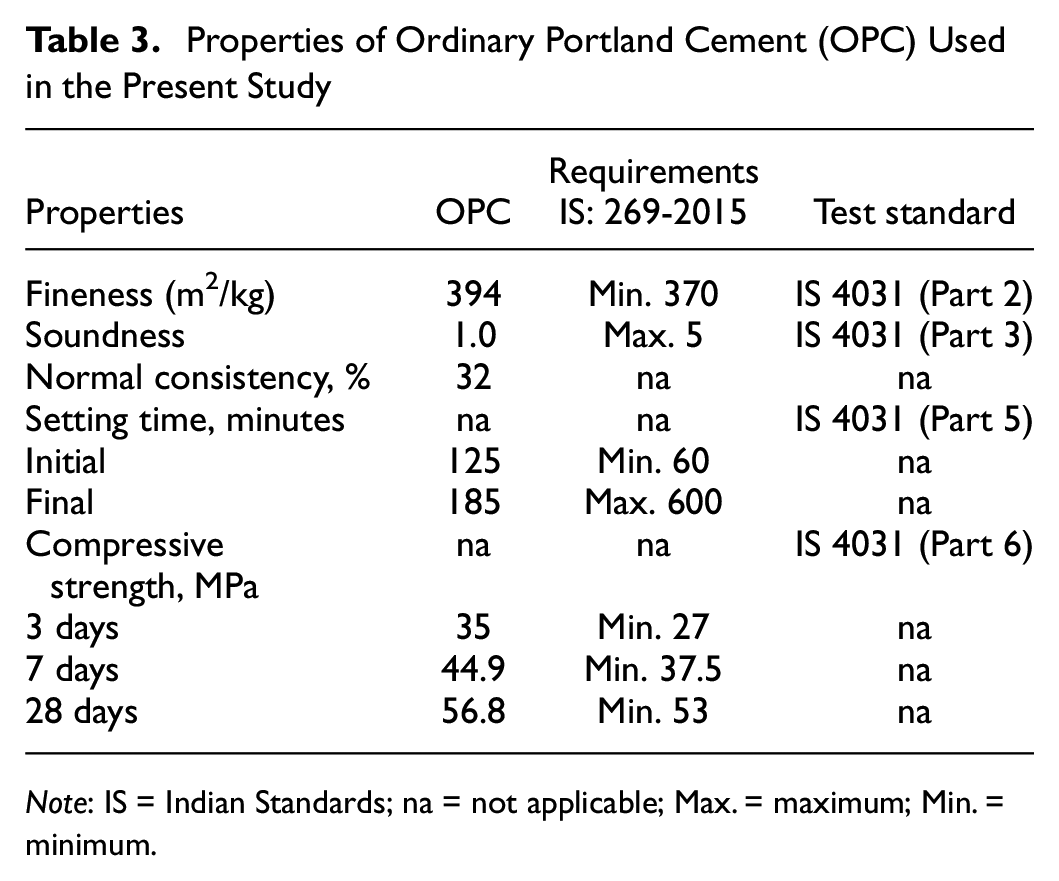
Note: IS = Indian Standards; na = not applicable; Max. = maximum; Min. = minimum.
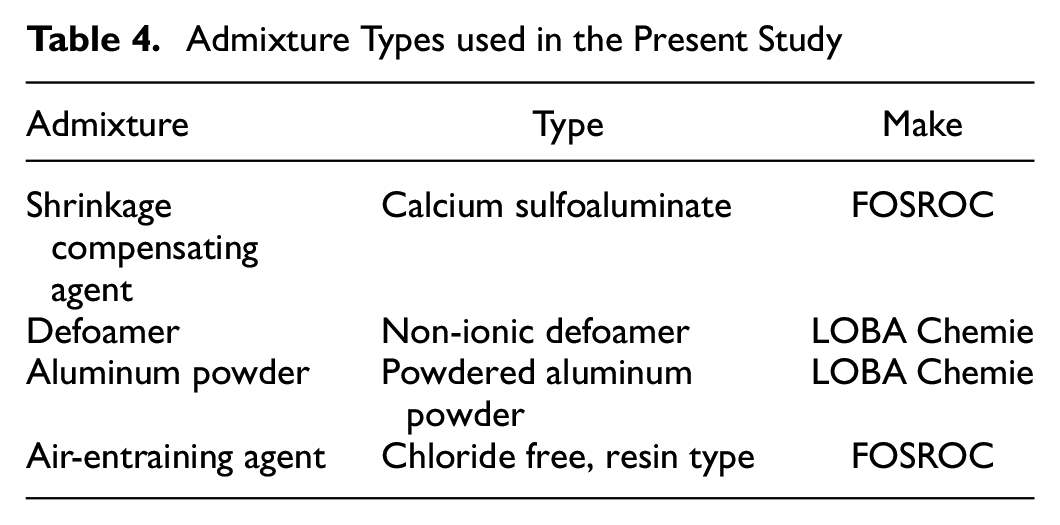
Admixtures were introduced into the CAM to address various factors, including strength development, emulsion foaming, air entrainment, and expansion requirements. When cement-based products undergo hydration, they experience volume changes caused by water loss from drying and because the hydration products occupy less volume than the reactants. SRAs were added to the CAM to mitigate this shrinkage. In addition, ensuring expansion in the CAM was crucial for bonding with the track slab, achieved by carefully incorporating precise amounts of aluminum powder.
The mixing process involved homogenizing AE with water, polymer dispersion, and defoamer. Defoamers were employed to suppress the foam generated by surfactants present in both the AE and polymer dispersion, as excessive foam could adversely affect the air content and flow time. Air entrainment was vital for the CAM to withstand freeze–thaw cycles, a task achieved through careful control of the mixing speed and duration, along with the addition of air-entraining agents. For a comprehensive list of admixtures used in this study, please refer to Table 4 ( 5 ).
Admixture Types used in the Present Study
Methodology
This study aims to evaluate various AE formulations and their influence on fresh CAM properties, specifically flow time and working time. To achieve this, the impact of different AE combinations on CAM flow time and working time is assessed. Ten variations of AE are produced to investigate the influence of factors such as emulsion type, pH, residue asphalt content, and emulsifier dosage on the properties of CAM. Subsequently, the CAM is designed, proportioned, produced, and tested using these emulsions to further evaluate its flow time and working time. Finally, the coagulation properties of the AE are analyzed by employing the current coagulation test protocol as per IS 8887:2018, a modified coagulation value (MCV) test, and the proposed fluidity ratio method to determine the suitability of the emulsion for CAM applications.
Asphalt Emulsion Formulation
For the production of AEs, a DenimoTech colloid mill (Figure 4) was utilized. The process involved preparing the soap phase with the appropriate emulsifier dosage according to the experimental program. The desired pH was adjusted using hydrochloric acid (HCl) or sodium hydroxide (NaOH). The asphalt was preheated and conditioned at 152°C (temperature corresponding to 200 cP viscosity) and the soap phase was maintained at 40°C. Both the asphalt and soap phases were introduced into their respective hoppers and brought to the above-mentioned production temperatures. Flow rates for both phases were set based on their concentrations, and once the specified temperature and flow rates were achieved, the mill was set at 9000 rpm and the inlet valves of both phases were opened simultaneously to produce the emulsion, which was then collected from the discharge valve.
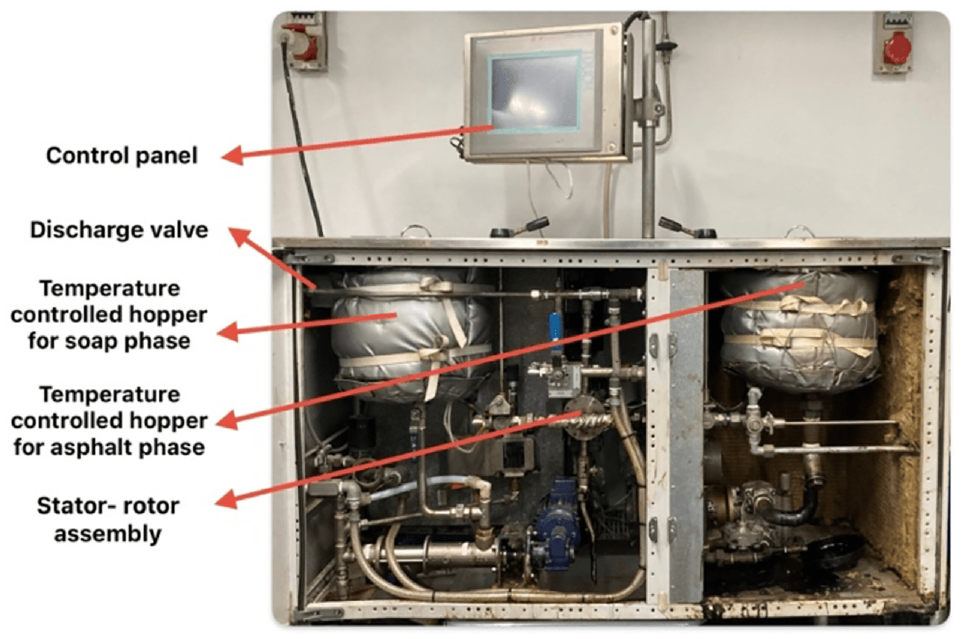
DenimoTech research plant used in the present study for asphalt emulsion production.
AEs C1 (cationic emulsion), A1, and A2 (anionic/non-ionic) of varying pH values were produced to evaluate the influence of emulsion type and pH on CAM flow time. The pH in the emulsions is a result of the acid or base added to activate the emulsifier. The cationic emulsifier employed in our study did not necessitate the addition of acid to activate the emulsifier, allowing us to prepare a soap phase with just water and emulsifier, resulting in a pH level of 6–7. Further, the preliminary investigations indicated that cationic emulsions within the pH range of 2–4 experienced premature breaking, leading to poor fluidity. Emulsions A2, A3, and A4 were produced with varying residual asphalt content to assess the impact of residue asphalt content. Further observations on different emulsions (A5–A9) were conducted by maintaining the residue asphalt content, pH, and emulsifier type constant while varying the emulsifier dosage to evaluate the coagulation and fluidity ratio properties of the CA paste and, subsequently, the flow time of the CAM. Table 5 summarizes the composition details of the emulsions. The optimum dosage (OD) of emulsifier indicates the formulation of an emulsion that effectively balances the breaking characteristics of emulsion and the flow time of CAM. It is to be noted that the OD is subject to change with the emulsifier type. Cationic emulsifiers have a different OD, while anionic/non-ionic emulsifiers also have different ODs. To assess the influence of emulsifier dosage on CAM fluidity, AE formulations were conducted at both increased dosages relative to the OD (indicated as OD+X) and reduced dosages compared to the OD (indicated as OD-X, OD-XA, OD-XB, and OD-XC). These symbols signify higher or lower dosages concerning the optimum emulsifier dosage for the particular emulsion.
Asphalt Emulsion Formulations Produced for the Study
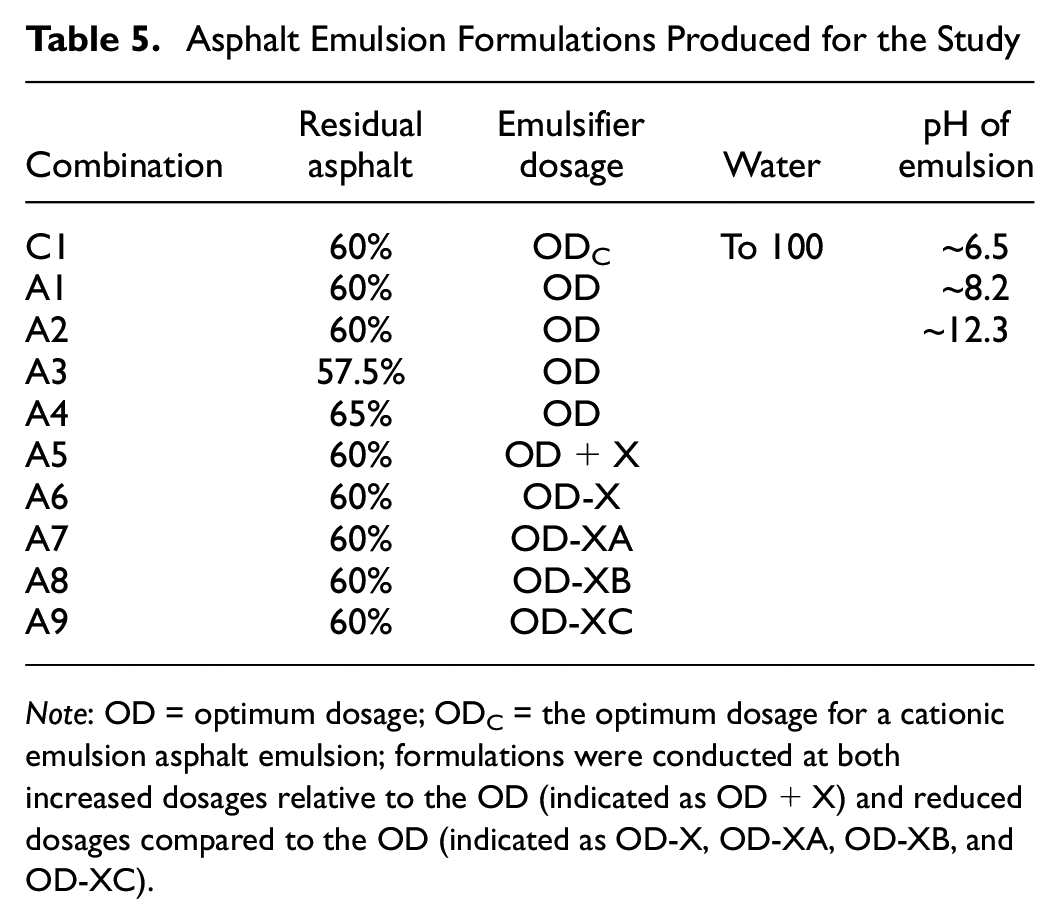
Note: OD = optimum dosage; ODC = the optimum dosage for a cationic emulsion asphalt emulsion; formulations were conducted at both increased dosages relative to the OD (indicated as OD+X) and reduced dosages compared to the OD (indicated as OD-X, OD-XA, OD-XB, and OD-XC).
CAM Design and Production
In slab track applications, ensuring optimal performance relies heavily on producing the right CAM. This requires meeting specific criteria, which include maintaining a flow time of 16–26 s for at least 30 min, an air content of 8%–12%, no bleeding, a controlled expansion of 1%–3% at 24 h, and achieving a minimum 28-day material strength of 1.8 MPa ( 5 ). To meet these critical requirements, a comprehensive evaluation was conducted on a broad range of constituent ratios. The investigation encompassed A/C ratios falling within 0.7–0.85, W/C ratios ranging from 0.7 to 0.85, and S/C ratios between 1.5 and 2.25. The ultimate goal was to identify the most suitable proportions that not only satisfy the CAM strength requirements but also the specific fluidity requirements for HSR applications. The selected materials and their proportions were tested for strength and damping characteristics of the resulting CAM. However, for the scope of this study, the presented work is limited to evaluating the flow time characteristics of the CAM.
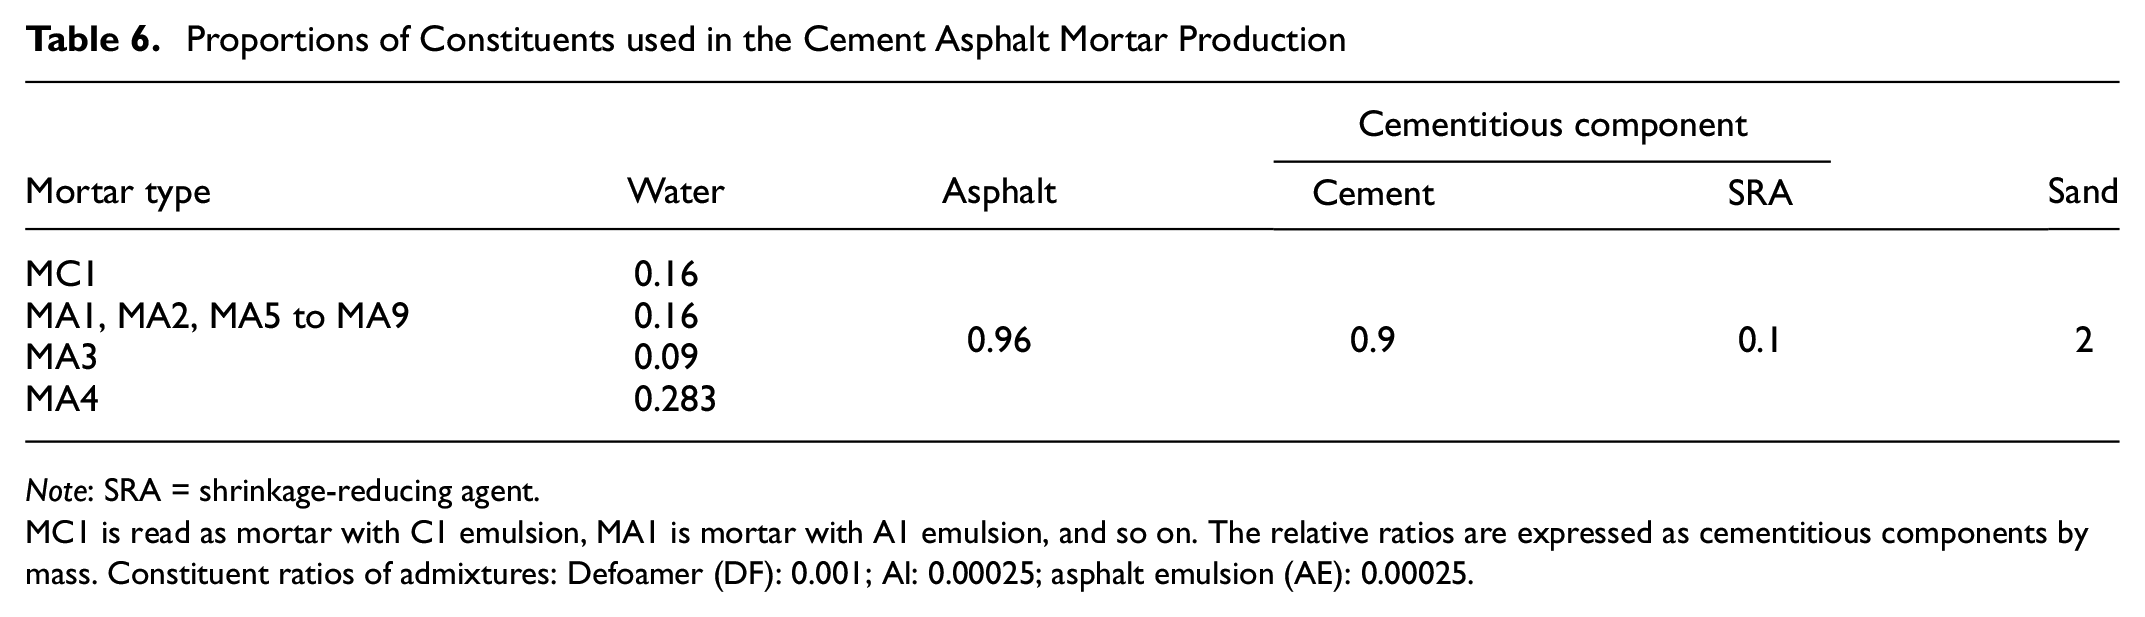
The study was conducted at two measurement scales: the mortar scale and the paste scale. Mortar refers to a mixture of fine aggregate with a binder (CAM), which includes AE and cement. On the other hand, paste specifically denotes the binder component, comprising AE and cement without the inclusion of fine aggregate. Table 6 presents the proportions of the constituents and associated combinations used to produce different CAM mixes (MC1, MA1 through MA9), with the dosages of defoamer, expansive, and air-entraining agents as mentioned in the footnote of Table 6. The mixing process took place within controlled room temperatures, maintained between 30°C and 32°C. Initially, liquid constituents such as AE, defoamer, and water were added into the planetary mixer, followed by a mixing duration of 60 s at 60 rpm. Then, the dry constituents, comprising the cementitious component, aluminum powder, and sand, were introduced and mixed for 180 s at 120 rpm. Finally, the air-entraining agent was incorporated into the mixture, with the mixer operating at 60 rpm for a mixing period of 30 s. Subsequent evaluations were conducted on AEs A2, A5, A6, A7, A8, and A9 to assess the flow time properties of CAM under different emulsifier dosages (refer to Table 5 for details). The evaluation process included adopting a cement mixing test protocol on CA paste known as the stability to mixing with cement test, which quantifies the coagulation value (CV), as specified in Annex G of IS 8887:2018. In addition, a MCV test and a fluidity ratio test were performed.
Proportions of Constituents used in the Cement Asphalt Mortar Production
Note: SRA = shrinkage-reducing agent.
MC1 is read as mortar with C1 emulsion, MA1 is mortar with A1 emulsion, and so on. The relative ratios are expressed as cementitious components by mass. Constituent ratios of admixtures: Defoamer (DF): 0.001; Al: 0.00025; asphalt emulsion (AE): 0.00025.
Tests for Asphalt Emulsion Suitability
For the CA paste investigations, a consistent AE-to-cement ratio of 1.6:1 was used for the stability to mixing with cement test, MCV test, and fluidity ratio test, and a specific nomenclature was employed to identify the CA paste combinations (e.g., “PA2” for CA paste with AE A2). However, the stability to mixing with cement test was carried out as per the methodology mentioned in IS 8887:2018. The following sections outline the methodology adopted for these tests.
Stability to Mixing with Cement/Coagulation Value Test (IS 8887:2018)
In this experiment, a diluted AE sample is prepared by mixing it with water to achieve an asphalt content of 50%. The mixture consists of 100 g of diluted AE and 50 g of cement that has already been sieved using a 150 μm sieve. The mixture is stirred using a rounded 12 mm glass rod at 60 rotations per minute. After 1 min, 150 mL of distilled water is added to the mixture and it is mixed for 3 min. Finally, the resulting mixture is passed through a 1.4 mm sieve to wash it. The weight of the oven-dried sieve with the pan is recorded. According to IS 8887 specifications, the retained material on the sieve should not exceed 2% of the asphalt content in the emulsion. The adopted test protocol is as per IS 8887:2018 (Annex G) with the only exception being the stirring apparatus used. This test assesses the emulsion’s capacity to blend with finely divided, high surface area substances without undergoing significant coagulation.
Modified Coagulation Value Test
The testing protocol was carried out at a controlled room temperature of approximately 25°C to conduct the CV test on the AE. The MCV test is an extension of the existing stability to mixing with cement test. This specific method does not align with any existing code or standard. It was designed as an experimental approach to investigate whether sieving the CA paste over a smaller sieve for a longer duration led to notable coagulation effects. Initially, a 600 μm sieve was washed using xylene and acetone to eliminate any residue. After washing, the sieve was placed in a dish and dried in an oven at 105 ± 5°C for 1 h. The dish, along with the sieve, was then cooled and weighed accurately to the nearest 0.01 g (W1). Meanwhile, the AE was prepared according to the specified proportions mentioned in Table 5. OPC of 53 S grade, which is passed through a 150 μm sieve, was chosen for this experiment. The formulated emulsion is diluted so that both the water and asphalt phases are in the ratio of 50:50. For instance, if 200 g of AE with a solid residue of 60% was taken, it accounted for 120 g of asphalt and 80 g of the water phase. An additional 40 g of distilled water was added to maintain equal ratios. The added water is mixed well, and 160 g of the resultant diluted emulsion is taken for the test. Next, 100 g of cement was gradually added to the mixture under continuous agitation over the next 30 s, followed by agitation for 90 s using a mechanical mixer set at 120 rpm. The time was recorded at the moment cement is introduced into the diluted emulsion. Subsequently, the resulting CA paste was passed through the pre-weighed 600 μm sieve. The sieve was thoroughly washed with distilled water until the water ran clear. It was then placed in a small dish and dried in an oven at 105 ± 5°C for 2 h. Finally, after cooling, the dish and sieve were reweighed together to the nearest 0.01 g (W2). Careful handling was maintained throughout the procedure to prevent any loss of material. The difference in weight (W1 and W2) divided by the solid asphalt content in the diluted emulsion is referred to as the CV, expressed as a percentage. The same sample sourcing and CA paste preparation procedure is repeated to determine the CV at time intervals of 15, 30, and 60 min.
Fluidity Ratio Test
For the fluidity ratio test, a Ford viscosity cup (No. 4) with an orifice diameter of 4.12 mm, as specified in ASTM D 1200-10, is utilized (see Figure 5a). The AE is diluted so that the water and asphalt phases are in the ratio of 50:50. The orifice is sealed with a stopper, and the diluted emulsion is poured into the leveled instrument, allowing it to overflow before removing the excess. Simultaneously, the stopwatch is started on removing the stopper, and the time taken for the sample to flow through the orifice is recorded. Subsequently, CA paste is prepared following the procedure and proportions outlined in the MCV test protocol. The materials are stored and the test carried out at a controlled room temperature of 25°C. The resulting paste is used to fill the cup, and the efflux time is measured. The ratio of the flow time of the CA paste to the flow time of the diluted emulsion is referred to as the fluidity ratio. On careful consideration of the outcomes presented in the subsequent section, the fluidity ratio test is our proposal as a suggested method for evaluating the appropriateness of AE in CAM production as opposed to utilizing the stability to mixing with cement test.
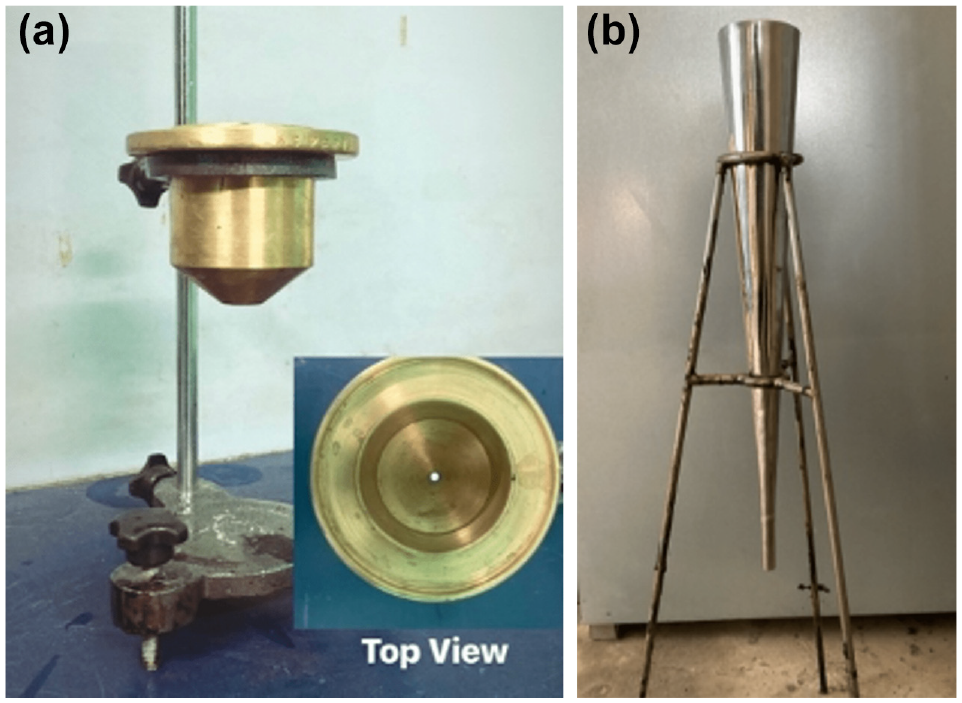
(a) Ford viscosity cup (No.4) used in the present study and (b) Brass J funnel for flow time measurement.
Flow Time (or Fluidity)
To assess the fluidity property of CAM, the flow time was measured. Flow time represents the duration required for CAM to pass through a designated Brass J funnel, which adheres to the CRTS specifications of having a volume of 640 mL and an orifice diameter of 10 mm ( 5 ). A shorter flow time indicates higher fluidity in the mortar. The evaluation of the CAM’s flow time was conducted at 5-min intervals throughout a 30-min study period. The time range during which the flow time of the CAM remained within 16–26 s is defined as the fluidity time or working time. Figure 5b shows the Brass J funnel setup used in the present study.
A comprehensive summary of the experimental procedures employed in this study is provided in Figure 6. The test matrix indicating the type of sample considered for a test is given in Table 7.
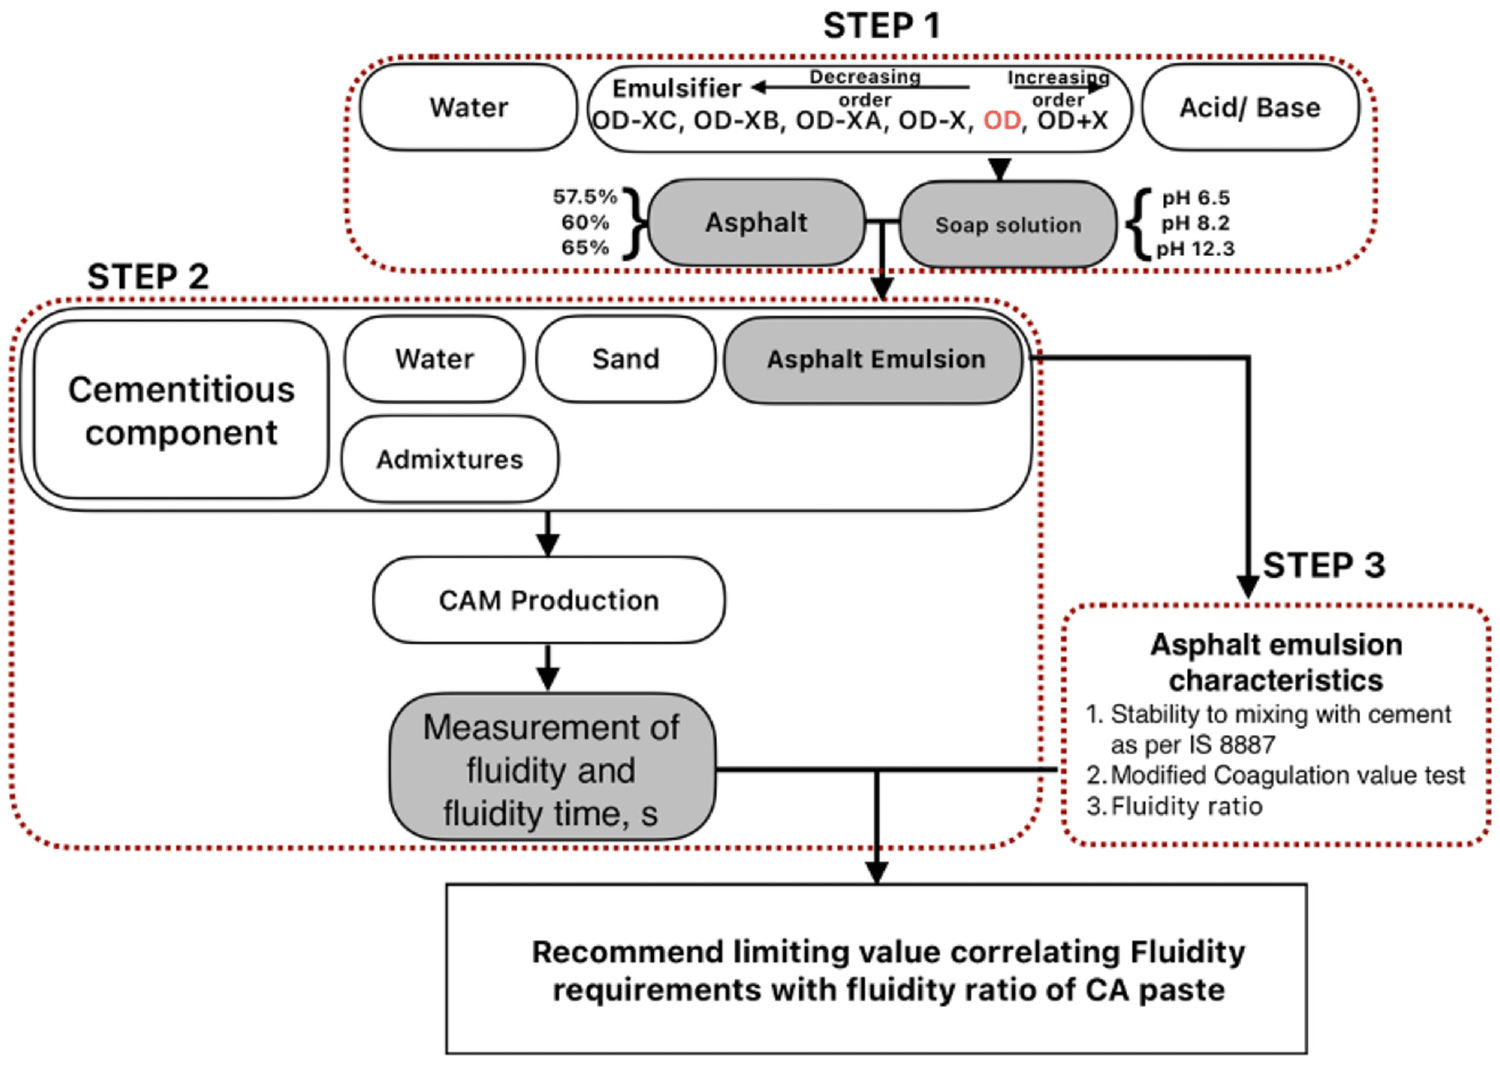
Flow chart of the experimental program.
Test Matrix for the Experimental Program
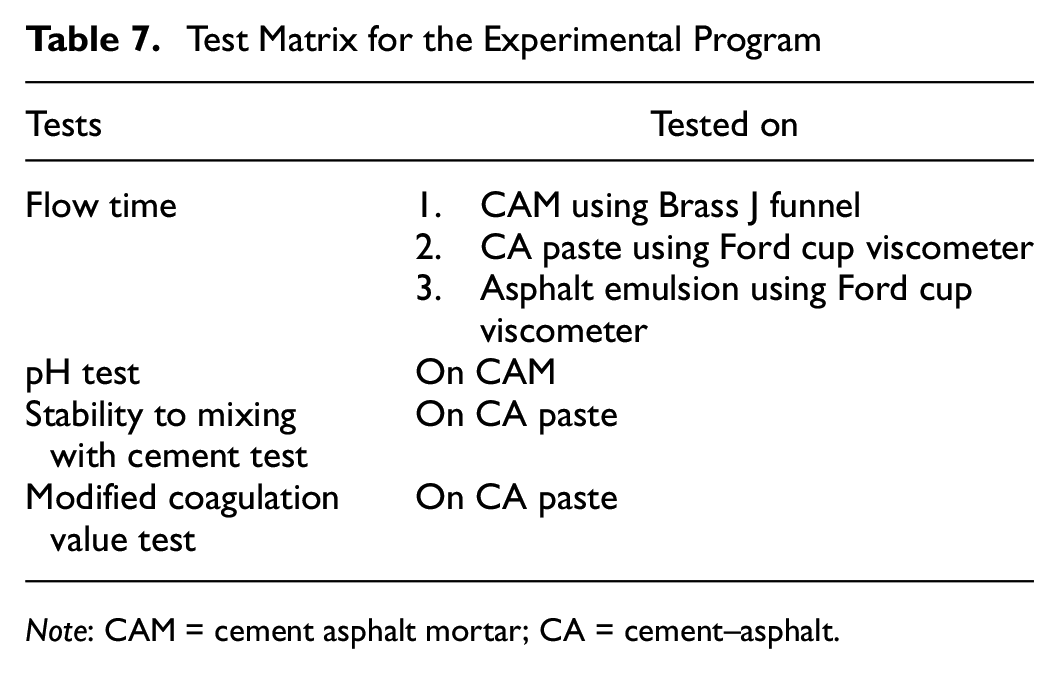
Note: CAM = cement asphalt mortar; CA = cement–asphalt.
Results
Influence of pH/Type of Asphalt Emulsion on the Fluidity of CAM
Figure 7 illustrates the impact of the AE pH on the fluidity behavior of CAM. The y-axis represents the flow time (in seconds) and the x-axis represents time (in minutes) since mixing the AE with the cement and other constituents. Among the mortar combinations, mortar MC1 containing cationic emulsion is highly unstable with respect to flow time. It exhibits a longer flow time (lower fluidity), ranging from 31 s at 5 min to 63 s at 15 min. This instability is attributed to the high alkaline environment resulting from the reaction of silicates during cement hydration, which leads to the production of calcium-silicate-hydrate (C-S-H) and calcium hydroxide (Ca(OH)2). The resulting Ca(OH)2 causes highly alkaline environment and has a pH value close to 13.
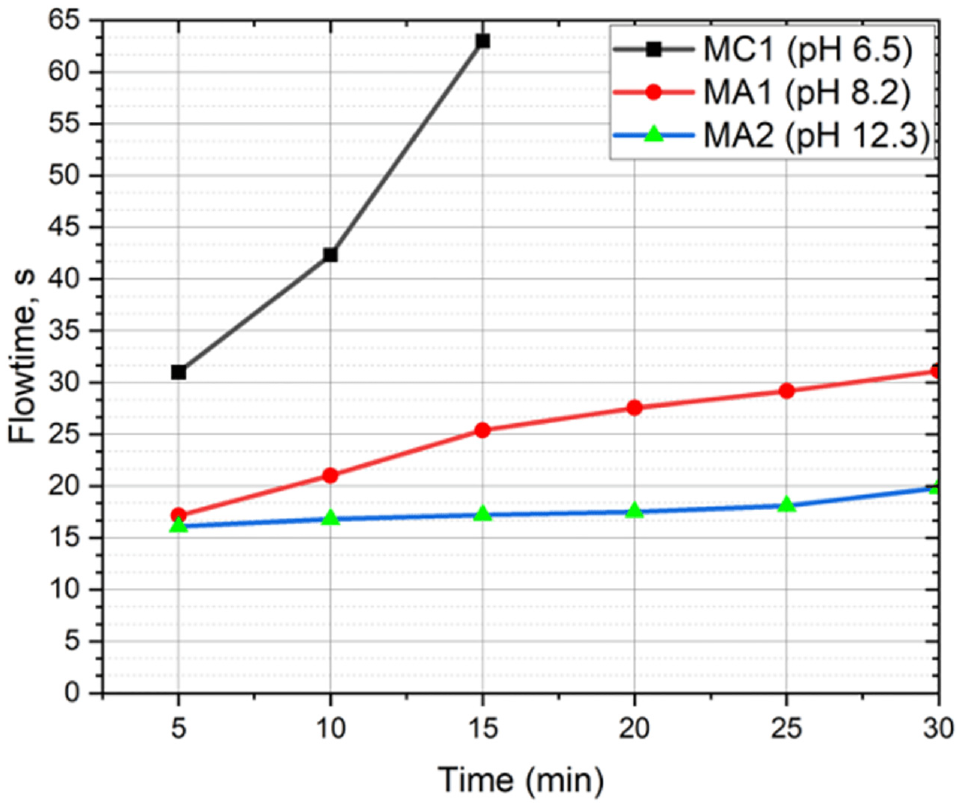
Flow time curve of cement asphalt mortar over time with different asphalt emulsion pH values.
The stability of the ionic emulsions (cationic and anionic) is because of repulsive forces and is significantly influenced by the pH. Changes in pH can shift the charge on the asphalt droplet surface, leading to coalescence and an increase in droplet size, resulting in longer flow times. Even though both AEs A1 and A2 used to produce CAMs MA1 and MA2 have the same emulsifier dosage, the CAM exhibits higher flow time for the emulsion with a lower pH. In contrast, MA2, with a pH of approximately 12, shows the desired flow time.
To understand the interaction between cement and AE, pH measurements were conducted on freshly produced CAM. Figure 8 illustrates the variation of pH over time for three different AEs and for CAM after mixing. The pH of the CAM after mixing is recorded with a microprocessor-based pH meter. Regardless of the emulsion’s pH, the pH of the CAM phase instantly shifts to around 12.5 after mixing. This is because the resulting alkaline medium benefits anionic emulsions with a pH greater than 12, further stabilizing the emulsion. Conversely, cationic emulsions show rapid destabilization.
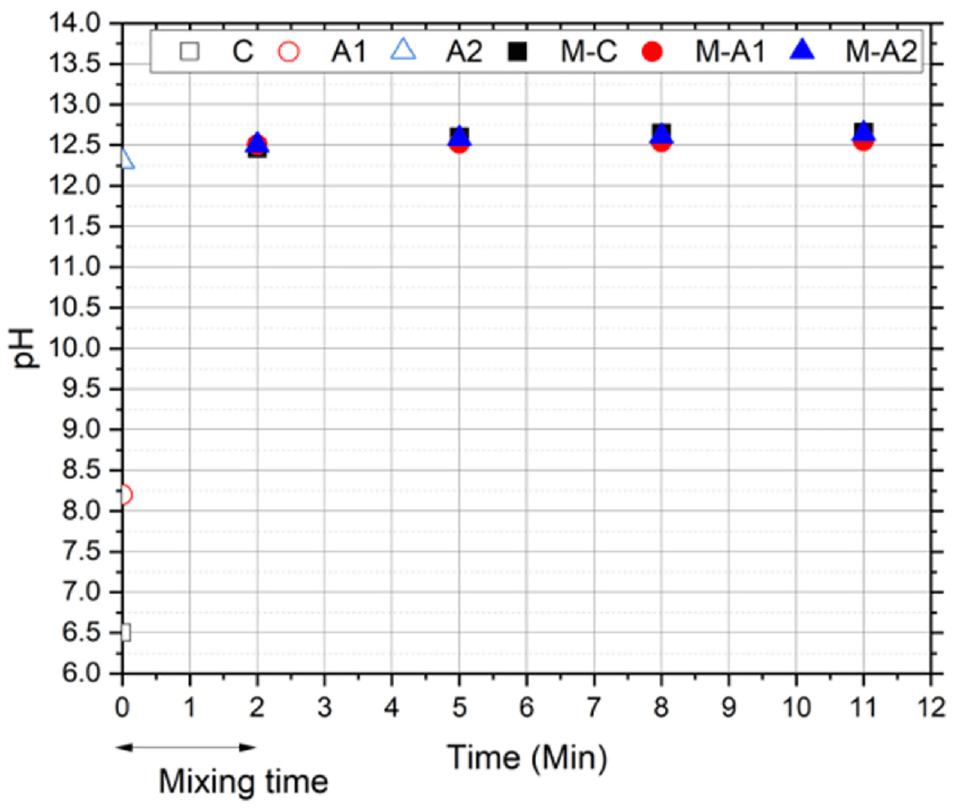
Variation of pH over time after mixing of the cement asphalt mortar constituents.
Influence of Residue Asphalt Content in the Emulsion on the Fluidity of CAM
Figure 9 illustrates the flow time outcomes of three different CAMs produced using AEs with varying asphalt residue contents. It is worth noting that all other parameters, including the total water content to cement ratio (W/C), remain constant across the CAM mixes. On observing the figure, it becomes evident that the CAM with a residue binder content of approximately 60% (referred to as MA2) displayed a lower flow time of 16.1 s at 5 min, and this flow time persisted beyond 30 min. To understand this phenomenon, two potential hypotheses are proposed.
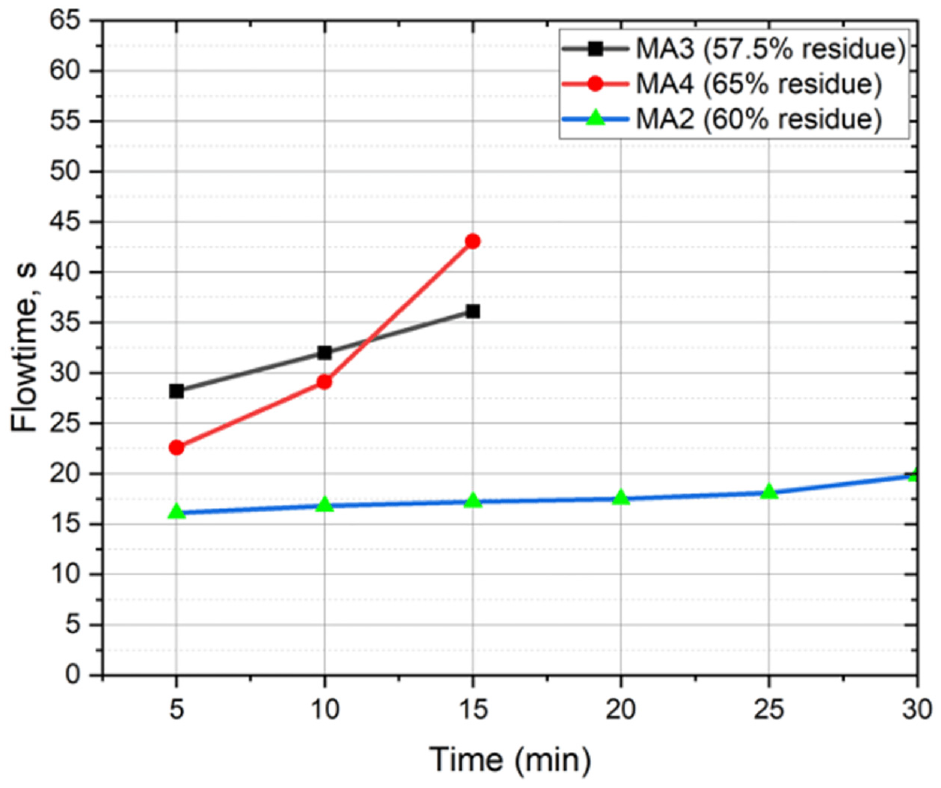
Flow time curve of cement asphalt mortar over time for asphalt emulsions with different asphalt residue contents.
Firstly, in the case of a constant W/C ratio, also termed as the water ratio (for which 0.8 is adopted in this study), the water content of the mixture is derived from two sources—the water content inherent in the emulsion and the additional water (free water) added separately. In these scenarios, the flow time characteristics of the CAM are primarily influenced by the presence of the additional free water, which facilitates better dispersion of the cement grains. Table 6 indicates that the CAM combination MA4 (with the added free water ratio of 0.283) adds the most free water to the process, followed by MA2 (with the added free water ratio of 0.16) and MA3 (with the added free water ratio of 0.09). For the condition of the same asphalt and emulsifier dosage, a CAM with higher free water added yields a lower flow time compared to a CAM with lower free water.
Secondly, although all three emulsions (A2, A3, and A4) share the same emulsifier dosage (OD), variations in micelle concentration within the continuous phase of the AE can be attributed to differing residue contents. The A4 emulsion is likely to exhibit the lowest micelle concentration because of a higher absorption of emulsifiers over a greater number of asphalt droplets, stemming from its elevated residue content. This reduced micelle concentration may prompt an early breaking of the AE, leading to a longer flow time. Consequently, MA4 demonstrated a higher flow time of 22.4 s at 5 min, with a lower working time of 7 min because of the diminished micelle concentration, despite having the highest free water content.
On the other hand, mortar MA3, which potentially has the highest micelle concentration, resulted in an extended flow time of 28 s at 5 min, primarily because of the limited free water content in the mortar. This limitation in free water hinders the dispersion of cement grains, influencing the flow time despite the higher micelle concentration.
Moving on to Figure 10, a comparison plot of the phase concentrations in the emulsion (primary vertical axis) and the water ratio (secondary vertical axis) in the mortar is depicted. The existing specifications for slow-setting AEs only provide the lower limit of asphalt content in the emulsion, which is 60% for cationic and 57% for anionic AEs ( 13 , 22 ). Evaluations of bitumen emulsions with residue contents ranging from 59% to 63%, and beyond, at intervals of 1%, revealed satisfactory CAM flow time results within this range, indicating acceptable performance. Based on these experimental observations, a residue content range of 61% ± 2% is considered acceptable in the context of the present work, where emulsions demonstrate satisfactory performance with respect to CAM flow time.
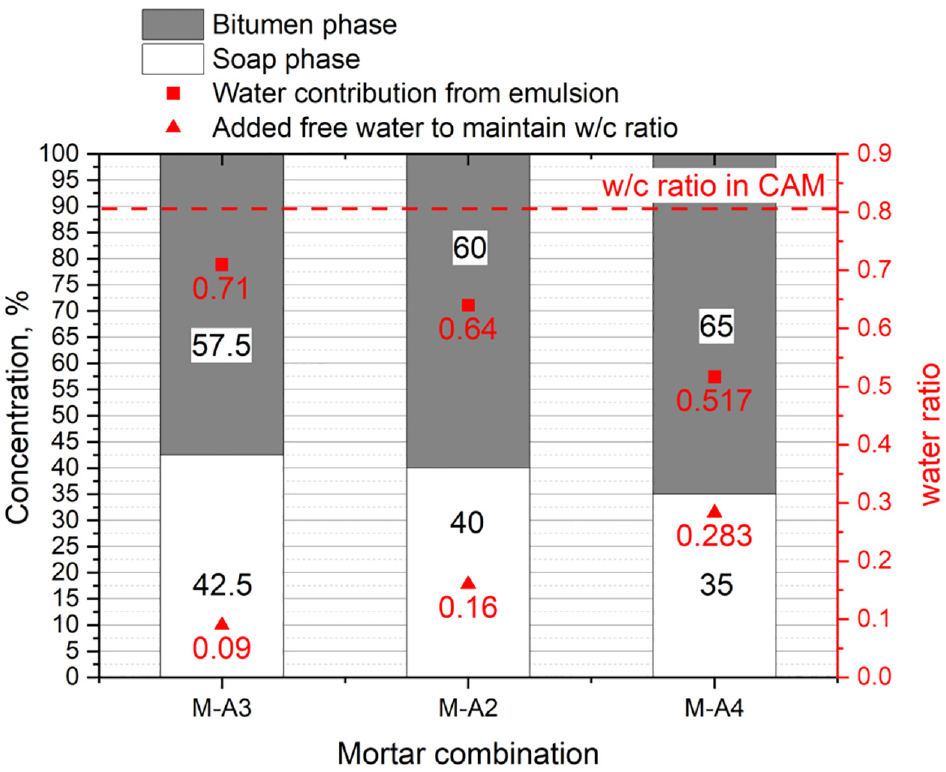
Phase diagram of asphalt emulsions with relative water contents.
The findings of the present study highlight the significance of having an excess micelle concentration in the continuous water phase to maintain the physicochemical stability of the emulsion. In addition, there exists a minimum additional free water content below which the flow time of the emulsion becomes unstable, suggesting the need for an upper limit to the residual asphalt content.
Influence of Varying Emulsifier Dosages on the Coagulation Property of Asphalt Emulsion and Fluidity of CAM
Figure 11 presents the findings with respect to the coagulation property of AEs formulated with different emulsifier dosages. The CV tested for emulsion combinations following IS 8887 guidelines remained within the prescribed limit of 2%, confirming these emulsions as slow-setting with resistance to breaking, suitable for use in the production of CAM.
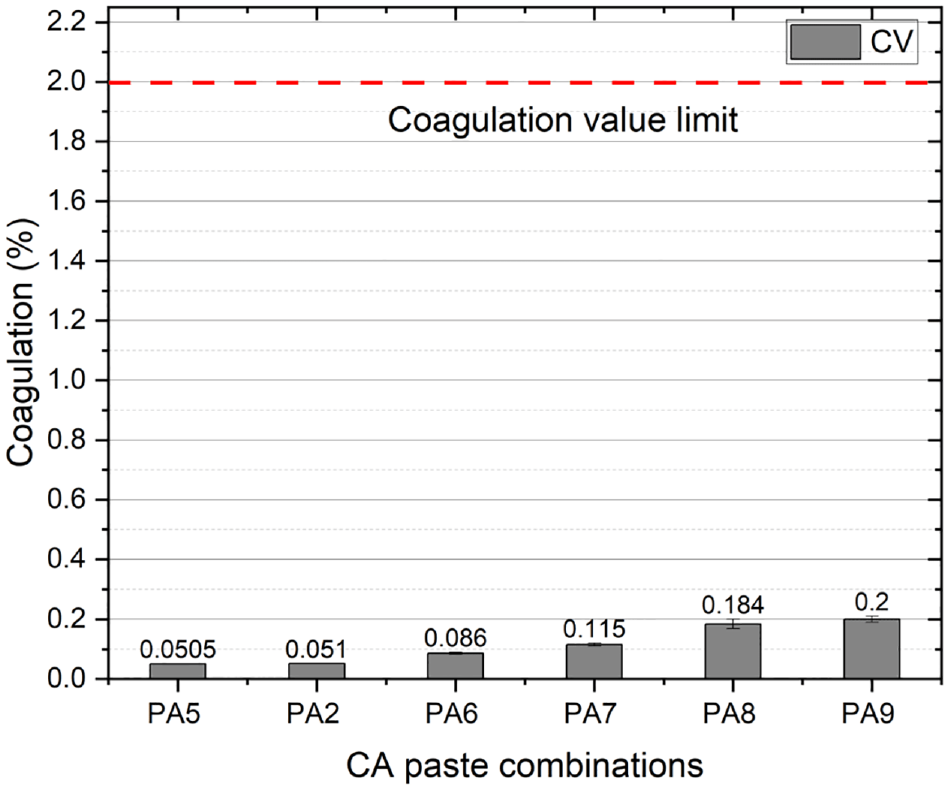
Coagulation values of different cement–asphalt (CA) paste combinations tested as per the coagulation value (CV) test protocol.
Further, the flow time and working time of CAM under different AEs are evaluated, each formulated with varying emulsifier dosages as in Table 5. Figure 12 illustrates the flow time measurements of CAMs under different emulsifier dosages while keeping all other parameters constant. As observed, for the same constituent proportion, the flow time and working time show significant differences across different emulsifier dosages in AE. Emulsions formulated with emulsifier dosages close to the optimum (i.e., A5, A2, and A6) exhibit stable flow time within the range of 16–26 s. Conversely, emulsions with substantially lower emulsifier dosages (A7, A8, and A9) display much higher flow time characteristics, with flow times of 45 s and beyond. This can be attributed to the rapid dissolution of charges on the asphalt droplets. However, during CAM production, significant variation in flow time values was observed under controlled environmental conditions.
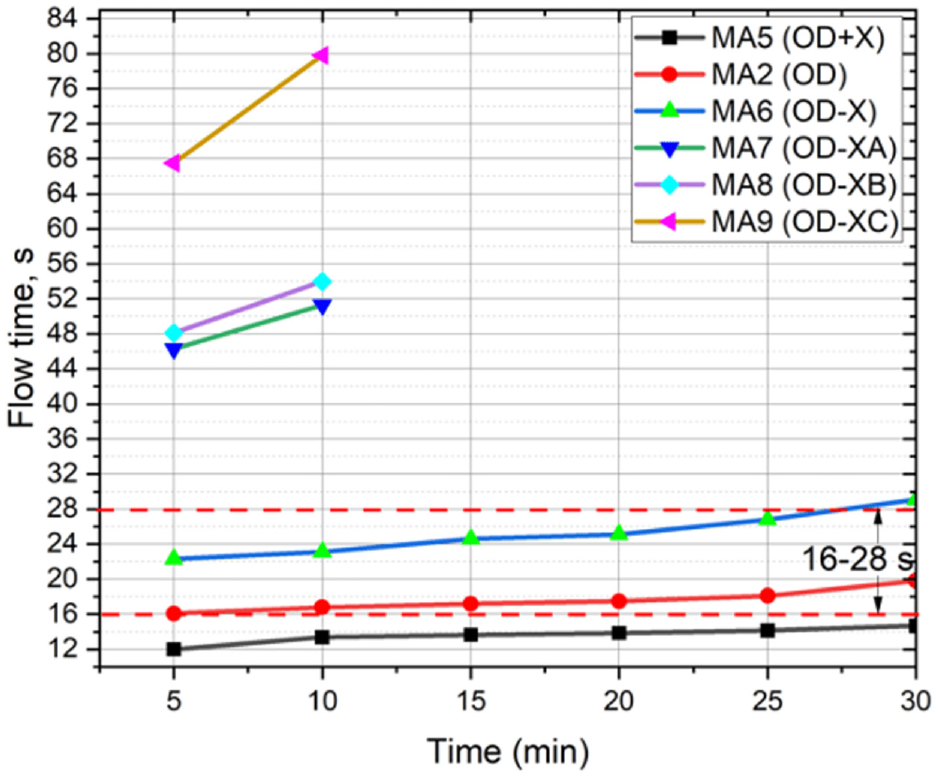
Flow time curve of cement asphalt mortar (CAM) over time for asphalt emulsions with different emulsifier dosages.
To evaluate the observed of CV with the variations in flow time and working time, an evaluation of the coagulation property of AE by the MCV test protocol was conducted. An attempt was made to evaluate the coagulation property of CA paste as per the CAM mix design, using an AE:C proportion of 1.6:1. The results, as shown in Figure 13, indicated that the value quantified in the MCV test protocol was approximately 0.35% at the end of the mixing time, in contrast to the conventional test protocol (IS 8887), which showed values below 0.1% (Figure 11). This observation can be attributed to the variation in the proportioning of constituents, the adopted sieve size, and the stirring protocol. The progression of asphalt droplet coagulation over time, as seen in Figure 13, signifies the neutralization of the asphalt droplet charge, leading to adsorption over cement grains, affecting the flow time (viscosity) of the CA paste, and consequently affecting CAM constructability.
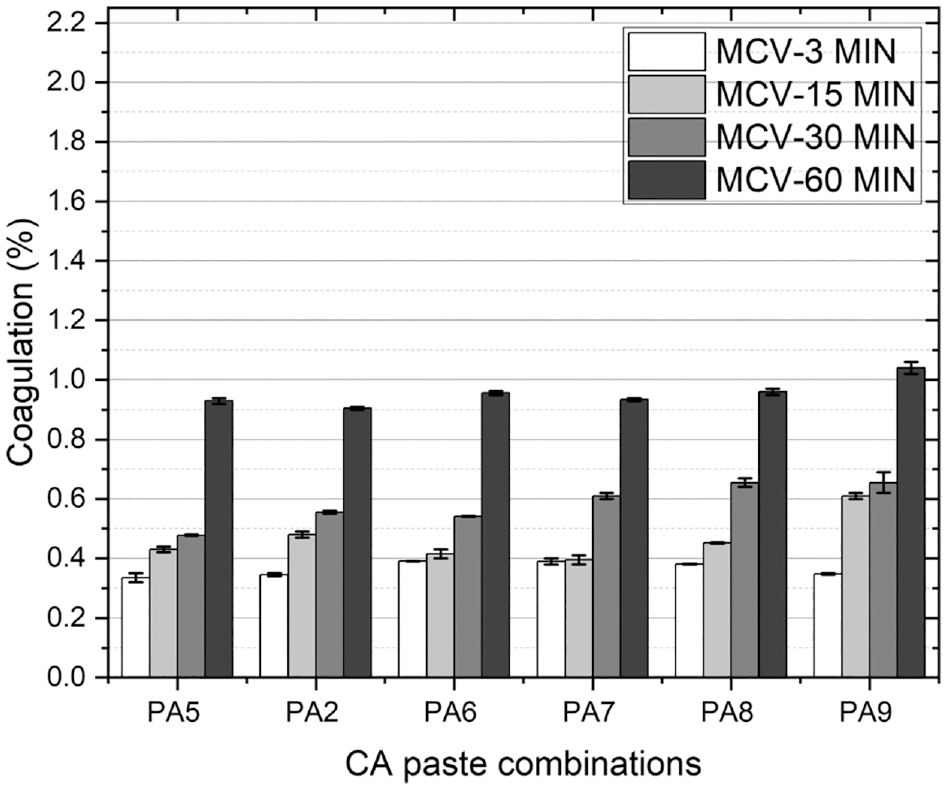
Coagulation values of different cement–asphalt (CA) paste combinations tested as per the modified coagulation value (MCV) test protocol.
It is relevant to highlight that although the magnitude of coagulation is higher in the MCV test and it exhibits an increasing trend compared to the conventional stability to mixing with the cement/CV test (Figure 11), the MCV test and CV test showed a limited sensitivity to detect subtle differences in physicochemical emulsion stability, especially when emulsions are highly stable with dosages way above the CMC of the emulsifier. The small magnitude of differences (approximately 0.1%) makes it difficult to distinguish between emulsions that may have varying performance in the flow time of the CAM. The fluidity ratio method is expected to offer enhanced sensitivity, allowing formulators to detect even minor changes in physicochemical emulsion stability.
To categorize the AEs and determine their compatibility with cement for CAM production, a flow time measurement of CA paste was adopted. The residue content of AE can vary depending on formulation and production conditions, potentially influencing the emulsion’s viscosity. To address this, the flow time of diluted emulsion is recorded using a Ford viscosity cup (No. 4). Subsequently, the flow time of CA paste is recorded over time. Figure 14 shows the flow time in seconds of the AE on the left-hand axis and the flow time in seconds of the CA paste on the right-hand axis. The flow time of the CA paste over time in Figure 14 clearly demonstrates significant variation in flow time with different paste combinations.
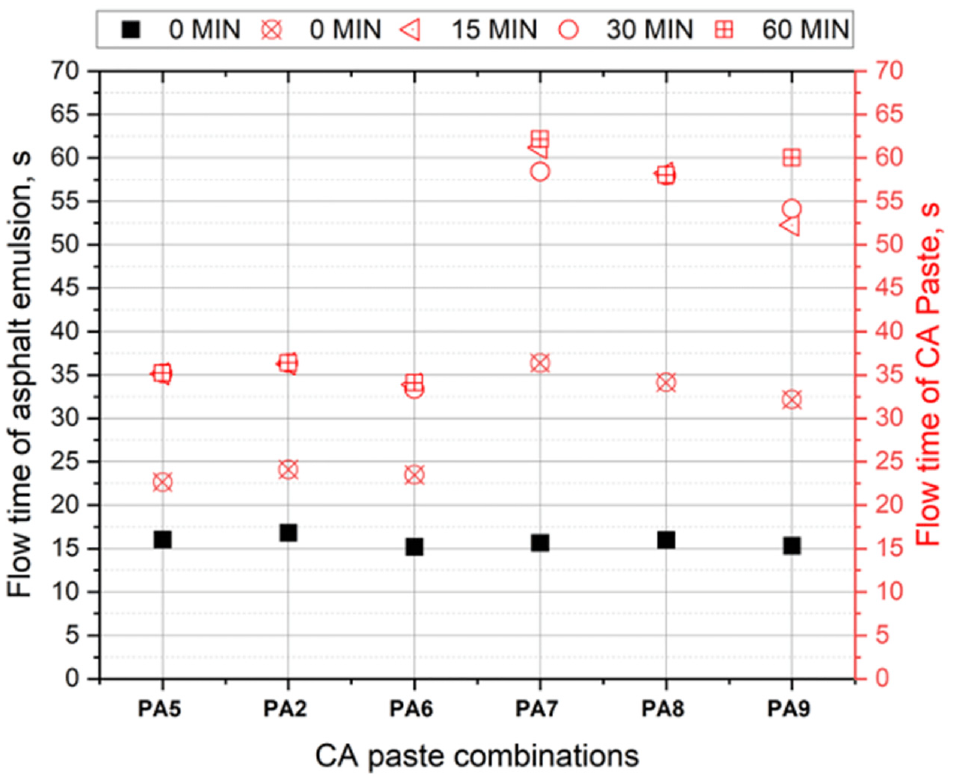
Scatter plot of the flow time of the base asphalt emulsion and cement–asphalt (CA) paste.
By comparing the results from Figure 14 with those from Figure 12, it can be observed that emulsions A5, A2, and A6 exhibited shorter flow time in CAM and shorter flow time in CA paste over extended time periods. In contrast, the use of AEs A7, A8, and A9 in CAM production resulted in longer flow time and shorter working time, indicating longer flow time for the corresponding CA paste as well. Figure 15 presents the fluidity ratio of CA paste over time, showing that PA5, PA2, and PA6 exhibit a fluidity ratio of approximately 2.25 after 60 min, while PA7, PA8, and PA9 display a fluidity ratio of 3.5 and above after 60 min. By comparing the working time of CAM (Figure 12) with the fluidity ratio (Figure 15), a logical conclusion can be drawn. A fluidity ratio below 2.5, especially below 2.25, over a 30-min time period validates the AE’s suitability for CAM production, ensuring stable flow time over an extended period and meeting the required workability criteria. In summary, emulsifier dosages beyond a certain value lead to unstable CAM, and the conventional CV test and MCV test may not effectively differentiate AEs for CAM production purposes. The proposed fluidity ratio test on CA paste emerges as a more appropriate and reliable method, with a fluidity ratio below 2.5 over a 30-min time period serving as the criterion to effectively identify AEs suitable for CAM production.
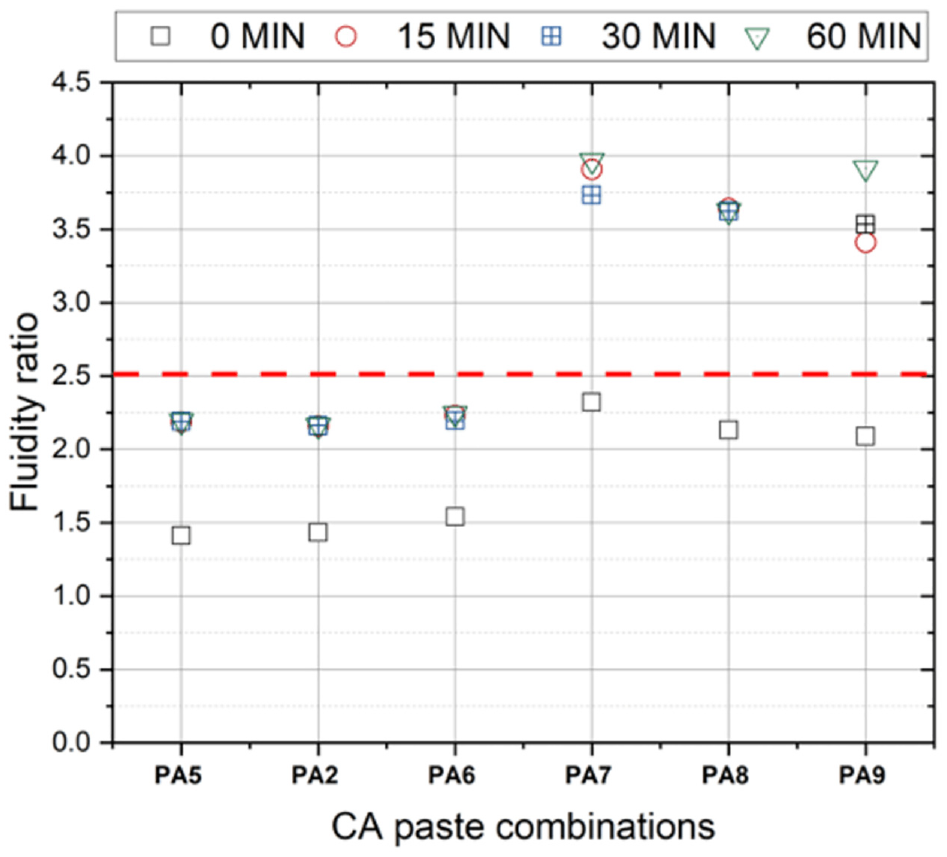
Fluidity ratio of cement–asphalt (CA) paste combinations over time.
The fundamental differences among the evaluated CV test, the MCV test, and the proposed fluidity ratio test lie in their distinct testing objectives. While the CV test and MCV test primarily focus on measuring coagulation, the fluidity ratio test assesses the flow time of AE and CA paste.
As previously mentioned, AEs suitable for CAM production require a higher dosage of emulsifiers, resulting in highly stable emulsions. Emulsions exceeding a certain emulsifier dosage exhibit minimal coagulation while demonstrating unfavorable breaking and flow time behavior when used to produce CAM.
This study aims to propose a test for AE specifications for CAM applications, where the workability requirement, along with the constituents, significantly differs from products used for road applications, such as those tested under the existing CV test in IS 8887. The test also serves as a guiding tool for emulsion formulators.
The production of CAM involves up to nine materials, each with specific characteristics such as cement grade, sand gradation, constituent proportions, and various additives, making the evaluation of the entire system complex. Procuring all the raw materials for CAM production might be beyond the scope of an AE formulator in the process of optimizing the formulation. Therefore, the proposed fluidity ratio test aims to assist the formulation in screening AEs for their suitability for CAM production. Therefore, the recommendations provided on the fluidity ratio requirement for AE serve as necessary prerequisites rather than sufficient conditions. Essentially, the performance indicators of the AE must align and contribute to the overall fluidity performance of the final CAM by the Brass J funnel test.
Conclusions
The study evaluated the influence of AE properties on the flow time characteristics of CAM and subsequently propose a suitable testing protocol and associated criteria for selecting AEs appropriate for CAM production. The findings suggest a strong correlation between AE properties and the flow time of CAM, indicating that the AE used in CAM production significantly affects the resulting flow time.
The pH of the AE has a significant impact on the flow time of CAM. Cationic emulsions, which generally have a lower pH, were found to be less stable because of the high alkaline environment during cement hydration. This led to increased flow time. On the other hand, anionic/non-ionic emulsions exhibited stable flow time because their relatively higher pH is compatible with the alkaline medium resulting from cement hydration in fresh CAM. It is advisable to use an AE with a pH of around 12.
The asphalt content in the emulsion was also shown to have a significant influence on the flow time of CAM. A higher asphalt content in the emulsion, say beyond 65%, led to a reduced micelle concentration, resulting in early emulsion breaking and therefore increased flow time. On the other hand, lower asphalt content with its inherent higher water phase led to a lower added free water content and insufficient dispersion of cement grains, thus affecting flow time negatively. These findings reveal the crucial need for considering both upper and lower limits for the residual asphalt content in AE specifications for CAM production. In the context of the present work, residual asphalt content in the range of 59%–63% was found to demonstrate acceptable flow time.
Emulsifier dosage also played a crucial role in the flow time of CAM. The study found that emulsifier dosages above a certain threshold led to over-stabilization of the emulsion, resulting in a very low CV and thus lower flow time. In contrast, lower emulsifier dosages led to rapid dissolution of charges on asphalt droplets, resulting in increased flow time.
Stability to mixing with cement/CV and MCV tests was found to be less effective in differentiating between AEs for CAM production. Instead, the fluidity ratio test on CA paste, with a criterion of a fluidity ratio below 2.5 over a 30-min time period, can be used as a more appropriate and reliable method for identifying suitable AEs for CAM production.
In conclusion, this study demonstrates the significant influence of AE properties on the flow time of CAM and underscores the need for careful consideration and selection of AEs for CAM production. The proposed fluidity ratio test could serve as an effective means of identifying appropriate AEs, thereby contributing to improved performance and stability of CAM.
Footnotes
Acknowledgements
The authors also want to thank Nouryon Chemicals India Pvt Ltd, Fosroc Chemicals (I) Pvt. Ltd, and Patil Rail Infrastructure Pvt. Ltd, for the supply of raw materials.
Author Contributions
The authors confirm contribution to the paper as follows: study conception and design: R. Reddy Banapuram, K.K. Kuna; data collection: R. Reddy Banapuram; analysis and interpretation of results: R. Reddy Banapuram, T. Andiyappan, K.K. Kuna; draft manuscript preparation: R. Reddy Banapuram, T. Andiyappan, K.K. Kuna, M. Amaranatha Reddy, A. Deb. All authors reviewed the results and approved the final version of the manuscript.
Declaration of Conflicting Interests
The author(s) declared no potential conflicts of interest with respect to the research, authorship, and/or publication of this article.
Funding
The author(s) disclosed receipt of the following financial support for the research, authorship, and/or publication of this article: The continuation of the project entitled Indigenous Development of Cement Asphalt Mortar (CAM) for High-Speed Railway Track from which this paper is derived, was made possible because of funding received from the High-Speed Railways Innovation Centre, National High-Speed Rail Corporation Limited. Grant number: NHSRCL-CO/MA/HT/01/CAM/260/.1/OHQ1097, Dated: 09-11-2020

Data Accessibility Statement
The data that support the findings of this study are available from the corresponding author.