
Abstract
Traditionally, the quality-of-service assessment of a roundabout is only focused on the capacity of the individual entries. However, the exits also have an important impact on the performance of a roundabout since they can be temporarily blocked by prioritized crossing pedestrians. As a consequence, exiting vehicles may spill back from the blocked pedestrian crossing onto the circular roadway. At single-lane roundabouts this will cause a queue on the circle, which again can block the upstream entries and reduce their capacity. The extent of this effect is influenced by vehicle traffic volumes, pedestrian volumes, and also the geometric design of the specific roundabout. In practice, an analytical method would be desirable to estimate the effects of this phenomenon. This paper presents such a solution. As a starting point a mathematical model based on queuing theory is developed which calculates the probability of an entry to the roundabout being obstructed by a queue originating from the next exit downstream. This probability is applied to reduce the usual estimated capacity of the entry. The theoretical model is compared with microscopic simulations of a single-lane roundabout. As a result, a high correspondence between the theoretical approach and the simulation, along with a measurement at a real-world roundabout, becomes evident. Therefore, the model is recommended for practical application in, for example, the Highway Capacity Manual (HCM) or the German Highway Capacity Manual (HBS). A set of graphs is presented which can be introduced into such a standardized calculation procedure.
The quality-of-service of roundabouts is traditionally determined in respective standardized procedures such as the U.S. Highway Capacity Manual (HCM) ( 1 ) and the German Highway Capacity Manual (HBS) ( 2 ). These consider the different legs to be independent junctions. It is presumed that the capacity of the entries is only dependent on the number of lanes, the circulating flow rate, and in some cases the number of prioritized crossing pedestrians. For the exits it is usually the case that no detailed review of the capacity is performed. The total capacity of the whole roundabout results in the sum of the maximum throughput of all legs for specific traffic conditions. However, these procedures completely neglect any mutual influence between the different elements of the roundabout, in particular between the entries and exits. In reality, especially at single-lane roundabouts, spillbacks from a downstream exit forming as a result of a blockage caused by prioritized crossing pedestrians can significantly affect the traffic flow at the upstream entry and thus reduce the entry capacity.
The influence that spillbacks on the circulating roadway can have on the roundabout capacity has been addressed in several studies. With microscopic simulations this effect can be easily modeled for specific situations considering all relevant influencing factors (cf. 3–6). However, a separate simulation model needs to be created for the analyzed roundabout and traffic conditions and the procedure cannot be regarded as standardized. Also, analytical models were derived by Tan ( 7 ), Rodegerdts and Blackwelder ( 8 ), and Schmotz ( 9 ) to consider the influence of downstream exits on the capacity of upstream entries. In the case of Tan ( 7 ) and Schmotz ( 9 ) the influence is modeled with regression functions missing a valid theoretical background. In addition, it is questionable whether the derived functions can be transferred to other countries since the local boundary conditions, such as the geometric design of the roundabouts or the yielding behavior, might differ significantly. In the model by Rodegerdts and Blackwelder ( 8 ), capacity reduction is calculated based on the exiting traffic volume, the roundabout geometry, the number of blocking pedestrians and their mean duration of blockage, and the capacity of the exits. However, the model assumes a blockage of all roundabout legs to calculate the capacity reduction and no specific method is provided to calculate the number of blocking events. Thus, supporting observations or simulations are needed to apply the method.
Brilon and Wu ( 10 ) derived an iterative method to calculate the maximum throughput of a roundabout considering the interference between the different roundabout elements. Since the method is only available for computer applications it is not suitable for a quality-of-service assessment procedure such as those contained in guidelines such as the HCM ( 1 ) or HBS ( 2 ). Also, with the new method of analyzing the traffic flow of roundabouts with a macroscopic fundamental diagram proposed by Brilon et al. ( 11 ) the interference between different roundabout elements is implicitly considered. Since the shape of the macroscopic fundamental diagram is highly dependent on the geometry and the traffic volumes of the individual roundabouts this method is no alternative to a quality-of-service assessment procedure such as those outlined in the HCM ( 1 ) or HBS ( 2 ) (cf. 12 ).
The problem of queues forming within the roundabout becomes relevant when there are large volumes of prioritized crossing pedestrians in the exits. In urban areas with a significant demand from pedestrian traffic this aspect may have a more significant impact on the roundabout performance than the vehicular traffic alone. Furthermore, the geometry of the roundabout or the distances between the pedestrian crosswalk and the circular roadway—and also the distances between the exits and the upstream entries—can have a large impact on the extent of this effect. Therefore, practitioners would benefit from some method to calculate an estimate of these effects on the performance of the whole roundabout, also accounting for the geometric design. Such a verified and easy-to-use method, however, is not available, which suggests the need to adapt the guidelines. The purpose of this paper is to provide an answer to this problem. To do this, it focuses on single-lane roundabouts, as they are the most commonly used type in continental Europe. Single-lane roundabouts are well known for their traffic safety and their high degree of compatibility of all traffic modes. They are thus often used in urban areas with significant pedestrian volumes. A detailed knowledge of the expected interferences caused by queues at these roundabouts is crucial for the planning process.
The paper is structured as follows. First all necessary parameters and cross sections of the roundabout used in this study are defined. A basic aspect then introduced is the capacity of a roundabout exit when influenced by prioritized crossing pedestrians. To derive an analytical model, the relevant basics of the applied queuing theory are explained. Against this background a theoretical model is discussed. This is compared with microscopic simulation results and some numerical examples are given. Finally, the consequences of these derivations are discussed and a suitable formulation with nomograms for future guidelines is presented.
Definitions
For the derivation of an analytical model, all relevant points along the roundabout are first defined (see Figure 1 for an example). The considered situation is an entry j named Ej at a single-lane roundabout whose capacity is influenced by spillbacks on the circular roadway. These spillbacks are caused by an exit lane leaving the roundabout at the downstream leg j+1, where the bottleneck is the pedestrian crossing at point Aj+1. The route of the exiting vehicles diverges from the circular roadway at point Hj+1. The cross sections on the circular roadway between the exit and the entry of the same leg are named Kj or Kj+1.
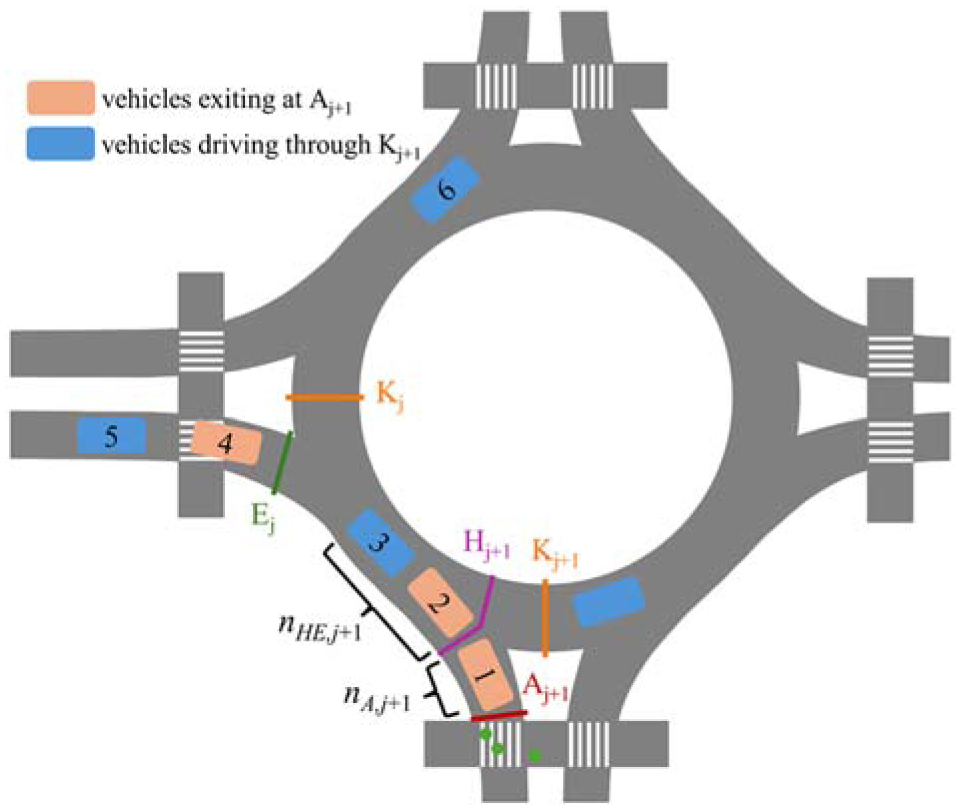
Designation of relevant points and parameters of an entry-exit configuration at a single-lane roundabout.
All other necessary parameters are defined as follows:
nA = number of queuing slots in the exit between the pedestrian crossing and the circular roadway, so that nA queuing vehicles in the exit do not disturb traffic flow within the roundabout,
nHE = number of queuing slots between the diverging point Hj+1 and upstream entry Ej so that nHE queuing vehicles on the circular roadway do not obstruct a vehicle entering from Ej,
vE = entering volume at point E (pc/h),
vA = exiting volume at point A (pc/h),
vK = volume on the circular roadway at point K (pc/h),
vH = volume on the circular roadway at point H (e.g., vH,j+1 = vE,j + vK,j = vA,j+1 + vK,j+1) (pc/h),
nped = number of conflicting pedestrians per hour (p/h),
PA = proportion of exiting vehicles = vA/vH (-),
cA,0 = base capacity of the exit at point A without the influence of pedestrians (pc/h),
cA = capacity of the exit at point A also considering crossing pedestrians (pc/h),
cK = capacity of the circular roadway at point K (pc/h),
cH = actual capacity at point H also considering cA and cK (pc/h),
cE,j = capacity of entry Ej uninfluenced by spillbacks from the downstream exit Aj+1 (pc/h),
cE,b,j = capacity of entry Ej reduced by the influence of spillbacks from the downstream exit Aj+1 (pc/h),
xA = volume-to-capacity ratio at point A = vA/cA (-),
xK = volume-to-capacity ratio at point K = vK/cK (-),
xH = volume-to-capacity ratio at point H = vH/cH (-),
Dn,A = adjustment factor to consider the degree of randomness of the queuing system when using the formulas for an M/M/1 system for exit A (-),
Dn,HE = adjustment factor to consider the degree of randomness of the queuing system when using the formulas for an M/M/1 system HE for the circle between Hj+1 and Ej (-),
p 0,j = probability that entry Ej is not blocked by spillbacks from the downstream exit Aj+1 (-),
F(X) = distribution function of the parameter X (-),
Pr(X) = probability of the parameter X (-).
In the example in Figure 1 one car (car no. 1) can queue within the exit in front of the blocked pedestrian crosswalk without blocking the circular roadway, so that nA results as 1. Since a second exiting car follows immediately (car no. 2) the circular roadway is temporarily blocked so that the third car, which follows the circular roadway and does not exit, has to queue. In this example the distance is large enough for car no. 4 to enter even if car no. 1 queues in the exit and cars nos. 2 and 3 queue on the circular roadway. Thus, the parameter nHE results as 2 for this entry-exit constellation since two cars can queue between points Hj+1 and Ej without blocking the entry. After car no. 4 has entered or if the queue from the crosswalk has a total length of nA + nHE + 1, the entry is blocked and car no. 5 cannot enter the roundabout. Instead, the next circulating car (no. 6)—queues on the circular roadway.
Pedestrian Influence on the Capacity of Roundabout Exits
For the analysis and modeling of the effects of spillbacks on the circular roadway the impact of pedestrians on the capacity of the roundabout exits is a major aspect. In most countries, at roundabout exits, pedestrians have priority by law over the vehicles leaving the roundabout. Thus, the capacity of the exits is directly affected by the crossing pedestrians because of the temporary blockage. However, the priority for pedestrians is not practiced in each case, which reduces the impact on the exit capacity. Observations in Germany have shown that only in 20% to 60% of the conflicts the pedestrians went first ( 13 ). In case of a marked crosswalk (zebra crossing) the compliance rises to about 95% of all conflicts. This ratio differs strongly between different countries so that often much lower yielding rates are reported ( 14 – 16 ). It should be mentioned that the German design rules ( 17 ) recommend marked crosswalks (zebra crossings) at urban roundabouts for all entries and exits in each case.
In capacity calculation, the effect of reduced yielding rates can be considered by multiplying the counted pedestrian flow rate with the yielding rate fP resulting in an effective pedestrian flow rate. Moreover, for the calculation of the exit capacity it should be considered that many pedestrians walk in socially conditioned groups. In this case, the effective volume should be further reduced by a “group factor”fG, for which a typical value of 0.8 has been reported based on observations ( 18 ). Of course, these parameters depend on local conditions and should be adapted to each local situation. The effective pedestrian flow rate nped,E considering reduced yielding rates and socially conditioned grouping then is the basis for further calculations. It can be calculated as:

where
nped,E = effective number of conflicting pedestrians per hour, adjusted by factors to account for grouping and reduced yielding rates (p/h),
fG = adjustment factor to consider socially conditioned groups (0 < fG ≤ 1) (-),
fP = priority compliance (driver yielding rate) adjustment factor (0 ≤ fP ≤ 1) (-),
nped = total number of conflicting pedestrians per hour (p/h).
To determine the capacity cA of the roundabout exits influenced by pedestrians several calculation methods can be found in literature. Based on recent empirical research in Germany, the solutions by Schmotz ( 9 ) and by Schmitz et al. ( 18 ) are worth mentioning.
Schmotz ( 9 ) proposed an equation specifically for mini-roundabouts:
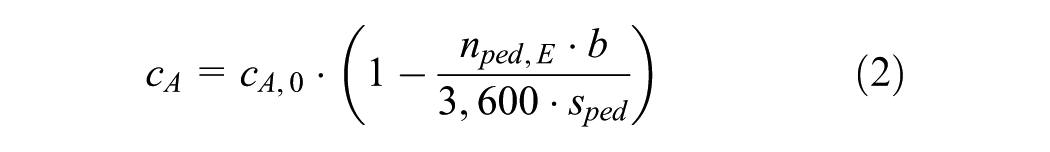
where
b = width of the exit lane at the crosswalk (m), and
sped = walking speed of pedestrians = 1.3 (m/s).
Schmitz et al. ( 18 ) developed a universal formula to calculate the influence of pedestrians on the entry capacity of roundabouts. The formula can be adapted to exits by neglecting the impact of the traffic on the circular roadway resulting in Equation 3 which will be used in the following. Whereas Equation 2 assumes a linear reduction of the base capacity of the exits, Equation 3 considers an exponential reduction, which is more reasonable for an exponential distribution of the time gaps in the pedestrian stream.

where
t 0,ped = mean blockage time of the entry lane caused by one pedestrian = 3.9 (s).
For the base capacity of a single-lane exit cA,0, the HBS ( 2 ) indicates a value of 1,200 pc/h to 1,400 pc/h, which is also referred to in the HCM ( 1 ). A recent study ( 13 ) has confirmed that 1,440 pc/h is the theoretical maximum exiting volume without the influence of pedestrians for roundabouts under the concept of the German design guide ( 17 ). This is a rather theoretical value, which applies in the fictitious case that an uninterrupted flow of vehicles is leaving the roundabout at point A. In practice, this value might not be directly observed over a longer time period because of the interference between the different roundabout legs or as a result of crossing pedestrians. Here, it is treated as a reasonable value for the maximum throughput of an exit within the model context.
Propagation of Congestion: Queuing Theory
To derive an analytical model which considers the impact of spillbacks from an exit Aj+1 on the circular roadway on an upstream entry Ej, the defined system is perceived as a combination of two queuing systems:
a) The first is the queue of exiting vehicles being impeded by the pedestrians crossing at point Aj+1. This queue can extend to point Hj+1 where it will block the circulating traffic when the queue length exceeds nA.
b) The second is the queue forming from point Hj+1 in case of a spillback from exit Aj+1. The diverging point Hj+1 represents the service counter of the second queuing system. From here a queue can extend backward to entry Ej, where it can obstruct the entry temporarily when the queue length exceeds nHE.
To describe these queues, basic equations from queuing theory are applied. Here it is quite usual to compare the interference of two movements, one of them having priority, with a modified M/M/1-queuing system. Thus, the distribution function, which is the probability that the number L of customers in the system (here: vehicles) is less than or equal to M (here: queuing slots) is:

where
Dn = adjustment factor for the degree of randomness of a modified M/M/1 queuing system
x = the degree of saturation (here: volume-to-capacity ratio = v/c) (-)
v = arrival rate of customers (here: vehicles) entering the queuing system (customers/h), and
c = capacity of the queuing system (customers/h).
Transferred to the queuing systems in a roundabout, this equation can be applied to the two analyzed queuing systems. It gives the probability that the queue forming at one specific point (e.g., Aj+1 or Hj+1) is shorter or equal to the number queuing slots (e.g., nA or nHE) and thus the upstream branching point is not blocked. This probability is called p0. The parameters must be used according to the queuing system under consideration. The probability that the branching point gets blocked can then be calculated as 1 −p0.
For Dn = 1 this is the formula for an M/M/1 queuing system. The queuing systems within a roundabout considered here will differ from the functional mechanisms of the M/M/1 queuing system. These real queuing systems are difficult to classify within the common typification of queuing theory, since for high saturations the arrivals and the capacity are less randomly distributed but rather deterministic. Therefore, to adapt the real queuing mechanisms to the formulas of the M/M/1 system, it is usual to apply factor Dn. This factor must be calibrated to the nature of the observed system. It is worth mentioning that adding a parameter Dn may not fully describe the characteristics (e.g., the distribution) of a modified M/M/1 (M/G/1) queuing system. It is only an approximation to use this equation for further modeling in the paper. Simulation studies have shown that this approximation is suitable for practical use without significant deviations.
Based on these considerations, for the first queuing system in the exit it is stated:
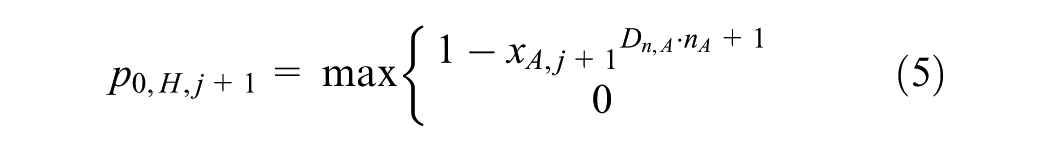
where
p0,H,j +1 = probability that the queues at exit Aj+1 are shorter than or equal to nA, and the circular roadway at point Hj+1 is not impeded (-).
The capacity of exit Aj+1 to determine xA,j+1 is influenced by the number of crossing pedestrians nped,j+1 at the exit. This reduced capacity can be calculated using Equation 3.
For the second queuing system on the circular roadway the result is:
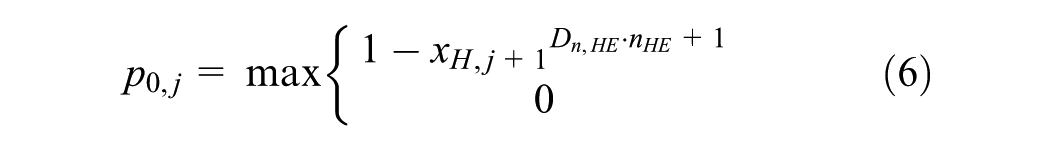
where
p 0,j = probability that the queues on the circular roadway forming from point Hj+1 are shorter than or equal to nHE and do not block the upstream entry Ej (-).
This means that the volume-to-capacity ratio xH,j+1 must be determined first to calculate p0,j.
Parameter p0,j is the factor by which the capacity cE,j at entry j, as calculated by conventional methods, must be reduced when assessing the effect of a spillback from exit Aj+1 into the roundabout. Therefore, parameter p0,j is the target of the derivations made in this paper.
It should be noted that the number M in Equation 4 includes the service counter. Similarly, in Equations 5 and 6, the service counter is also implied within nA or nHE. Usually, in such a priority system the first position in the minor stream is treated as the service counter. This aspect, in the observed case, makes the approach seem questionable, because by succeeding use of Equations 5 and 6 two service counters are implied in a system which in reality is a continuous flow of vehicles. Especially in the first queuing system in the exit this assumption is critical, since for single-lane roundabouts nA is typically limited to 1. If a vehicle arrives here, when there is no need to stop for a pedestrian, it exits the roundabout without queuing. The theory, however, implies that this vehicle stops for a certain duration. This assumed duration is the service time, which in queuing theory is defined as 1/cA,j+1. That means that the real duration of the occupation of the first place is lower than the theory assumes. This discussion underlines that the analogy between a theoretical queuing system and a priority system is limited. If longer queues are relevant, for example, at two-way stop-controlled intersections, this problem is less impactful. To take this aspect into consideration, instead of Equation 5, the following form is used to estimate the probability that no queue from the exit exceeds point Hj+1 and blocks the circular roadway:
Adjustment Factor Dn
The value for the two parameters Dn (cf. Equations 6 and 7) or the randomness of the queuing system have a significant influence on the calculated probability of a spillback blocking point Hj+1 or Ej. Thus, the capacity of the observed entry j, which is calculated as the final result, is also affected by these parameters.
To determine a suitable value for Dn, Monte Carlo–like simulations have been carried out for the first queuing system at exit Aj+1 using the software KNOSIMO ( 19 ). The resulting estimates for Dn,A showed considerable variability. The parameter Dn,A depends on many parameters, for example, the exiting traffic volume vA,j+1, the number of prioritized crossing pedestrians nPed and, above all, the volume-to-capacity ratio xA,j+1. However, the position in the queue is without noticeable influence. It is also irrelevant whether the arrivals of the exiting vehicles are considered an exponential distribution or a distribution with a lower limit for the headways. The relationship Dn,A = f(xA,j+1) is shown in Figure 2. Curves for vA,j+1 = 100 pc/h and 300 pc/h are shown for the case of an exponential distribution of arrivals.
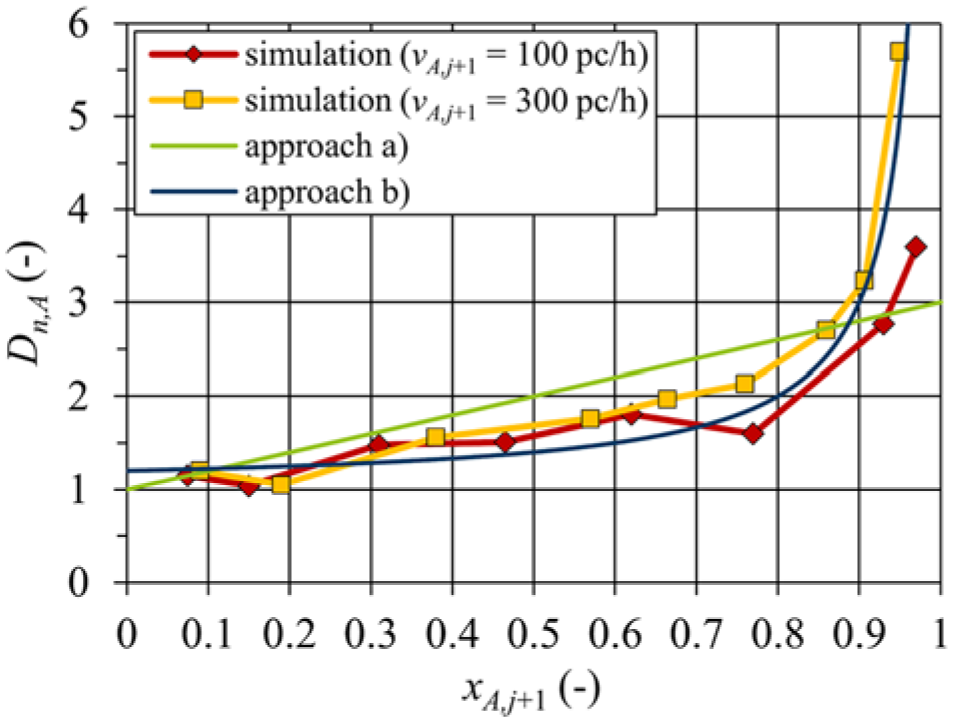
Adjustment Factor Dn,A depending on the volume-to-capacity ratio of the exit.
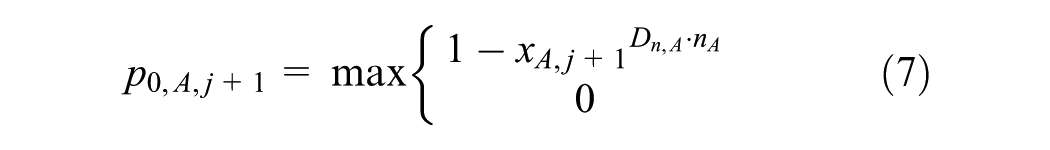
The curves must tend toward infinity for xA,j+1→ 1, because at full saturation the system modifies into a D/D/1 system, in which no traffic jam occurs as long as the volume-to-capacity ratio is less than 1. The result suggests the following two variants for the calculation of parameter Dn,A as a function of xA,j+1 (cf. Figure 2):
a) For easy practical application, the relationship shown is represented by a linear function (case a):

b) The curves for Dn,A = f(xA,j+1) (Figure 2) must tend toward infinity for xA,j+1→ 1, because at full saturation the system transforms into a D/D/1 system. The simulation results also suggest this tendency. The following function might then be used as an approximation instead of the linear function (case b) (fitted by regression):

The large deviation of the linear approach a) from the simulated values (underestimation) at xA,j+1 > 0.9 is acceptable, because in practice this range should occur only rarely. Moreover, in this case the exit would bring the entire roundabout to a standstill anyhow, which would definitely be expressed by the calculation result. In the range of xA,j+1 < 0.8, the values of Dn,A are slightly overestimated with approach a). The simulated values of Dn,A in this range are between 1 and 2, while Equation 8 returns values between 1 and 2.5. For further procedure, approach a) is chosen because it is simpler and, finally, a useful overall result has been achieved.
There is no corresponding study for the second queuing system within section Hj+1 to Ej on the circular roadway. Experience with queuing systems suggests that the realistic Dn value is rather larger than in the exit, because a deterministic traffic flow occurs in the circle at higher traffic volumes. Thus, Dn,HE is determined from the microscopic simulations described below. There, a value of Dn,HE = 4.5 turned out to be the best fit.
Derivation of an Analytical Model
The problem considered in this study shows considerable similarity with a configuration at usual unsignalized intersections. It is identical to that of a shared lane with an additional short turn lane. A solution to estimate the capacity for such a shared short lane (SSL) has been derived by Wu ( 20 ) and Wu and Brilon ( 21 , 22 ). Their solution, as a standardization, is contained in the HCM ( 1 ) for two-way stop-controlled intersections (HCM Equation 20-51 ff).
In the case of a roundabout exit, as considered here, Hj+1 is the diverging point on the circular roadway. In the SSL model, the exiting lane represents the short turn lane with nA queuing slots between the diverging point Hj+1 and the pedestrian crossing at point Aj+1. The capacity cA,j+1 of the exit at point Aj+1 is mainly influenced by crossing pedestrians. The circular roadway at point Kj+1, that is, downstream from point Hj+1, replaces the through lane in the SSL model. The situation can then be abstracted as shown in Figure 3.
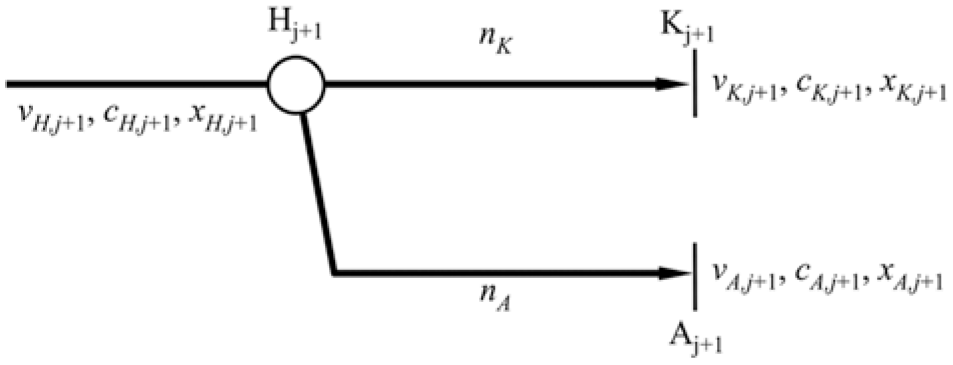
Constellation of the mixed lane at a roundabout exit j+1.
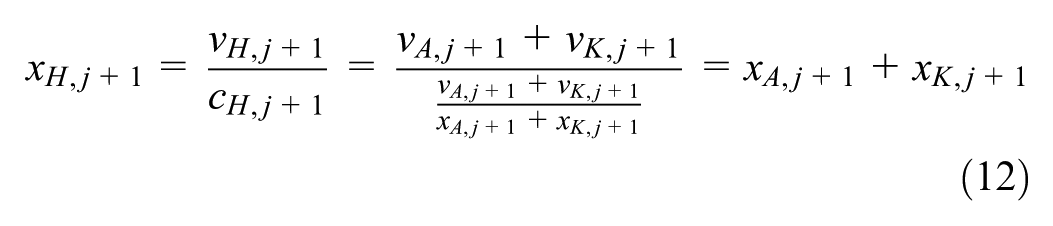
The section on the circular roadway upstream from the diverging point Hj+1 is treated as a shared lane used by the two movements directed to exit Aj+1 and point Kj+1. The capacity of the shared lane at point Hj+1 can be calculated with the general shared lane formula in Equation 10, as was first determined by Harders ( 23 ). This formulation is valid for each kind of queuing system where two different kinds of customer are served by the same counter.

where
cH,j +1 = capacity at the branching point Hj+1,
vA,j+1 = exiting volume at point Aj+1 (pc/h),
vK,j+1 = volume on the circular roadway at point Kj+1 (pc/h),
cA,j+1 = capacity of the exit at point Aj+1 also considering crossing pedestrians (pc/h),
cK,j+1 = capacity of the circular roadway at point Kj+1 (pc/h),
xA,j+1 = volume-to-capacity ratio at point Aj+1 = vA,j+1/cA,j+1 (-), and
xK,j+1 = volume-to-capacity ratio at point Kj+1 = vA,j+1/cA,j+1 (-).
However, this is only correct for times when there is a queue reaching from point Aj+1 back onto the circular roadway blocking point Hj+1. The proportion pT of this time is (cf. Equation 7):

Only during these times is the volume-to-capacity ratio in the exit next to point Hj+1 identical to xA,j+1 at the pedestrian crossing.
Consequently, the volume-to-capacity ratio at point Hj+1 during this time of proportion pT is:
Then, during this time of proportion pT, the proportion of time ppT when there is a queue reaching from point Hj+1 back onto the upstream entry Ej is (Equation 6):
Related to the total time, with Equation 11, the result is that, for the total probability pTpT, the entry Ej is blocked by a queue stemming back from the downstream exit Aj+1 via point Hj+1:
Therefore, the probability p0,j that entry Ej is not blocked is:
where
a = 1 + 2 ·xA,j+1, and
b = 4.5.
For nA = 0, the equation does not give a meaningful result because it is not defined. Also, in this situation the value of p0,j must be equal to 1 in case of xA,j+1 = 0 (i.e., there is only through traffic on the circular roadway). That is, Equation 15 must be normalized to 1 by a parameter C in this situation:
Appling the limit of xA,j+1a·0 = 1 yields

And thus,
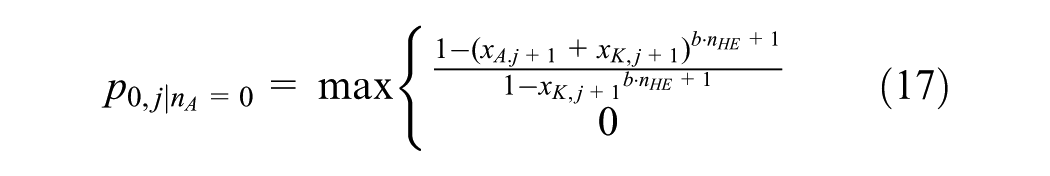
Therefore, the probability that the upstream entry is not blocked by a spillback from the downstream exit results for nA ≥ 0 in:
It has to be mentioned that any result derived from a stationary (steady-state) queuing system is only valid for a volume-to-capacity ratio x ≤ 1. That is, the derivations of Equations 11 through 18 are only applicable for xA,j+1 ≤ 1, xK,j+1 ≤ 1 and xH,j+1 ≤ 1. Given the stochastic nature of the embedded queuing model the derivations of Equations 11 through 18 account also for the dynamic effects caused by the temporal increase and decrease of the queue length at a real roundabout in the transition between the blocking of point H and the dissipation of the exit queue at point A. These dynamic effects may have a temporally positive or even a negative effect on p0,j. However, Equation 18 does deliver an average value over time in case of xA,j+1 ≤ 1, xK,j+1 ≤ 1 and xH,j+1 ≤ 1 because the stochastic distribution of queue length is sufficiently accounted for in the considered queuing system based on the embedded queuing theory.
Comparison with Microscopic Simulations
Normally, the capacity reduction caused by spillbacks within the roundabout cannot be sufficiently analyzed empirically since the spillback effect only occurs for short time periods so that enormously long observation times are required. Furthermore, the results can be strongly influenced by local conditions. Therefore, microscopic simulation was used to verify the derived analytical model. A simulation model of a single-lane roundabout has been developed using PTV Vissim ( 24 ), which replicates a typical geometric design as recommended by the German guidelines ( 17 ). Within this margin some variation was possible with regard to the distance between entry and the next downstream exit, which resulted in scenarios with different values for the parameter nHE. The distance between the crosswalk and the circular roadway was not modified in the simulation so that for all scenarios a value of nA = 1 was used, which represents the standard design for single-lane roundabouts in Germany. In each case the outer diameter of the roundabout was 40 m. For this study one pair of an entry Ej and a downstream exit Aj+1 was selected. The model was tested and the uninfluenced entry capacities cE,j were calibrated to match the capacity equations of the HBS ( 2 ). The calibration also achieved an uninfluenced capacity at the exits cA,0,j+1 of 1,440 pc/h and a capacity for the circular roadway cK,j+1 of 1,640 pc/h. The exit could be crossed by pedestrians, who, for this study, used their absolute priority, as established by the crosswalks, and did not walk in socially conditioned groups (nped,E = nped). The number of hourly crossing pedestrians nped,j+1 in the exit was varied in different scenarios from 0 to 400 p/h in steps of 100 p/h.
It is in the nature of microscopic simulation that probability p0,j cannot be obtained directly from simulation. Instead, p0,j was reconstructed by a comparison of capacities. In a first step the origin–destination (O-D) matrix of traffic demand was established in a way that no traffic was leaving exit Aj+1 and therefore no spillback effect occurred. Entry Ej, however, was charged with rather high volumes above the capacity. Thus, the possible input vE,j at entry Ej measured in 1-h intervals with constant boundary conditions could be treated as capacity cE,j, that is, without a bottleneck at exit Aj+1. The conflicting traffic volume on the circular roadway vK,j at leg j was varied within one scenario from 0 to 1,400 pc/h in steps of 50 pc/h, so that 29 h were simulated for each simulation run. As a result, the values of the volume vH,j+1 at point Hj+1 differed in a certain range because of the shape of the capacity function (vH,j+1 = vE,j + vK,j).
For succeeding scenarios, volumes vA,j+1 aiming at exit Aj+1 were increased stepwise. The resulting ratio of exiting vehicles PA,j+1 relative to vH,j+1 varied from 0% to 100% in steps of 10%. The volumes entering at Ej must still be kept on a level of oversaturation to measure the capacity under the influence of the blockage effects on the circular roadway defined as cE,b,j. Obviously, the now resulting capacity cE,b,j is smaller than cE,j. The relation cE,b,j/cE,j is a direct representation of p0,j. The input of the relevant O-D matrices into the VISSIM-model could be automated so that a rather large sample of simulation runs could be achieved easily. For every combination of different values of nHE, nped,j+1, and PA,j+1, which defines a specific scenario, 20 simulation runs with different random seeds were carried out.
All simulated scenarios were compared with the analytical model (cf. Equation 18), where Dn,A was modeled with Equation 8 and the capacity reduction caused by the pedestrians was calculated using Equation 3. As a result the best compliance was achieved with the value of Dn,HE or b = 4.5, determined by minimizing the squared errors.
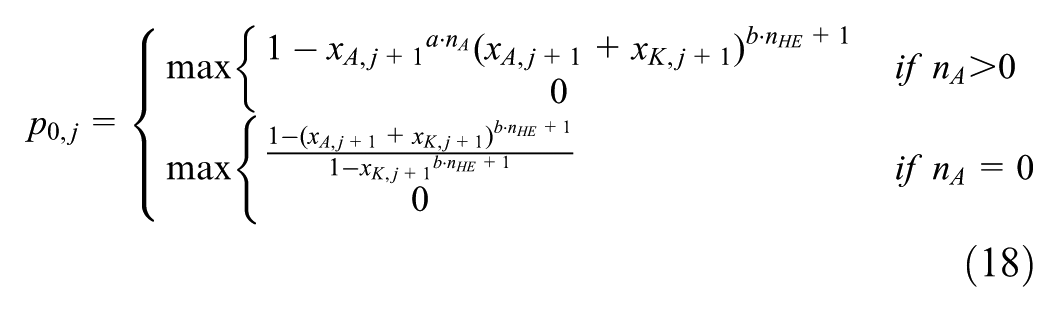
In Figure 4 some of the results are illustrated as they depend on the volume vH,j+1 on the circular roadway at the diverging point Hj+1 and on the proportion of exiting vehicles PA,j+1. The colored points represent the simulation results whereas the curves illustrate the results of the model. The model curves are only depicted in the valid model range of xA,j+1 + xK,j+1 ≤ 1. The significant effect of spillbacks within the roundabout on the capacity cE,b,j can be seen directly by the reduction of p0,j, the extent of this effect being strongly influenced by the traffic volume, the number of crossing pedestrians and the roundabout geometry. The derived mathematical model shows a nearly perfect fit to the simulation results in case of xH,j+1 ≤ 1 or xA,j+1 + xK,j+1 ≤ 1. It is reasonable that in the simulation or in real traffic flow also situations can occur where xH,j+1 > 1 or xA,j+1 + xK,j+1 > 1. These situations cannot be accounted for by the proposed model. All systematic influences on the effect are depicted properly by the model in the valid model range. Figure 4 also illustrates that a larger volume of pedestrians at an exit Aj+1 in combination with larger volumes of exiting vehicles has a potential to block the upstream entry Ej completely (p0,j = 0 or cE,b,j = 0).
Comparison of the derived model (Equation 18) with the simulated values of p0,j.
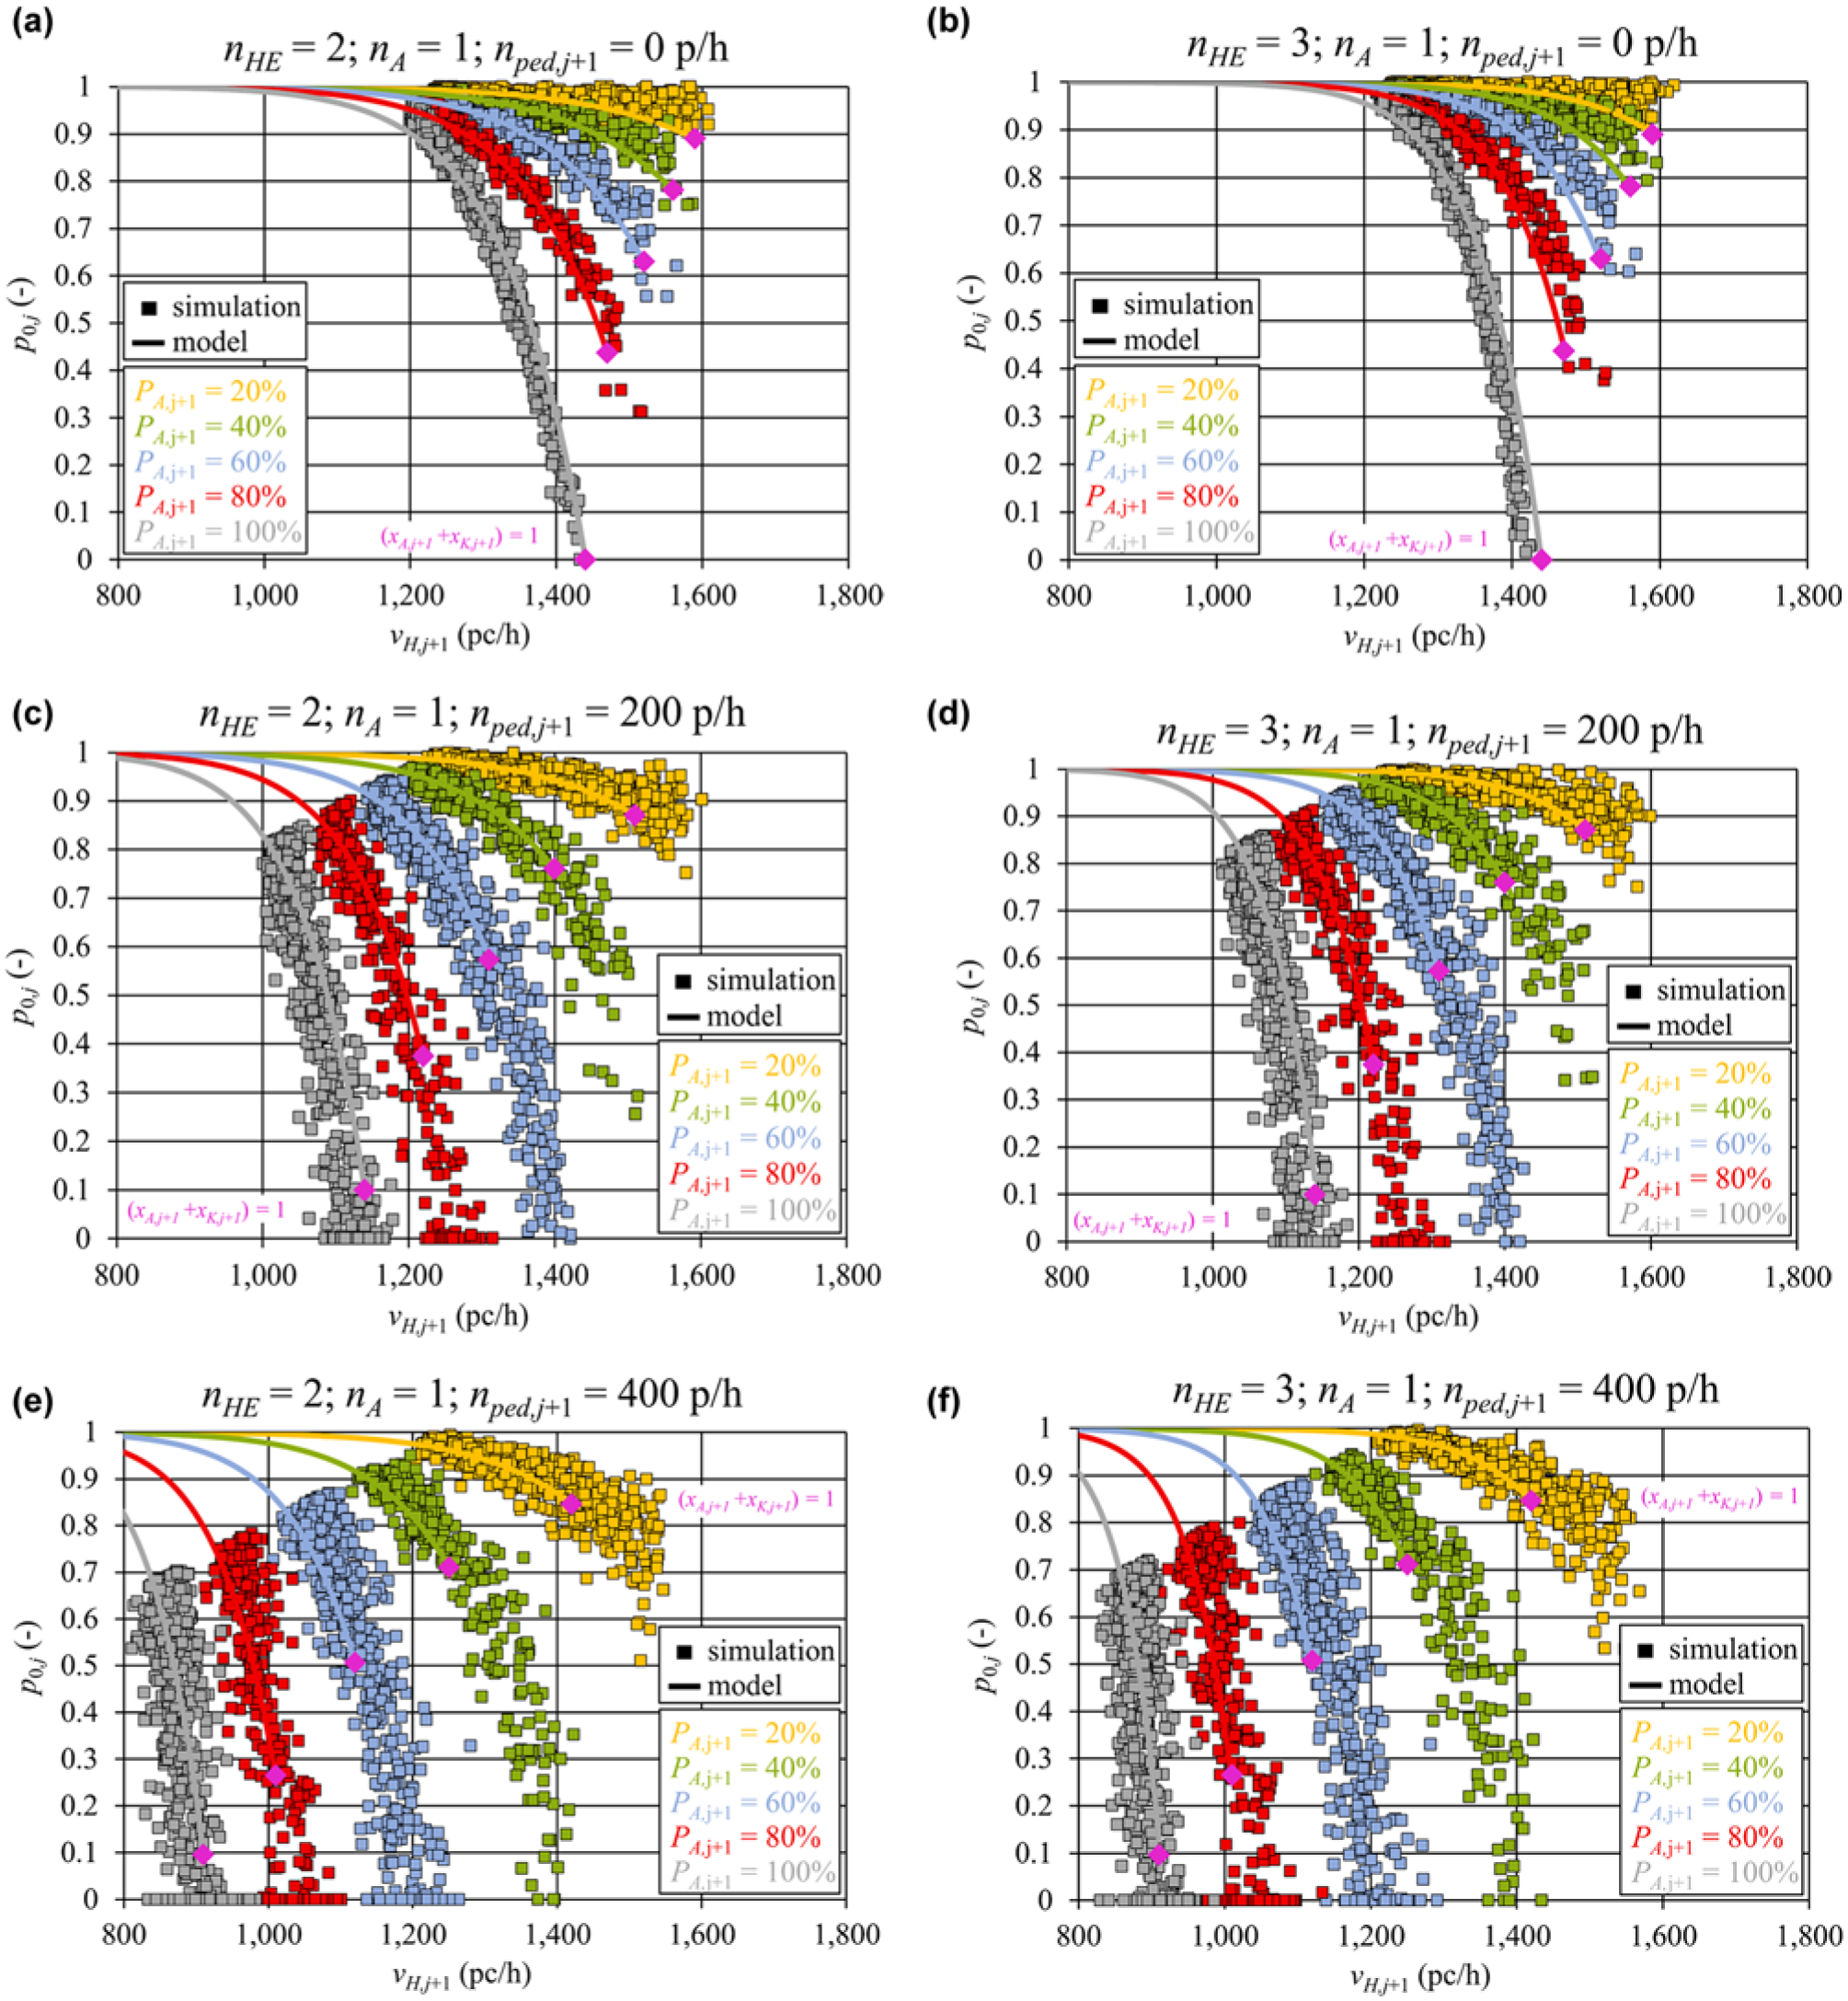
It has to be emphasized once again that the proposed model is only valid for xA,j+1 + xK,j+1 ≤ 1. If the model is extrapolated to the range of xA,j+1 + xK,j+1 > 1, the impact of nHE in Equation 18 reverses and more queuing slots on the circular roadway would lead to lower values on p0,j (see Figure 5 as an example). In other words, it would result in lower capacities at the entry Ej. This is obviously not plausible and could not be found in simulation results which showed no systematic differences between nHE = 2 and nHE = 3 in this value range (Figure 4). Thus, the model should not be used for these situations, which might not have a huge relevance in practice.
Calculation of p0,j for an example with the derived model (Equation 18) for nHE = 2 and nHE = 3.
In Figure 6 the model has been evaluated as an example for nA = 0, 1, 2, and 3 as well as nHE = 1, 2, and 3 with traffic volumes on the circular roadway of vH,j+1 = 1,100 and 1,450 pc/h. In the example the number of crossing pedestrians is 200 p/h and the exiting volume is 500 pc/h (PA,j+1 = 0.45 and PA,j+1 = 0.35). It can be seen that the largest effect on the target value p0,j is caused by the space nA between the circular roadway and the crosswalk. Here, and also for the distance nHE, the first space has the strongest impact. For the rather large value of circulating traffic (1,450 pc/h) and nA = 0 the next upstream entry will be almost completely blocked, independent from nHE.
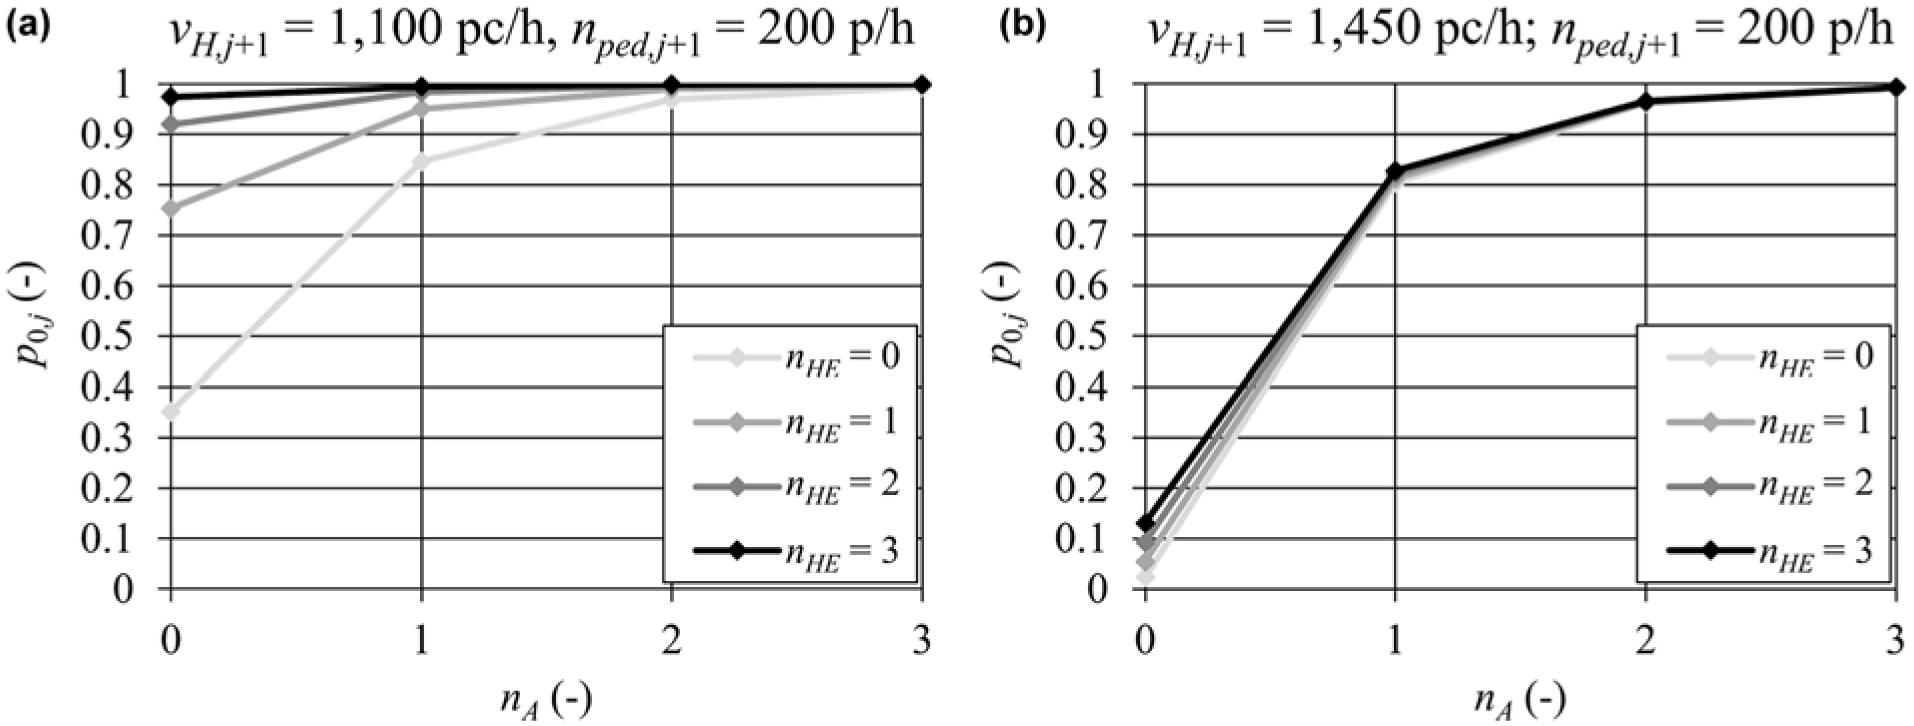
Evaluation of the model for an example case: (a) with vH,j+1 = 1,100 and (b) vH,j+1 = 1,450.
Implementation into Capacity Calculation Procedures
In guidelines such as the HCM (1) or the HBS (2), the capacity cE,PCE,j of a single-lane entry Ej is calculated in pc/h using a specific capacity formula which differs between the guidelines (e.g., HCM Equation 22-1). The calculated capacity is then adjusted with an adjustment factor fped,j for prioritized crossing pedestrians if a crossing is located in the entry and a heavy-vehicle adjustment factor is applied to convert the capacity back into veh/h (e. g. HCM Equation 22-14). Furthermore, the capacity can be influenced by spillbacks from a downstream exit which is neglected in the guidelines. With the model proposed in this paper the probability p0, j that the entry does not get blocked by vehicles queuing from the next downstream exit Aj+1 can be calculated. This also represents the proportion of time in which the entry is not blocked by these spillbacks. To incorporate the influence of the blockage effects of the spillbacks from the downstream exit into the capacity calculation, the usually determined capacity has additionally to be adjusted with p0,j resulting in:

where
cE,b,j = capacity of the entry j influenced by pedestrians, heavy vehicles and the blockage of a downstream exit (veh/h),
cE,PCE,j = capacity of the entry Ej influenced by the conflicting flow on the circular roadway (pc/h),
fped,j = entry capacity adjustment factor for crossing pedestrians in the entry Ej (-),
fHV,j = heavy-vehicle adjustment factor of entry Ej (-),
p0,j = probability that entry Ej is not blocked by spillbacks from the next downstream exit Aj+1 calculated with Equation 18 (-).
The resulting capacity cE,b,j can then be used to determine the volume-to-capacity ratio xE,j = vE,j/cE,b,j of the entry and the average control delay with the respective guideline (e.g., HCM Equation 22-17). Thus, the derived model can easily be incorporated into existing quality-of-service assessment procedures.
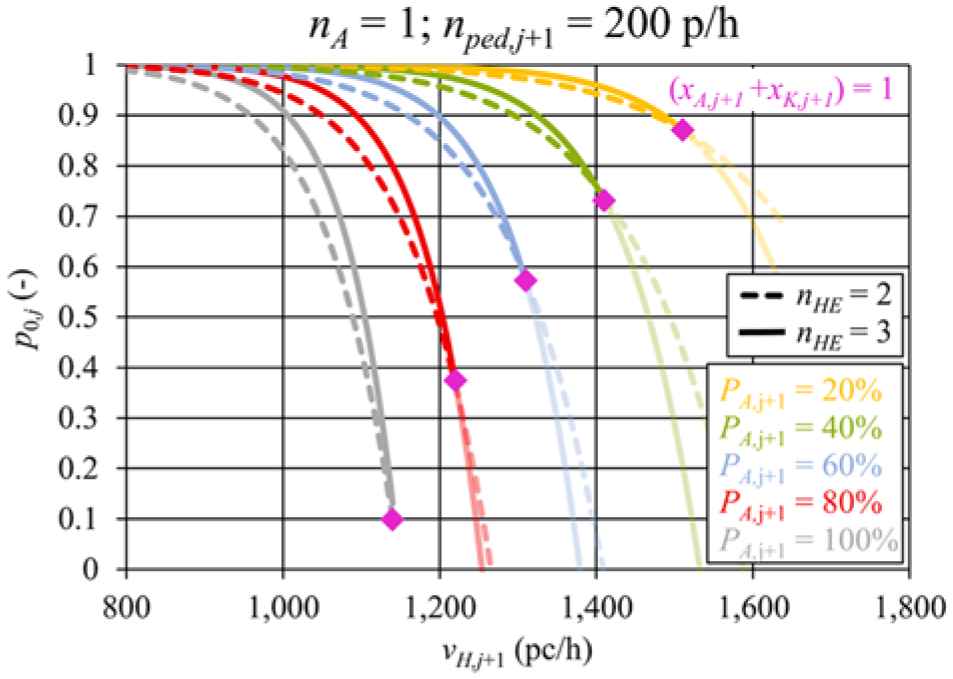
To simplify the calculation procedure the derived model can be illustrated as nomographs. Practitioners can directly estimate the influence of the downstream exit. Corresponding nomographs have been created for combinations of the parameters nA (= 0 or 1) and nHE (= 1, 2 or 3) (cf. Figure 7). The curves are truncated with xA,j+1+xH,j+1 ≤ 1, for which Equation 18 is valid. To use the nomographs, only the volume-to-capacity ratio xA,j+1 of each exit j+1 needs to be calculated.
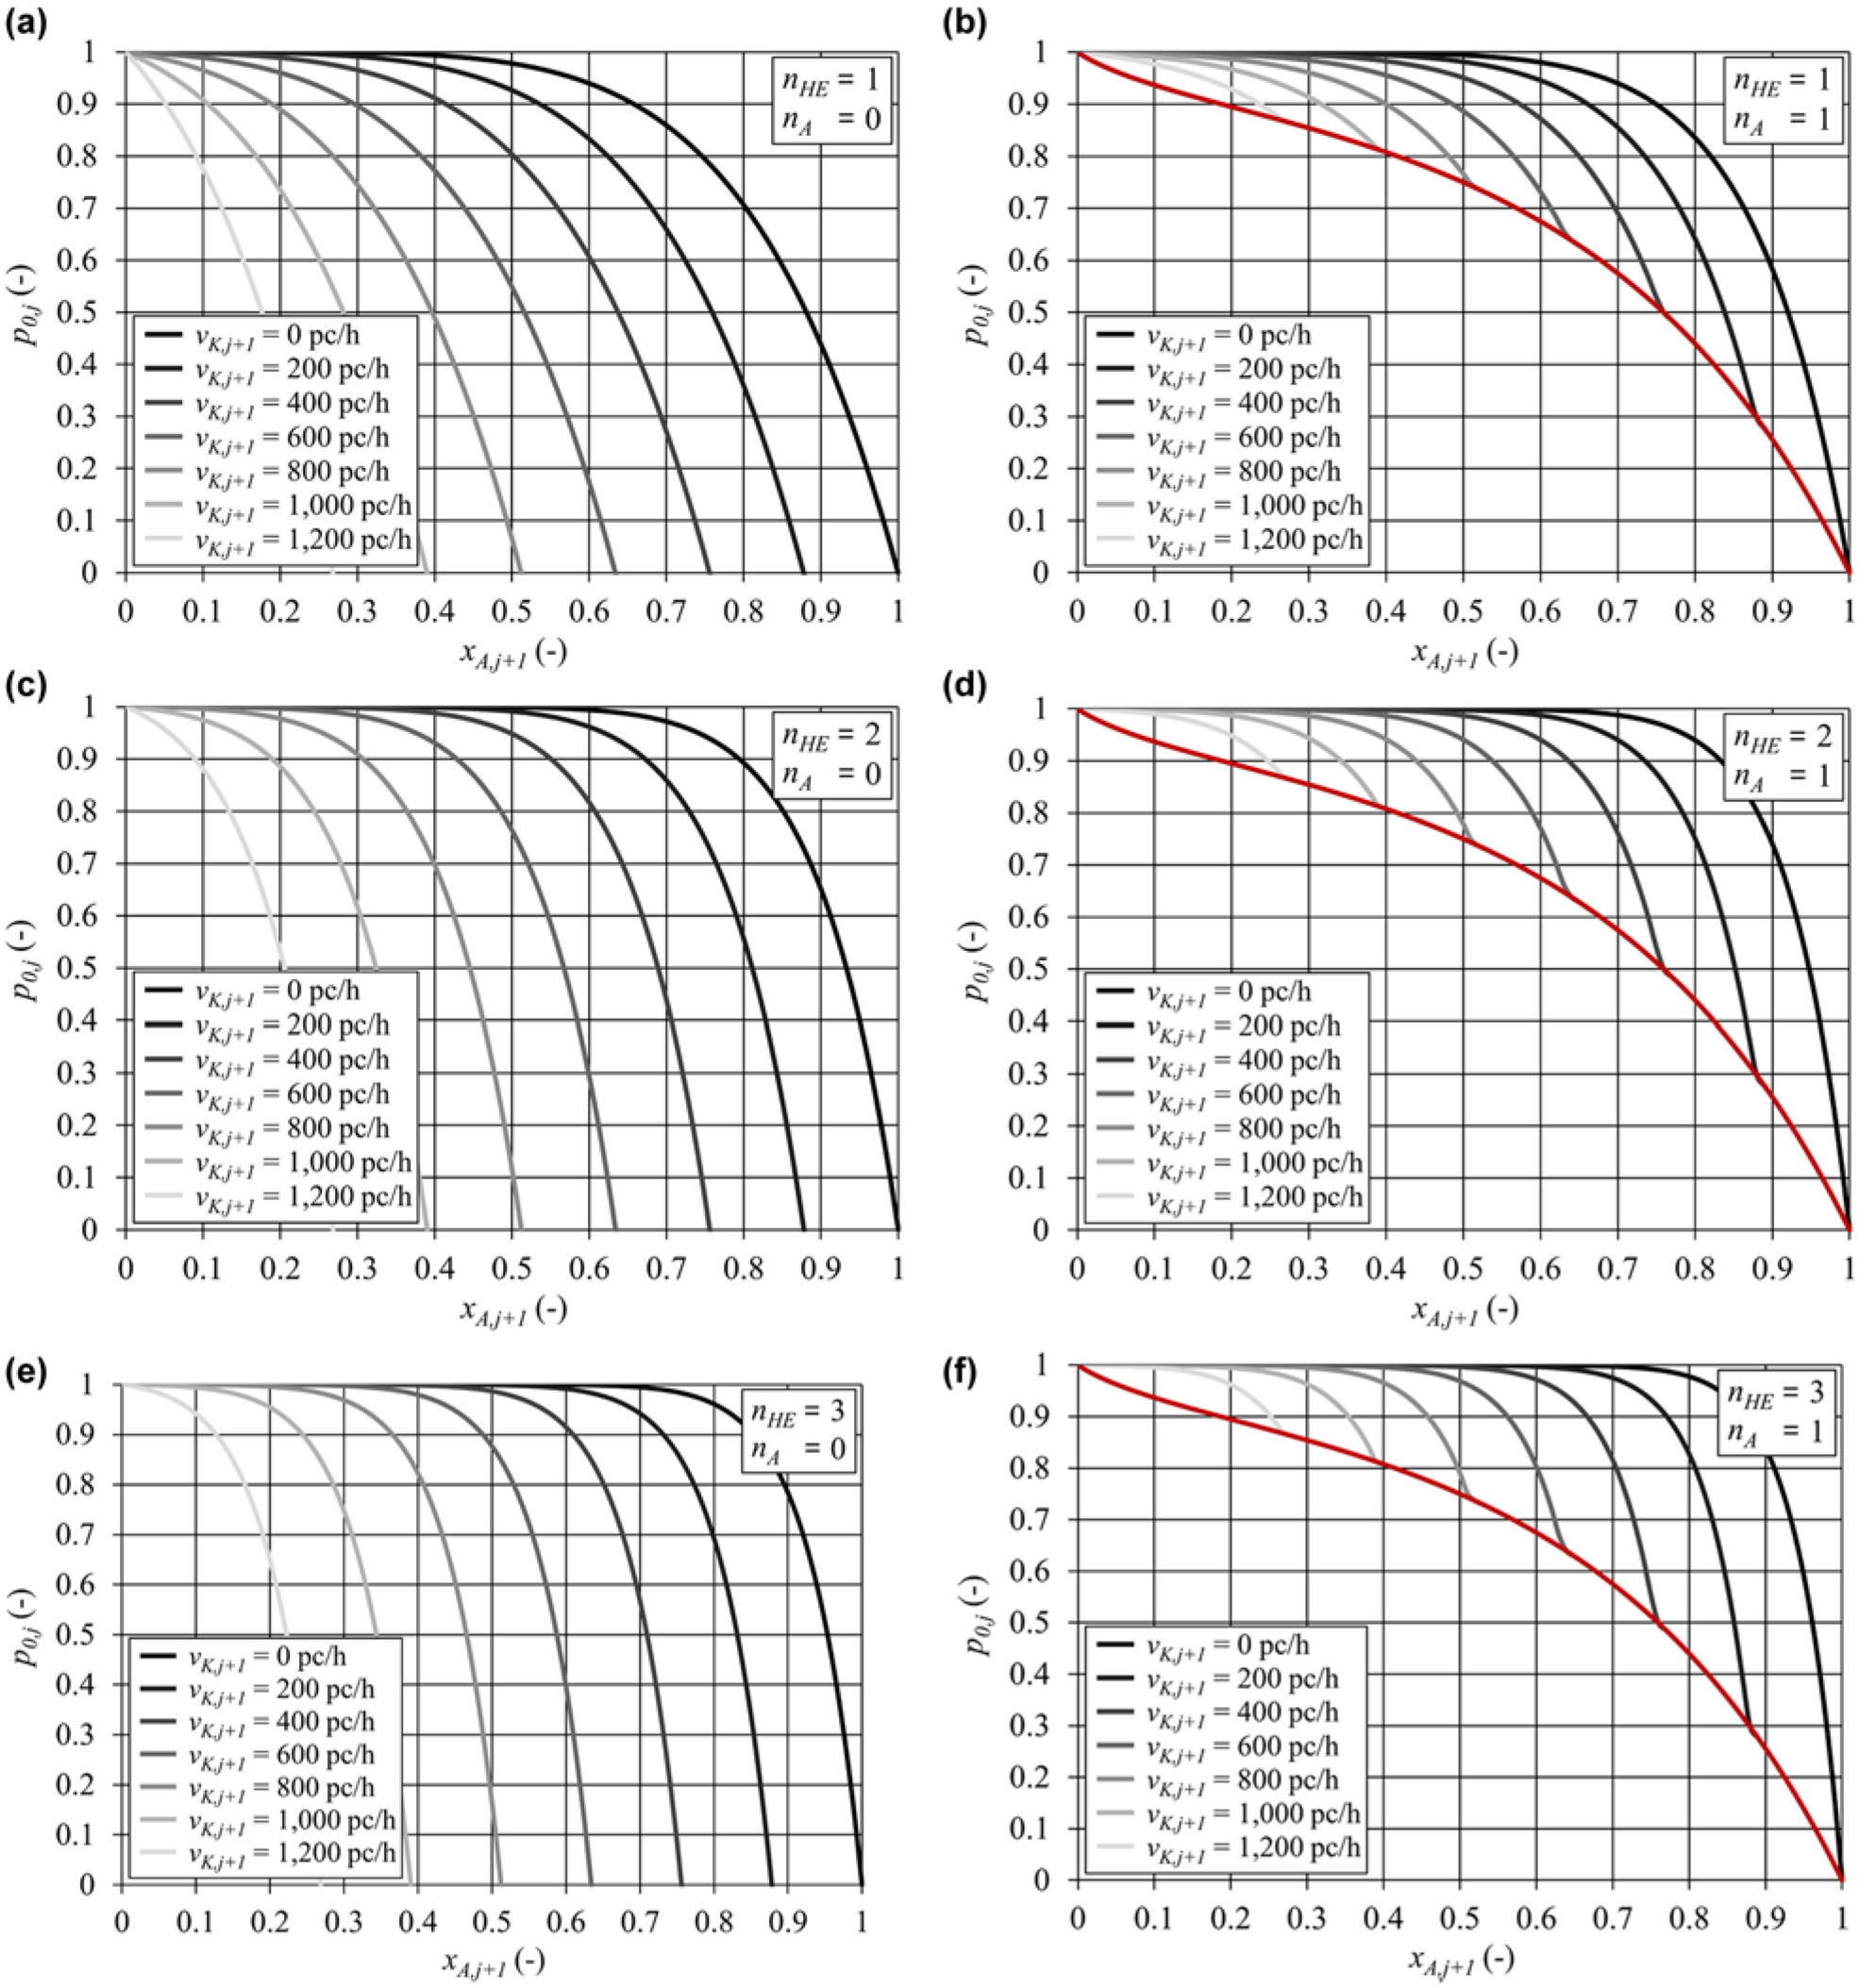
Illustration of p0,j according to Equation 18) with Dn,A according to Equation 7) and Dn,HE = 4.5 for nA = [0; 1] and nHE = [1; 2; 3].
Numerical Examples
To verify the calculation model and to demonstrate the calculated impact on the total roundabout performance, numerical examples are given. As a first example, a real-world roundabout is examined (Figure 8). It has an outer diameter of 30 m. To calculate the entry capacity, parameters were used in accordance with the proposed new version HBS ( 25 ). The extent and the course of the capacity function for single-lane roundabouts is very similar to the HCM ( 1 ) for conflicting volumes of 300 to 1,000 pc/h, which represent the most relevant range. However, in the proposed new version of the HBS ( 25 ), a proportion of the exiting volume fA is added to the conflicting volume vK on the circular roadway. A value of fA = 10% is recommended by a recent study ( 13 ) to consider the capacity reducing effect of some exiting vehicles. The entry capacity is calculated using Equation 19 which also considers p0,j derived by the proposed model in Equation 18. The capacity of the exit was estimated using Equation 3.
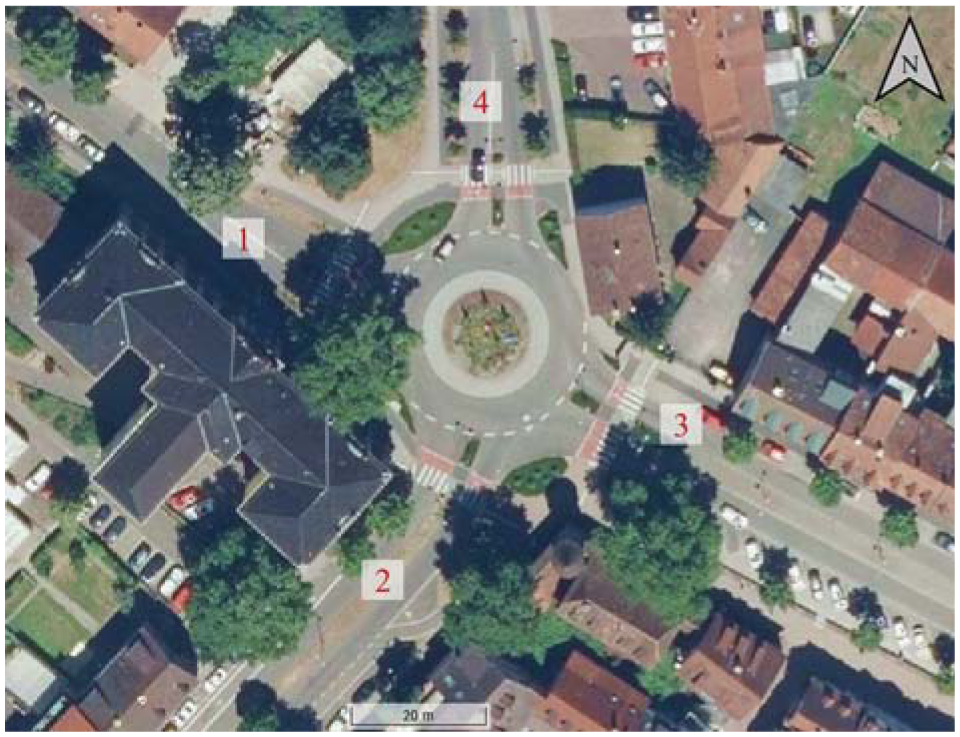
Example 1, a single-lane roundabout in Ettlingen, Germany.
For the analyzed roundabout the number of queuing slots between the circular roadway and the pedestrian crosswalks is nA = 1 at each exit. The number of spaces between exit and entry (nHE) was estimated according to the geometry of the roundabout. In general, the average distance between the front bumpers of two vehicles in a moving queue on the circular roadway can be considered to be approximately 8 to 10 m. It should be noted that to calculate the relevant geometric parameters nA and nHE, the trajectories of the vehicles must be used. The traffic demand (O-D matrix and pedestrians) in the afternoon peak hour was obtained by empirical observation at the roundabout. The volumes of vehicular traffic were counted in veh/h. For further calculation, the volumes are transferred to pc/h using a factor 1.1, which is the standard value in the German guideline ( 2 ). The volume of pedestrians was counted in every leg, including bicycles. The asymmetric design of the roundabout (nHE from 0 to 2) may induce different blockage effects caused by the downstream exits.
The input data for the geometric and traffic parameters as well as the result of the calculation with and without consideration of the queues on the circular roadway are summarized in Table 1. Each column represents a specific roundabout entry influenced by pedestrians crossing in the respective entry, the conflicting flow on the circular roadway at the entry, and the spillback from the next downstream exit. The delay d refers to the entering vehicles at that entry calculated with the HBS ( 25 ). It can be seen that entry 2 is strongly affected by the spillbacks from the downstream exit 3, resulting in p0,j = 0.84. The effects on the other entries are not that severe. Thus, for entry 2 a significant change in the volume-to-capacity ratio of entry x from 0.758 to 0.901 and thus of the average control delay d occurs from 18.6 s to 45.3 s.
Input Values and Results for Example 1
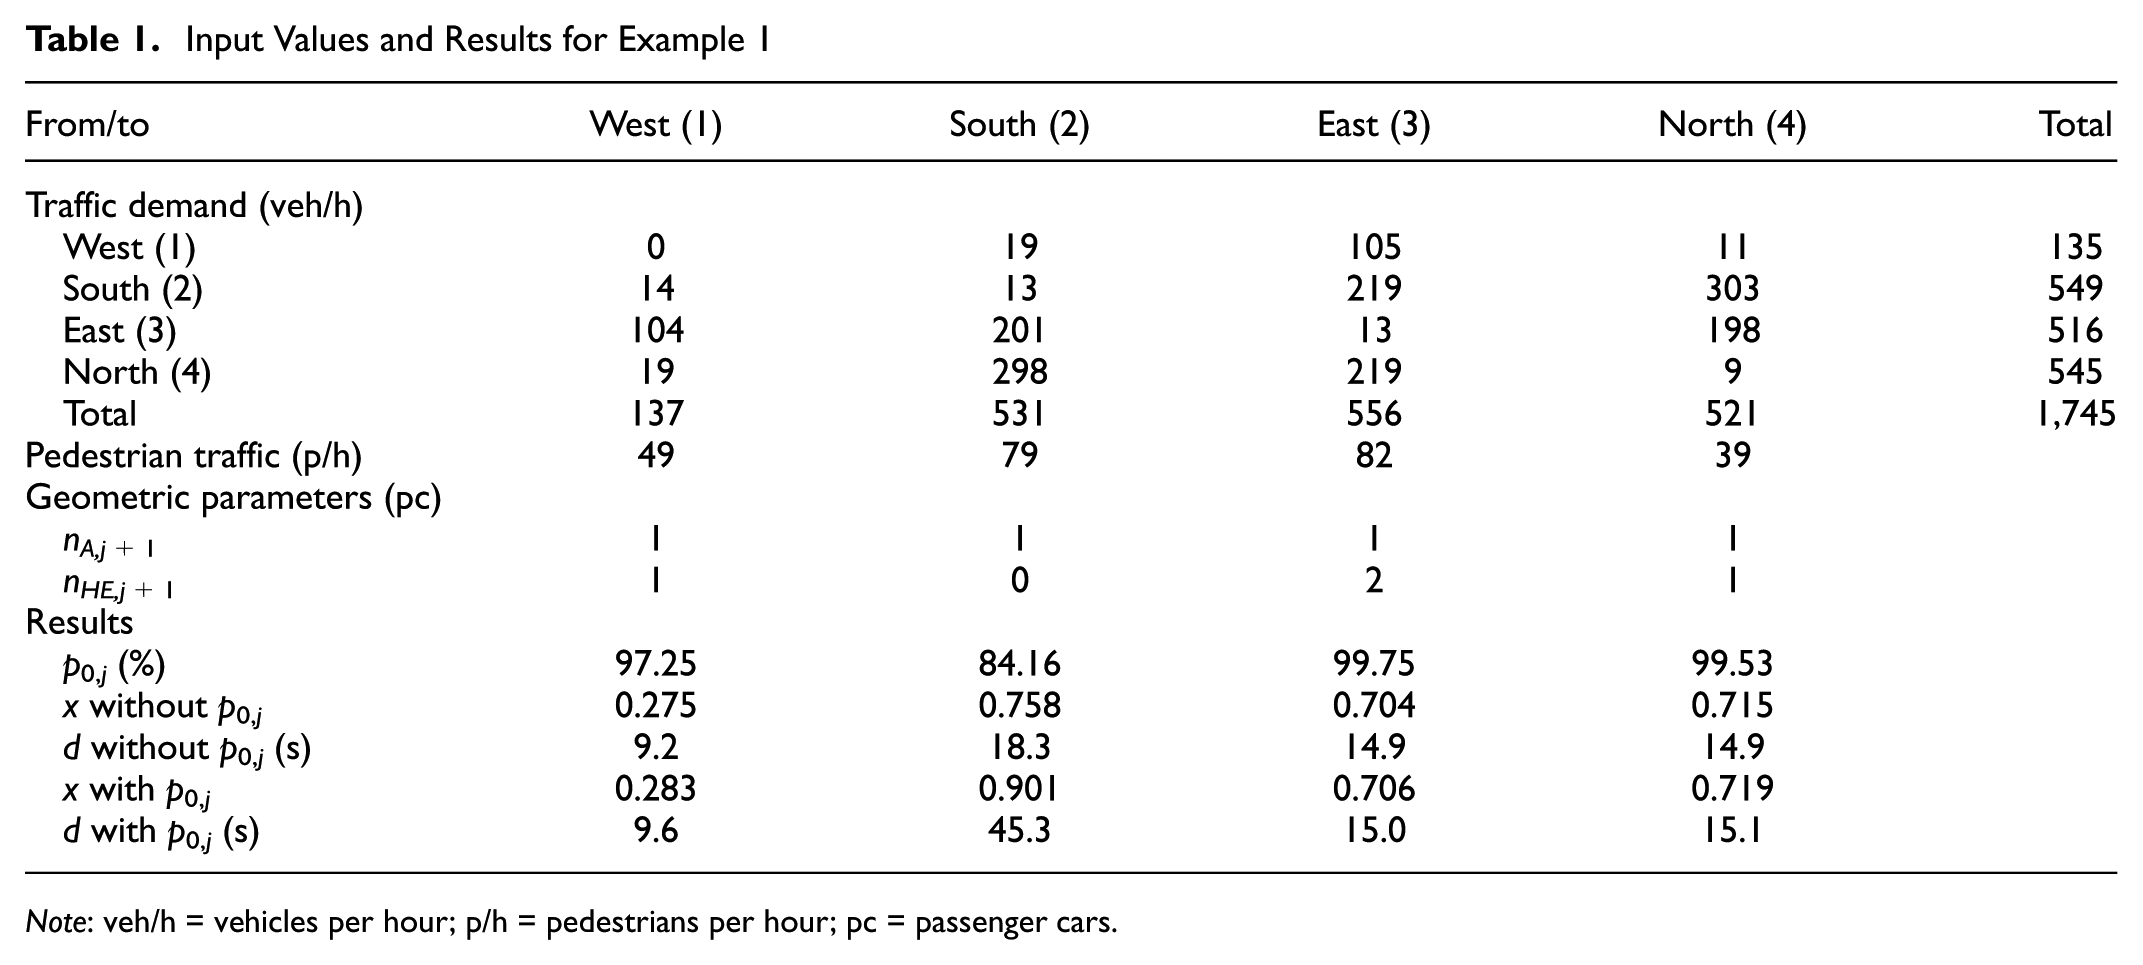
Note: veh/h = vehicles per hour; p/h = pedestrians per hour; pc = passenger cars.
The roundabout was near saturation in the observed period with considerable delay. Entry 2 was the most saturated of the subject entries during the observation period. During the observation, several spillbacks from exit 3 blocking entry 2 were recorded so that the calculation results are plausible. A detailed view of the results (Table 1) reveals that the quality-of-service of the roundabout without considering the blockage effect or without p0,j determined with the proposed HBS ( 23 ) is classified as good (LOS: B) with a maximum control delay d2 = 18.3 s. If the blockage effect caused by spillbacks from the downstream exits is taken into account with p0,j, the maximum control delay rises to d2 = 45.3 s, which corresponds with an insufficient quality-of-service (LOS: E). Thus, the effect of the spillbacks on the circular roadway is crucial for the evaluation of the traffic quality of this roundabout.
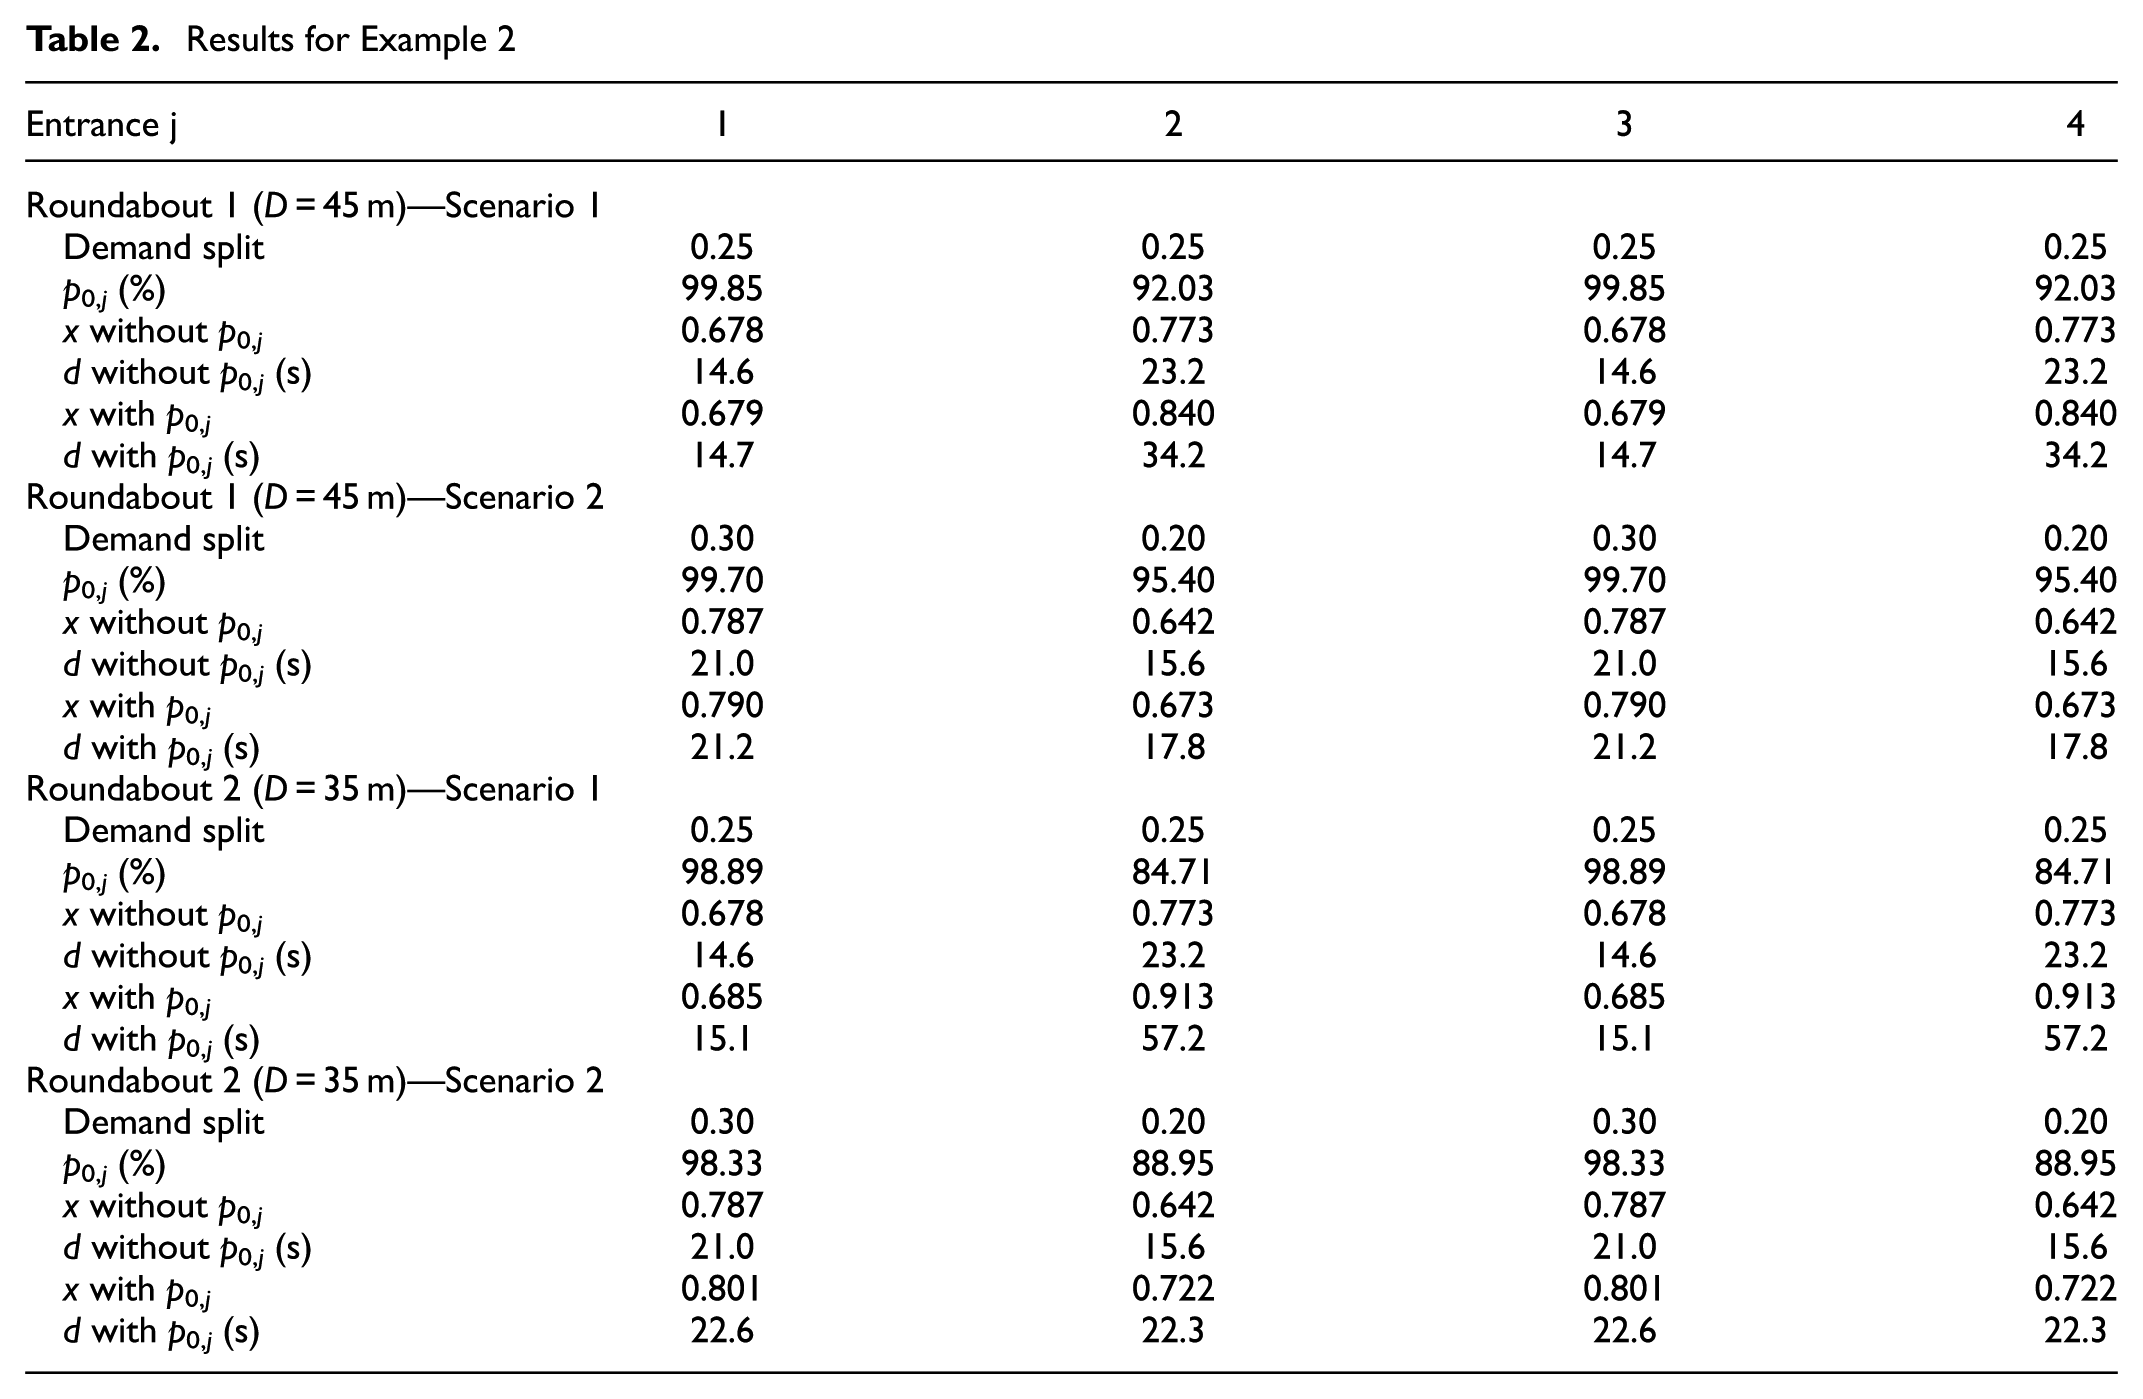
As a second example, we consider two fictional, symmetric, four-leg single-lane roundabouts with outer diameters D of 45 m and 35 m. The total traffic demand of the roundabouts is assumed to be vT = 2,050 pc/h. The movement split of the entries 1 and 3 is in each case set to right/through/left = 0.2/0.6/0.2 and for the entries 2 and 4 to 0.4/0.2/0.4. For the distribution of the total demand on the four entries, the two scenarios 0.25/0.25/0.25/0.25 and 0.3/0.2/0.3/0.2 are used. The volume of pedestrians is set to 200 p/h for each crosswalk. Each exit has one queuing slot between the crosswalk and the circular roadway (nA = 1). Depending on the size of the roundabouts the geometric parameter nHE for each leg is 2 for D = 45 m and 1 for D = 35 m. The capacities are calculated analogously to the first example with the proposed version of the HBS ( 23 ).
The results of the calculation are given in Table 2. It can be seen that the influence of queues forming from the downstream exits because of the temporal blockage by pedestrians has a huge impact for some scenarios. For the boundary conditions considered here, an even split of the traffic volume on the different movements of one entry results in an overall higher control delay. Also, the effect of the roundabout design on the traffic performance can be quantified directly. The impact of the queues on the circular roadway on the capacity is significantly lower for the bigger roundabout leading to a maximum control delay d2 of 34.2 s in scenario 1 for the first roundabout (D = 45 m) and of 57.2 s for the second roundabout (D = 35 m).
Results for Example 2
Conclusion
The influence of spillbacks on the circular roadway caused by crossing pedestrians in the exits on the capacity of an upstream entry can be crucial for the capacity and the traffic flow performance of a single-lane roundabout. This influence has so far been neglected by guidelines such as the HCM ( 1 ) or HBS ( 2 ). The extent of this influence on the one hand depends on the number of crossing pedestrians or the resulting capacity of the exits in combination with the exiting traffic volume and the traffic volume driving on the circular roadway. On the other hand, the influence is strongly dependent on the geometry of the roundabout such as the distance between the pedestrian crossing and the circular roadway and also the distance between the different legs. Based on queuing theory an analytical model was derived to account for this effect which can be incorporated into existing capacity calculation procedures in the guidelines. The theoretical model was validated by microscopic simulation showing a good agreement between the simulated and calculated capacity reductions as a result of the spillbacks on the circular roadway. A measurement at a real-world roundabout also verifies the proposed model. Thus, the model (Equation 18) is recommended to be applied in practice. It can be directly included into standardized quality-of-service procedures such as the HCM ( 1 ) or HBS ( 2 ). Also easy-to-use nomographs can be provided.
With the proposed procedure, the geometric dimensions of a roundabout become quantifiable with regards to their influence on capacity and quality-of-service. For example, the influence of the size of a roundabout, of the distance of the crosswalk to the circular roadway or of an asymmetric roundabout design can now be directly evaluated with the derived model in an early planning stage. For practical application, the values for nA and nHE must be obtained from the geometry of the roundabout. Even deviations of size “1” have a very huge impact on the overall results so that incorrect inputs must be avoided in any case. In practice, this can lead to a lack of clarity, also because the definition of these parameters is difficult to formulate and to grasp or understand.
It has to be noted that the model considers only the effect of spillbacks on the next upstream entry. However, for practical purposes, this does not provide a restriction since for situations where spillbacks regularly extend longer than the next upstream entry, the reduced capacity of this entry would cause an insufficient LOS or even an oversaturation.
The effect of heavy vehicles was not analyzed in detail and is considered by using vehicle traffic volumes, such as pc/h, to make a practical approximation. In future, it might be desirable to refine the model to account for dynamic effects of increasing and decreasing queues during blocked and unblocked periods at the diverge point. However, it is expected that these effects are only of minor magnitude. Moreover, the derived model is only suitable for single-lane roundabouts. A two-lane roundabout is less susceptible to a spillback from an exit onto the circular roadway, because exiting vehicles queuing on the right side of the circle may be passed by through traffic. In future, it would be desirable to give an answer to this as well. However, this problem does not seem to be accessible for theoretical models. Instead, empirical studies or simulations will be a suitable source of information in this case.
Footnotes
Author Contributions
The authors confirm contribution to the paper as follows: study conception and design: W. Brilon, N. Wu, J. Schmitz; data collection: W. Brilon, J. Schmitz; analysis and interpretation of results: W. Brilon, N. Wu, J. Schmitz; draft manuscript preparation: W. Brilon, N. Wu, J. Schmitz. All authors reviewed the results and approved the final version of the manuscript.
Declaration of Conflicting Interests
The authors declared no potential conflicts of interest with respect to the research, authorship, and/or publication of this article.
Funding
The authors received no financial support for the research, authorship, and/or publication of this article.