
Abstract
The primary objective of this study is to assess the impact of various inert and active fillers, along with their physicochemical properties, on the laboratory performance of asphalt mixtures. To achieve this objective, various fillers, including active fillers derived from industrial wastes, are sampled, processed, and evaluated. Two state-approved asphalt mixes, a stone matrix asphalt (SMA) and a surface mixture, were selected. For each selected filler, the study characterizes its physical and chemical properties and its influence on the mixture’s laboratory performance against major distresses, specifically, rutting, durability, moisture resistance, and cracking. Results indicate an acceptable correlation between the physical and chemical characteristics of the fillers and the performance of the mixes prepared with these different filler materials. Concerning laboratory-mixed performance, mixes containing industrial fillers, particularly fly ash and steel slag, exhibit better rutting and cracking performance than the control mixes for SMA and surface mixes. In relation to durability, the control mix and steel slag appear to enhance the durability of the surface mixtures. SMA, on the other hand, consistently demonstrates robust performance across filler types. For moisture-damage resistance, the tensile-strength ratio is higher for the different industrial filler materials, especially fly ash and steel slag, than for the control filler. In summary, this study recommends using fly ash and steel slag powder as replacements for mineral fillers in asphalt mixtures. These industrial waste-derived fillers are found to outperform conventional fillers while allowing the reuse of industrial waste in the road infrastructure.
Introduction
An asphalt mixture consists of two main components: the asphalt binder and the aggregate structure. Within the aggregate blend, mineral filler refers to particles smaller than 200 µm ( 1 ). Fillers serve multiple functions: they fill voids in the aggregate skeleton, enhancing the mixture’s density, stability, and toughness; and they contribute to the formation of asphalt mastic, which coats coarser aggregate particles and suspends fine dust in a colloidal matrix ( 2 ).
Research has shown that filler properties significantly affect mixture performance, particularly in resisting cracking and rutting ( 3 ). Therefore, selecting a suitable filler is essential for achieving performance goals such as improved cracking resistance, rutting resistance, and optimal voids in mineral aggregate. The interaction between filler and binder is complex and crucial for optimizing mixture performance and improving pavement durability ( 4 ). Depending on their physical and chemical characteristics, fillers may act either as extenders or stiffeners. These interactions result in the formation of filler-binder mastic, a composite material that plays a key role in the mechanical characteristics and performance of hot-mix asphalt (HMA). Finer fillers, in particular, tend to stiffen the binder, creating a more cohesive matrix that effectively binds aggregate particles and enhances the overall strength and durability of the mixture ( 1 , 5 ). Mastic properties are also significantly influenced by filler characteristics, including particle shape, size, gradation, specific surface area, and density.
In general, two main categories of fillers have been used in asphalt mixtures: inert fillers, which originate from natural aggregate sources, and active (manufactured) fillers, which are reactive with the asphalt binder. It has been reported that the addition of active fillers can positively improve the rutting, moisture, and fatigue resistance of asphalt mixtures ( 4 ). Active fillers are commonly sourced from industrial byproducts such as hydrated lime, steel slag powder, fly ash, and kiln dust. These fillers can also contribute to waste management and environmental sustainability by repurposing industrial and agricultural byproducts.
As new and alternative fillers, including industrial byproducts and agricultural wastes, are increasingly introduced into asphalt mixtures, a comprehensive understanding of their influence on mixture performance becomes increasingly important. These fillers vary widely in relation to chemical composition, physical structure, and surface characteristics, all of which can affect key performance indicators such as stiffness, workability, moisture susceptibility, and long-term durability. Therefore, laboratory evaluation and performance-based testing are necessary to identify the most suitable fillers and ensure their reliable incorporation into HMA across various climatic and traffic conditions.
Objectives and Scope
The main objective of this study was to evaluate the effects of various inert and active fillers, along with their physicochemical properties, on the laboratory performance of asphalt mixtures. To achieve this objective, various fillers, including active fillers derived from industrial wastes, were sampled, processed, and evaluated. For each selected filler, the study characterized its physical and chemical properties and its influence on the mixture’s laboratory performance against major distresses (i.e., rutting, durability, moisture resistance, and cracking).
Background
Types of Fillers
Different types of fillers may be used in the production of asphalt mixtures. Selecting an appropriate filler to achieve the desired performance is important. The following sections provide an overview of the main types of fillers evaluated in asphalt mixtures.
Inert Fillers
Inert fillers, typically derived from natural mineral sources such as limestone dust, granite fines, or basalt powder, are commonly used in HMA to enhance the mixture’s physical structure without chemically interacting with the asphalt binder. These fillers primarily serve to fill voids within the aggregate skeleton, improve the packing density, and contribute to the development of asphalt mastic, thereby enhancing the overall stiffness and durability of the mixture ( 5 ). Unlike active fillers, inert fillers do not participate in pozzolanic or chemical reactions with the binder, making them more predictable and stable under typical field conditions ( 6 ). The performance of inert fillers largely depends on their physical properties, such as particle size distribution, shape, and specific surface area. Finer inert fillers tend to increase the viscosity of the mastic and improve resistance to permanent deformation, provided the filler content remains within an optimal range ( 7 ). Despite their limited reactivity, inert fillers can play a vital role in improving workability, moisture resistance, and mix cohesion when properly selected and dosed ( 8 ).
Active Fillers
Active fillers are finely processed mineral materials that chemically interact with the asphalt binder to enhance the performance of HMA. Unlike inert fillers, active fillers such as hydrated lime, cement kiln dust, and fly ash exhibit pozzolanic or alkaline properties that improve adhesion between the binder and aggregate and increase resistance to moisture damage and aging ( 9 ). Hydrated lime, in particular, has been widely recognized for its ability to neutralize acidic components in asphalt and reduce susceptibility to stripping ( 10 ). It is worth noting that hydrated lime can either be used as a slurry by mixing it with water or as a dry blend with the asphalt binder. The slurry is then mixed with the remaining dry aggregate to ensure a thorough, even coating.
Active fillers can also stiffen the asphalt mastic and reduce its susceptibility to rutting by influencing its viscoelastic behavior ( 11 ). Their effectiveness is influenced by factors such as chemical composition, fineness, and surface area. In addition to improving mechanical performance, the incorporation of industrial byproduct fillers, such as fly ash and slag dust, also supports sustainability by recycling waste materials into road construction ( 12 ). Thus, the use of active fillers represents a beneficial approach to improving pavement durability while addressing environmental concerns.
Effects of Fillers on Asphalt Mixture Performance
The incorporation of mineral fillers into asphalt mixtures significantly influences the mechanical properties and performance of HMA. Mineral fillers enhance the mixture’s stability, stiffness, and resistance to deformation by filling voids and interacting with the asphalt binder. The specific characteristics of the fillers, including particle shape, texture, and gradation, also play an important role in the performance of the asphalt mixture. Proper selection and proportioning of fillers are essential to achieving the desired performance outcomes in asphalt mixtures ( 5 ).
Rutting Performance
Fillers significantly influence the rutting performance of asphalt mixtures by altering the viscosity and stiffness of the asphalt mastic. By increasing mixture stiffness, fillers reduce their susceptibility to rutting. Research studies indicate that higher filler content improves rutting resistance ( 13 ). However, the optimal filler-to-asphalt ratio is critical for achieving the desirable rutting performance. Excessive filler content may result in a mixture that is too stiff and brittle, while insufficient filler may result in a soft mixture susceptible to rutting. Superpave guidelines suggest a maximum filler-to-asphalt weight ratio of 1:2 to balance these effects ( 14 ). There is an optimal filler content beyond which rutting resistance declines because of excessive brittleness ( 15 ). Studies also show that mixtures containing high percentages of mineral fillers, such as crushed granite, exhibit lower permanent strain accumulation than those with natural sands ( 16 ). In addition, increasing the mineral filler content from 4% to 12% significantly reduced the accumulated permanent strain, demonstrating enhanced rutting resistance.
The type of filler also plays a significant role in the mixture’s rutting resistance. When used as a slurry, mixtures with hydrated lime show a substantial reduction in rut depth compared with those with conventional fillers such as silica or sand. This is because of the improved adhesion and mechanical interlock of hydrated lime particles.
Fatigue Cracking Performance
The presence and characteristics of fillers significantly influence an asphalt mixture’s ability to dissipate energy without fracturing, directly affecting its fatigue resistance. High filler content can increase the stiffness of the asphalt mixture, potentially reducing its ability to dissipate energy and increasing its susceptibility to fatigue cracking. However, maintaining the proper balance of filler content can mitigate this effect ( 14 ). The type of filler also plays a critical role in the fatigue performance of the mix; fillers such as hydrated lime not only improve stiffness but also enhance the adhesive properties between the asphalt binder and aggregate, thereby improving the mix’s resistance to fatigue cracking ( 17 ). The particle size distribution and specific surface area of the fillers are also critical: fines passing the 0.075-mm sieve (P200 material) significantly affect the mixture’s fatigue performance. Properly characterized fillers, using tests such as Rigden voids (RVs) and methylene blue value, ensure adequate fatigue resistance ( 18 ).
Thermal Cracking Performance
Thermal cracking in asphalt mixtures primarily occurs at low temperatures and during significant temperature fluctuations. As asphalt cools, it contracts; if the tensile stresses induced by this contraction exceed the material’s tensile strength, cracks develop. The filler in the mixture significantly influences its resistance to thermal cracking by enhancing its thermal stability and flexibility. Fillers such as limestone dust and hydrated lime improve low-temperature cracking resistance by enhancing the flexibility and toughness of the asphalt mixture ( 10 ). These fillers improve thermal cracking resistance by increasing the mastic’s tensile strength and reducing its coefficient of thermal contraction ( 10 ).
The interaction between the filler and modified asphalt binder, such as polymer-modified binders, also plays a critical role. Fillers help reduce the binder’s thermal susceptibility, thereby improving its resistance to thermal cracking ( 19 ). Fillers that improve the binder’s relaxation properties at low temperatures help reduce thermal cracking. Dynamic shear rheometer and bending beam rheometer tests demonstrate this improvement, highlighting the importance of fillers such as hydrated lime and limestone dust in preventing binder brittleness ( 14 ).
Moisture Damage Resistance
Fillers play a critical role in enhancing the moisture resistance of asphalt mixtures by improving binder–aggregate adhesion and reducing the susceptibility to stripping. Conventional fillers, such as hydrated lime, are particularly effective because their alkaline nature promotes strong chemical bonding with the binder, thereby significantly improving resistance to moisture-induced damage ( 10 ). Even limestone dust, though less reactive, provides modest improvements by densifying the mastic structure ( 12 ). Among alternative fillers, fly ash and steel slag powder have shown promise because of their mineral composition and surface properties, which help resist moisture intrusion ( 20 , 21 ). In addition, nano-silica improves moisture resistance by refining the mastic structure and reducing micro voids, while biochar provides a moderate enhancement through increased stiffness and hydrophobicity ( 21 , 22 ).
Materials and Methods
To achieve the objectives of the study, eight different mixes were fabricated in the laboratory. Two mixes with inert fillers, approved by the Louisiana Department of Transportation and Development (DOTD), were chosen as the control mixes. The remaining six mixtures were prepared by adding three fillers (cement, fly ash, and ground steel slag) as a replacement for the inert fillers specified in the Job Mix Formula (JMF). A series of laboratory tests was then conducted on the fillers and on each mix to characterize their physicochemical properties and to evaluate their performance.
Materials
The control mixes consisted of a stone matrix asphalt (SMA) and a surface mixture. These mixes are currently utilized in road construction projects across Louisiana. The SMA mixture included four aggregate types: Pine Bluff 78, Vulcan 78 sandstone, Vulcan 89 sandstone, and DonnaFill (CM1), a granite fine with 39.6% passing No. 200. The mix design specified the following proportions: 30% Pine Bluff 78, 30% Vulcan 78 sandstone, 22% Vulcan 89 sandstone, and 18% DonnaFill. A polymer-modified asphalt binder, PG 76-22, was incorporated at 6.2% by weight of the total mix. In addition, Evotherm was added to the PG 76-22 binder at 0.6% by weight to serve as an antistripping agent, enhancing the mixture’s resistance to moisture damage.
The surface mixture consisted of four aggregate types: Vulcan #78, Vulcan #11, sand aggregate #10, and reclaimed asphalt pavement (RAP). The mix design included 36.3% Vulcan #78, 29.7% Vulcan #11, 15% sand aggregate #10, and 19% RAP by weight. The asphalt binder used in the mixture was unmodified PG 67-22, incorporated at 3.5% by weight of the total mix, with 1% of the total asphalt binder content contributed by the RAP material. The filler material in the surface mixture is referred to as CM2 in this manuscript. Perma-Tac 99 Nouryon, a cationic surfactant, was added to the asphalt binder at 0.7% by weight to serve as an antistripping agent, enhancing resistance to moisture damage. In addition, it functioned as a rejuvenator for the binder extracted from the RAP.
In this study, different types of fillers were evaluated by replacing the passing No. 200 (filler size) sieve material within the aggregate structure. The filler types evaluated in this study were ordinary Portland cement, fly ash, and steel slag powder. It is noted that hydrated lime (as a dry filler), crumb rubber, ground recycled waste plastic, and rice husk ash were also evaluated as a replacement for the filler, but were found unsuitable as a dry filler in the mixture. These fillers were observed to significantly dry the mixture during preparation and to reduce its workability because of their high binder absorption. While an increase in binder content could have helped solve this issue, it would have made the mixtures incomparable to the control mixes.
Physical and Chemical Characteristics of Fillers
The physical and chemical properties of the selected fillers were evaluated. To gain a comprehensive understanding of filler characteristics, several properties were measured, including RVs, particle size distribution, bitumen bond strength, scanning electron microscopy-energy dispersive X-ray spectroscopy (SEM-EDS), and X-ray fluorescence (XRF). An overview of these test methods is provided in this section.
Rigden Void Test
The test measures the void content in the filler by compacting dry fillers into a mold of a specified size. Fractional voids for the fillers were determined in accordance with the European Standard EN 1097-4 ( 23 ). For each filler material, three test specimens were prepared. A minimum mass of 150 g of each filler material was sampled and oven-dried at 110ºC to a constant mass. Ten grams of the filler material were then obtained and evenly spread inside the cylinder of the dropping block. The dropping block was then raised to the upper stop and allowed to fall freely to the base. This process was repeated 100 times at approximately 1-second intervals to compact the filler material. At the end of the compaction process, the void percentage was calculated using

where
m = mass of the compacted filler, in grams;
α = Inner diameter of the dropping block cylinder, in millimeters;
ρt = Particle density of the filler, milligram per cubic millimeter; and
h = height of the compressed filler, in millimeters.
The filler material void percentage was calculated as the mean of the three specimens and used in the analysis.
Bitumen Bond Strength
The effect of filler materials on the mastic adhesive strength was assessed using the bitumen bond strength test, conducted in accordance with ASTM D4541. A pneumatic adhesion tensile testing instrument was used to measure the bond strength of the mastic, as shown in Figure 1. The sample’s bond strength was measured by pulling the stub at a loading rate of 150 pounds per square inch per second (psi/s). The pull-off tensile strength (POTS) was calculated

where
POTS = pull-off tensile strength (psi);
BP = burst pressure (psi);
Ag = gasket and piston plate contact area = 2.009 in.2 for F-2 piston;
C = piston Constant = 0.1775 lb ± 1.5% for F-2 piston; and
Aps = area of pull stub = 0.1963 in.2 for ½-in. diameter pull-stub.
The loss of bond strength percentage because of wet conditioning was calculated based on the pull-off tensile under dry and wet conditions as follows:

For test specimen preparation, a 6-in. (length) by 6-in. (width) by 1.5-in. (thickness) aggregate block was cut from a larger block sourced from the quarry. The aggregate substrates were selected with relatively flat faces to minimize curvature effects. The block was then carefully cleaned using deionized water to ensure uniform roughness. Next, the aggregate block was placed in an oven at 60°C for 1 h to remove any moisture. To prepare the mastic sample, filler and asphalt binder (PG 76-22 or PG 67-22) were mixed at a 0.8:0.2 mass ratio. Then, the mastic and the pull of the stub were maintained at 163°C and 60°C, respectively. Once the mastic sample had reached adequate fluidity, 0.40 ± 0.05 g of the blend was poured into an 8-in. diameter and 2-in. height circular dynamic shear rheometer silicone mold. The mastic sample was then removed from the mold and placed onto the pull stub, which was subsequently pressed vertically. The sample was allowed to settle at 25°C for 24 h before testing.
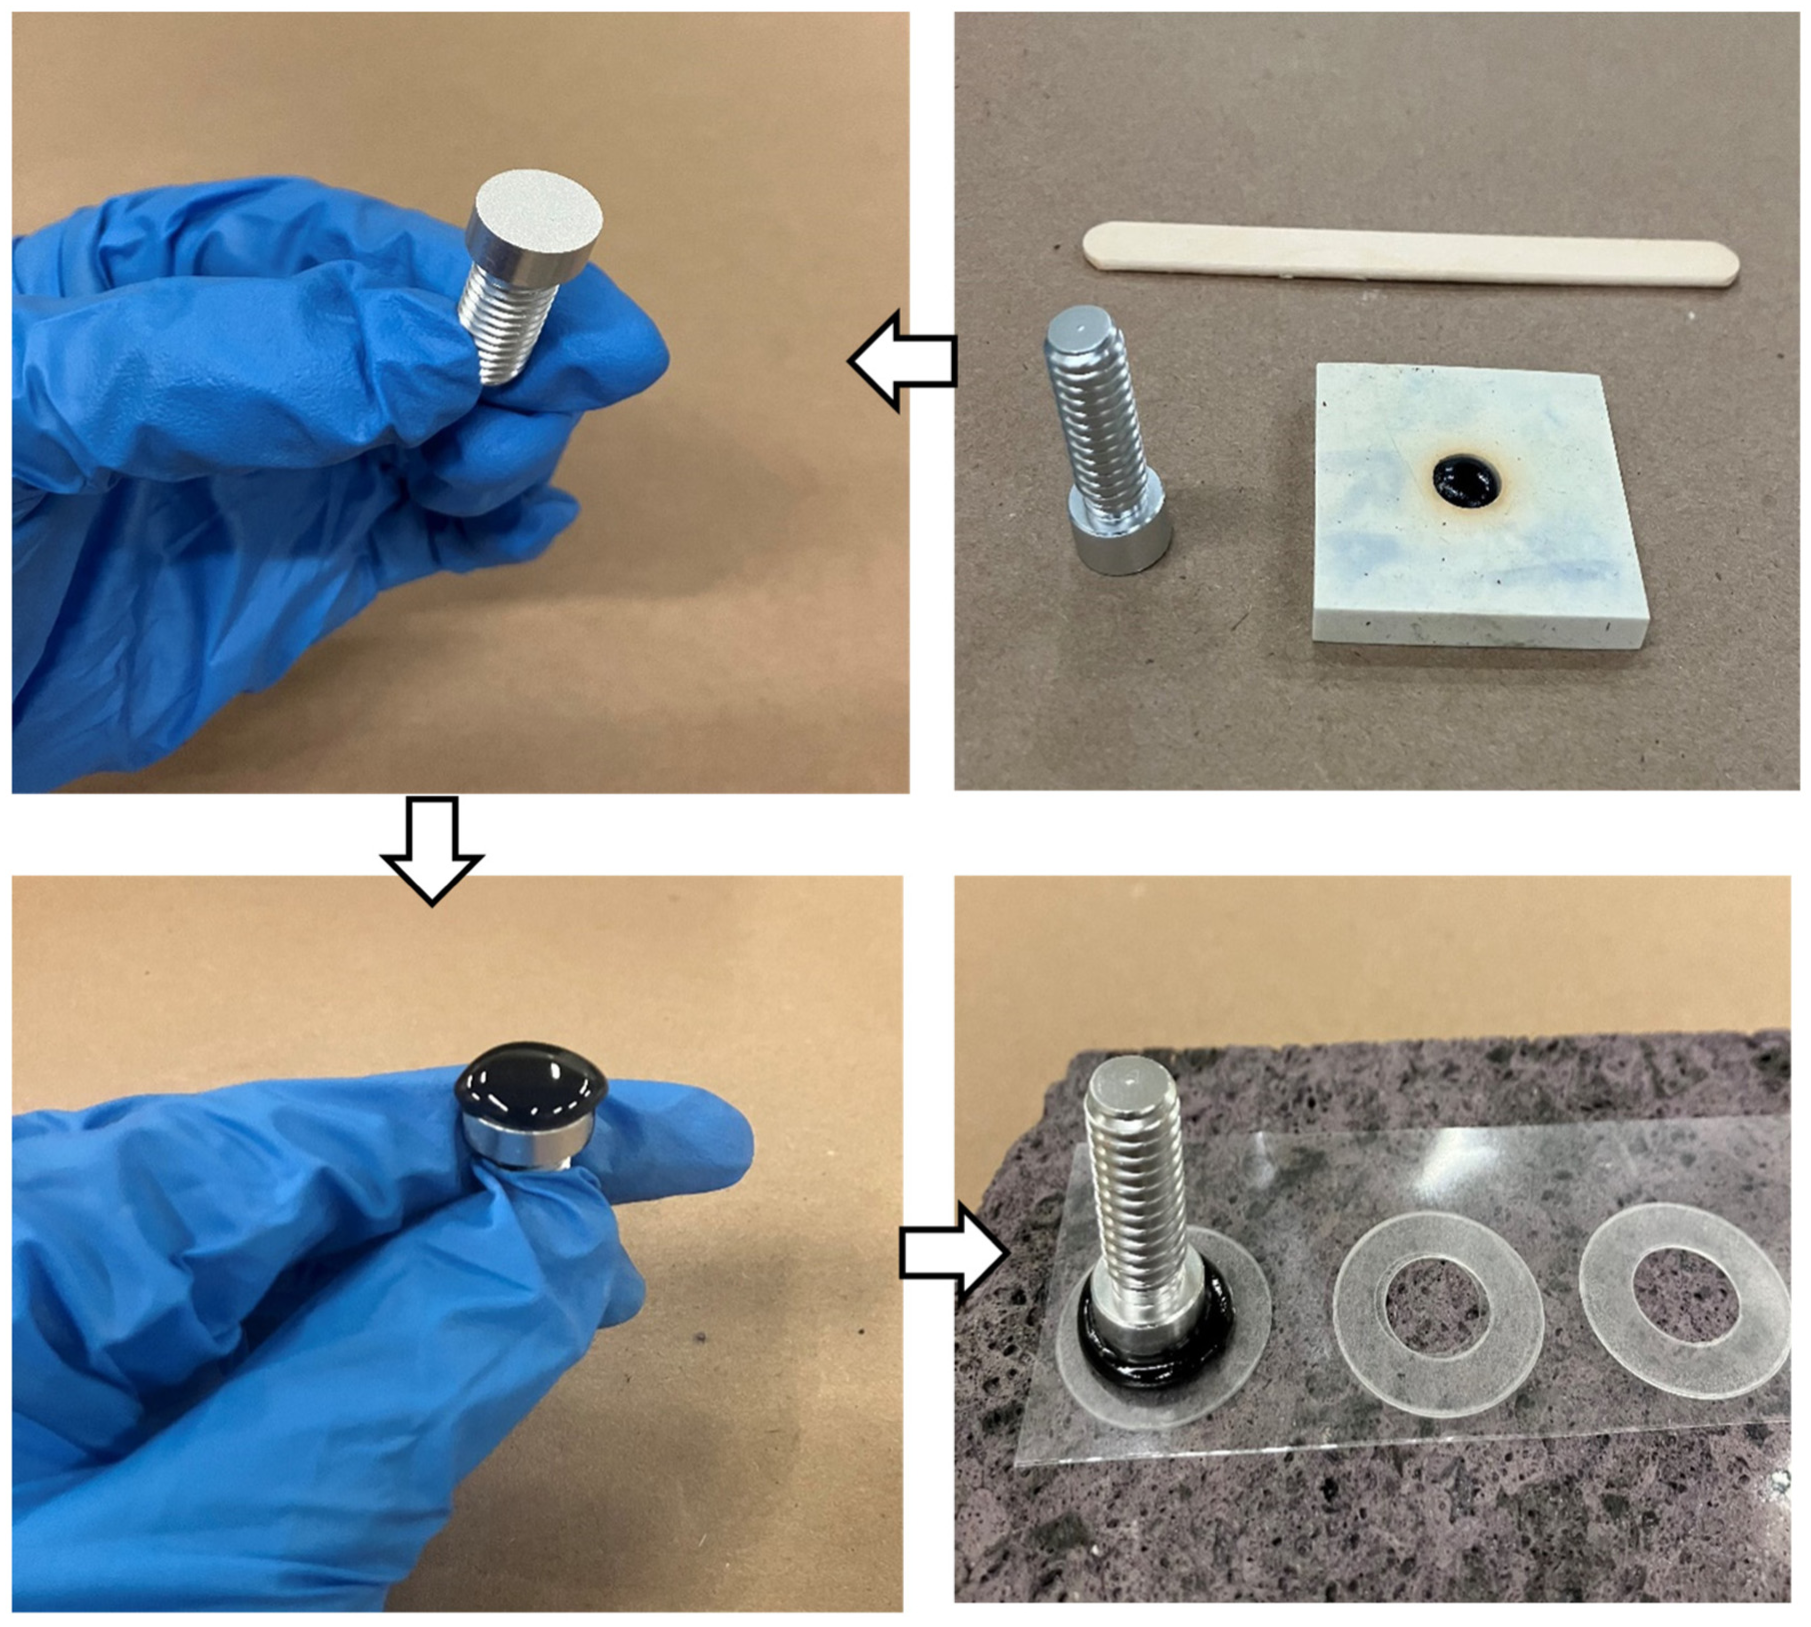
Illustration of the bitumen bond strength test.
For the wet conditioning test, samples were first conditioned at 25°C for 1 h. Subsequently, each sample was submerged in distilled water at 40°C for 24 h. Afterward, the sample was removed from the water bath and kept at 25°C for approximately 1 h. Finally, the sample was tested following the same procedure as the dry samples.
Particle Size Distribution and Fineness Modulus Using Laser Diffraction
Particle size analysis of the selected fillers was conducted using dynamic light scattering with a Microtrac S3500 and Zetatrac instrument, which includes a laser light source, a detector, and a sample cell. Initially, the samples were dispersed in water to remove air bubbles. The dispersed samples were then loaded into the sample cell, and the temperature was controlled for stability. The ultrasonic feature was activated to disperse the particles effectively before the analysis. Following this, the laser beam was directed at the samples, causing them to emit scattered light, which was detected by the instrument. The instrument subsequently analyzed the intensity variations in the scattered light, influenced by the Brownian motion of the particles. The data were then presented with relevant graphical representations of the size distribution and statistical parameters.
At least three tests were conducted for each sample, and the average was calculated to ensure measurement repeatability. In addition, other parameters, including D10, D30, D50, and D60 (corresponding to 10%, 30%, 50%, and 60% passing of the material, respectively), and fineness modulus, were calculated from the particle size distribution data (Equation 4). The fineness modulus quantifies the relative fineness of the filler material. In the case of P200 material, this modulus is derived by summing the percentages of particles exceeding 75, 50, 30, 20, 10, 5, 3, and 1 µm in size, and then dividing this sum by 100. It should be noted that a smaller fineness modulus signifies a higher degree of fineness for the filler material.

where
FM = fineness modulus; and
P exceeding (75, 50, 30, 20, 10, 5, 3, 1) = percentages of particles exceeding 75, 50, 30, 20, 10, 5, 3, and 1 µm in size.
Scanning Electron Microscopy-Energy Dispersive X-Ray Spectroscopy
A Quanta™ 3D Dual Beam™ FEG FIB-SEM, equipped with EDAX Pegasus EDS/EBSD detectors, was used to evaluate the filler materials’ morphology and chemical composition. The morphology of the different fillers was investigated by SEM imaging, while their chemical composition was determined by EDS and XRF. For EDS spectra collection, a current of 4pA and an accelerating voltage of 20 kV were utilized with area mode.
X-Ray Fluorescence
The chemical elemental compositions of the fillers were evaluated using an Epsilon 3XLE, an XRF spectrometer that employs energy-dispersive X-ray fluorescence (EDXRF) for elemental analysis. The system operates at 50 kV and up to 3 mA, with a silver anode X-ray tube and a silicon drift detector capable of detecting elements ranging from sodium (Na) to uranium (U) with detection limits in the ppm range.
Performance Evaluation of Asphalt Mixtures
Cantabro Loss Test
The Cantabro abrasion test was conducted according to AASHTO T 401, Standard Method of Test for Cantabro Abrasion Loss of Asphalt Mixture Specimen. In this test, Superpave gyratory compacted specimens were weighed to the nearest 0.1 g. Then, the Los Angeles abrasion test was run on the specimen without steel balls. For 10 min, the apparatus runs at a speed of 30 to 33 revolutions per minute at a temperature of 25oC. Afterward, the test specimen is removed and its final weight is measured to the nearest 0.1 g. The Cantabro loss value is then calculated as

where
Wini = initial weight; and
Wfinal = final weight.
While the Cantabro loss test has been widely used with open-grade mixes, results have shown that this test is also useful to assess the abrasion and durability of dense-graded mixes ( 24 ). Although no widely recognized limit was found in the literature for dense-graded mixes, a maximum of 20% Cantabro loss for unaged samples was assumed in the analysis.
Hamburg Wheel-Tracking Test
To evaluate the rutting resistance of mixtures containing different fillers, the Hamburg wheel-tracking test (HWTT) was conducted following AASHTO T 324, Hamburg Wheel-Track Testing of Compacted Hot Mix Asphalt (HMA) ( 25 ). In this test, specimens were loaded with two steel wheels that repeatedly moved back and forth at a speed of 1.1 ft/s (0.305 m/s), with approximately 50±2 passes per minute. Testing began after the specimens had been submerged in 50°C water for 30 min and continued while submerged until the test was concluded. For this study, four test specimens were prepared for each mix type at a target air void content of 7.0±0.5%. Testing was stopped when specimens either reached 20,000 passes or exhibited a deformation of 12.5 mm, whichever occurred first. In Louisiana, the maximum allowable rut depth after 20,000 passes is 6 mm for SMA mixes prepared with PG 76-22 binder and 10 mm for surface (wearing course) mixes prepared with PG 67-22 binder.
Semicircular Bending Test
The cracking potential of asphalt mixtures at intermediate temperatures was evaluated using the semicircular bending (SCB) test, in accordance with ASTM D 8044. This test method determines the critical strain energy release rate (J c ) from the load–displacement curve. The SCB test employs a three-point bending configuration, in which a monotonically increasing load is applied to the semicircular specimen (with notch depths of 25.4 mm, 1.8 mm, and 38 mm) at a deformation rate of 0.5 mm/min until failure. The test device is designed to stop when the load decreases to 75% of the peak load after reaching its maximum value. Testing was conducted at 25°C.
The strain energy to failure, U, was calculated as the area under the load–deflection curve up to the maximum load. The average U for different notch depths was used to determine the slope of the regression line, dU/da. The critical strain energy release rate was then calculated by dividing dU/da by the specimen thickness according to

where
Jc = critical strain energy rate (kJ/m2);
b = sample thickness (m);
a = notch depth (m);
U = strain energy to failure (kJ); and
dU/da = change in strain energy with notch depth (kJ/m).
Twelve semicircular specimens with three notch depths were tested to determine dU/da, the change in strain energy with notch depth. Notch depths of 25.4 mm, 31.8 mm, and 38 mm were tested for each mix type. For the surface mix and SMA, the J c value must be at least 0.5 kJ/m2 and 0.6 kJ/m2, respectively, according to DOTD specifications ( 26 ). Higher J c values indicate greater fracture resistance of the asphalt mixture, making this parameter a direct indicator of cracking performance.
Modified Lottman Test
The resistance of SMA and surface mix to moisture damage was evaluated using the modified Lottman test, as outlined in AASHTO T 283 ( 27 ). This test determines the tensile strength ratio (TSR) by calculating the ratio of the average indirect tensile strength (ITS) of three wet-conditioned specimens to the average ITS of three dry specimens. For the wet-conditioned samples, one freeze–thaw cycle was applied, and all specimens were submerged in a 25°C water bath for 2 h before testing. The TSR of each mixture was compared against the minimum recommended value of 0.8 specified by Louisiana standards, providing a benchmark for predicting the moisture resistance performance of the mixtures prepared with different filler materials.
Results and Analysis
This section introduces the main results and findings of the laboratory experimental program. Results were analyzed statistically using Analysis of Variance (ANOVA) and Tukey’s Honest Significant Difference grouping at a 95% confidence level to identify differences in the characteristics and performance of the different mixes. Statistical differences were indicated by letters in the figures (i.e., A, B, and C). Different assigned letters indicate that the two groups are statistically different, with the letter A assigned to the best performer, followed by the letter B, and so on.
Physical Characteristics of Fillers
Rigden Void Test Results
The RV percentages for the control fillers, cement, fly ash, and steel slag are presented in Figure 2. Results presented in Figure 2 indicate that cement had the highest void percentage (25.2%), while fly ash had the lowest (21.1%). The control fillers (CM1 and CM2) had void percentages of 22.2% and 23.3%, respectively. Measurements were repeatable with a coefficient of variation (COV) ranging from 3.1 to 12.5% and an average of 8.7%.
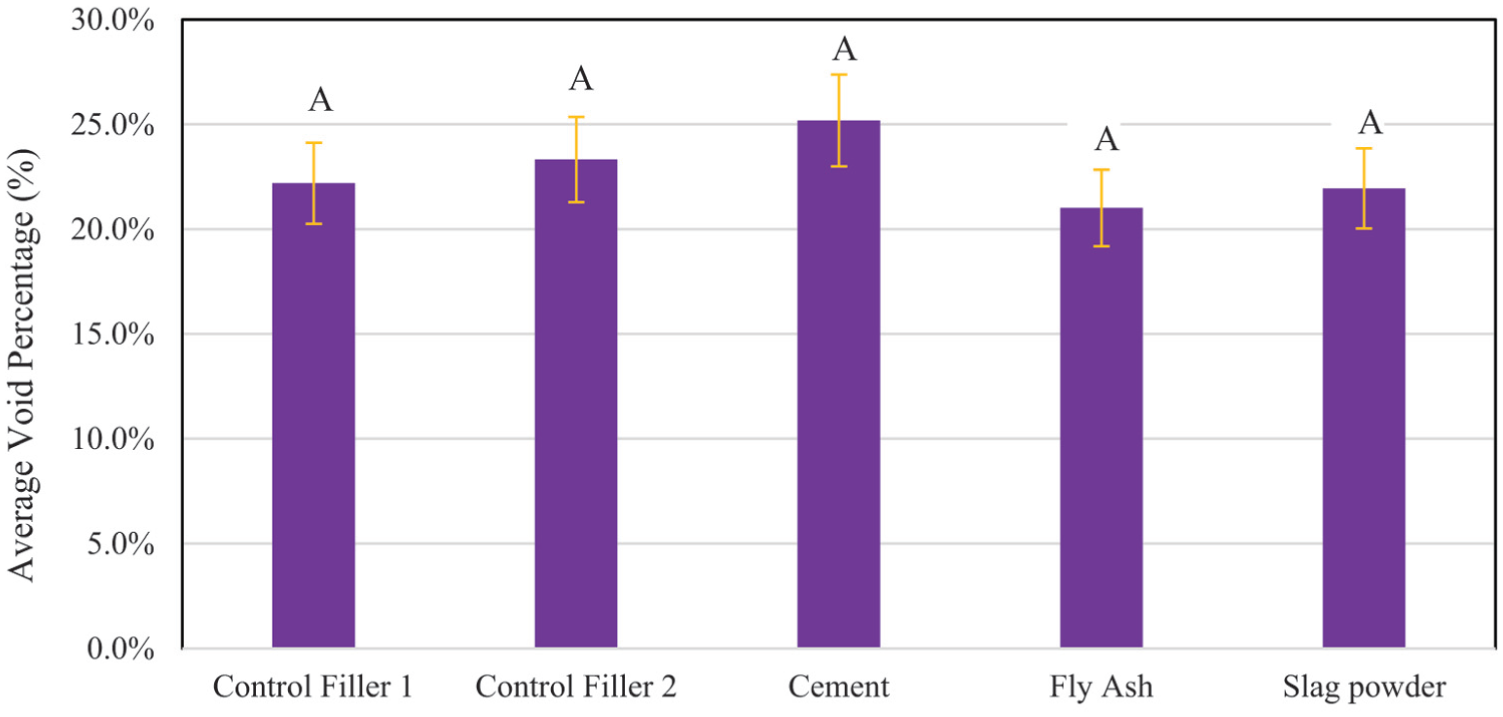
Average Rigden void percentage of fillers.
An ANOVA was performed to identify statistically significant differences among the void percentages of the filler materials. The ANOVA yielded an F-statistic of 2.71 with a corresponding p-value of 0.195, indicating that, based on the current data, there is no statistically significant difference among the group means of void percentages for the different filler materials. Therefore, it can be inferred that there is no compelling evidence of significant variation in void percentages among cement, fly ash, steel slag, and the control fillers. Furthermore, it is noted that all filler materials used in this experiment had lower RV values than the optimum range of 34% to 39% recommended by Harris and Stuart (1995). Higher RV values typically lead to stiffer asphalt mastic and an increased probability of cracking, while lower values result in soft asphalt mastic and difficulties in paving construction ( 28 ). However, since its introduction in 1947, the RV apparatus has undergone multiple modifications, which may explain the discrepancies between the results of the present study and those of earlier studies in the literature.
Bitumen Bond Strength
Figure 3 presents the measured bitumen bond strength for different filler materials under dry and wet conditions. The error bars shown in this figure were defined based on the standard error of the mean. The coefficients of variation of the measurements ranged from 1.5% to 15.9%. As shown in Figure 3a, under dry conditions, steel slag asphalt mastic exhibited the highest POTS value of 3.47 MPa. The other mastics had lower values, ranging from 2.6 MPa for CM1 to 3.03 MPa for fly ash. In the wet samples, all mastics experienced strength loss because of moisture. The mastic prepared with steel slag and fly ash exhibited the lowest moisture-induced strength loss (Figure 3b).
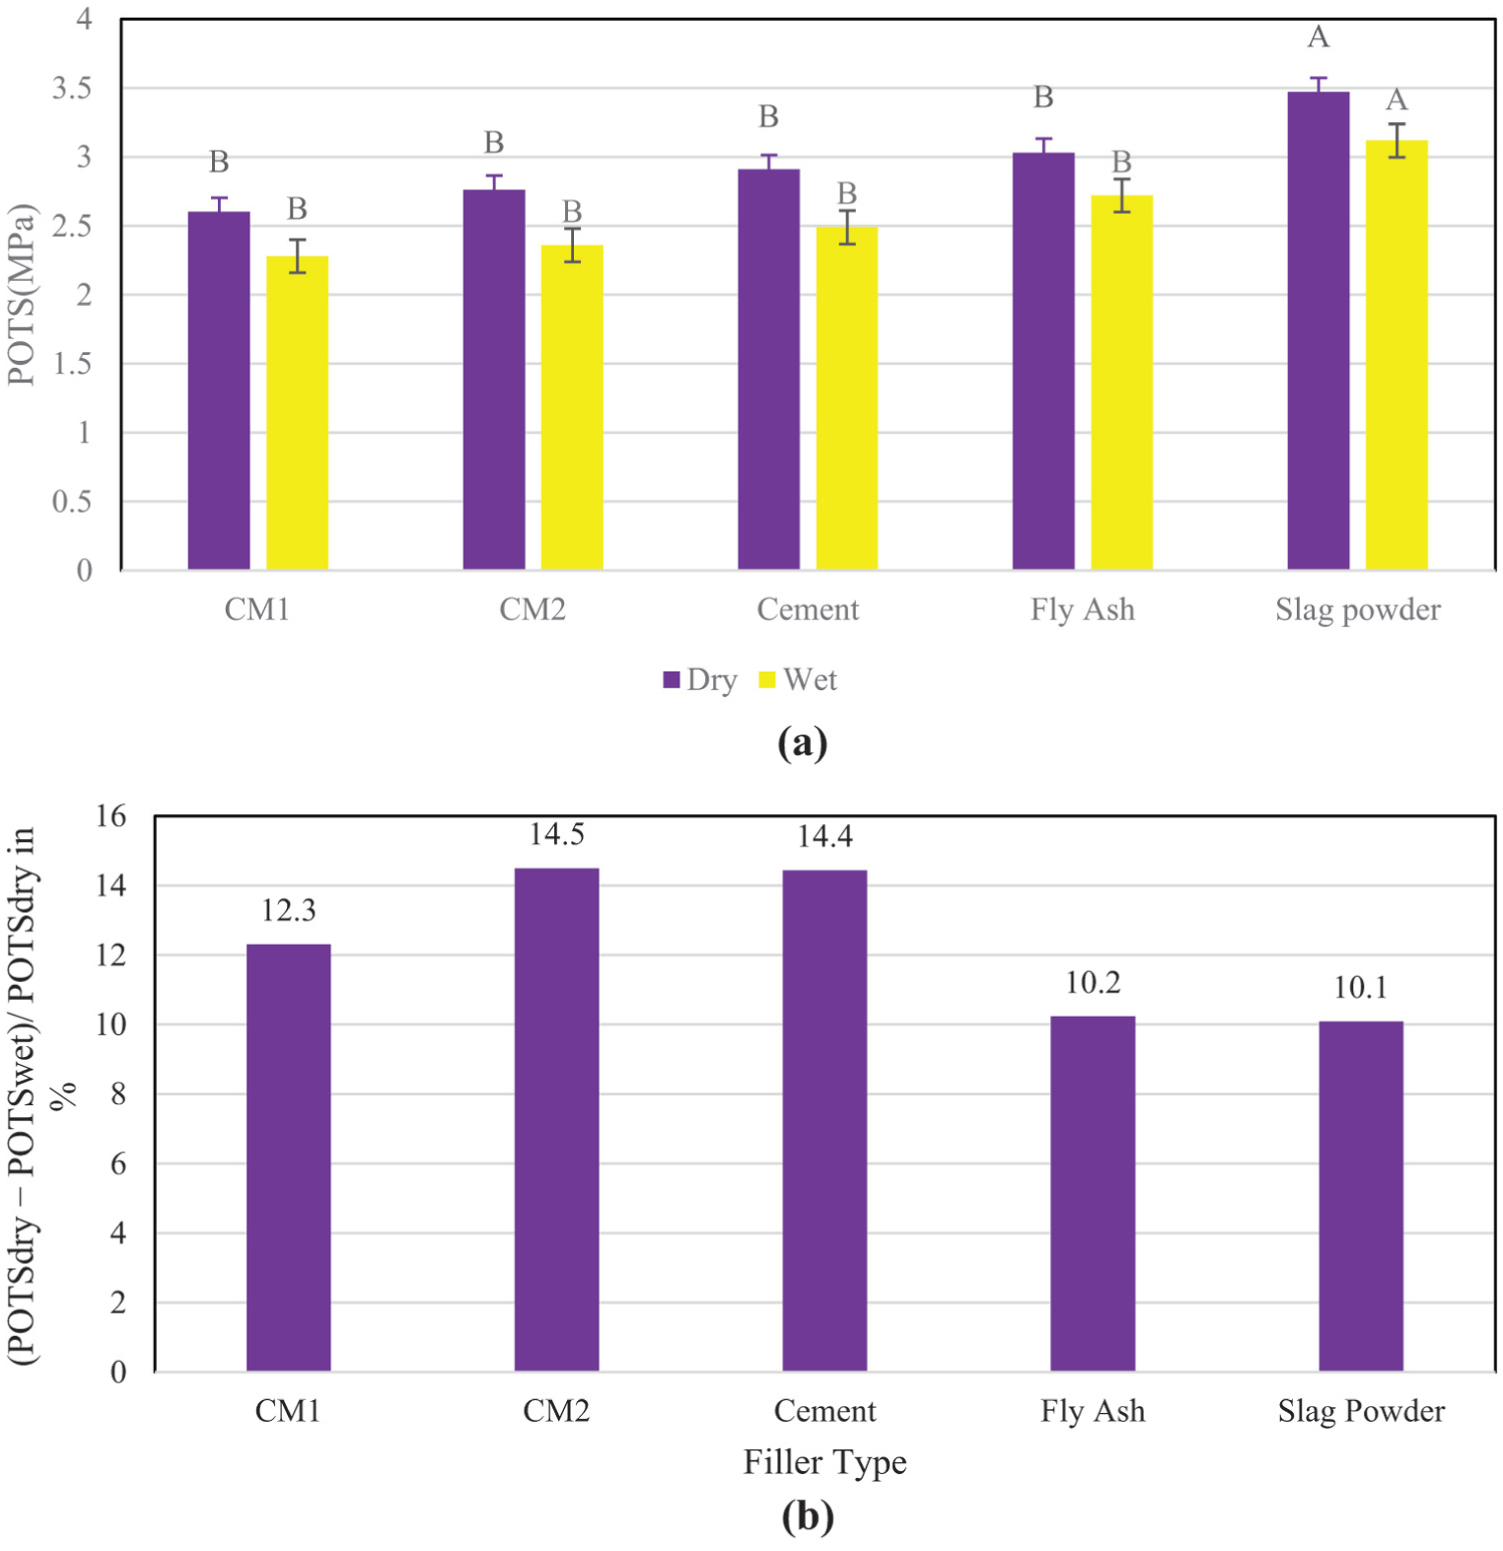
POTS test results: (a) POTS under dry and wet conditions, and (b) loss of bond strength because of wet conditioning.
An ANOVA was conducted to assess whether the measured differences were statistically significant at a 95% confidence level (α = 0.05). The statistical analysis revealed that steel slag powder exhibited significantly higher POTS than the control, fly ash, and cement mastics under both dry and wet conditions. Comparing the dry and wet conditions, Figure 3b shows that cement and CM2 exhibited the highest percentage of strength loss. After each test, the failure surface was visually inspected. For all samples, adhesive failure was observed at the binder-aggregate interface in both dry and wet conditions. These results indicate that the cohesive strength of the mastic exceeded the adhesive strength between the mastic and the aggregate surface, which was the controlling failure mechanism in this test.
Laser Diffraction Test Results
Figure 4 presents the particle size distribution and size parameters of the filler materials. It can be observed that, for all the fillers, more than 70% of the particles were smaller than 75 µm, meeting the ASTM D242 criteria for mineral fillers in asphalt mixtures. Overall, fly ash and steel slag were finer than the other fillers. This finding is supported by the fineness modulus values calculated from the particle size distribution results. As anticipated, the control fillers, derived from natural sources, were coarser than the other fillers, which are typically processed industrially. These results suggest that industrial fillers are more effective at filling voids and stiffening mastic than natural fillers. These results are also consistent with the RV measurements, which showed that fly ash and steel slag had the lowest RV values.
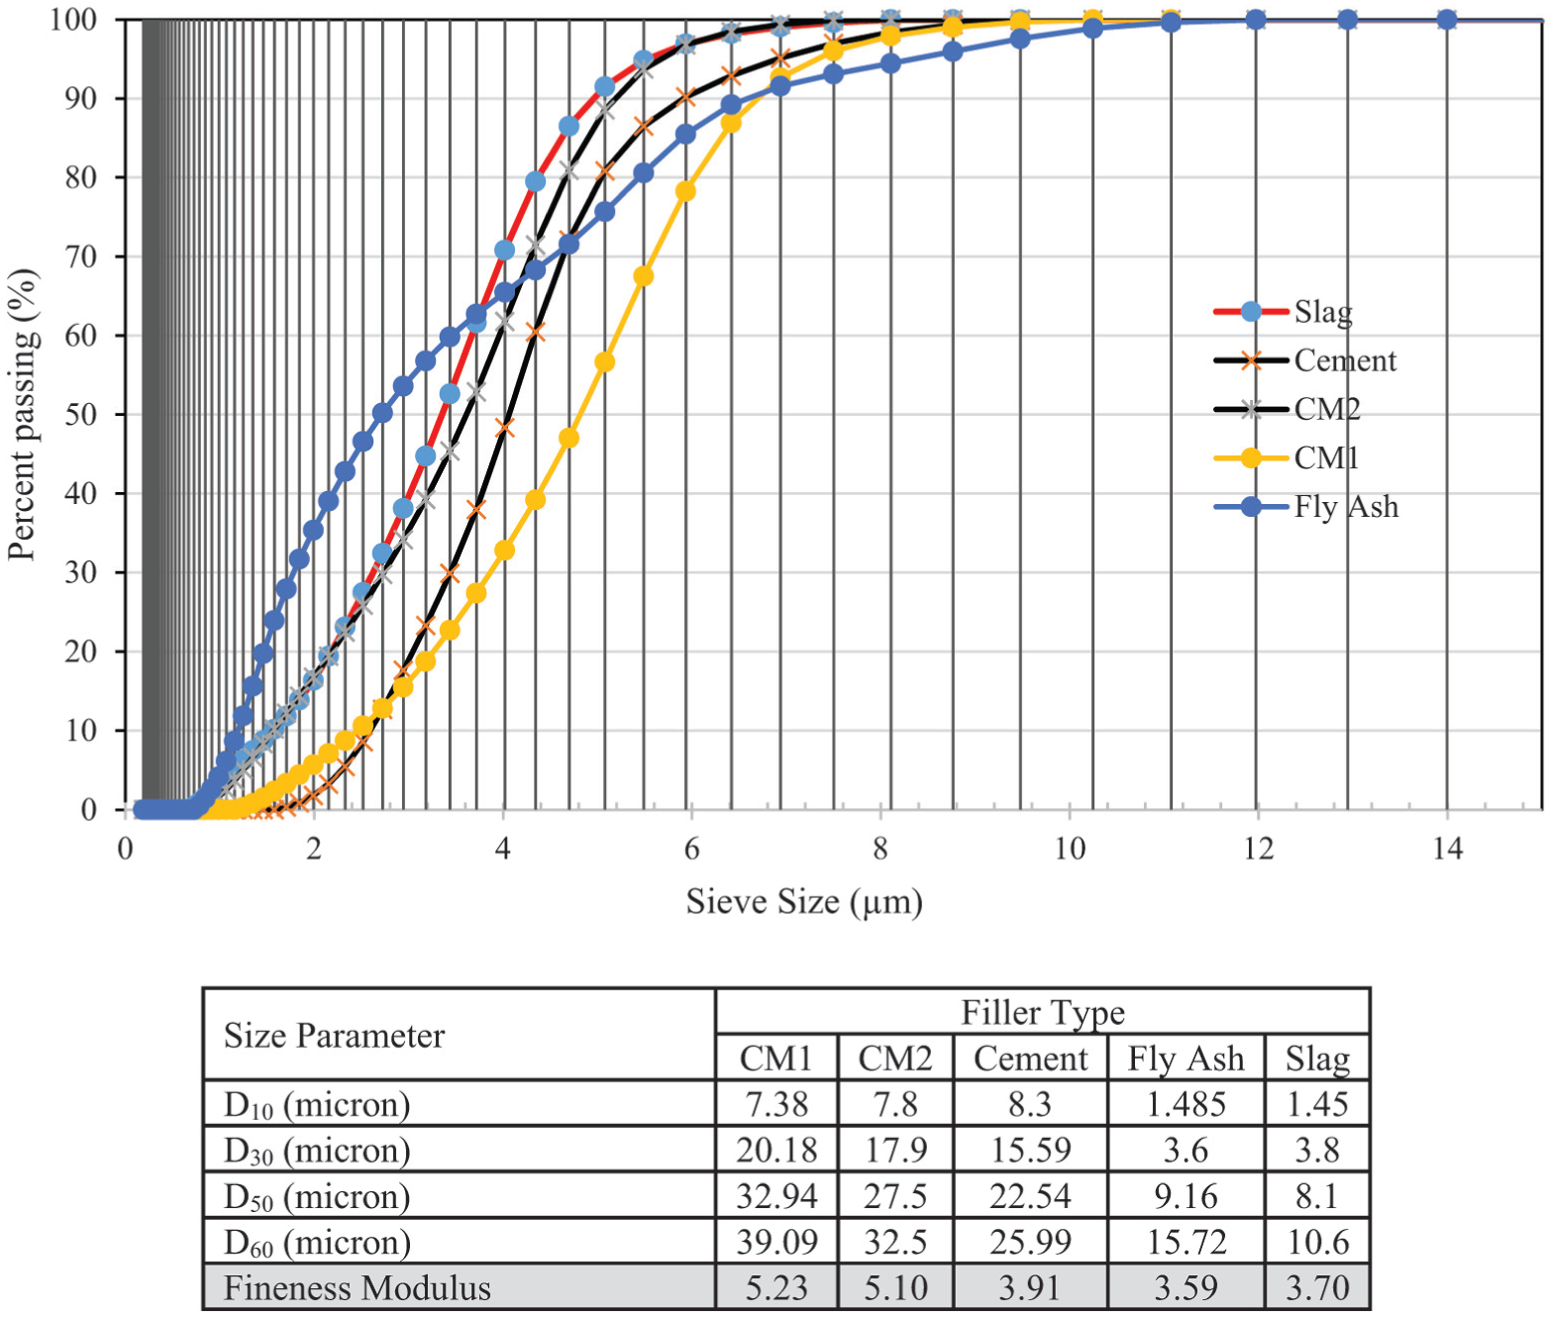
Particle size distribution and size parameters of the fillers using laser diffraction.
Scanning Electron Microscopy-Energy Dispersive X-Ray Spectroscopy
SEM images of four filler materials (CM1, cement, fly ash, and steel slag) are presented in Figure 5. Based on these images, one can observe that CM1 consists of highly irregular, angular, and flaky particles. It is made from crushed natural material and has a rough, textured surface with many sharp edges. On the other hand, the cement filler consists predominantly of angular and fine particles, with some smaller flaky structures. It has a moderately rough surface with a high surface area. Fly ash consists of small, spherical particles with a smooth surface texture and minimal angularity. The round nature of the fly ash particles is expected to enhance packing and workability. Finally, the steel slag consists of sharp-edged, angular particles with a rough surface texture. The angular nature of the steel slag particles is expected to enhance mechanical interlock and rutting resistance.
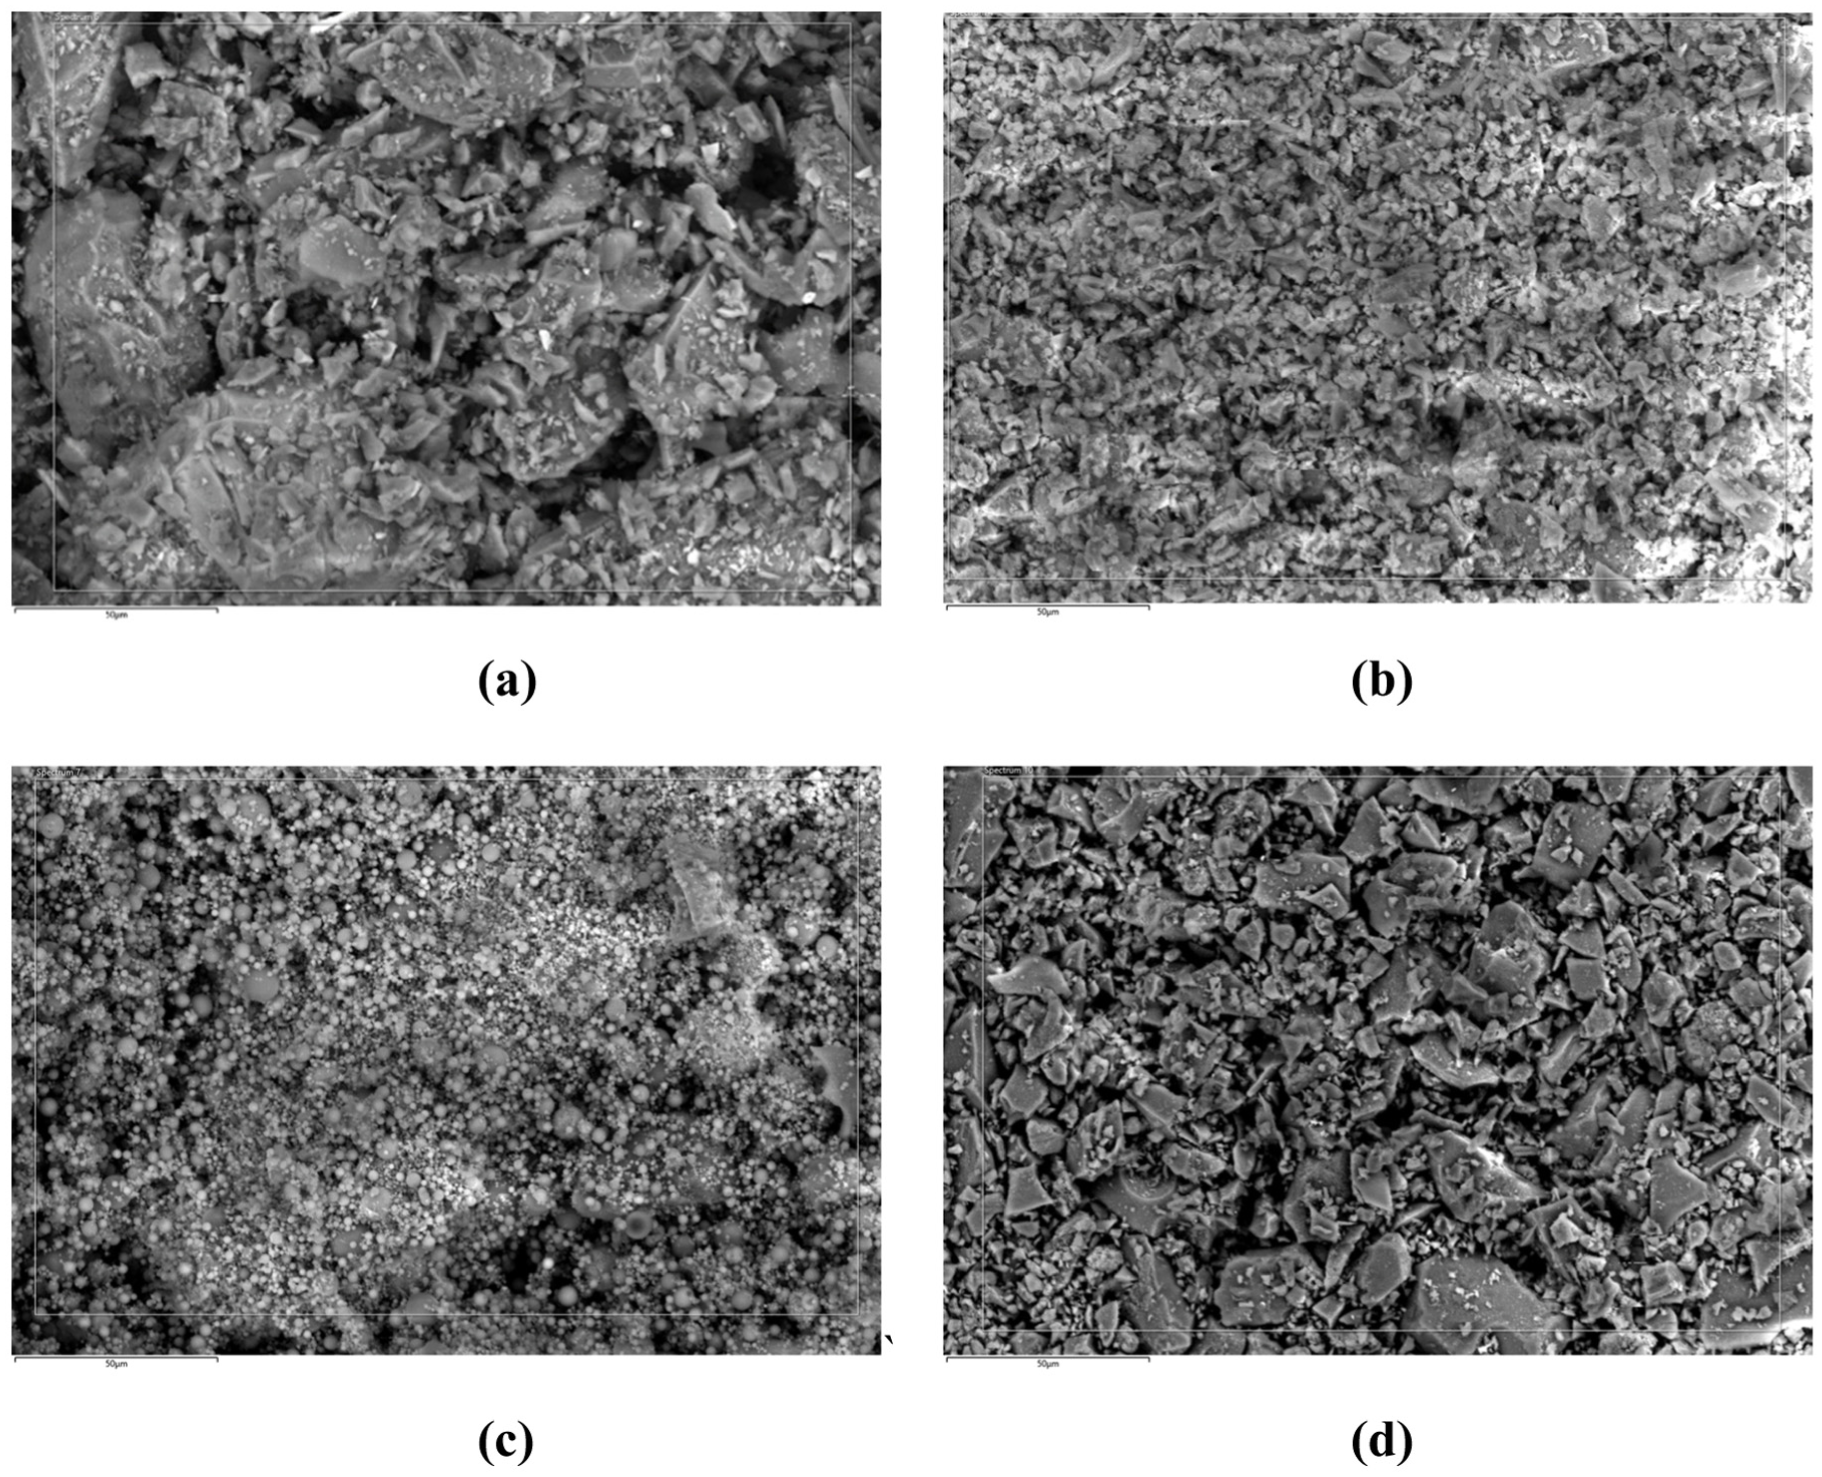
SEM images at 350x magnification for: (a) CM1, (b) cement, (c) fly ash, and (d) steel slag.
X-ray Fluorescence
The chemical elemental compositions of the four filler materials are presented in Table 1. The three main components for each filler are highlighted in the table. While not presented in this manuscript, the elemental makeup determined by EDS confirmed the XRF findings. As illustrated in Table 1, the XRF results revealed distinct chemical profiles for the fillers. CM1 exhibits the highest SiO2 content (63.03%). Excessive SiO2 content may lead to reduced moisture-damage resistance and poor bonding with the binder ( 29 ). Fly ash exhibits a moderate SiO2 content (31.90%) along with notable CaO and Al2O3 levels, indicating a siliceous Class F fly ash with strong pozzolanic potential. Cement is dominated by CaO (58.32%), consistent with its hydraulic nature, and also contains significant amounts of SiO2 and SO3. High CaO content in fillers, such as hydrated lime or cement, enhances the stiffness and cohesion of asphalt mastics, improving rutting resistance ( 1 ). However, excessive CaO can increase the brittleness of the asphalt mixture, reducing flexibility and making it more susceptible to cracking under thermal or mechanical stresses. Slag powder had a balanced composition, with moderate levels of SiO2 (39.41%), CaO (29.34%), and MgO (14.61%), reflecting its latent hydraulic properties.
Chemical Elemental Composition of Filler Materials Based on XRF Analysis
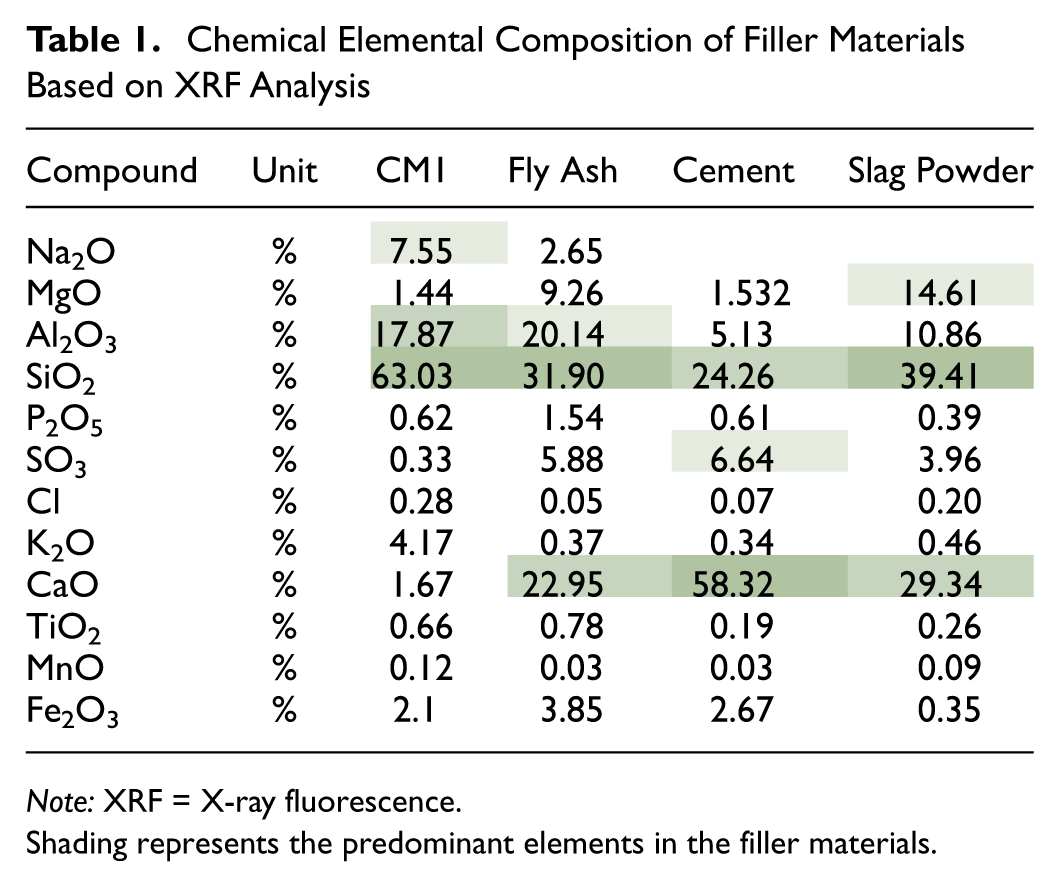
Note: XRF = X-ray fluorescence. Shading represents the predominant elements in the filler materials.
Performance Evaluation of Asphalt Mixtures
Cantabro Loss Test Results
Figure 6 presents the Cantabro loss test results for the SMA and surface mixture, as well as for different filler materials. The average COV of the measurements was 16.7%, based on three replicates for each mixture. Results shown in Figure 6 indicate that SMA mixtures consistently exhibited superior durability performance compared with surface mixtures, with all SMA variants showing loss values below 5%, regardless of filler type. This superior performance may be attributed to the polymer-modified binder used in this mixture. In contrast, surface mixtures were more sensitive to filler type. Fly ash resulted in the highest Cantabro loss (approximately 21%), exceeding the 20% performance threshold and suggesting reduced durability. Cement showed borderline performance with higher variability, while slag and CM yielded the lowest Cantabro loss values among the surface mixtures (approximately 17%–18%), indicating better filler-binder interaction. Overall, CM and slag appeared to enhance the durability of the surface mixtures, whereas SMA provided consistently robust performance regardless of the filler type.
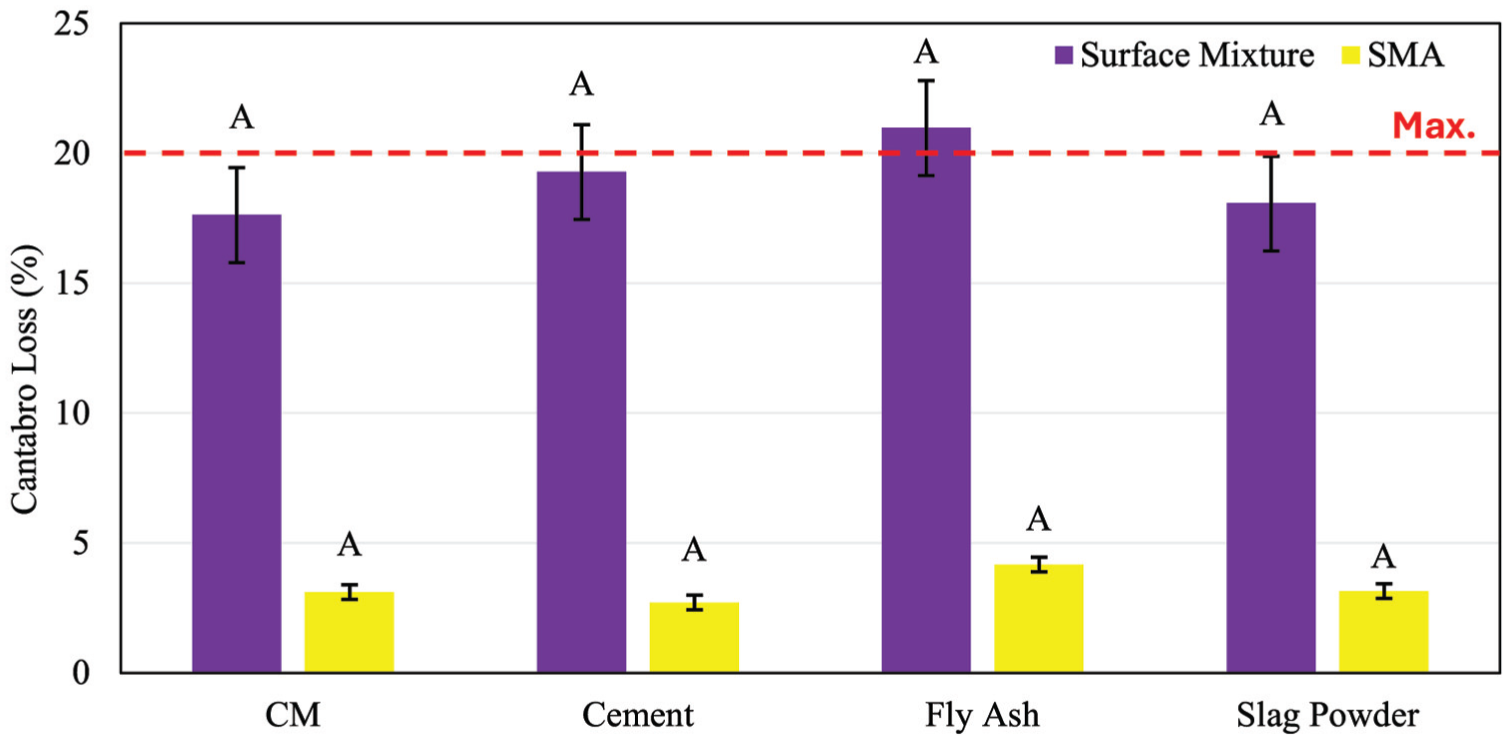
Cantabro loss test results for different filler materials.
HWTT Results
Figure 7 presents the results of the HWTT for different mixes prepared with various filler materials. Mixes containing industrial fillers, especially fly ash and steel slag, generally exhibited enhanced rutting performance compared with the control mixes for both mix types (SMA and surface). This improvement could be attributed to the finer particle size of these fillers compared with those in the other groups, which leads to better bonding between the aggregates and the binder. In addition, steel slag particles, characterized by their sharp-edged, angular shape and rough surface texture, detected in SEM, were expected to enhance the mix’s rutting resistance.
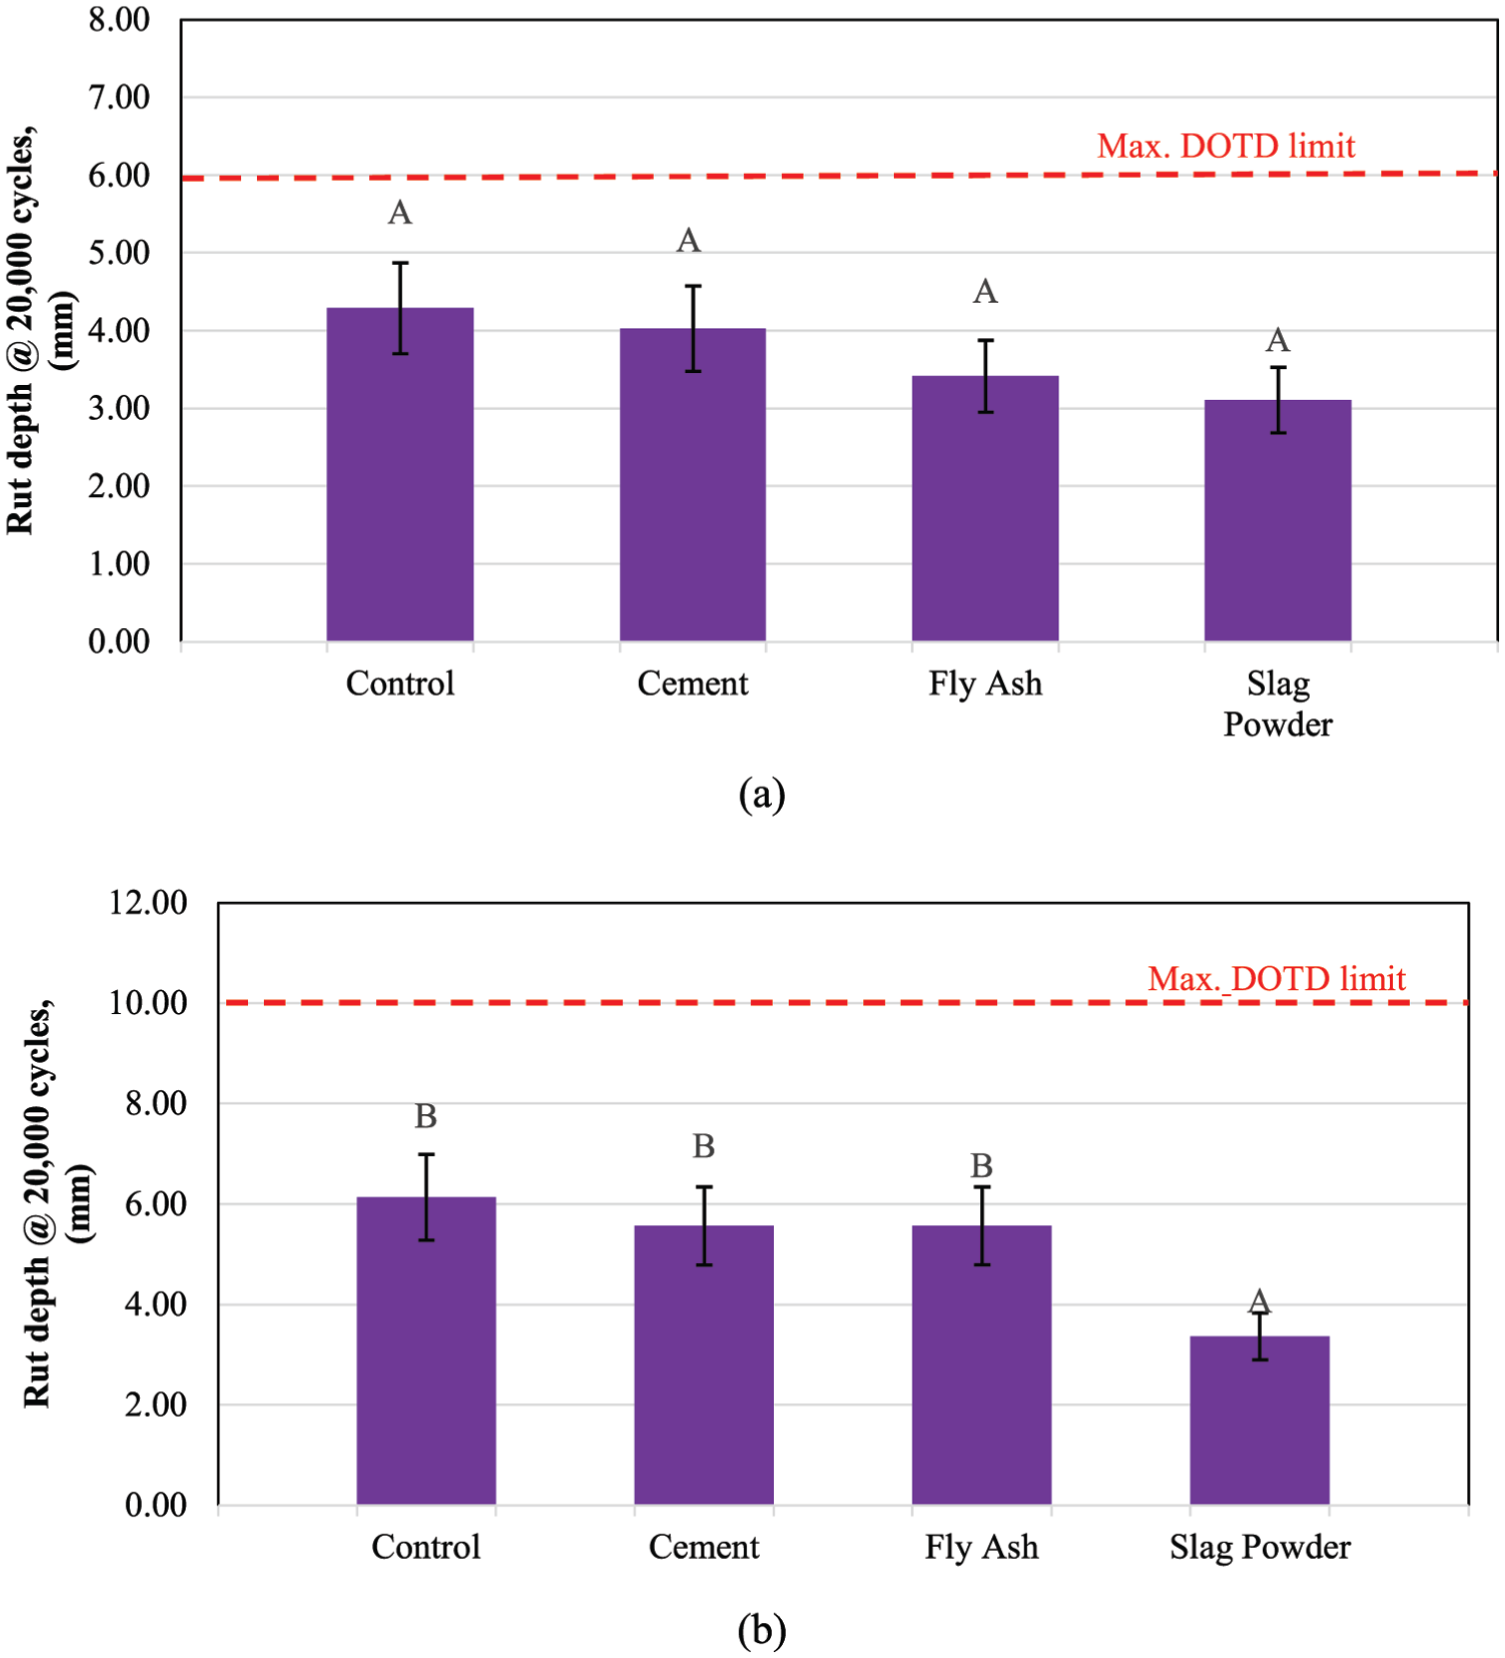
Hamburg wheel-tracking test results for: (a) stone matrix asphalt, and (b) surface mix.
Figure 7a shows the rut depth of the SMA mix at 20,000 passes. While the steel slag powder mix exhibited the lowest rut depth of 3.11 mm, the SMA modified with the control filler showed the highest rut depth of 4.29 mm. Nevertheless, all mixes met the DOTD criterion of less than 6 mm rut depth at 20,000 passes for SMA, indicating that all mixes are expected to perform satisfactorily against rutting in the field.
Figure 7b illustrates the rut depth for the surface mix after 20,000 passes. The mix containing steel slag powder exhibited a significantly lower rut depth of 3.37 mm, well within the DOTD criterion for surface mixes (Design Level 1), which requires a maximum rut depth of 10 mm at 20,000 cycles. In addition, all mixes containing industrial fillers outperformed the control mix in rutting resistance. This indicates that industrial fillers, especially steel slag powder, have the potential to serve as effective substitutes for the control filler.
Modified Lottman Test Results
Figure 8, a and b , presents the results of the Modified Lottman test for SMA and surface mixes, respectively. This test was used to assess the moisture susceptibility of the mixtures by evaluating the TSR, which was calculated as the ratio of the conditioned ITS to the unconditioned ITS. Figure 8a indicates that the SMA mix containing industrial fillers, particularly fly ash and steel slag, exhibited an increase in TSR in comparison to the control mix. Similar trends were observed for the surface mix, with the industrial fillers outperforming the control mix containing natural fillers. Results from XRF indicated that the control filler contained the highest SiO2 content (63.03%). Excessive SiO2 content may reduce resistance to moisture damage. Nevertheless, the TSR ratios for all the different filler materials were above the minimum threshold of 0.8 set by DOTD, and the noted differences were less than 4%, which is less than the d2s tolerance value of 10% for TSR (within-lab repeatability) recommended by Azari ( 30 ).
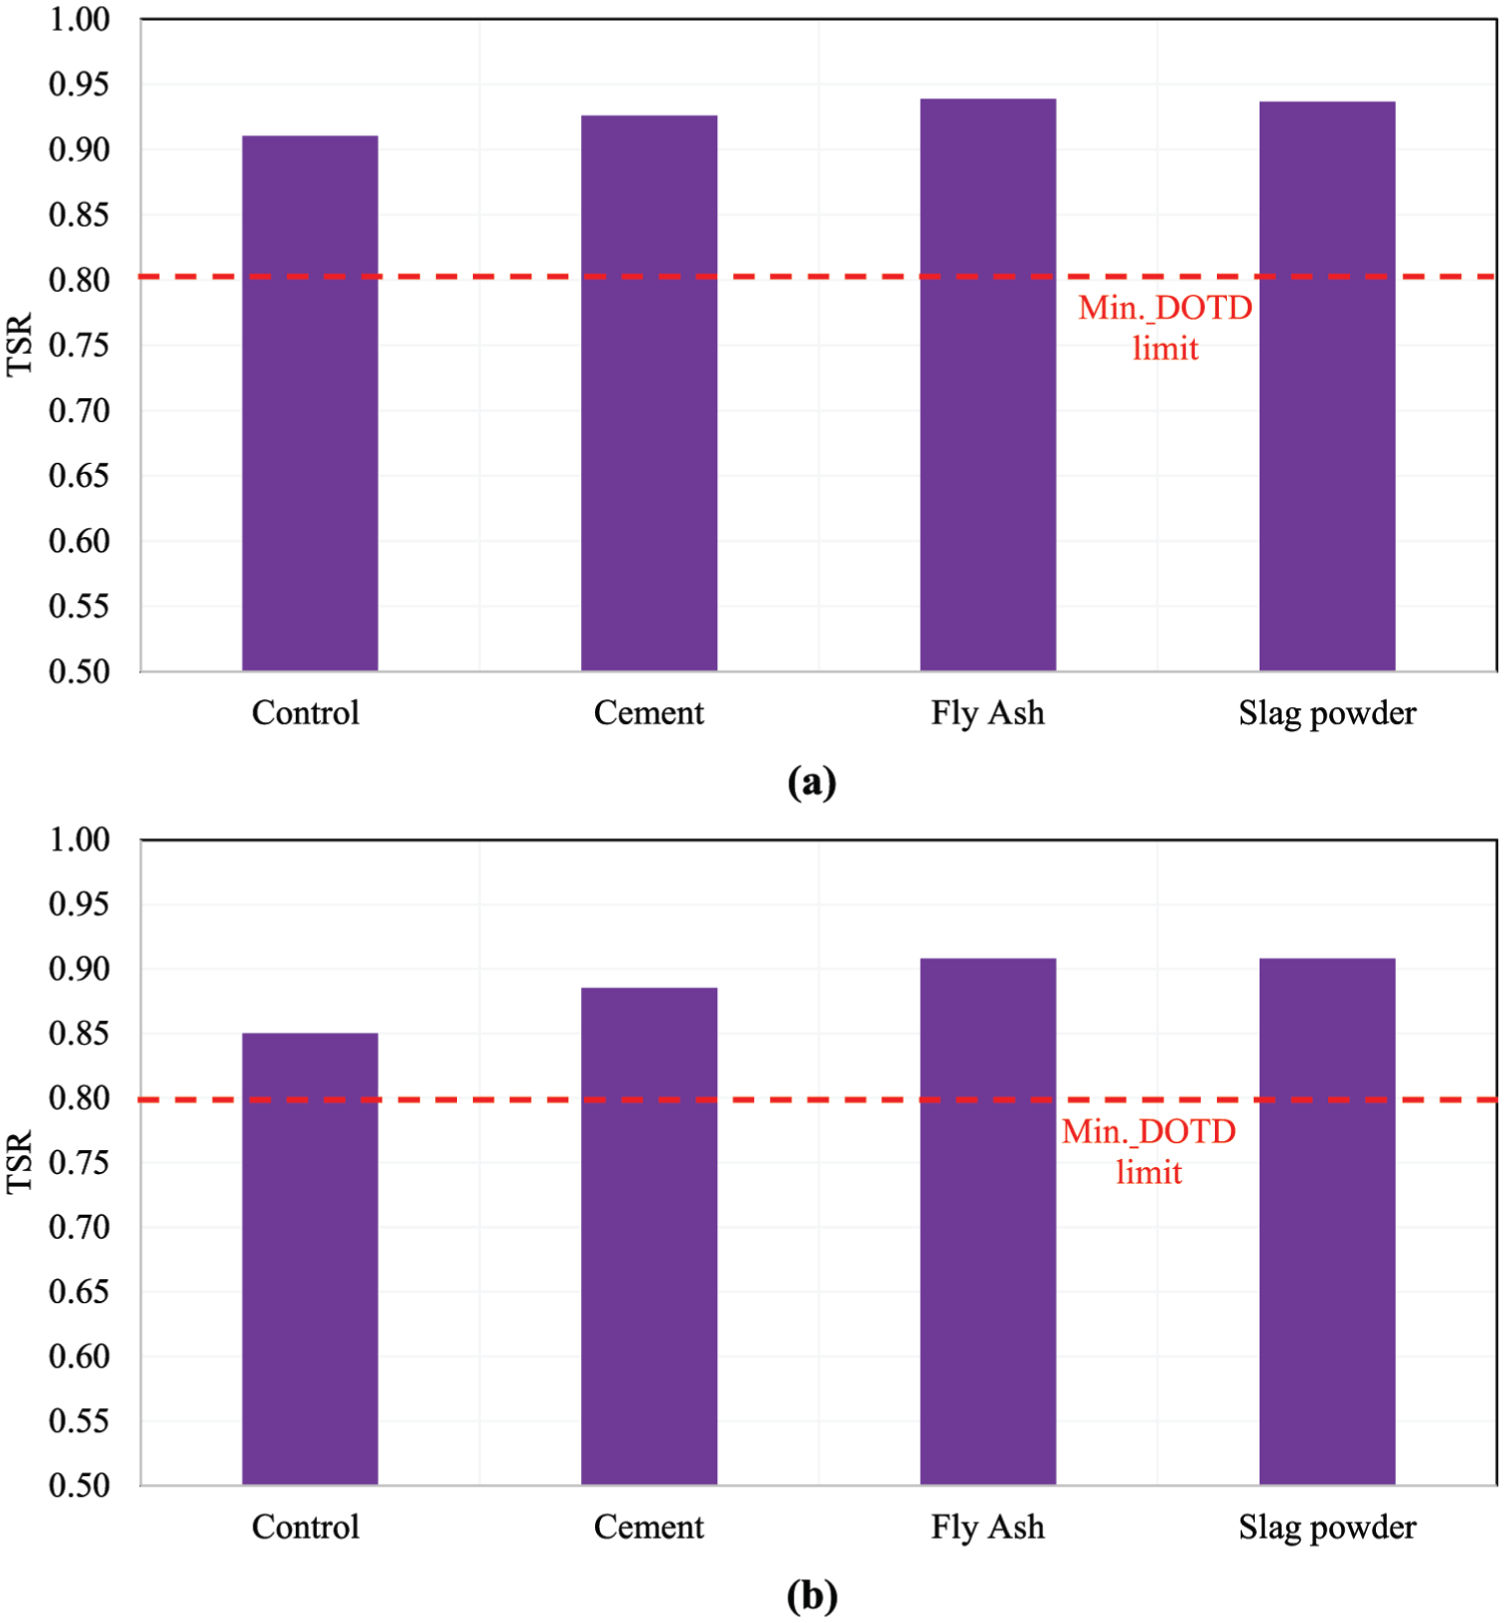
Modified Lottman test results for: (a) SMA, and (b) surface mix.
Semicircular Bending Test Results
Figure 9, a and b , presents the SCB critical strain energy release rate (Jc) test results for the SMA and surface mixes, respectively. An average COV of 9.5% was calculated based on the test results. According to DOTD specifications, the Jc value for SMA and surface mixes should be at least 0.6 and 0.5, respectively, for design levels 2 (high traffic, SMA) and 1 (surface mix). As noted from the figures, the Jc values for all mixes met the minimum requirement. In addition, the use of fly ash significantly enhanced the cracking resistance of the SMA and surface mixes compared with the control. This was followed by slag powder, which also outperformed the control mixes. In contrast, cement did not perform better than the control mixture. These results were consistent with the bitumen bond strength results, which showed that slag powder and fly ash had the highest POTS.
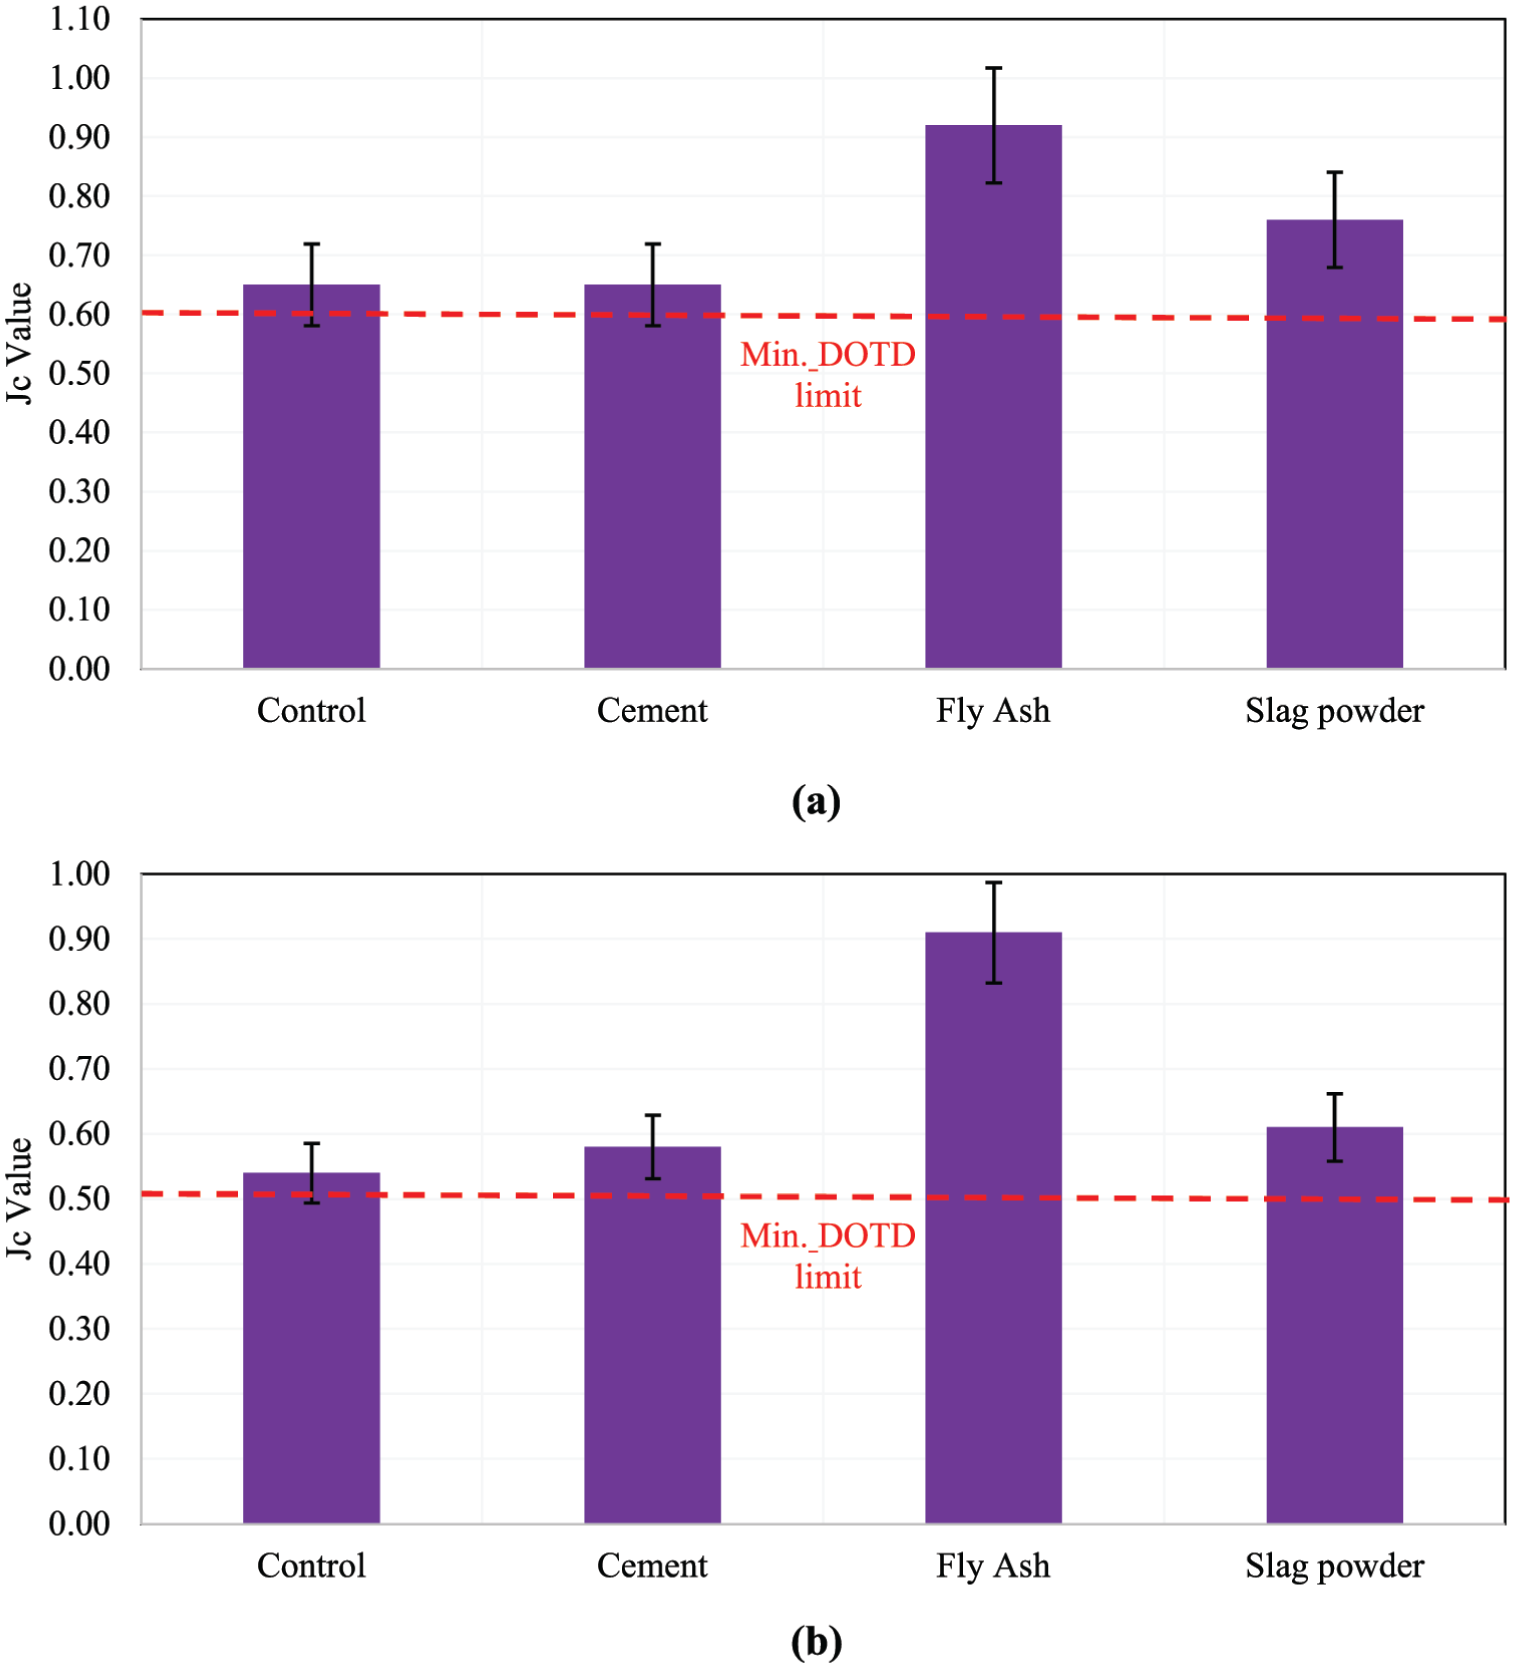
Semicircular bending test results for: (a) SMA and (b) surface mix.
Conclusions
This study was conducted to assess the feasibility of using industrial and sustainable fillers in asphalt mixtures and to evaluate the extent to which their physicochemical properties influence the performance of asphalt mixtures. Based on the results of the study, the following conclusions may be drawn:
Results of the Rigden fractional voids showed minor differences between the fillers. In addition, all filler materials had a lower RV value than the optimum range of 34% to 39%.
The results of the BBS test indicated that steel slag demonstrated significantly higher tensile strength, followed by fly ash, cement, and control mastics under both dry and wet conditions.
Laser diffraction results showed that fly ash and steel slag fillers were finer and had a more uniform particle size distribution than both the cement and the control fillers. This observation was supported by the fineness modulus values calculated from the particle size distribution data.
Concerning rutting performance, mixes containing industrial fillers, especially fly ash and steel slag, exhibited better performance compared with the control mixes for both SMA and surface mix types.
For cracking resistance, the use of fly ash and steel slag powder in the SMA and surface mixes improved the SCB Jc value compared with the control filler. In contrast, cement performed similarly to the control mixture. All SMA and surface mixes met the minimum DOTD requirement for the SCB test.
Concerning moisture damage resistance, the TSR for the industrial filler materials, particularly fly ash and steel slag, was higher than that of the control filler. In addition, all mixes met the DOTD minimum threshold of 0.8.
The physical and chemical characteristics of the fillers correlated acceptably well with the performance of the mixes prepared with different filler materials.
In summary, state agencies should permit the use of fly ash and steel slag powder as replacements for mineral fillers in asphalt mixtures. These fillers were found to outperform conventional fillers while facilitating the reuse of industrial waste in the road infrastructure. Future work will focus on establishing a direct quantitative relationship between the filler physicochemical properties and mixture-level test results through comprehensive statistical correlation and regression analyses.
Footnotes
Acknowledgements
The assistance of Mike Hemsley of Paragon Technical Services is greatly appreciated. In addition, the assistance of the additive manufacturers and Don Weathers was of great benefit to the authors.
Author Contributions
The authors confirm contribution to the paper as follows: study conception and design: Mostafa Elseifi, Moses Akentuna, Samuel Cooper III, and Mohammad Hadizadeh Pirbasti; data collection: Mohammad Hadizadeh Pirbasti, S. M. Tanvir, and Md Afif Rahman Chowdhury; analysis and interpretation of results: Mostafa Elseifi, Mohammad Hadizadeh Pirbasti, S. M. Tanvir, and Md Afif Rahman Chowdhury; draft manuscript preparation: Mohammad Hadizadeh Pirbasti and Mostafa Elseifi. All authors reviewed the results and approved the final version of the manuscript.
Declaration of Conflicting Interests
The authors declared the following potential conflicts of interest with respect to the research, authorship, and/or publication of this article: Mostafa A. Elseifi is a member of the Transportation Research Record’s Editorial Board.
Funding
The authors disclosed receipt of the following financial support for the research, authorship, and/or publication of this article: The study was financially supported by the Louisiana Transportation Research Center (LTRC). The grant number is 23-1B.
The contents of this paper do not necessarily reflect the official views or policies of LTRC or the Louisiana Department of Transportation and Development.