






Abstract
Validation of balanced mix design (BMD) test thresholds is essential for building confidence in performance-based asphalt mix designs. To support Texas’ BMD implementation, multiple field test sections statewide have been monitored, accumulating data from preconstruction through several years of service. These sections, exposed to traffic levels ranging from 600 to 23,000 average annual daily traffic (AADT) and up to 1.0 million equivalent single-axle loads (MESALs), provide valuable insights into test thresholds across diverse traffic and regional conditions. Complementary data from three national center for asphalt technology test track sections subjected to accelerated loading compare traditional volumetric designs and BMD specifications. Additionally, materials from the original WesTrack test track were evaluated with current cracking and rutting tests to relate historical field performance with present protocols. Despite challenges in collecting long-term field data and variability from traffic and environmental factors, key conclusions emerged. The indirect tensile asphalt cracking test and Texas overlay tester effectively gauge cracking resistance differences among mixtures, correlating well with field outcomes. The Hamburg wheel tracking (HWT) test reliably identifies mixtures prone to rutting, supported by minimal rutting observed in TxDOT sections. The IDEAL-rutting test (IDEAL-RT) consistently differentiates rutting resistance and predicts field rutting performance, underscoring its value in mix design. Early reflection cracking observed within two years exhibited strong correlation with the cracking tolerance index (CT Index), indicating higher CT Index values improve cracking resistance. Gradation also significantly influences CT Index and crack progression rate (CPR) results, emphasizing the need to incorporate gradation-specific thresholds. These findings enhance understanding of BMD test strengths and limitations, informing refinements aimed at improving pavement durability statewide.
Keywords
Introduction
The Texas Department of Transportation (TxDOT), in collaboration with the Texas A&M Transportation Institute (TTI), the Center for Transportation Research (CTR) and the Center for Transportation Infrastructure Systems (CTIS) has implemented several strategies to develop, benchmark, and validate performance-related asphalt mix design specifications. This research is focused on evaluating emerging performance tests and developing test thresholds for potential incorporation in the TxDOT balanced mix design (BMD) specification.
Unlike the traditional mix design approach which aims to satisfy volumetric criteria, the BMD approach aims to design asphalt mixtures that satisfy cracking and rutting performance criteria, ensuring a well-balanced performance to achieve optimal pavement durability ( 1 ). In this process, the Federal Highway Administration (FHWA) published eight tasks which can effectively guide any state department of transportation (DOT) to implement a BMD program. The current effort mainly focuses on steps three through five toward TxDOT BMD implementation ( 2 ) which include selecting performance tests, laboratory equipment, and establishing baseline data. While similar efforts are being worked on by other state DOTs across the country, regional specific testing and validation is necessary owing to differences in materials, climate, and traffic patterns ( 1 , 3 ). The BMD effort in this study consisted of mixtures that were designed to be balanced with rut depth lower than 12.5 mm from Hamburg wheel tracking (HWT) test and crack progression rate (CPR) less than 0.45 from Texas overlay test (OT), according to TxDOT’s special BMD specification-3074 available at the time of the study. The minimum number of passes for 12.5 mm rut depth depends on the high temperature grade of binder; that is, 10,000 passes for PG 64 or lower, 15,000 passes for PG 70, and 20,000 passes for PG 76 or higher. The BMD field sections were also accompanied by traditional Superpave field sections according to TxDOT specification 344.
Preliminary studies have identified correlations between emerging laboratory test results and field performance, suggesting that more modern, performance-based tests may reliably predict long-term pavement behavior. These correlations are intended to help refine test thresholds, optimize mix designs, and improve roadway durability ( 4 , 5 ). Ongoing research aims to further evaluate these field sections through accelerated pavement testing, forensic assessments, and advanced analysis to better understand the relationship between lab predictions and real-world performance.
In this process, the present study employed TxDOT BMD field sections, national center for asphalt technology (NCAT) test track BMD sections constructed using Texas materials and WesTrack materials to validate TxDOT BMD performance test thresholds. The findings from the above three projects are expected to contribute to the ongoing development of BMD implementation effort by establishing and validating thresholds and helping to improve pavement durability.
Goal and Objectives
This study aims to validate proposed test thresholds and refine performance test methodologies to enhance the durability and resilience of asphalt pavements. At this critical juncture for state transportation agencies, there is a growing need to promote confidence in BMD tests and their thresholds to support broader adoption and consistent implementation. By providing rigorous evaluation of these tests under diverse field and accelerated loading conditions, this research offers specific contributions toward establishing reliable, performance-based asphalt mix design criteria.
The primary objectives of this study are to:
Assess the sensitivity of current performance tests, such as the HWT and Texas OT, alongside emerging tests like the indirect tensile asphalt cracking test (IDEAL-CT) and the IDEAL-rutting test (IDEAL-RT), to mix design variables, specifically gradation and asphalt content as exemplified in the WesTrack materials.
Determine whether “real-world” traffic loading at the NCAT test track generates distinguishable performance outcomes between traditional volumetric and BMD mixtures.
Evaluate how well performance test results correspond to observed field performance in multiple Texas BMD field test sections exposed to varying traffic and environmental conditions.
The findings from this work will guide ongoing improvements in asphalt mixture design testing protocols and thresholds, ultimately supporting state agencies in making data-driven decisions that enhance pavement longevity and performance.
Laboratory Tests
A subset of the following tests presented in Table 1 was conducted on laboratory-mixed laboratory-compacted (LMLC) or reheated plant-mixed laboratory-compacted (RPMLC) specimens for each mixture in this study. The cracking tolerance index (CT Index) measured in the IDEAL-CT and the CPR measured by the OT were used to assess cracking resistance. Rutting resistance was measured using the rutting tolerance index (RT Index) measured in the IDEAL-RT and the HWT test rut depth (RD). Test standards and parameters are shown in Table 1.
Test Method Details
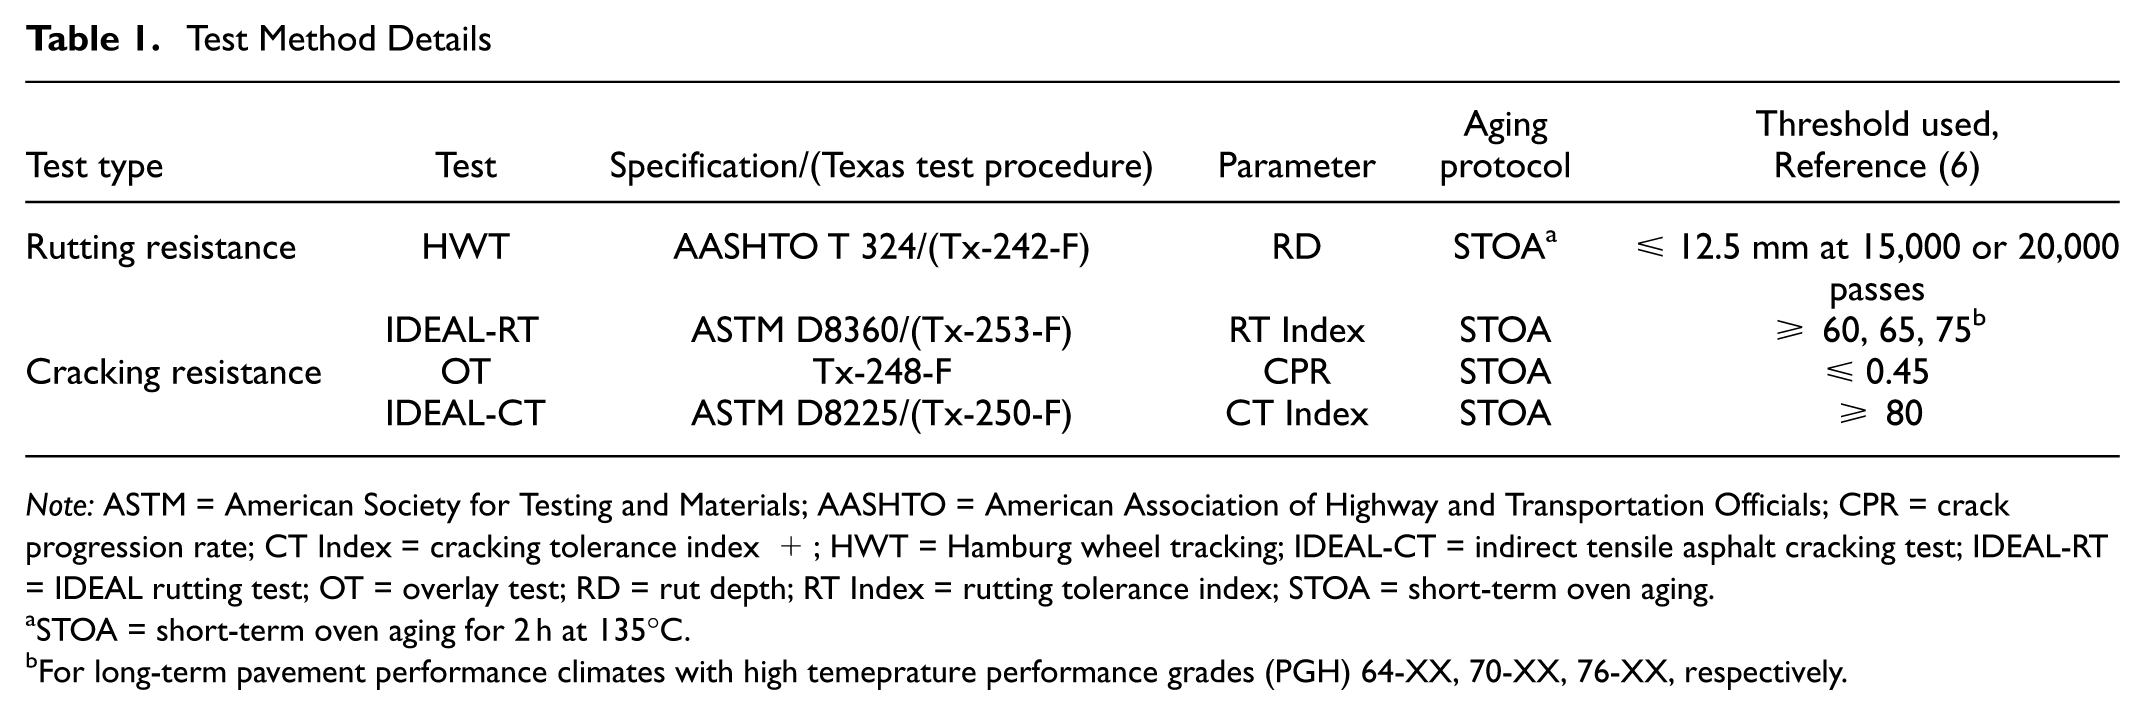
Note: ASTM = American Society for Testing and Materials; AASHTO = American Association of Highway and Transportation Officials; CPR = crack progression rate; CT Index = cracking tolerance index +; HWT = Hamburg wheel tracking; IDEAL-CT = indirect tensile asphalt cracking test; IDEAL-RT = IDEAL rutting test; OT = overlay test; RD = rut depth; RT Index = rutting tolerance index; STOA = short-term oven aging.
STOA = short-term oven aging for 2 h at 135°C.
For long-term pavement performance climates with high temeprature performance grades (PGH) 64-XX, 70-XX, 76-XX, respectively.
The OT and HWT tests were selected owing to their traditional use within TxDOT’s Superpave mix design ( 7 ). TTI has an extensive history with the IDEAL-CT test, encompassing its development ( 8 – 10 ) and subsequent pilot implementation within the forthcoming special BMD specification. Likewise, TTI developed the IDEAL-RT as part of a TxDOT-sponsored research initiative and is undergoing pilot evaluation in the upcoming TxDOT special BMD specification ( 8 ).
Field Sections
TxDOT BMD Field Sections
In the first phase of this study, 33 test mixtures were constructed across Texas and have been monitored annually (
11
). The BMD field sections were designed by TTI and research partners, and constructed by TxDOT and contractors across Texas, to evaluate BMD methodologies under real-world conditions. These sections represent a diverse range of traffic levels, environmental conditions, and pavement structures across the state. Between Fall 2019 and Summer 2022, BMD testing and monitoring were conducted on seven field projects comprising 26 mixtures across Texas. The locations of these projects are presented in Figure 1a along with respective gradation details in Figure 1b. Although additional field projects were constructed during this period, data from these newer sites are not included in this paper, as they had not been in service long enough to develop measurable distress at the time of this study. In this paper TxDOT field projects are denoted by a three-letter county code, a two-letter road type code, and a road number. For example, ATL FM 3129 is a test section in
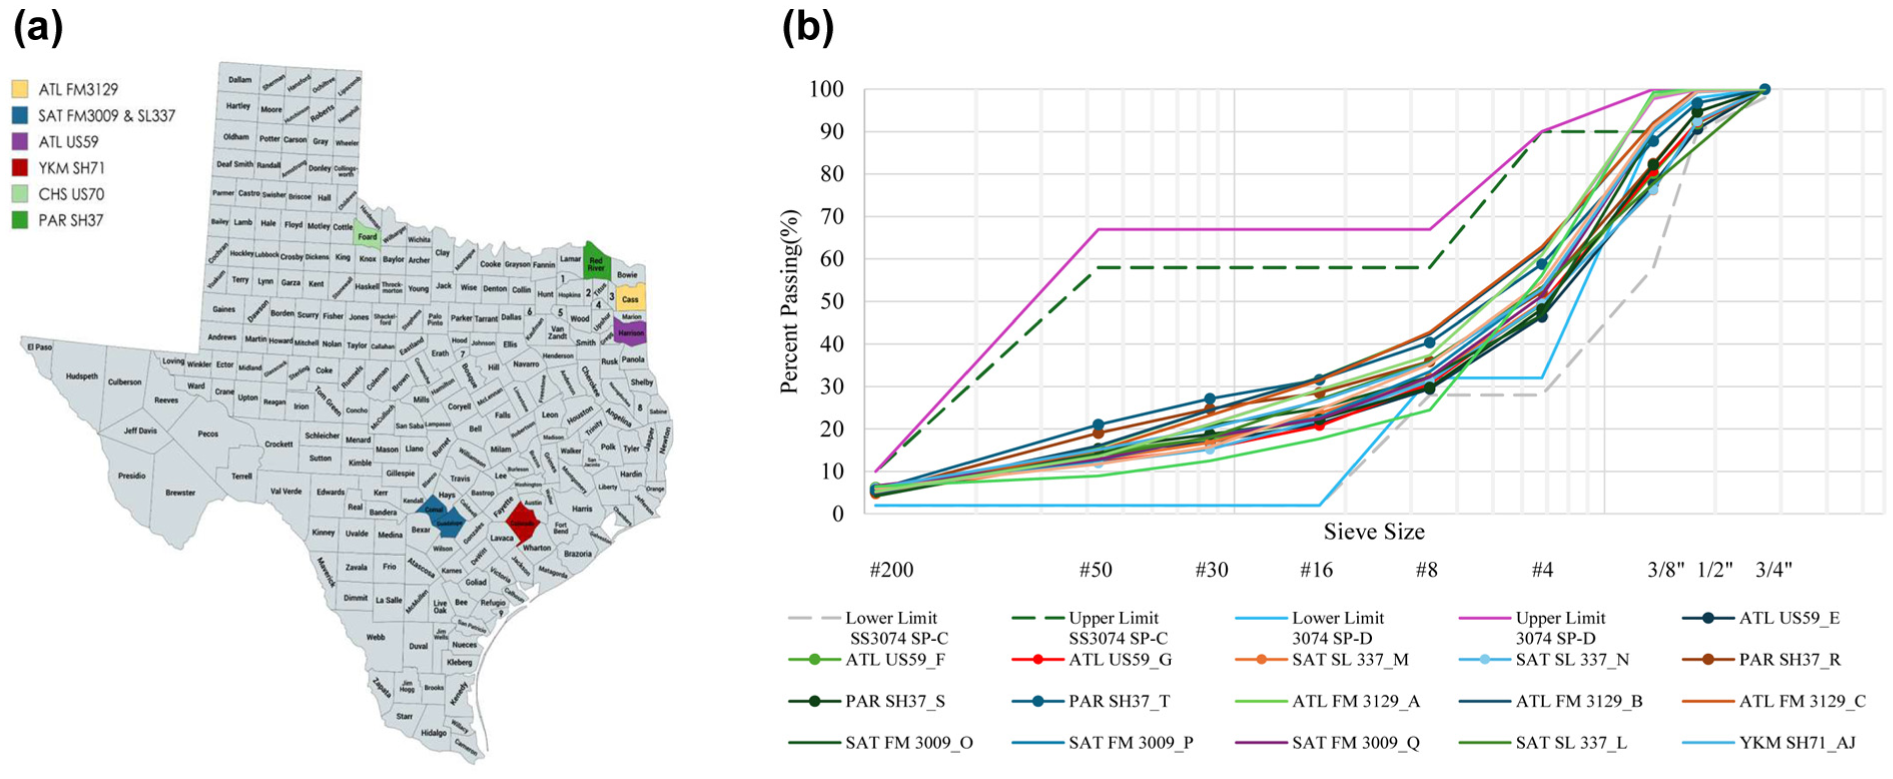
(a) Texas Department of Transportation (TxDOT) balanced mix design (BMD) field projects locations and (b) gradation of 15 TxDOT BMD mixtures.
At the time of this evaluation, the field sections had been in service for 3 to 6 years, with the highest traffic accumulated section experiencing approximately 6.07 million equivalent 18,000-lb single axle loads (MESALs). Traffic levels at these sites ranged from 234 to 32,825 average annual daily traffic (AADT), representing low to moderate traffic levels.
The CT Index and the CPR were measured on RPMLC specimens soon after construction for each field section (i.e., mixture). Rutting resistance was measured on RPMLC using the RT Index and the HWT test RD. Subsequent monitoring was performed annually to track the performance of each mixture. Field cracking was assessed using a measuring wheel and rutting was estimated using a 6-ft straight edge and a depth measuring device. Cracking (%lane) was used to quantify field cracking as defined in Equation 1. Cumulative degree days (CDD) was measured to account for both age and climate experienced by the pavement as defined in Equation 2 ( 12 ).

where
Crackinglong = longitudinal cracking (ft)
Crackingtrans = transverse cracking (ft)

where
Tdmax = daily maximum temperature, °F.
NCAT Test Track
Three field sections were constructed using Texas materials at the NCAT test track with gradation details displayed in Figure 2. Three mixtures including one volumetric mix design (S11) and two BMD mixtures (S10 and N6) were used in these sections. These field sections constructed at the NCAT test track were designed to compare a traditional TxDOT volumetric mix design with a mix design following the TxDOT special BMD specification (SS 3074). Some of the major additions to 3074 include, but not limited to, are allowance of up to 35% RAP and 35% RBR content only in surface mixtures, inclusion of IDEAL-CT and OT tests along with HWT in the mix design, reporting IDEAL-CT and OT test results along with HWT in production quality assurance by engineer, and so on. Initially, one control volumetric mix design and one experimental BMD mix design were constructed at the NCAT test track for the study. As the experiment progressed, a second BMD section was added to further evaluate changes in the BMD specification.
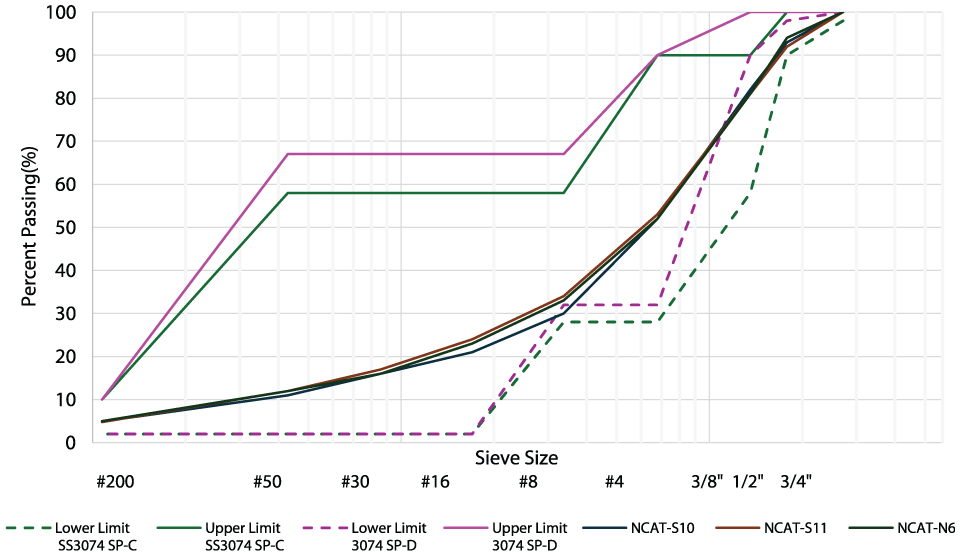
Gradation of three Texas Department of Transportation (TxDOT) mixtures on NCAT test track.
The test sections were trafficked by five loaded heavy haul class 8 semi-tractor-trailer-trucks at an accelerated rate of about 5 MESALs per year, allowing for comparisons of the performance of different mix designs under high traffic conditions ( 13 ). This high rate of trafficking helped identify how different mix designs hold up under repeated load traffic and how certain forms of pavement distress such as rutting and cracking, initiated and developed, providing valuable data for highway engineers and paving professionals. The condition of the pavement was analyzed and reported weekly, producing very precise results. At the time of this study, the first two field sections had been subjected to a total of 20 MESALs, while the latter BMD field section had been trafficked to approximately 10 MESALs.
WesTrack
The WesTrack project, originally constructed between 1994 and 1995, was a large-scale accelerated pavement testing experiment designed to evaluate the performance of asphalt mixtures under controlled conditions. The project featured multiple field sections with varying levels of air voids and asphalt content which are categorized as high, medium, and low for both parameters. These field sections were subjected to traffic loading, with the initial sections accumulating 1.5 MESALs before being replaced, and the subsequent replacement section receiving an additional 0.58 MESALs. At the project’s conclusion and throughout its life, key distress modes, including rutting and fatigue cracking, were thoroughly measured and analyzed ( 14 , 15 ). It is important to note that, although WesTrack’s design and performance are well documented, there remains some uncertainty about the exact failure mechanism, which likely involved a combination of high asphalt content, coarse gradation, reduced structural thickness, low dust-to-binder ratio, and other factors( 16 ).
For the current study, materials from the WesTrack project were obtained from the FHWA material reference library ( 17 ). However, one sand type used in the fine mixture was unavailable. To replace this missing sand, material was obtained from the original sand pit used during construction in 1995. This pit was still in operation, and based on gradation, the new sand was similar to the original material. Although materials likely changed over the years, the adoption of this material was still considered the best alternative. All aggregates were fractionated according to the sieve sizes listed in Table 2. This was particularly important for the sand replacement and extra care was taken to ensure nearly identical particle size distributions to the original material. These fractionated aggregates were then recombined in the exact proportions specified in the original mix design to create the combined gradation for the fine and coarse mixtures, as shown in Table 2. A washed sieve analysis was performed, and adjustments were made until the mix met the original design’s percent passing requirements—within ±1% on sieves ≥ #8 and ±0.5% on sieves < #8. LMLC test specimens were then prepared following the gradations listed in Table 2. Specimens were produced at optimum asphalt content (OAC), high asphalt content (OAC+0.7%), and low asphalt content (OAC–0.7%) for both Fine and Coarse mixtures to match the original test track parameters ( 14 ) Air void content was targeted at 7%±0.5% for all laboratory specimens.
WesTrack Mixture Gradations
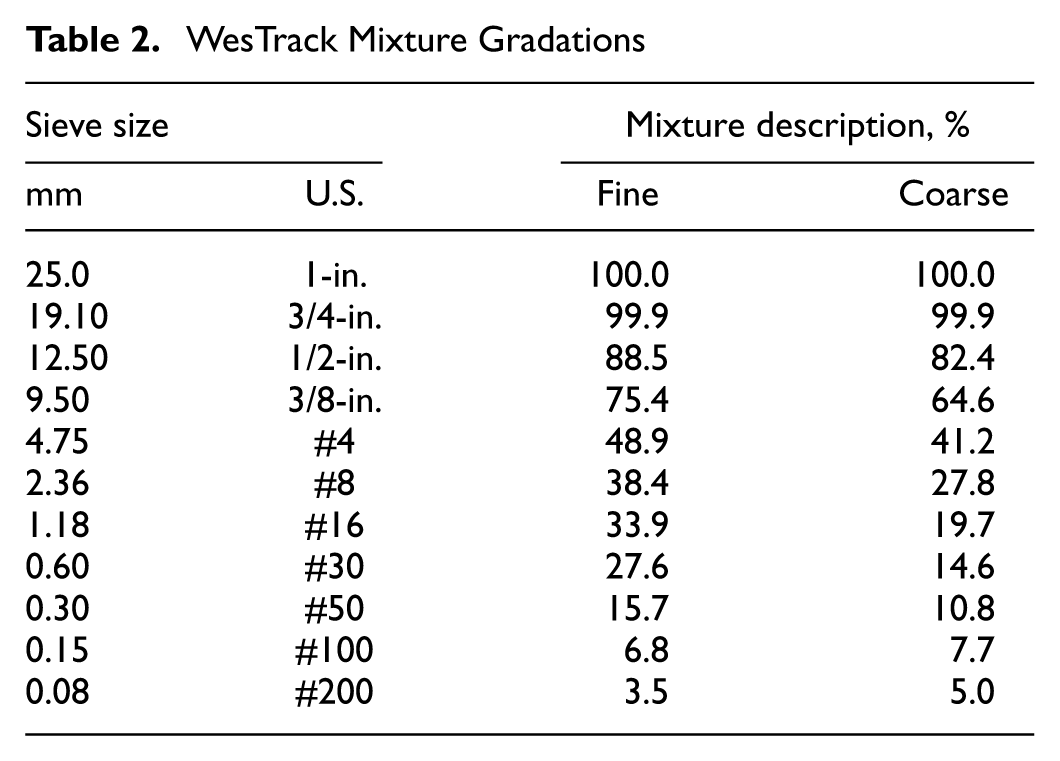
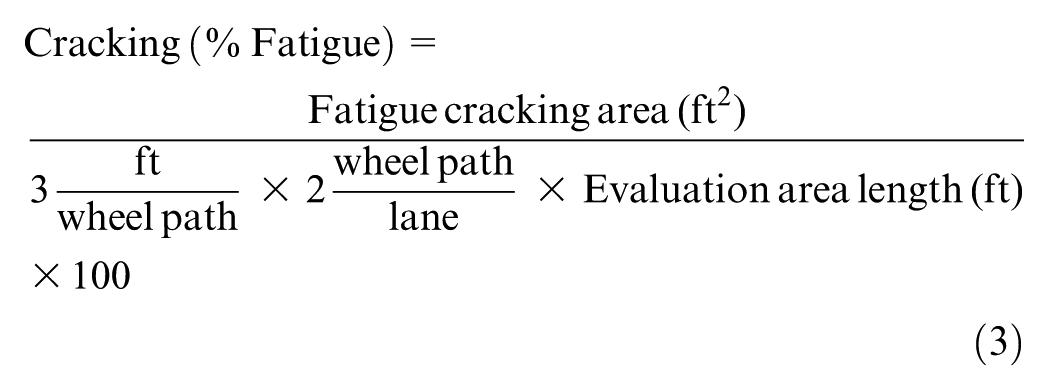
OAC for fine and coarse were 5.4%, 5.7% respectively and the high and low binder contents were ± 0.7% of OAC. Rutting and cracking field performance data was collected for the project from NCHRP Report 455 ( 14 ), percent fatigue cracking is defined in Equation 3.
The WesTrack gradations are plotted against the TxDOT Superpave (SP) mixtures SP-C and SP-D limits in Figure 3. SP-C and SP-D are the mix designs used in Texas for the Superpave specification as well as the special BMD specification. Neither the fine nor the coarse mixtures met the SP-C or SP-D gradation requirements ( 7 ). This is important to note as neither of these mixtures could be constructed using the TxDOT special BMD specification. However, the comparison between these two mixtures and their tie to performance test results can still yield valuable data and inform TxDOT BMD development.
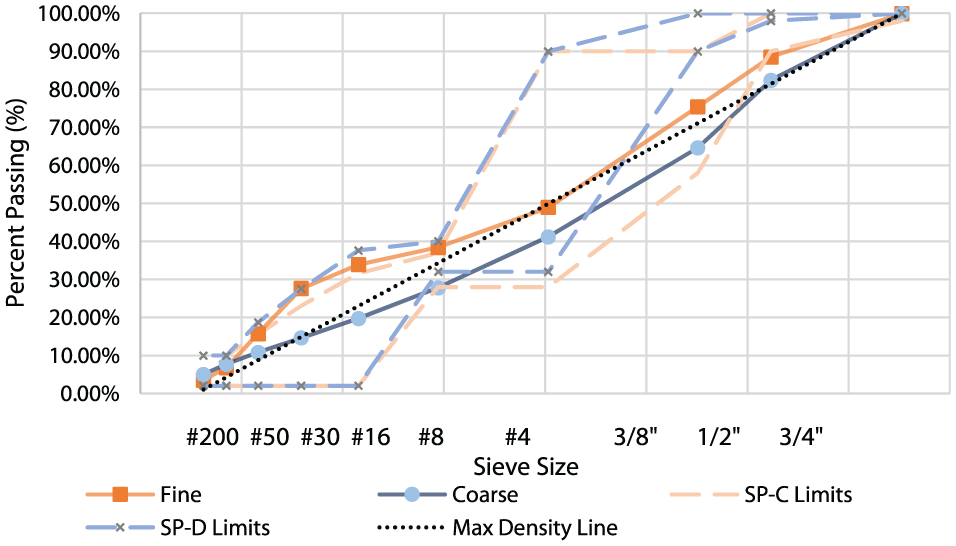
WesTrack gradations versus Texas Department of Transportation (TxDOT) SP-C and SP-D gradation requirements.
The objective was to apply current and emerging cracking and rutting performance tests (IDEAL-CT, IDEAL-RT, HWT test, and OT) to these materials and compare them with past performance evaluations. TTI researchers replicated the original fine and coarse mixtures at high, medium, and low asphalt content levels, ensuring a direct comparison between historical and current/emerging performance test results. By reassessing WesTrack materials with more modern testing protocols, this effort aimed to bridge the gap between traditional volumetric-based mix designs and newer performance-driven BMD approaches.
Performance Results
TxDOT BMD Field Performance
During annual monitoring activities, cracking was observed in several field section mixtures within the ATL FM 3129, PAR SH 37, YKM 71, and CHS US 70 field projects. Although these projects are still in the early stages of service life, analyzing their data provides valuable insights. The overall CT Index test results of RPMLC mixtures were compared with the extent of field cracking as presented in Figure 4. A forensic analysis found reflection cracking to be the primary distress across the four dense-graded test sections on PAR SH 37. The amount of cracking correlated strongly with construction CT Index performance, with higher CT Index values associated with less cracking. This suggests that, for mixtures with similar gradations, higher CT Index values offer better resistance to reflection cracking. Further details are published in Leavitt et al. (2024) ( 5 ).
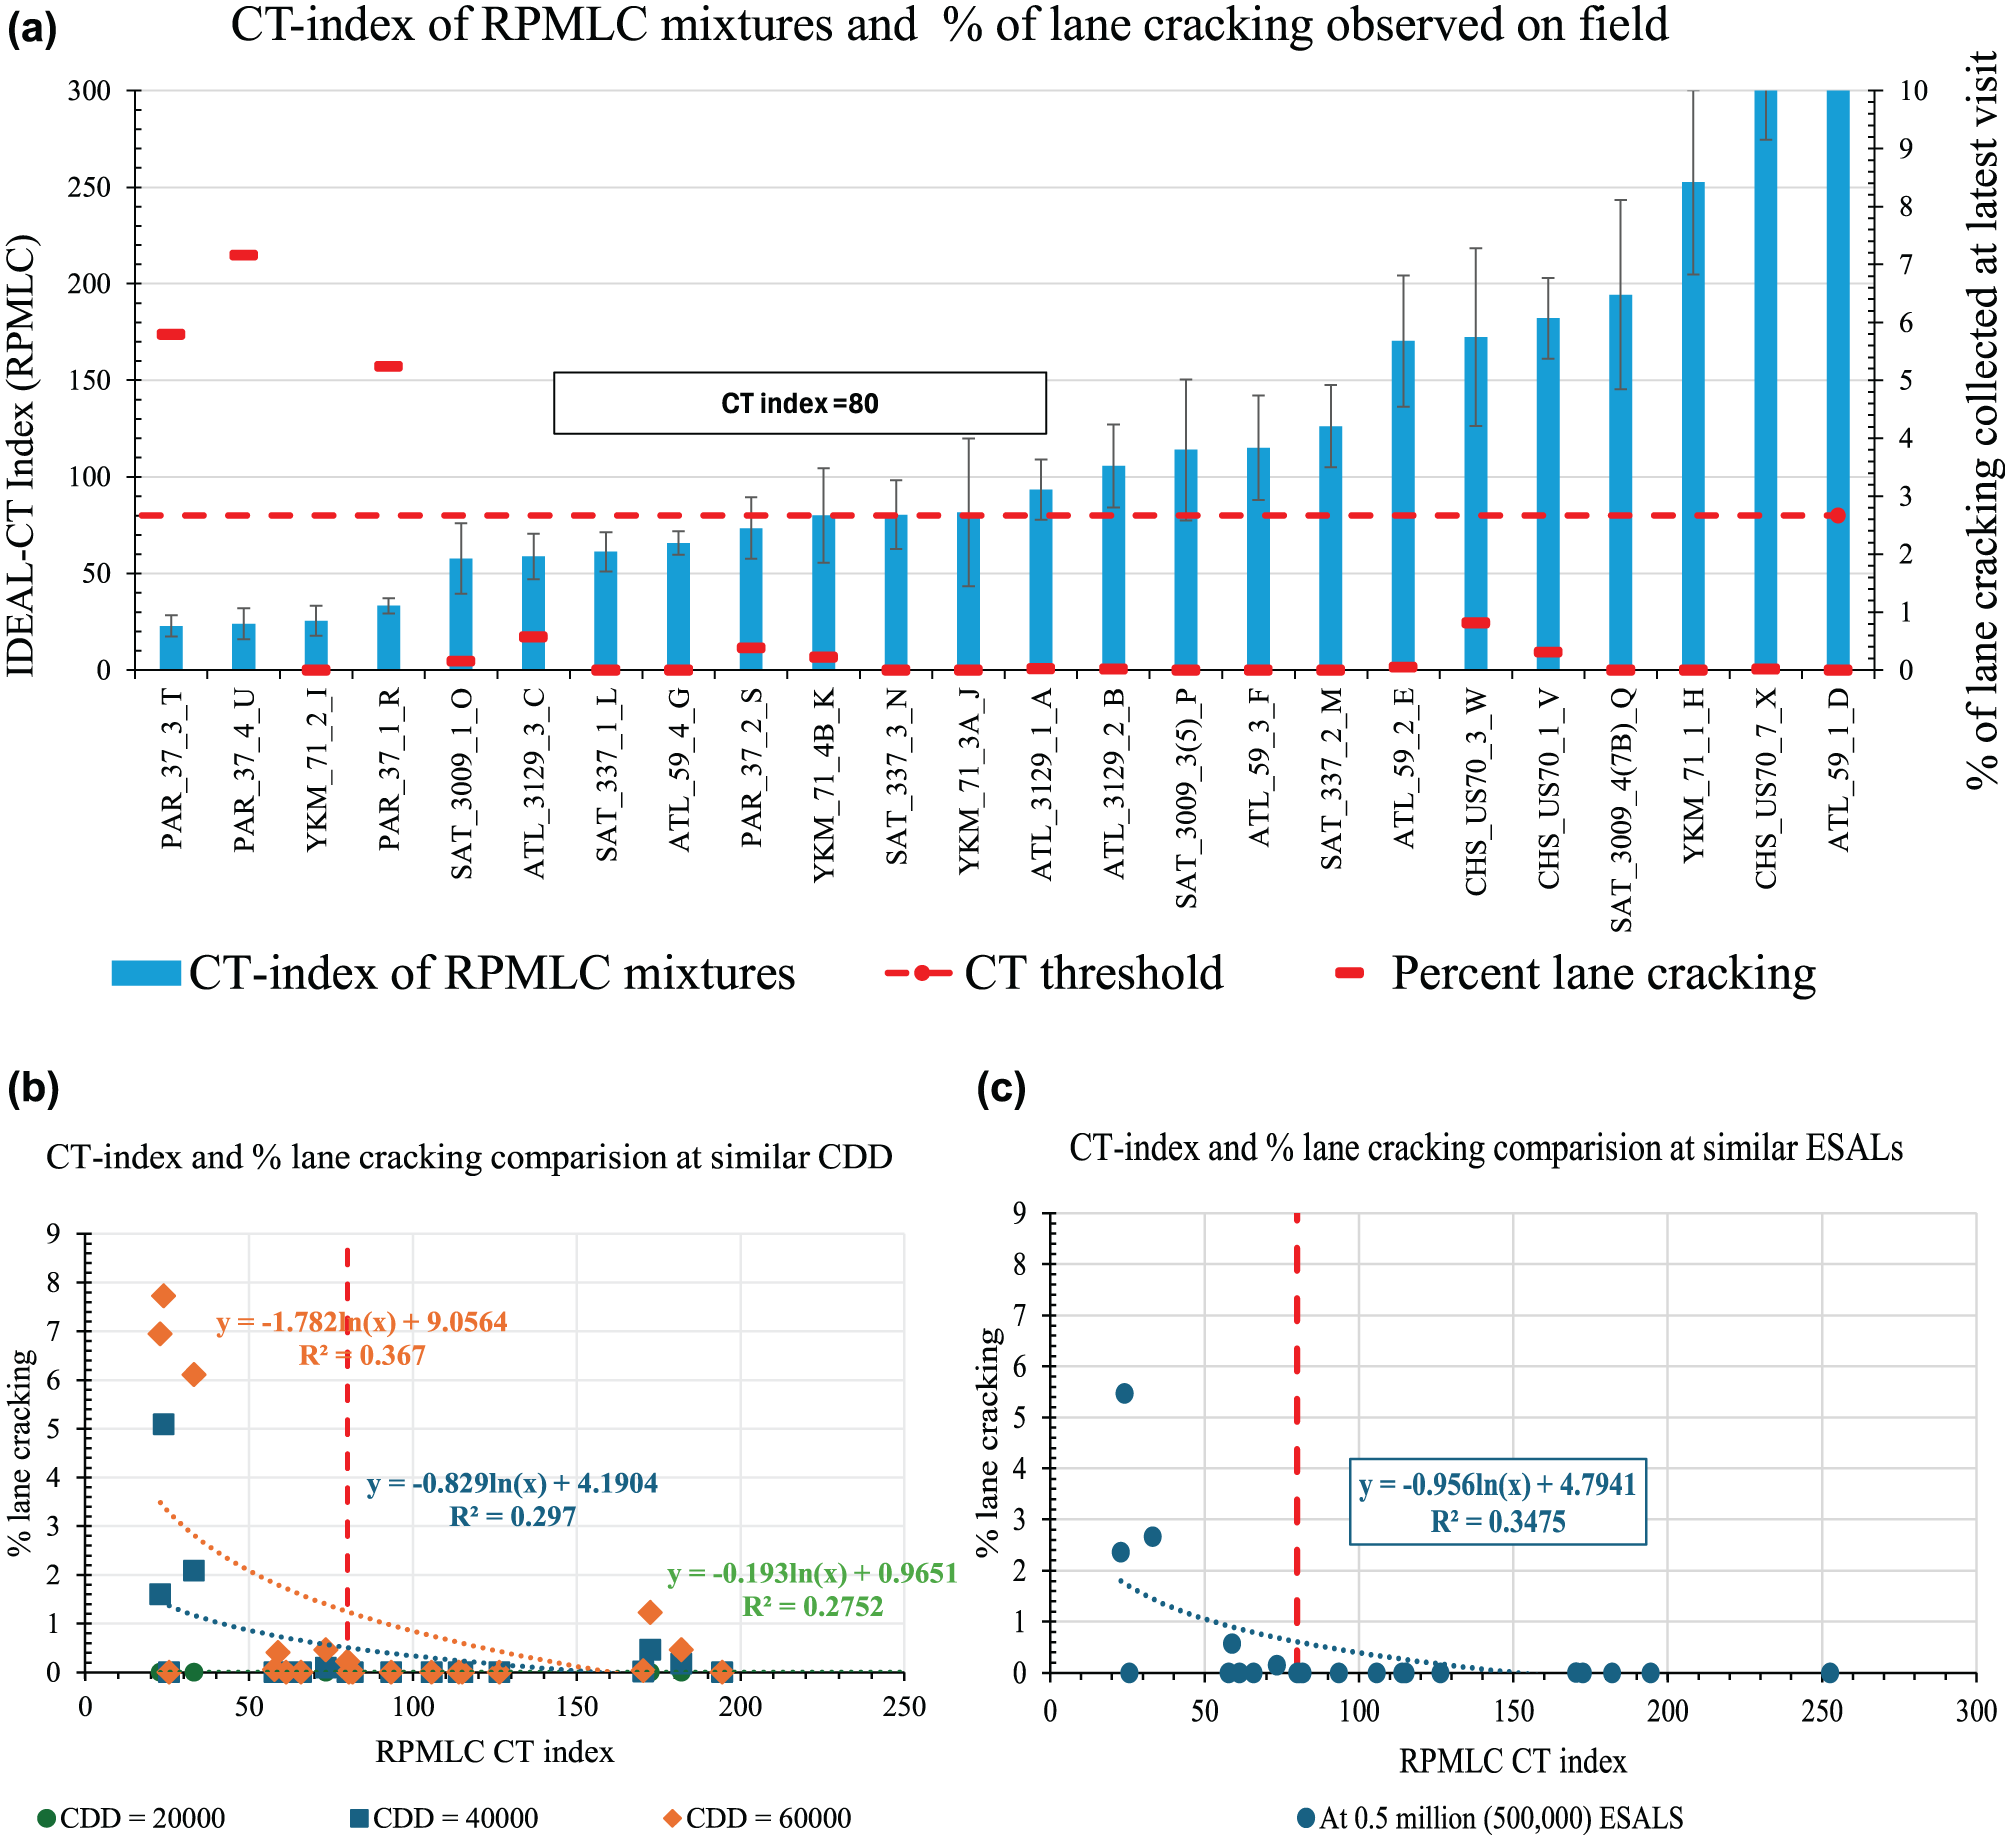
Fall 2019–Summer 2022 Texas Department of Transportation (TxDOT) balanced mix design (BMD) reheated plant-mixed laboratory-compacted (RPMLC) cracking tolerance index (CT Index) results with (a) latest field cracking data, (b) field cracking data at equivalent cumulative degree days (CDDs), and (c) field cracking data at similar equivalent single axis loads (ESALs).
Notably as seen in Figure 4a, all the mixtures exhibiting field cracking greater than 5% have a CT Index lower than 80, which is the preliminary minimum acceptance threshold for TxDOT. However, the values are plotted as obtained from the latest site visit, which does not necessarily capture the differences in traffic or aging levels between the field sections. As a result, Figure 4, b and c , were developed to normalize the effect of aging and traffic by scaling the field cracking at similar CDDs (20,000, 40,000, and 60,000) and ESALs (0.5 million), respectively. Few field sections that did not reach the selected CDD and ESAL levels were not included in the analysis. From Figure 4b, at 20,000 CDD almost all the sections experienced minimal cracking, establishing poor correlation between RPMLC CT Index and early field cracking. However, with the evolution of CDD from 20,000 to 60,000, the R-squared value between the % lane cracking and the RPMLC CT Index increased from 0.27 to 0.36 indicating the potential of CT Index in distinguishing mixtures prone to cracking at long term field aging. Further severe field cracking is noticed predominantly in the case of mixtures with CT Index less than 80, while mixtures with CT Index greater than 80 experienced minimal to no cracking. This is a good step toward long-term field validation of the IDEAL-CT test and the CT Index threshold.
Figure 5a represents the OT CPR test results of RPMLC mixtures with observed % lane cracking. PAR 37 sections experienced the highest field cracking among all field projects and interestingly two of these mixtures also have CPR result closer to 0.45, which is the current maximum CPR threshold for TxDOT. This indicates the mixtures with CPR results above the listed thresholds were more likely to experience early life cracking distress. As anticipated, when the results are normalized with equivalent CDDs and ESALs as seen in Figure 5, b and c , the RPMLC CPR values exhibited proper correlation with field cracking. However, the current maximum CPR threshold of 0.45 seemed to be only partially successful in flagging the crack susceptible mix designs, as mixtures with CPR values below the recommended threshold of 0.45 experienced notable field cracking. This led to an interesting observation that the current required CT Index criteria is more efficient than the maximum allowable CPR value in flagging crack susceptible mixtures with these materials.
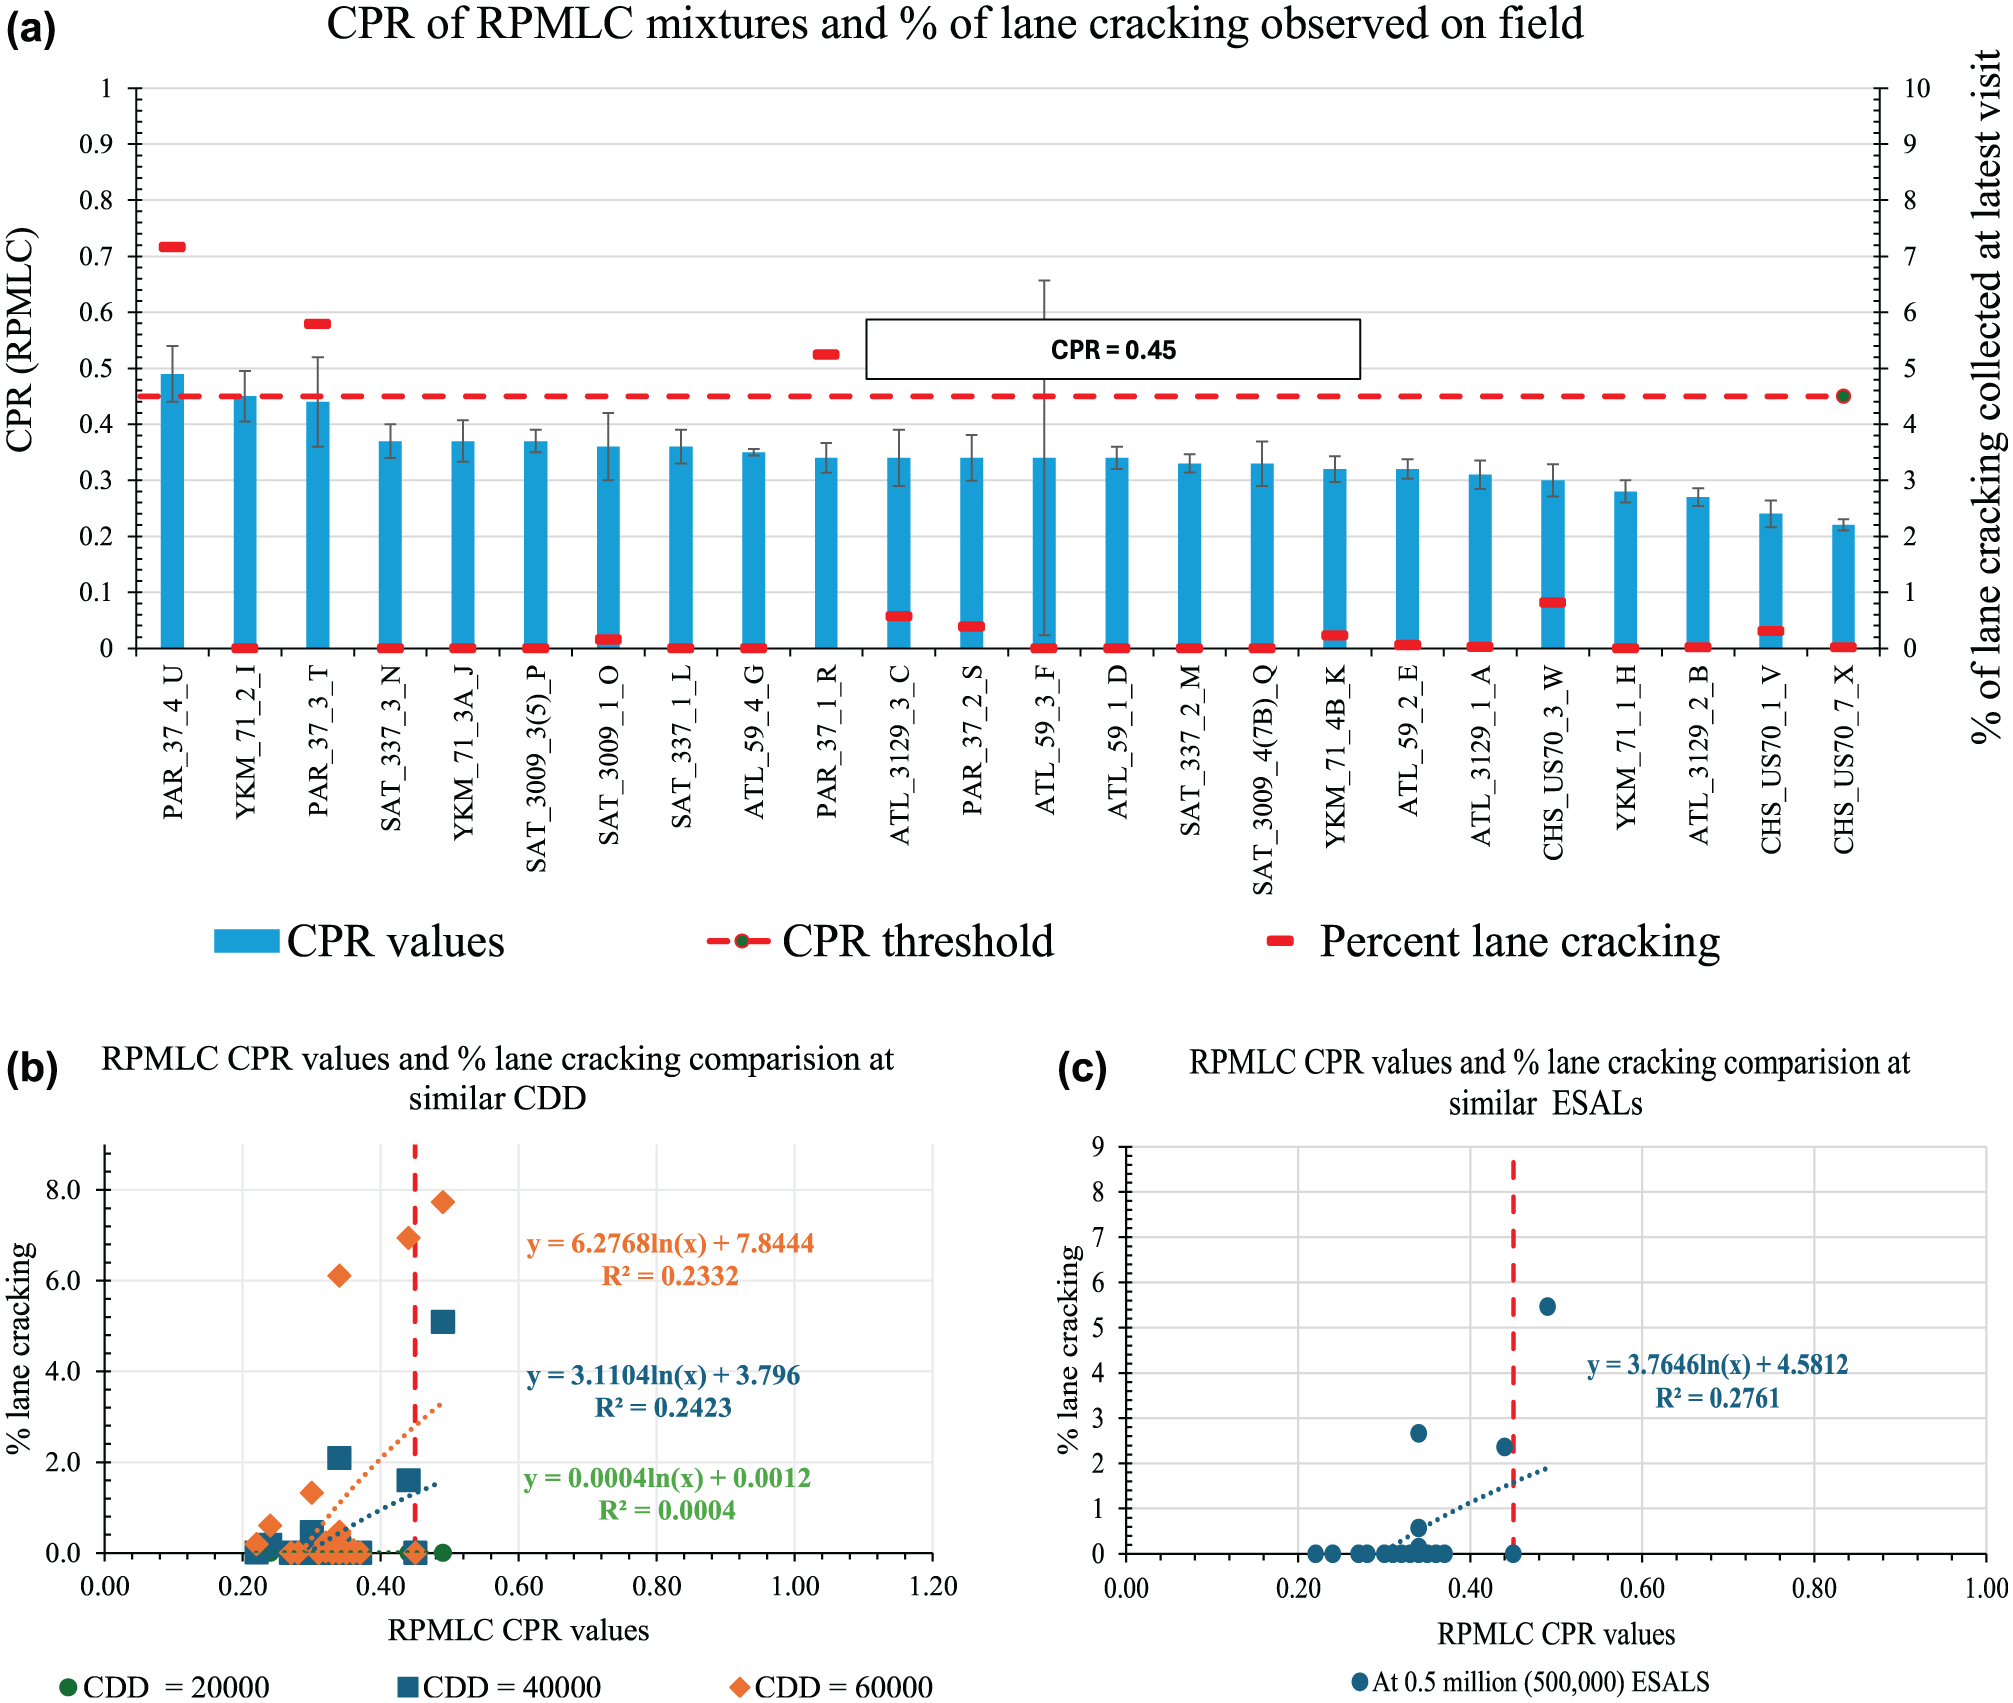
Fall 2019–Summer 2022 Texas Department of Transportation (TxDOT) balanced mix design (BMD) reheated plant-mixed laboratory-compacted (RPMLC) crack propagation rate (CPR) results with (a) latest field cracking data, (b) field cracking data at equivalent cumulative degree days (CDDs), (c) field cracking data at similar equivalent single axis loads (ESALs).
TxDOT BMD mixtures have demonstrated minimal rutting in the field (<0.3 in.), this is likely owing to all mixtures being designed to meet the HWT requirement (12.5 mm maximum rut depth at 20,000 passes), and most mixtures having rut depths less than 5 mm. Figure 6a presents the comparison of RT Index values obtained from RPMLC specimens versus the observed field rutting. Although the field projects have been in service for varying durations. The RT Index values varied from 50 to 120 and field rut depths varied between 0 to 0.3 in. Even at such low rutting levels, when the sections were normalized at 20,000 CDDs as seen in Figure 6b, the RT Index had a decent negative correlation with field rut depth. In addition, field rut depths were identified to be higher in sections that had lower RT Index values. When the data was normalized based on ESALs as shown in Figure 6c, there was a better negative correlation between field rut depth and RT Index. This demonstrates the potential of the IDEAL-RT test in identifying rut resistant mixtures. However, further monitoring is required to confirm this conclusion.
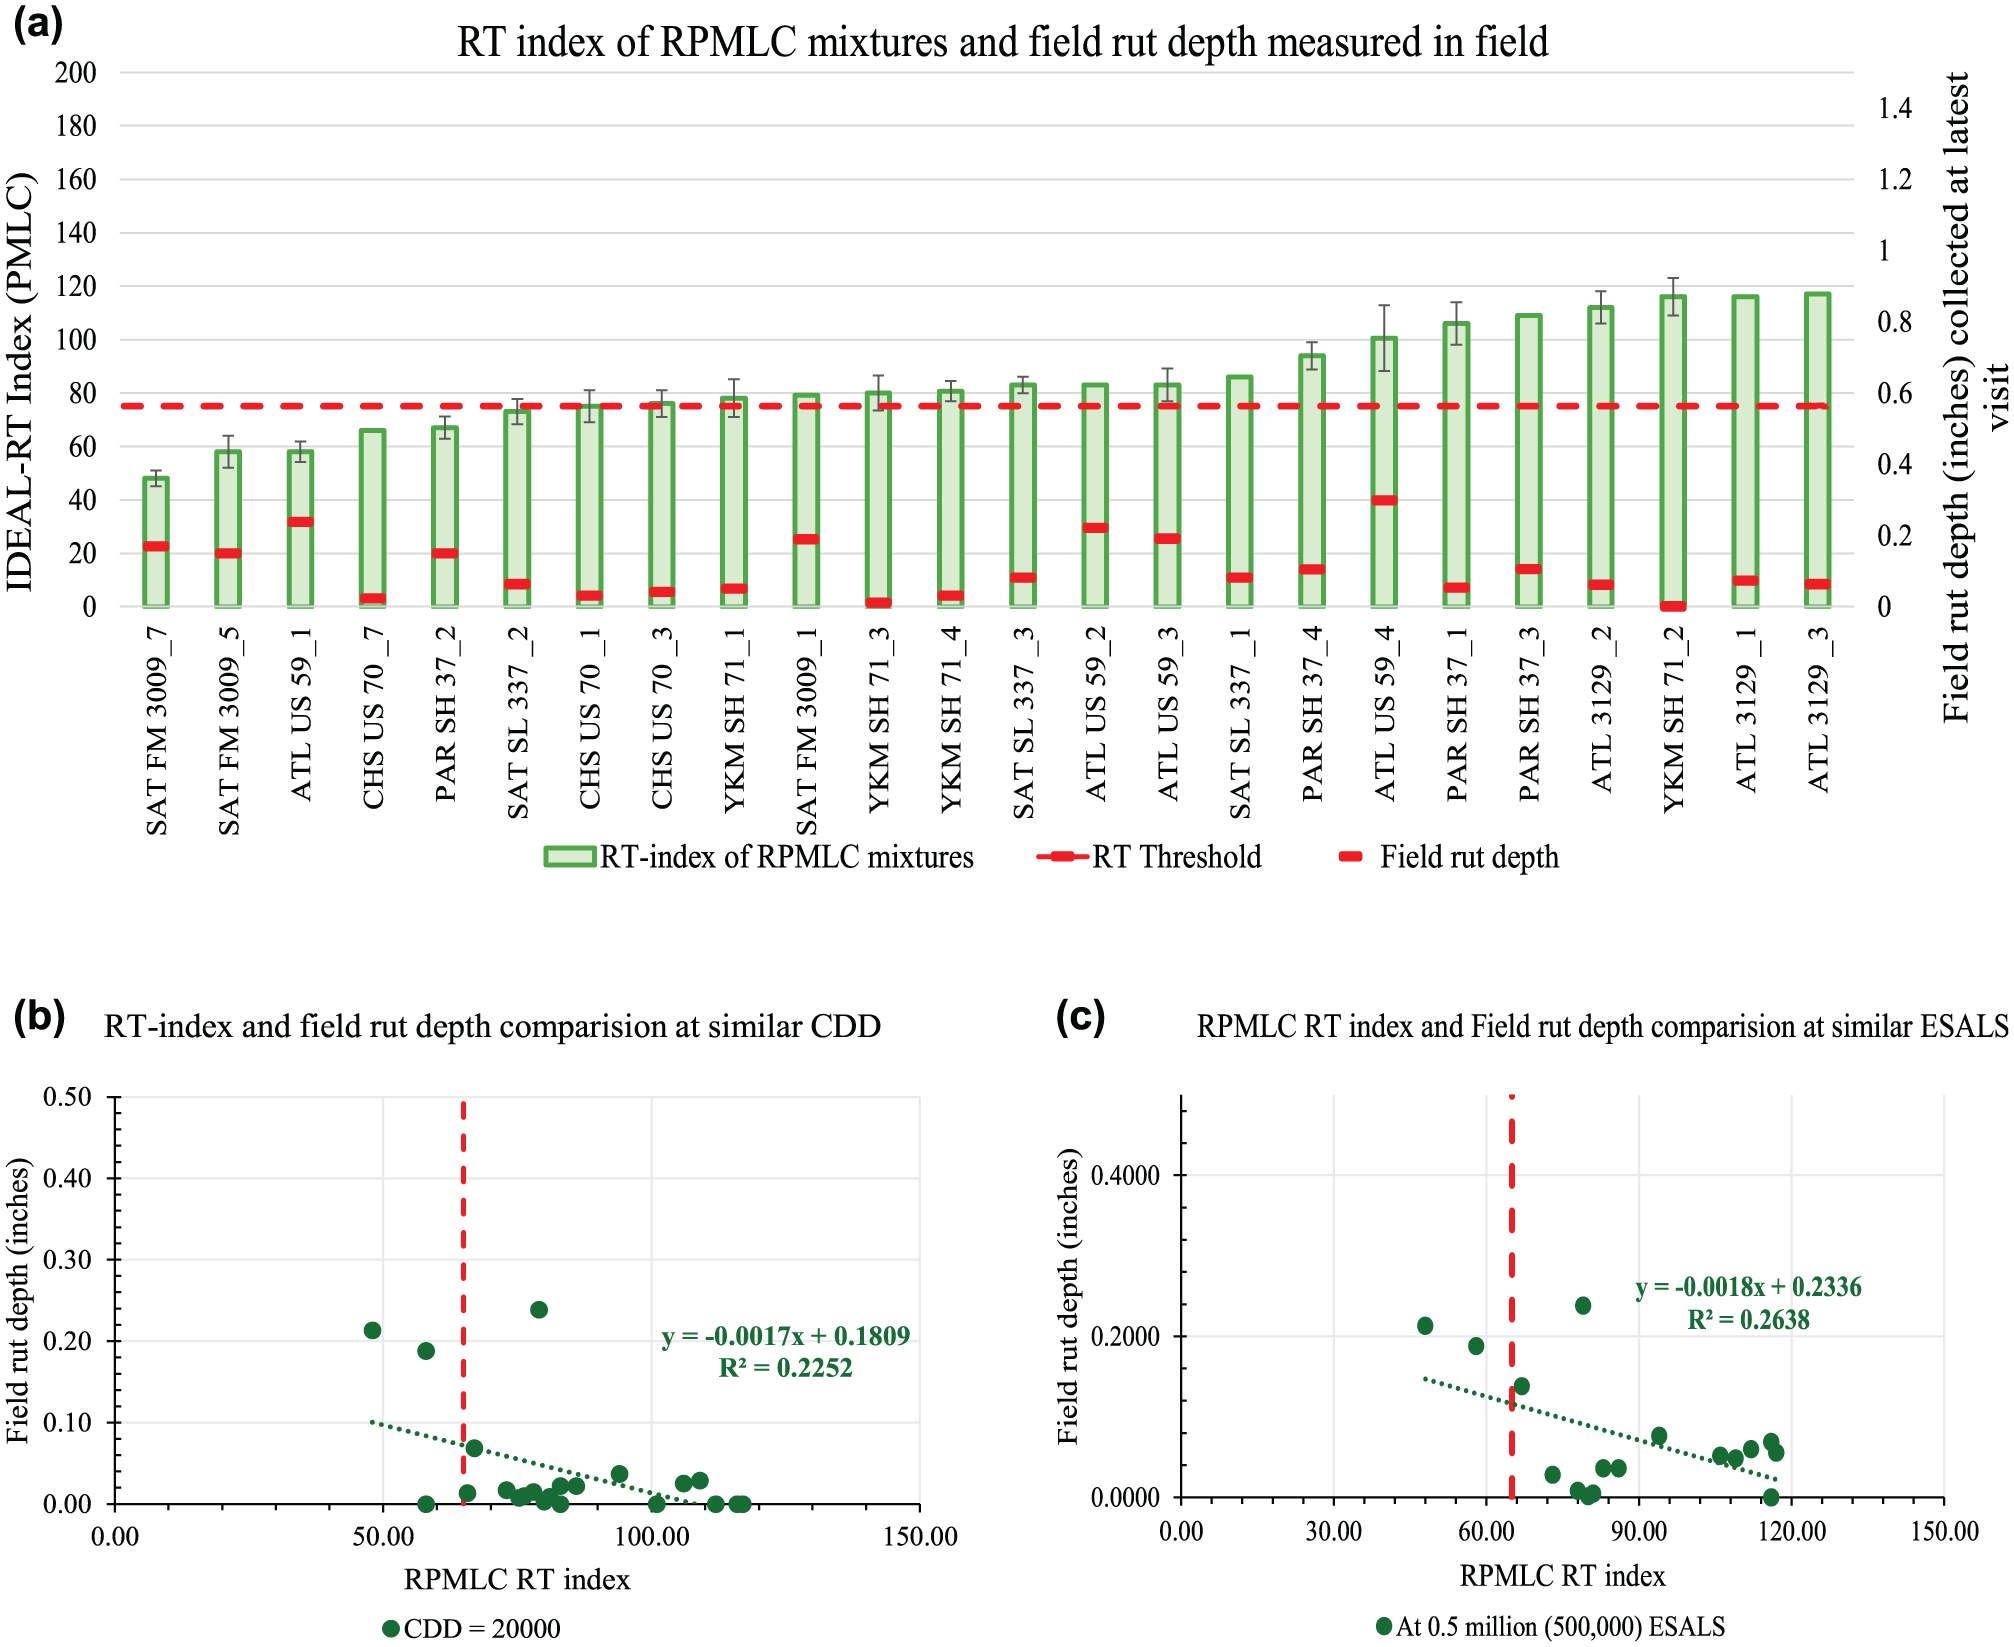
Fall 2019–Summer 2022 Texas Department of Transportation (TxDOT) balanced mix design (BMD) reheated plant-mixed laboratory-compacted (RPMLC) IDEAL-rutting test (IDEAL-RT) results with (a) latest field rut depth, (b) field rut depth at equivalent cumulative degree days (CDDs), and (c) field rut depth at similar equivalent single axis loads (ESALs).
Similar to RT Index, Figure 7 presents the comparison of the HWT test rut depth values obtained from RPMLC specimens versus the observed field rutting. Owing to how relatively close the rut depths are, the HWT test results lack proper correlation with the measured field rut depths, in contrast with what was observed between the RT Index versus measured field rut depths (Figure 6, b and c ). However, employing the HWT test as mix design tool appears to be successful in obtaining rut resistant mixtures.
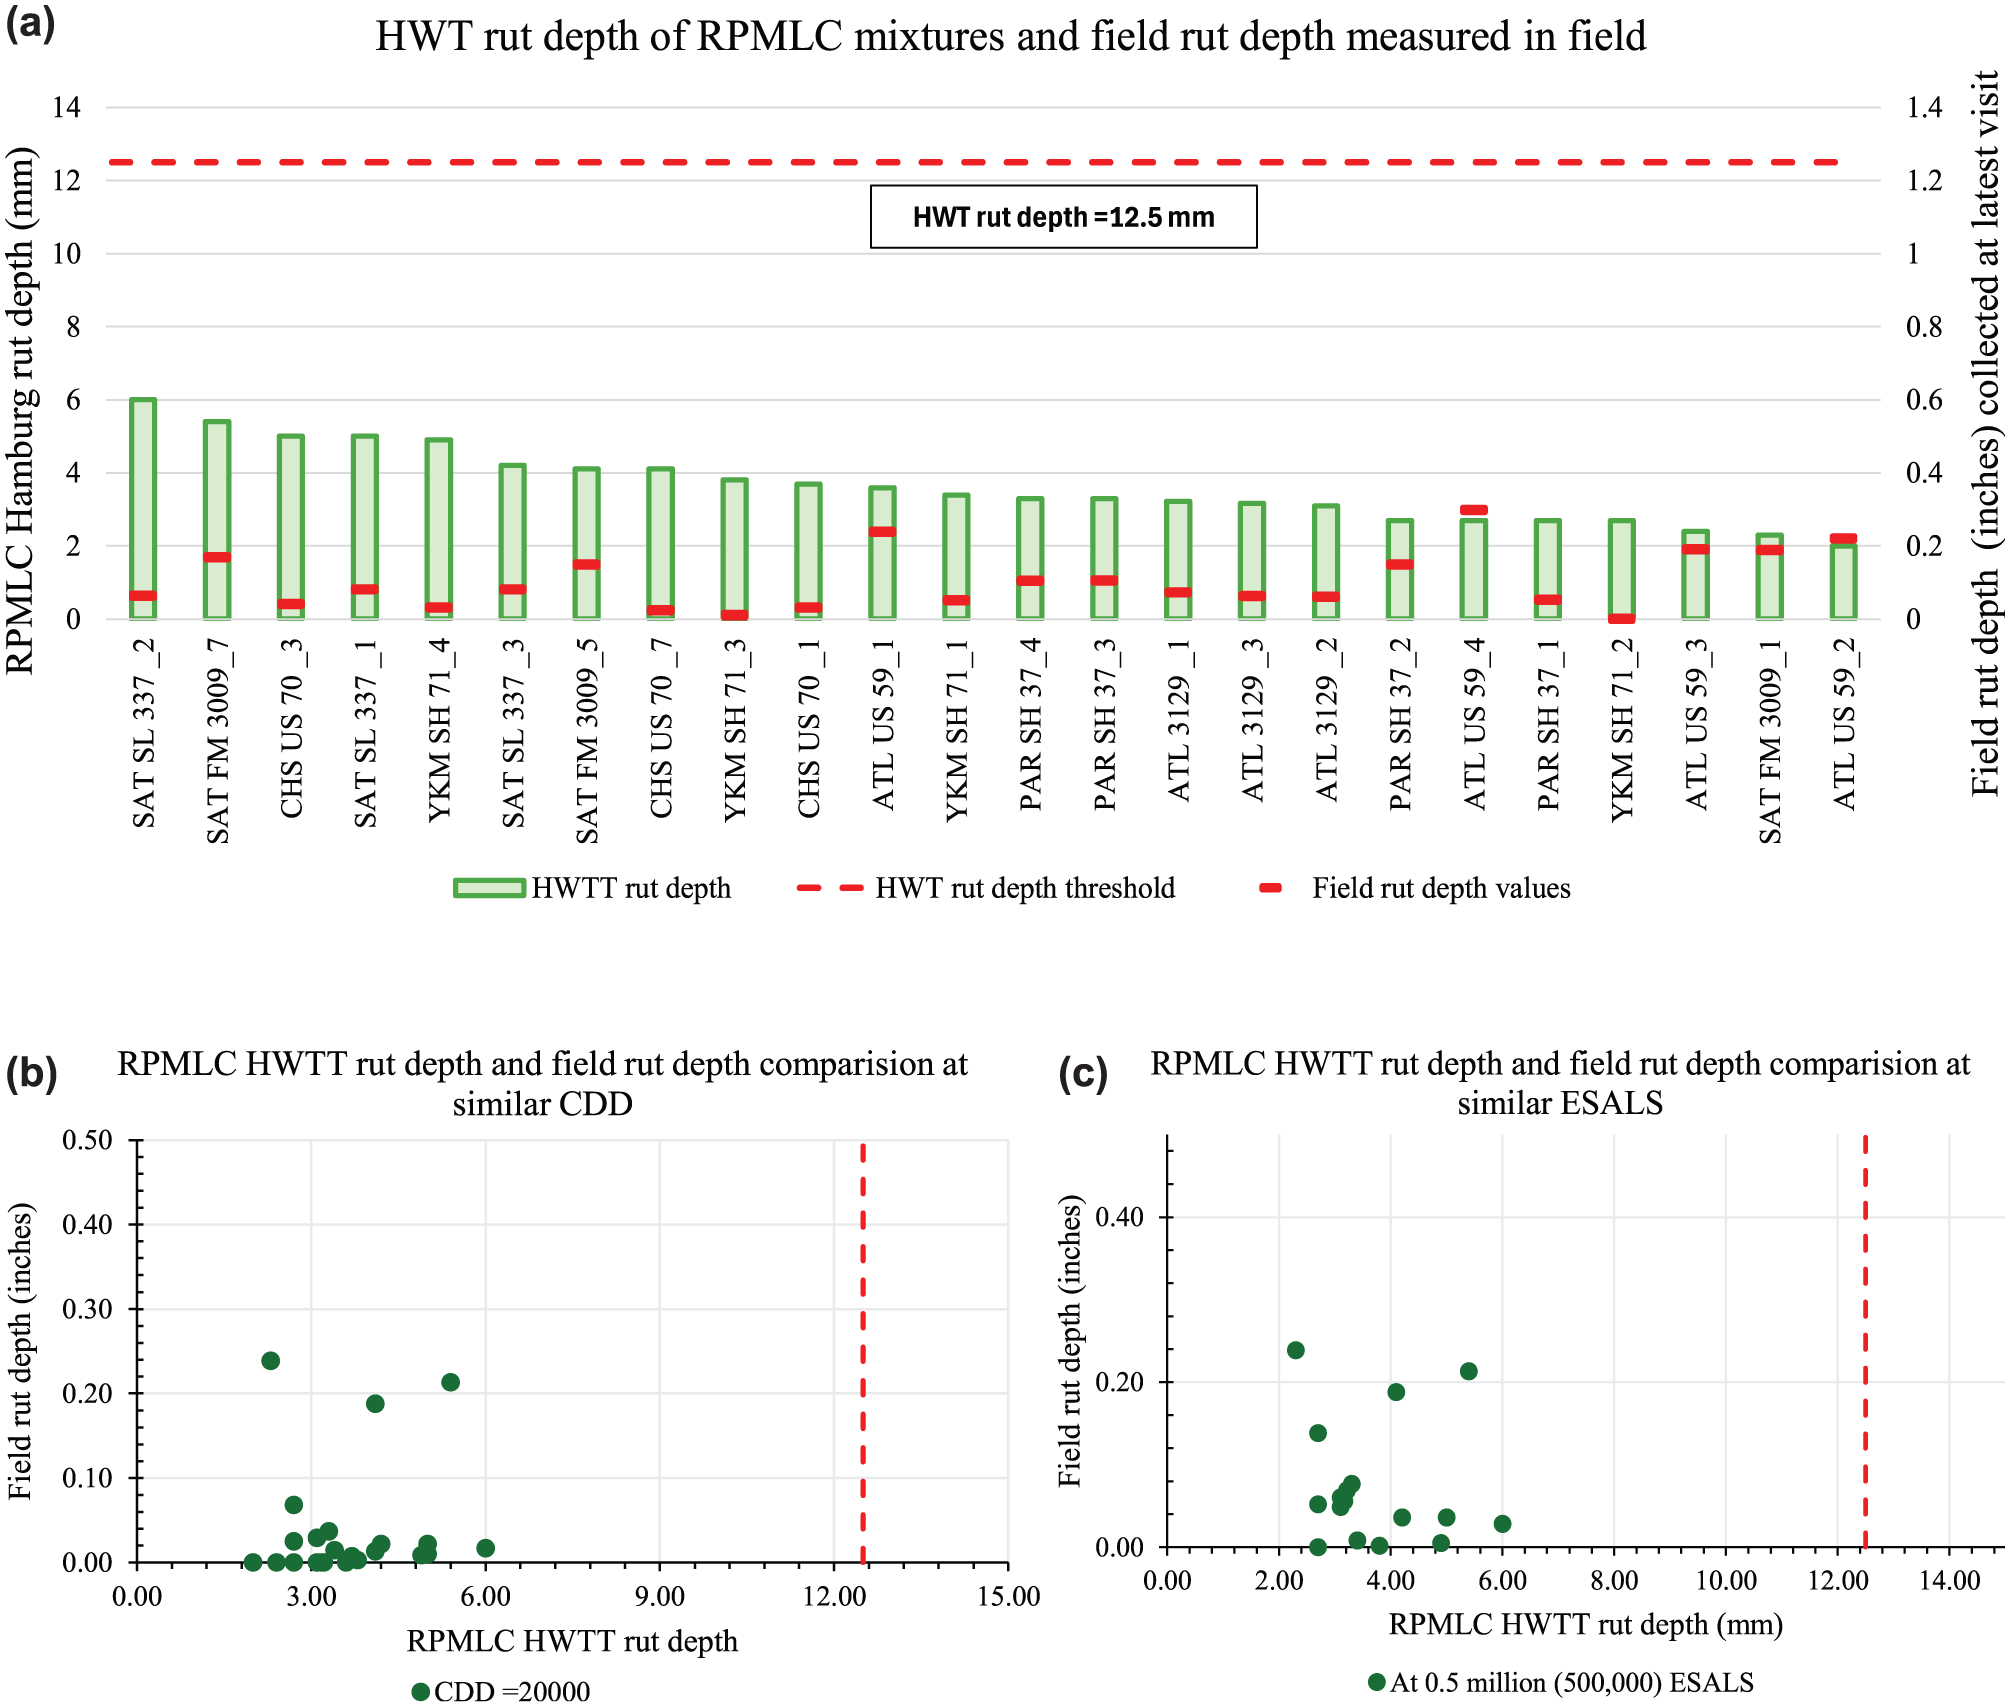
Fall 2019–Summer 2022 Texas Department of Transportation (TxDOT) balanced mix design (BMD) reheated plant-mixed laboratory-compacted (RPMLC) Hamburg wheel tracking test (HWTT) rut depth results with (a) latest field rut depth, (b) field rut depth with equivalent cumulative degree days (CDDs), and (c) field rut depth with similar equivalent single axis loads (ESALs).
NCAT Test Track Performance
TxDOT contracted NCAT to construct three test sections on their test track using Texas materials and mix designs. Including a standard volumetric mix design (Volumetric), a BMD meeting OT and HWT test requirements (BMD A) and a BMD meeting OT and HWT test requirements but with a lower CT Index and a higher CPR value (BMD B). The IDEAL-CT was performed for informational purposes only (not used as a criteria for mix design). Table 3 shows the laboratory performance results for these three mixtures. These tests are all RPMLC specimens.
NCAT Laboratory Performance Testing
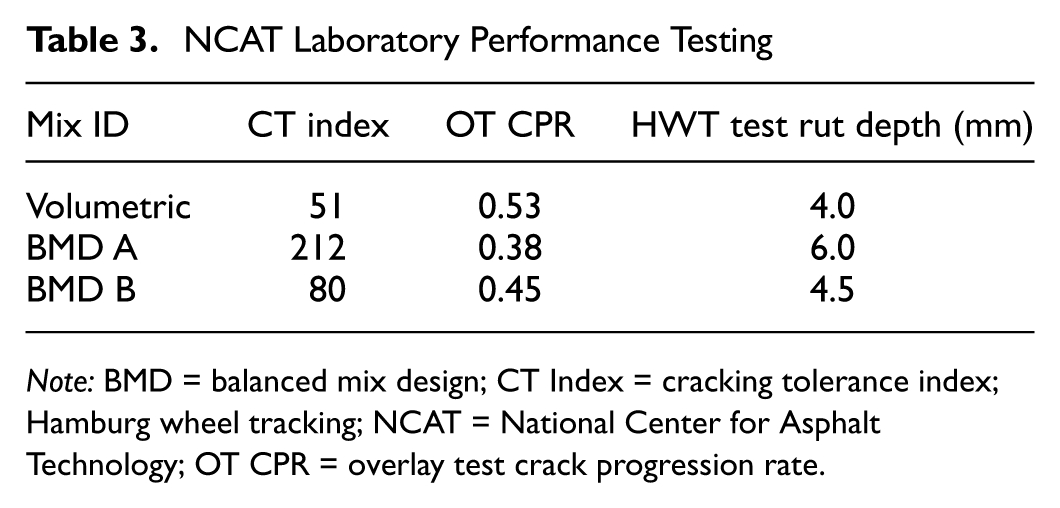
Note: BMD = balanced mix design; CT Index = cracking tolerance index; Hamburg wheel tracking; NCAT = National Center for Asphalt Technology; OT CPR = overlay test crack progression rate.
The test sections were then subjected to accelerated traffic loading and cracking and rutting performance monitored weekly. Performance of the test sections versus accumulated traffic (MESALs) was recorded. Figures 8 and 9 show the amount of cracking and rutting respectively, a point was graphed every 4 MESALs.
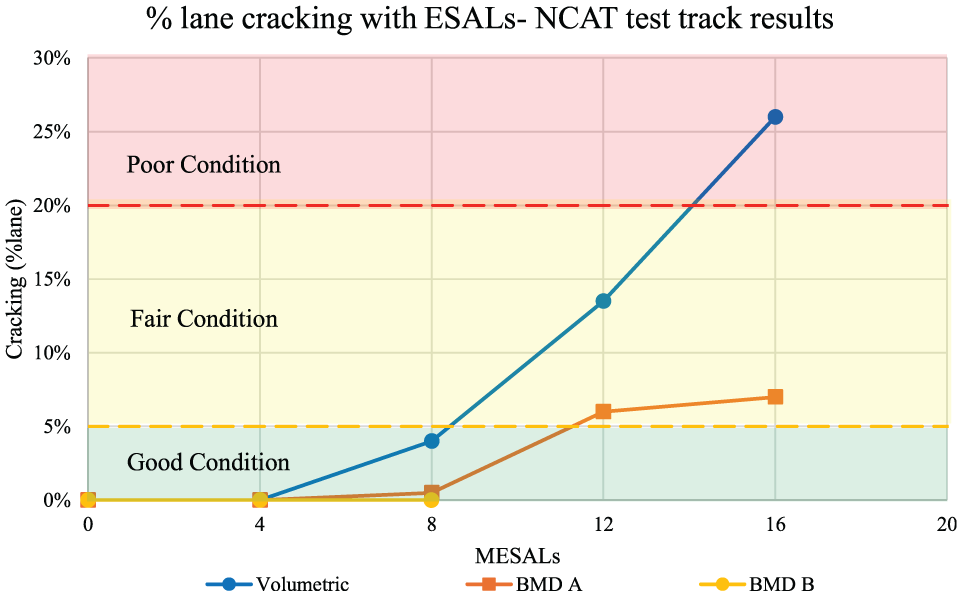
NCAT test track cracking (%lane) versus million equivalent single-axle loads (MESALs).
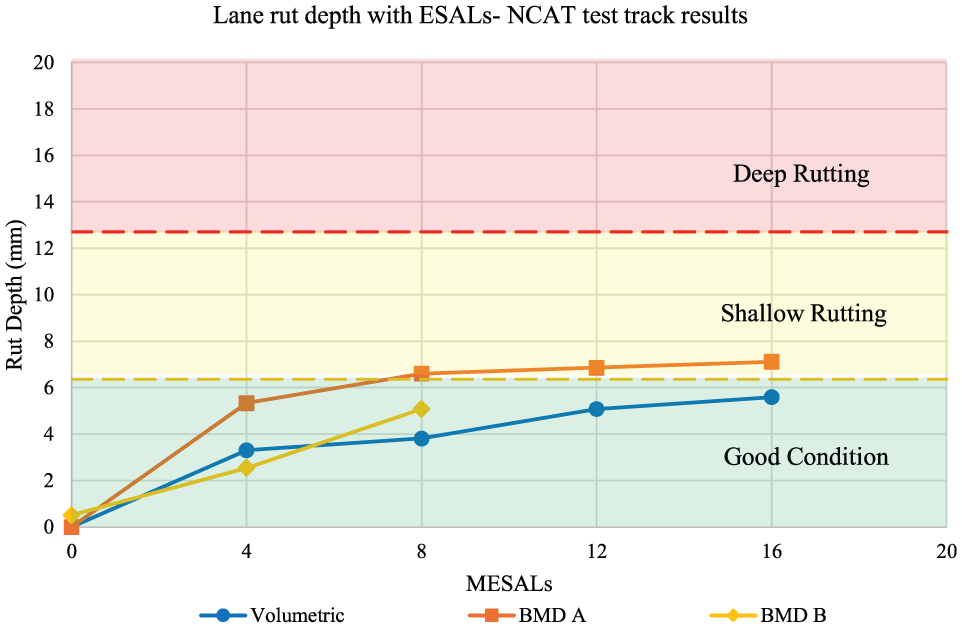
NCAT test track rutting (mm) versus million equivalent single-axle loads (MESALs).
Findings from this study indicate that both mixtures BMD A and BMD B exhibited significantly higher cracking resistance in the field compared with the Volumetric mixture. The Volumetric mixture was removed from service at approximately 16 MESALs owing to excessive cracking, whereas BMD A remained in serviceable condition after 20 MESALs. At the time of this study, BMD B had been subjected to only 10 MESALs but was already outperforming the Volumetric mixture and slightly outperforming the BMD A mixture at the same traffic level. It is expected that the BMD A mixture will show better cracking performance than the BMD B mixture, this will be evaluated in the future when more data is available. These results provide strong confidence in TxDOT’s BMD methodology and its effectiveness in enhancing cracking resistance.
With respect to rutting, all three mixtures demonstrated good performance, with the Volumetric mixture exhibiting slightly better field performance than the BMD mixtures. This further reinforces confidence in the effectiveness of the HWT test in yielding rutresistant mixtures.
WesTrack Performance
Actual percent fatigue cracking from the original WesTrack data was compared with the LMLC CT Index obtained in this study as shown in Figure 10. Less fatigue cracking occurred as binder content increased in both fine (Figure 10a) and coarse mixtures (Figure 10b) with no cracking in both high AC mixtures. As expected, the CT Index increased with higher AC when examining fine and coarse mixtures separately. However, CT Index values were significantly higher for the coarse mixtures despite their lower actual cracking resistance. This indicates that changes in gradation have a pronounced effect on the CT Index and appear to influence the test results. A CT Index threshold of 80 would have eliminated the poor performing coarse low AC mixture, but it would also have eliminated all the good performing fine mixtures. These mixtures were not designed using Texas standards or materials, and do not conform to the aggregate gradation requirements (Figure 1b) making a direct comparison more difficult. But it is important to note the effect that gradation has on CT Index results.
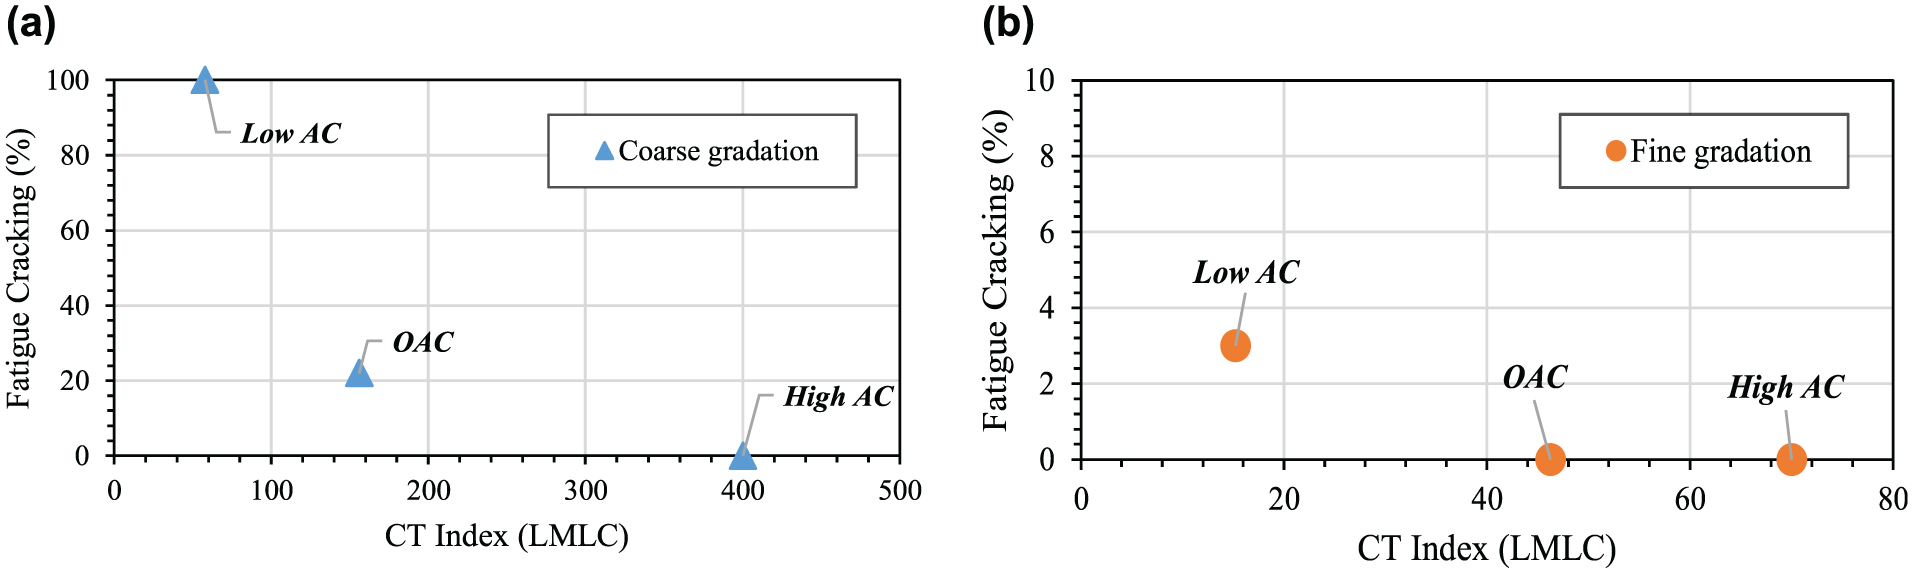
WesTrack 2024 IDEAL-CT results versus 1995 fatigue cracking performance: (a) coarse mixture and (b) fine mixture.
The actual percent fatigue cracking from the original WesTrack data was compared with the LMLC CT Index results from this study, as shown in Figure 10. For both mixture types, fatigue cracking decreased with higher AC, with no cracking observed in the high-AC mixtures. As expected, the CT Index increased with higher AC; however, the results were not directly comparable between mixtures in this study. Changes in gradation had a significant impact on CT Index, appearing to shift the results higher for coarser mixtures. Based on these results it is very important that CT Index thresholds are employed only for mixtures with certain aggregate gradations to draw meaningful field correlations.
Similar to the IDEAL-CT testing, the Texas OT showed the coarse mixture had higher expected cracking resistance as compared with the fine mixture as shown in Figure 11a. This is the inverse of what was seen in the field performance, possibly owing to differences in factors such as effective binder content, actual field gradation and structural thickness. Also, the test results indicate that gradation plays a large role in the Texas OT CPR results. The HWT test results indicated a lack of rutting resistance in both mixtures as shown in Figure 11b. The highest HWT RD was seen on the fine mixture which is the inverse of what was seen in the field. These results indicate that for these materials the HWT test was able to indicate mixture rutting resistance deficiency; however, it was not a good indicator of future rutting severity.
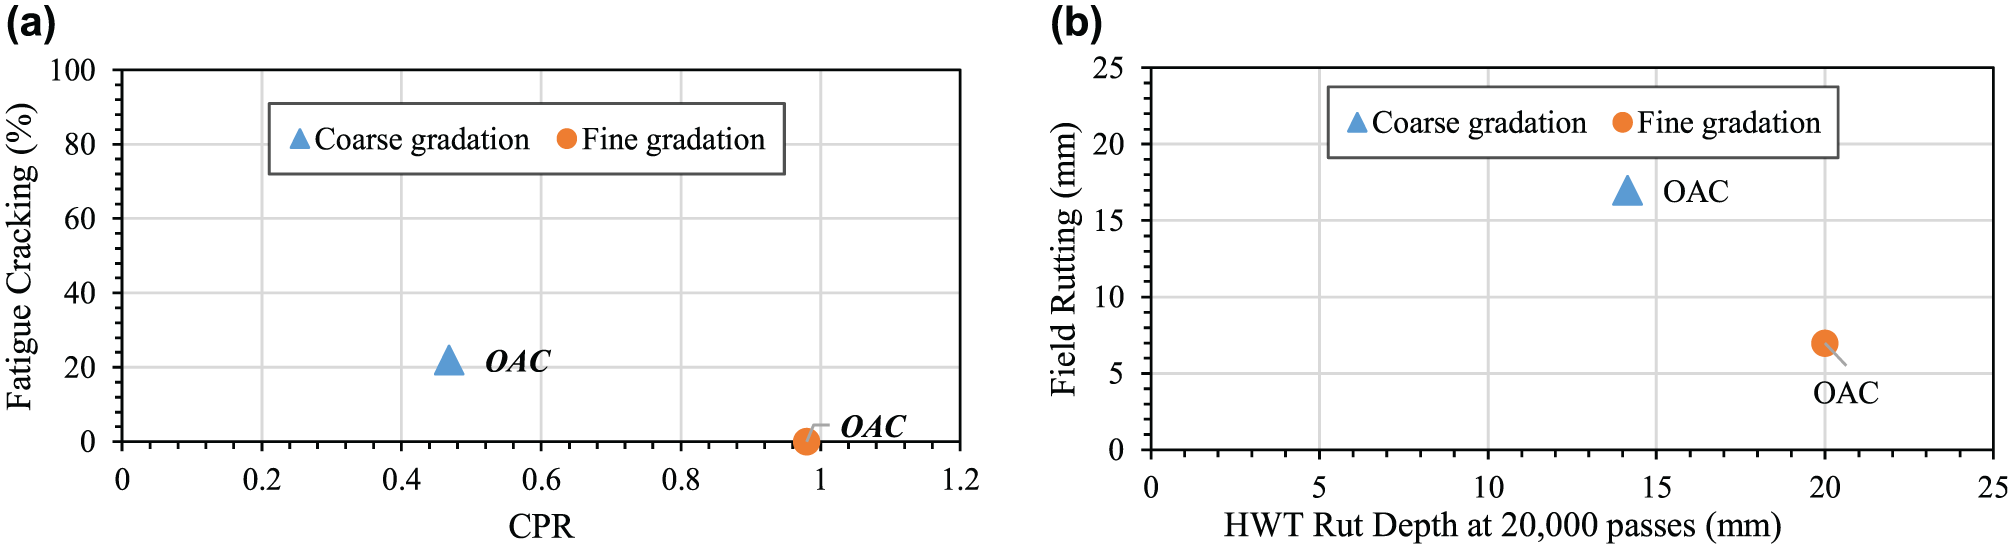
WesTrack 2024 crack propagation rate (CPR) and Hamburg wheel tracking (HWT) results versus 1995 field rutting performance: (a) CPR and (b) HWT.
Rutting measured on the WesTrack project was compared with the RT Index results for both mixtures and three binder contents each as shown in Figure 12. The results for both mixtures were graphed on the same chart and show a remarkably strong linear correlation with the observed field rutting. This indicates that the IDEAL-RT can distinguish relative rutting resistance even between mixtures with very different gradations. Additionally, the TxDOT preliminary BMD specification threshold for these mixtures would be an index value of 60. Under this criterion, the two mixtures with the poorest rutting performance would have been excluded from consideration.
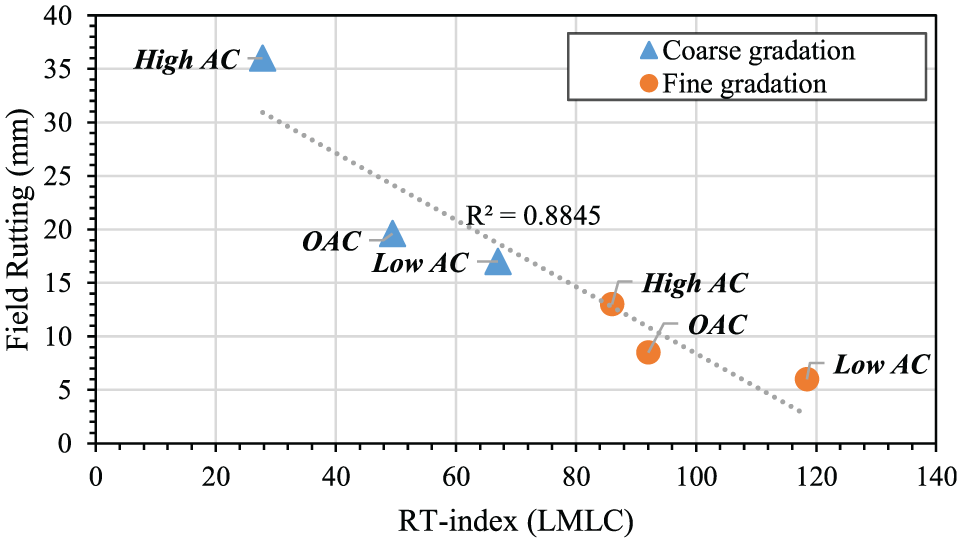
WesTrack 2024 IDEAL rutting-test (IDEAL-RT) results versus 1995 field rutting performance.
Conclusions
Long-term field data linked to laboratory mix design and performance criteria are scarce, primarily owing to the challenges in obtaining such data and collecting field data over time. Pavement performance can be influenced by factors like traffic, weather conditions, and the state of the underlying pavement. Despite these limitations, many valuable conclusions can be drawn from this study:
The current TxDOT BMD performance test thresholds for IDEAL-CT (80), IDEAL-RT (65), OT-CPR (0.45) and HWT rut depth (12.5 mm) are reliable in developing superior BMD mixtures.
The IDEAL-CT and Texas OT are good tools for comparing cracking resistance in different mixtures, with IDEAL-CT exhibiting better correlation than OT to field cracking. They provide insights into which mixtures will yield better cracking resistance under field conditions.
The HWT test has proven effective at identifying mixtures with stability issues, as evidenced by the lack of significant rutting observed in TxDOT test sections. This indicates that the test is successful in screening out mixtures that are prone to rutting and ensuring the durability of pavements.
The IDEAL-RT test consistently differentiates rutting resistance between diverse mixture types, as shown by both TxDOT BMD and WesTrack data. The ability of the IDEAL-RT to assess field rutting performance makes it a potentially valuable tool for designing mixtures and monitoring construction.
Reflection cracking has been observed in some mixtures as early as two years after construction, with the severity of cracking correlating strongly to the CT Index. This indicates that a higher CT Index is desirable to achieve mixtures with lower propensity to crack.
Gradation plays a significant role in influencing CT Index and CPR results. To ensure accurate evaluations and effective performance predictions, thresholds for these tests must be tied to gradation specifications.
An increase in AC content both increases CT Index and decreases RT Index results. This is intuitive with how asphalt materials behave.
Future Work
To improve the validation of BMD performance tests and their thresholds, additional long-term field data is needed across the country. While several promising efforts are underway, funding constraints often limit the ability to gather long-term field data, making it difficult to fully assess performance over time. Expanding these efforts will strengthen the reliability of BMD methodologies and their effectiveness in real-world applications.
Continued monitoring of TxDOT BMD field test sections will provide more definitive correlations as field distress accumulates. Constructing and tracking additional test sections across various climates, traffic levels and with different component materials will further enhance confidence in these results. Long-term data collection is crucial to refining performance thresholds and ensuring the robustness of BMD implementation. Additionally, ongoing monitoring of NCAT test track sections will help TxDOT establish and refine BMD cracking test thresholds. Building new test sections on the NCAT test track is also planned for additional validation. Further WesTrack testing on reconstruction materials may be performed and could also offer valuable insights into the influence of gradation on cracking test results, improving the accuracy and applicability of BMD performance criteria.
Footnotes
Acknowledgements
The authors would like to thank TxDOT for both funding and field support, Clayton Treybig, Michael Hoagland, Meng Ling, and Haydar Al-Khayat for laboratory and field support at Texas A&M Transportation Institute, and the many contractors and materials suppliers that made this effort possible.
Author Contributions
The authors confirm contribution to the paper as follows: study conception and design: Aaron Leavitt, Amy Epps Martin, Edith Arámbula-Mercado; data collection: Aaron Leavitt, Venkatsushanth Revelli; analysis and interpretation of results: Aaron Leavitt, Amy Epps Martin, Edith Arámbula-Mercado, Venkatsushanth Revelli; draft manuscript preparation: Aaron Leavitt, Edith Arámbula-Mercado, Venkatsushanth Revelli. All authors reviewed the results and approved the final version of the manuscript.
Declaration of Conflicting Interests
The authors declared the following potential conflicts of interest with respect to the research, authorship, and/or publication of this article: Edith Arámbula-Mercado is a member of guest editorial board for the Transportation Research Record Special Collection for the Association of Asphalt Paving Technologists (AAPT). All other authors declared no potential conflicts of interest with respect to the research, authorship, and/or publication of this article.
Funding
The authors disclosed receipt of the following financial support for the research, authorship, and/or publication of this article: TxDOT BMD Implementation effort is funded through an Interagency Contract between TxDOT, TTI and CTR.

Data Accessibility Statement
The datasets generated during and/or analyzed during the current study are available from the corresponding author on request.
The contents of this study reflect the views of the authors who are solely responsible for the facts and accuracy of the data presented here and do not necessarily reflect the official views or policies of TxDOT. This study does not constitute a standard, specification, nor is it intended for design, construction, bidding, contracting, tendering, certification, or permit purposes. Trade names were used solely for information purposes and not for product endorsement, advertisement, promotions, or certification.