
Abstract
To assess the performance, durability, and field applicability of soybean-oil-based dust suppressants, controlled laboratory experiments and a 3-week field particulate emissions monitoring program were conducted on unpaved roads. The laboratory program simulated wind erosion, wetting–drying durability, and traffic-induced loading. Soybean-oil treatments exhibited minimal mass loss and maintained surface integrity under all conditions, whereas calcium chloride brine (CCB) experienced substantial erosion. Field experiments were conducted on six sections treated with different materials, dosages, and application methods. Continuous on-vehicle monitoring and blower-induced particulate matter (PM) measurements showed that soybean oil applied at 0.8 L/m2 produced the lowest particulate emissions, and sustained strong performance throughout the 3 weeks. In contrast, the CCB-treated section exhibited rapidly increasing emissions. The area under the curve for particulate matter with aerodynamic diameters less than 2.5 µm (PM2.5) increased by a factor of 11.59, indicating rapid performance degradation and the need for frequent reapplication. Cost analysis showed that soybean oil has a higher unit price than CCB; however the dosage flexibility provides cost advantages. A low-dosage application of 0.12 L/m2 costs 1.34 times the price of CCB yet demonstrates superior durability. Overall, soybean-oil-based dust suppressants offer advantages in performance, durability, and environmental profile. They also provide flexibility in balancing cost and treatment effectiveness. Future work incorporating life-cycle assessment and life-cycle cost analysis is needed to evaluate long-term environmental effects, reapplication intervals, and system-level cost effectiveness.
Keywords
Introduction
Unpaved roads are still widely used in rural and developing regions of the global road networks. According to national reports, the U.S. has about 1.33 million miles (approximately 2.14 million kilometers) of unpaved roads, making up roughly 32% of the total network (
1
). These roads account for nearly 44% of the network in rural areas (
2
). Although they are a vital part of transportation infrastructure, unpaved roads are a significant source of fugitive dust emissions, particularly when influenced by traffic and wind (
3
–
6
). This road dust typically contains particulate matter (PM), which can cause many problems. Beyond aesthetic concerns, the fine aggregate particles, when disturbed by vehicle traffic and wind erosion, become suspended, contributing substantially to regional particulate pollution, particularly emissions of particulate matter with aerodynamic diameters less than 2.5 µm (
For safety, dust clouds reduce visibility and elevate accident risk ( 9 , 10 ). For health, PM can easily settle on vegetation and water bodies, harming sensitive ecosystems ( 11 ). More importantly, this dust can affect the health of not only road users but also nearby communities. Breathing in PM can contribute to serious health problems, including respiratory diseases, cardiovascular issues, and overall decreased life expectancy, as highlighted by global health assessments attributable to air pollution exposure ( 12 – 16 ). Besides, dust contributes to faster deterioration of the road surface and increases the frequency of grading and replacing materials, which in turn raises maintenance costs ( 17 , 18 ).
Researchers have focused on dust suppression strategies to deal with these problems over the years ( 19 – 21 ). Water spraying is commonly used but offers only short-term relief. Chemical suppressants, such as hygroscopic salts and petroleum-based binders ( 22 , 23 ), provide more durable solutions. However, these conventional treatments often carry environmental risks, including soil and water contamination, corrosivity, and poor long-term sustainability ( 24 – 26 ). For instance, chloride-based products are highly soluble and prone to leaching, elevating salinity in surface waters and groundwater, while petroleum-based emulsions introduce hydrocarbons and potential polycyclic aromatic hydrocarbons into sensitive ecosystems ( 25 , 27 ). Even lignosulfonates, though derived from biomass, can lead to dark-colored runoff and aesthetic issues, and their performance heavily depends on their specific chemical structure, which can vary with feedstock and processing ( 28 , 29 ). As regulatory and ecological concerns grow, attention is shifting toward bio-based suppressants derived from renewable biodegradable sources ( 30 – 32 ). Green and durable surface materials are becoming a key focus of road engineering research ( 33 , 34 ), and sustainable maintenance strategies are increasingly emphasized for long-term infrastructure planning ( 35 ). This paradigm shift aligns with broader civil engineering goals to transition toward a circular economy and achieve decarbonization targets, advocating for materials that exhibit lower life-cycle environmental burdens than their fossil-derived counterparts ( 36 , 37 ).
In recent years, soybean-based materials have drawn interest as a viable option for more sustainable dust control. Soybean oil is not only low in toxicity and biodegradable, but also widely available. In a preliminary investigation in Minnesota, researchers even tested soybean-oil soapstock as a dust suppressant as early as 1996 ( 38 ). More recent research has expanded on this work, using molecular modification, emulsification, and plant-based additives to enhance dust particle binding and moisture resistance ( 32 ). For example, Xia et al. ( 39 ) explored the preparation of vegetable-oil film-type emulsion dust suppressants and their adsorption performance on road dust, while Wu et al. (31) focused on the preparation and environmental performance evaluation of biological dust suppressants. These advances address historical limitations, such as the oxidative stability of unmodified soybean oil and its hydrophobicity, through chemical modifications, such as partial epoxidation or careful selection of emulsifiers (40–42). Studies on lignin ( 28 , 29 ), biosurfactants ( 31 ), and microbial binders have also contributed to the development of bio-based suppressants. In particular, Niu et al. ( 30 ) developed and characterized a high-efficiency rhamnolipid-based compound dust suppressant for coal dust pollution control, while Zhou et al. ( 32 ) optimized bio-based dust suppression materials derived from sisal leaves. These various bio-based materials, ranging from polysaccharides (e.g., starch, xanthan gum) to lignin-derived phenolic compounds and lipid-based products, offer distinct mechanisms for soil stabilization and dust suppression, including cohesive film formation, aggregate cohesion, and moisture retention ( 28 , 36 ). While exhibiting advantages in renewability, biodegradability, and reduced carbon footprint ( 43 , 44 ), their overall environmental benefits are further supported by life-cycle assessment (LCA) studies conducted by other researchers. For instance, Parvej et al. ( 16 ) emphasized that a complete LCA of dust suppressants should address emissions from raw material harvesting, transportation, formulation chemicals, and repeated reapplication on unpaved roads, recognizing that maintenance intervals heavily influence overall effects. Katra ( 10 ) further argued that suppressants with short effective lifetimes can dramatically increase total embodied emissions, owing to frequent retreatment, highlighting service life extension as a crucial performance criterion in sustainable dust control. Similarly, Arafat et al. ( 45 ) and Cavalli et al. ( 46 ) have conducted LCA studies on bio-based rejuvenators in asphalt mixtures, demonstrating a transferable methodology for assessing the environmental benefits of bio-based materials in road applications. However, despite these promising developments and documented advantages, the field still lacks a systematic evaluation for soybean-based applications under realistic conditions.
To address the limited understanding of soybean-based suppressants under practical conditions, in this study, laboratory experiments and field monitoring are integrated to evaluate their performance and durability in comparison with calcium chloride brine (CCB). The study also includes an analysis of material costs and dosage-dependent effectiveness, providing quantitative evidence to guide more sustainable and cost-effective dust control strategies for unpaved roads.
Methodology
In this study, a combination of controlled laboratory experiments and field testing was employed to evaluate the performance, durability, and practical applicability of soybean-based dust suppressants. The following sections describe the materials used, the sample preparation procedures, and the experimental methods adopted for laboratory and field evaluations.
Materials and Sample Preparation
The primary dust suppressant evaluated was soybean-oil material. For comparison, CCB control groups were established. The road material used for all laboratory tests was sourced to simulate typical unpaved road surfaces.
Samples for laboratory testing were prepared by compacting the road material into specific molds or containers. The suppressants were applied to the surfaces of the dust samples at varying application rates to investigate their performance. Five types of surface treatment were applied. The first sample tested was an untreated dust sample, acting as a control section, which received no suppressant and served as a baseline for comparison. The second treatment involved the application of undiluted soybean-based suppressant at a rate of 1.2 L/m2. To investigate the effect of oil dosage for a consistent total liquid application volume, two additional treatments were designed by adjusting the amount of soybean oil while supplementing the remainder with water. Specifically, soybean oil was applied at 0.6 and 0.12 L/m2, respectively, following a preliminary water application of 0.6 and 1.08 L/m2, so that the total applied volume remained constant at 1.2 L/m2. In these cases, water was applied first, followed by soybean oil. This approach allowed for the controlled evaluation of oil content effects without altering the overall liquid input. Then CCB was applied at a rate of 0.8 L/m2, serving as the conventional benchmark. After application, all samples were oven-dried to a consistent mass before testing, to simulate dry road conditions.
Laboratory Performance Evaluation
Wind Erosion Test
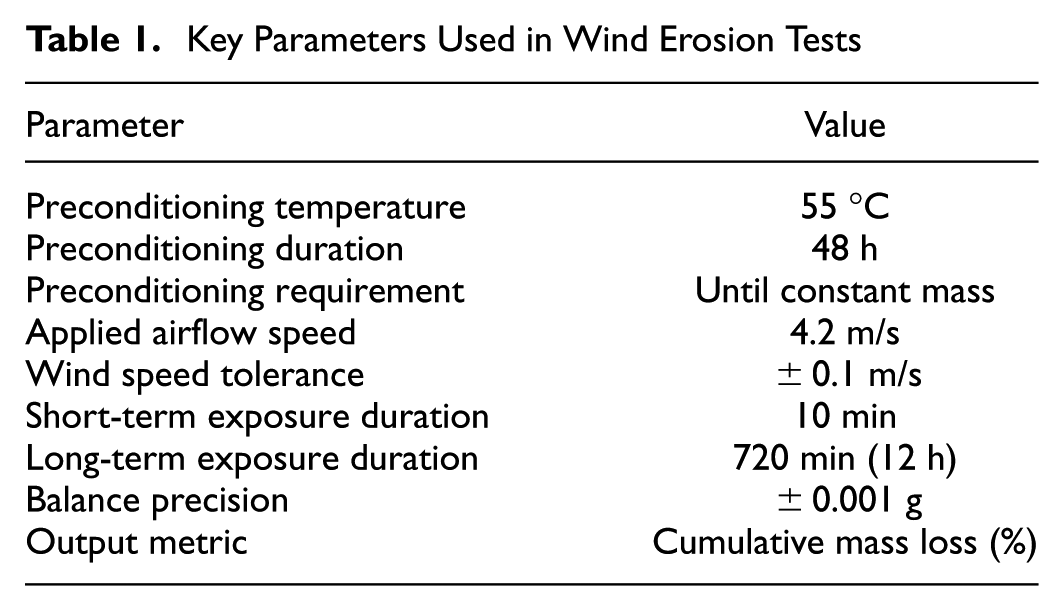
To simulate dust emissions under typical wind conditions, a wind erosion test was performed. The test was designed to measure the mass loss of the treated samples over time. A wind speed of 4.2 m/s was selected for the wind erosion test, to represent a realistic and nonextreme ambient wind condition. According to the Wind Integration National Dataset (WIND) Toolkit developed by the National Renewable Energy Laboratory (NREL) ( 47 , 48 ), the annual average wind speed across most regions in Michigan is typically below 5.5 m/s at 30 m elevation and below 4 m/s at 10 m elevation. Therefore, 4.2 m/s offers a representative intermediate value that approximates surface-level wind conditions for typical unpaved road environments without overstating erosion potential.
Before testing, all specimens were oven-dried at 55 °C for 48 h to attain a constant mass. A controlled airflow of 4.2 m/s was then applied continuously to each sample, with wind speed monitored using an anemometer to ensure that the wind speed remained within ±0.1 m/s throughout the experiment. Two exposure durations were evaluated: a short-term period of 10 min to assess immediate dust release and a long-term period of 720 min (12 h) to characterize sustained erosion resistance. At designated intervals, testing was paused briefly; specimens were removed from the airflow and weighed using a precision balance (±0.001 g). Cumulative mass loss was calculated as a percentage of the initial mass. This procedure provided insight into both rapid wind-induced particle detachment and long-term surface durability under continuous airflow. The parameters and procedure of the wind erosion test are detailed in Table 1 and Figure 1.
Key Parameters Used in Wind Erosion Tests
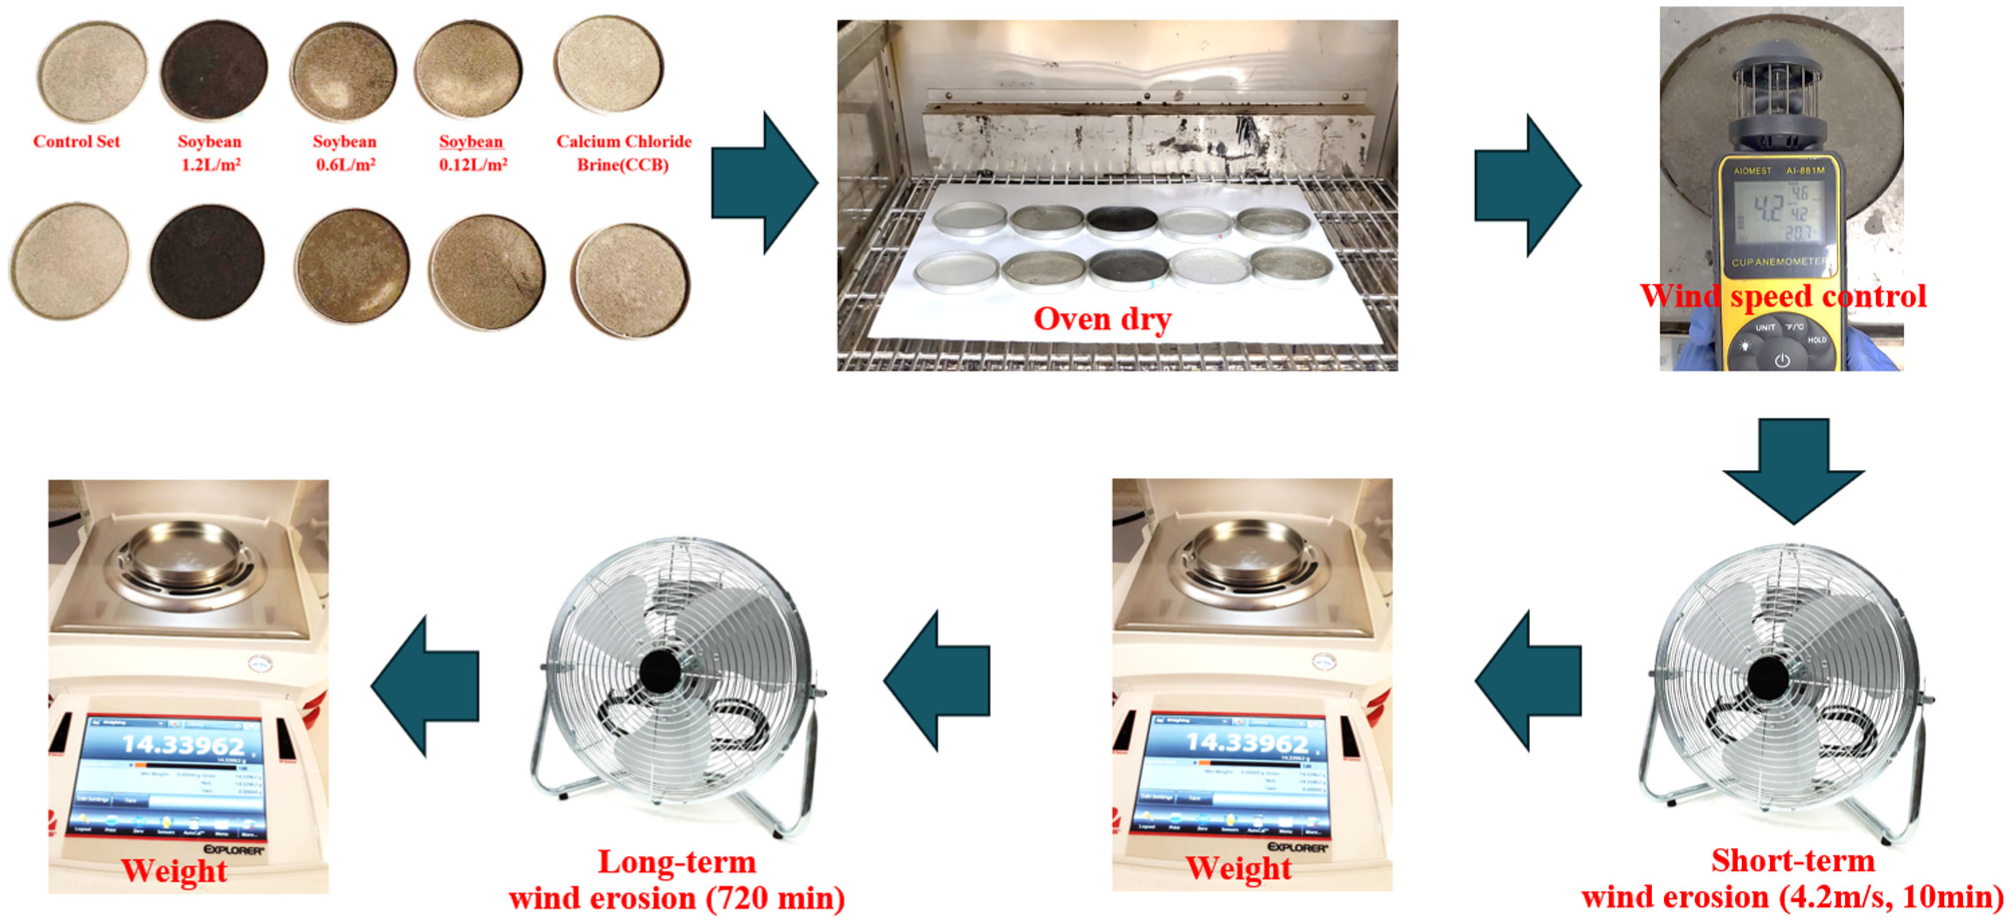
Experimental setup and procedure of wind erosion test.
Wetting–Drying Durability Test
The wetting–drying durability test was designed to evaluate the ability of each suppressant to resist repeated moisture exposure and surface crust degradation under cyclic environmental conditions.
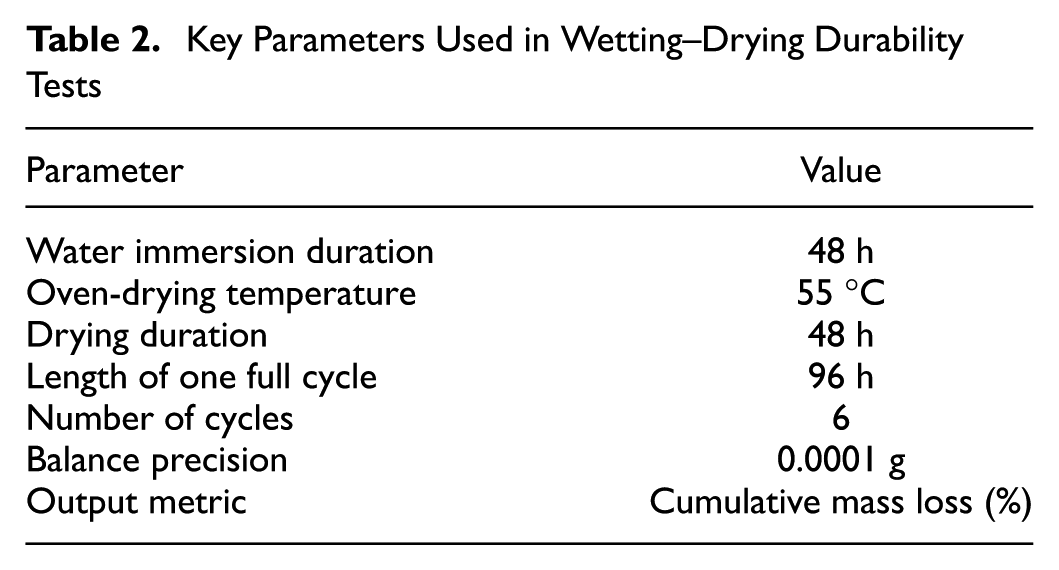
Treated specimens were fully submerged in water for 48 h to simulate prolonged rainfall or ponding. They were then oven-dried at 55 °C for an additional 48 h to represent natural drying on unpaved roads. Each wetting–drying cycle, therefore, lasted 96 h in total. After every cycle, specimens were weighed to a precision of four decimal places to quantify cumulative mass loss. Six consecutive cycles were performed for each treatment group. This cyclic immersion–drying procedure provided a measure of long-term durability and resistance to water-induced degradation. The parameters and procedure of the wetting–drying durability test are detailed in Table 2 and Figure 2.
Key Parameters Used in Wetting–Drying Durability Tests
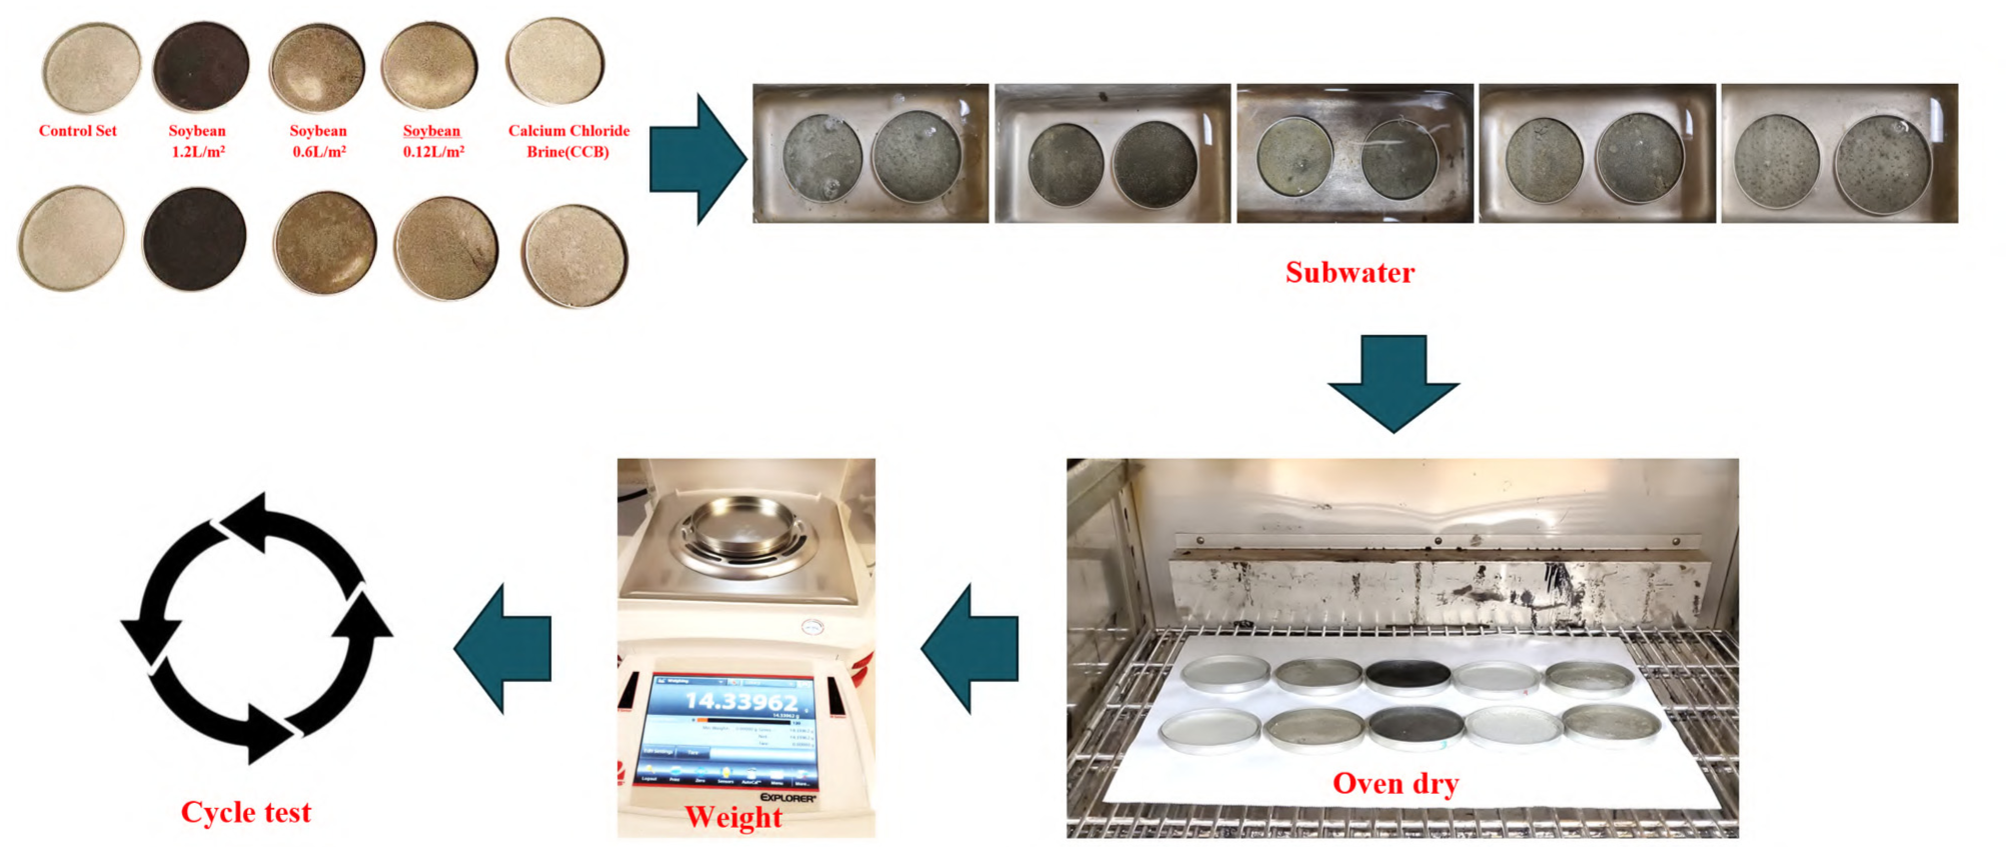
Experimental setup and procedure of wetting–drying durability test.
Traffic Load Stability Test
The traffic load stability test was designed to evaluate the durability of treated aggregates under repeated impact and handling, simulating traffic-induced dislodgement of surface fines.
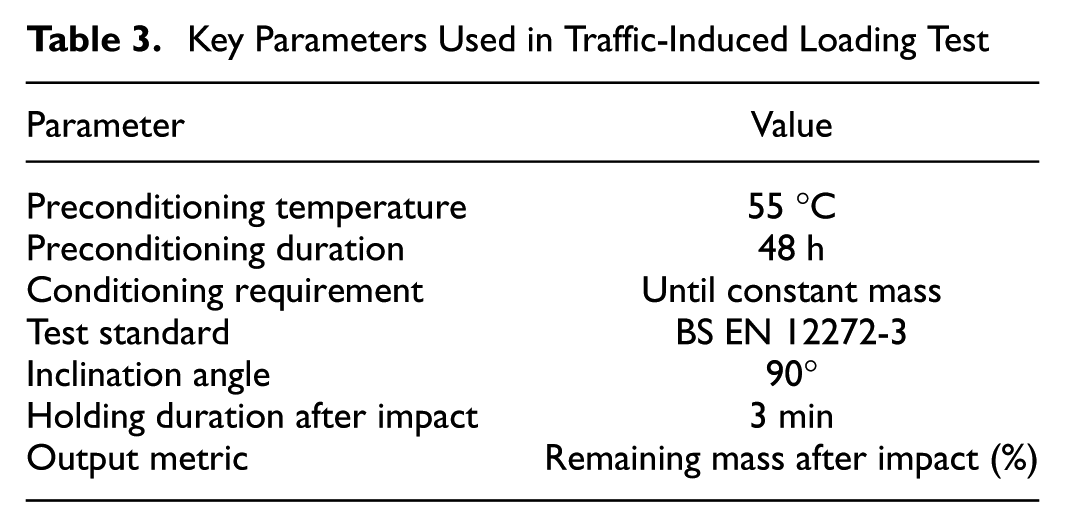
Before testing, all specimens were oven-dried at 55 °C for 48 h until a constant mass was attained to ensure consistent baseline conditions. In this test, a modified Vialit plate shock test was conducted following BS EN 12272-3 ( 49 ). After a standardized impact load was applied, the specimens were held at a fixed inclination angle of 90° for 3 min to allow any unstable portions to detach. The remaining mass was then recorded as an indicator of durability under traffic-induced loading. The parameters and procedure of the traffic load stability test are detailed in Table 3 and Figure 3.
Key Parameters Used in Traffic-Induced Loading Test
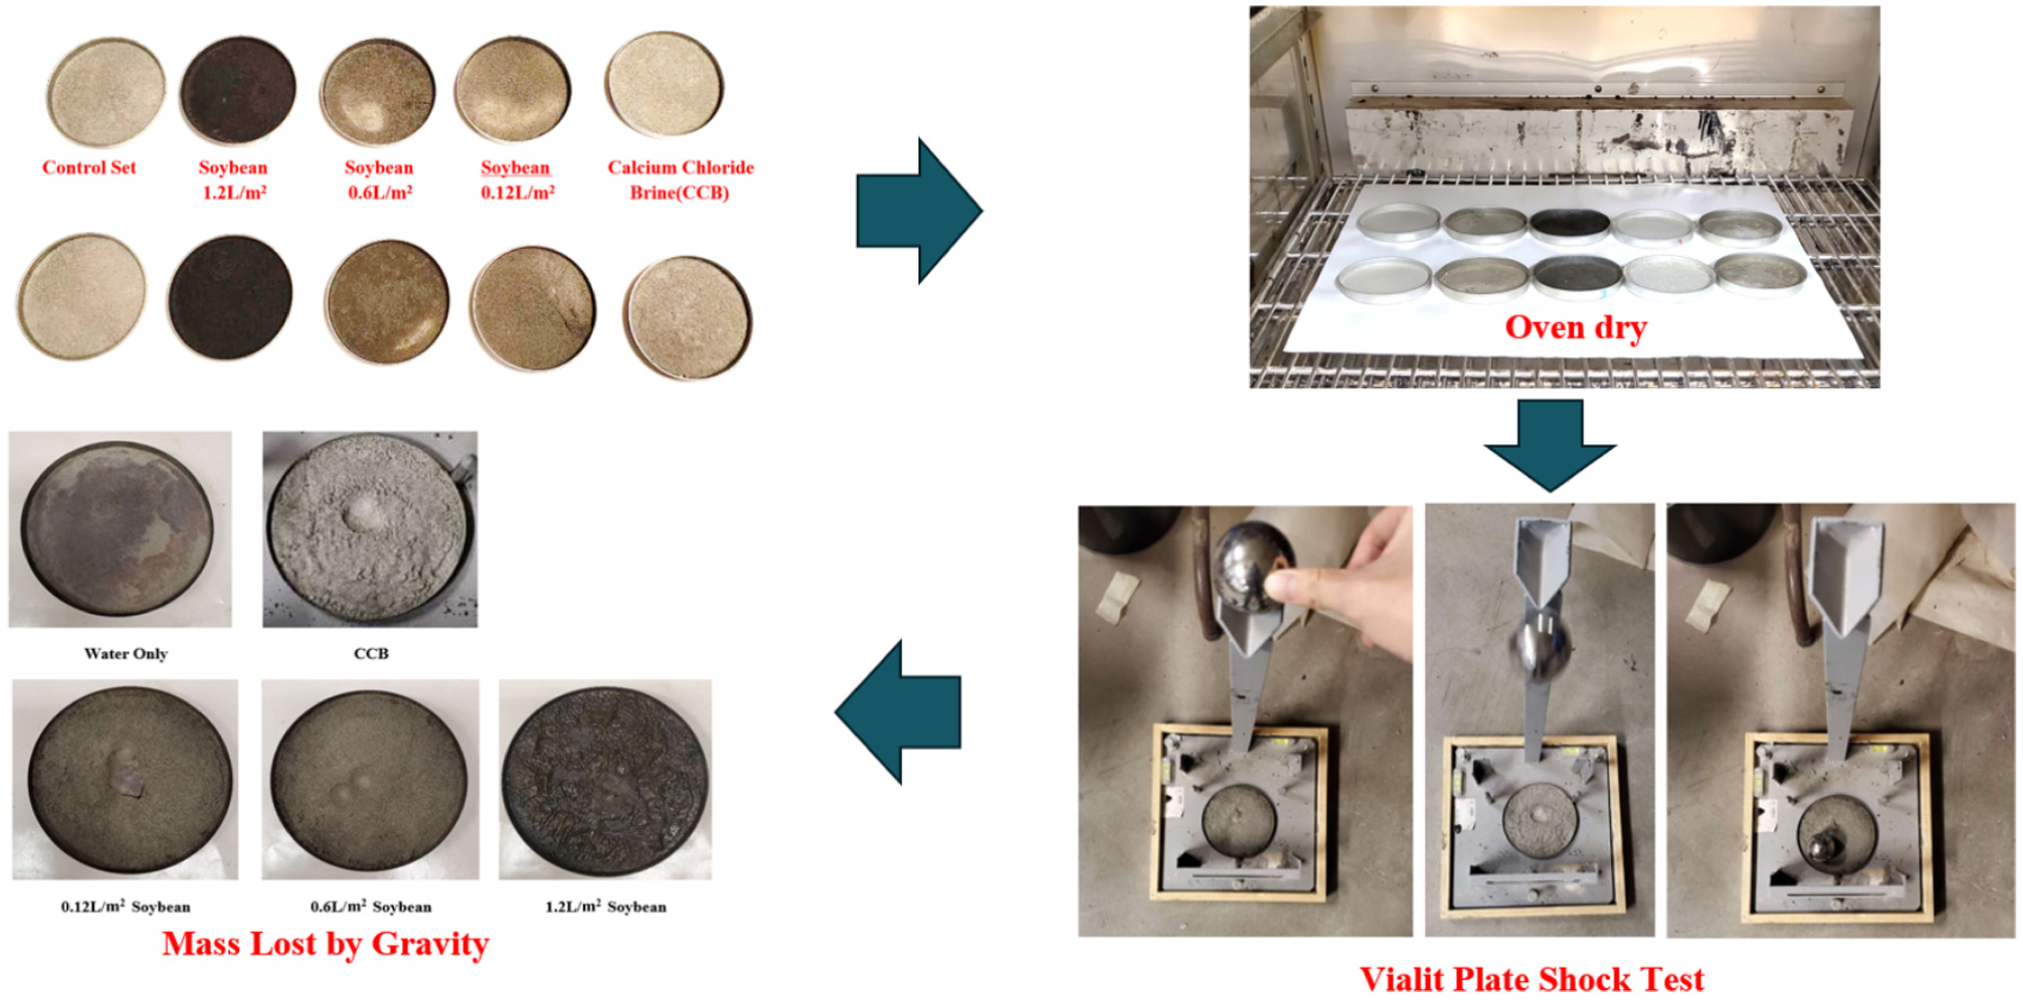
Modified Vialit plate shock test used for traffic load simulation.
Field Application and Performance Monitoring
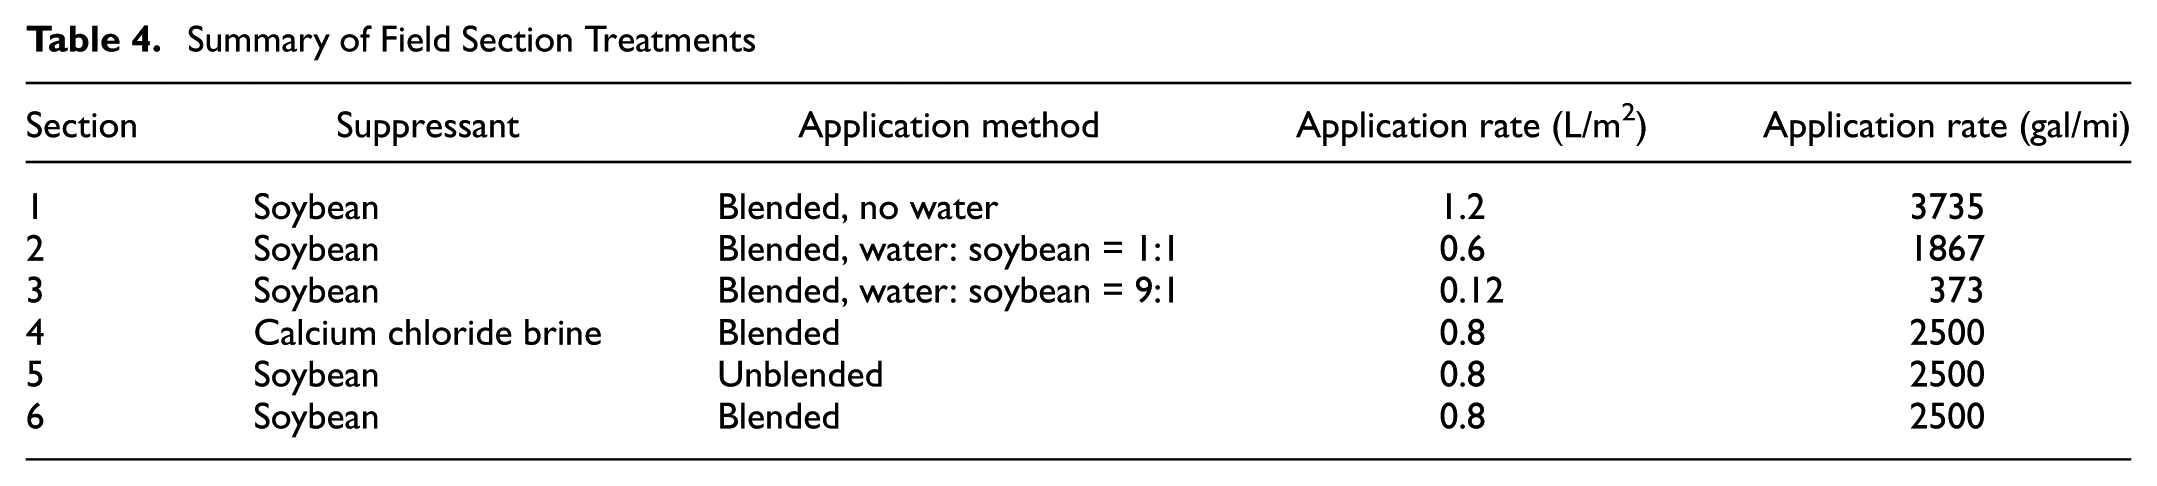
Preliminary field applications were conducted on six road sections, each receiving different treatments. The application procedure followed a standardized sequence. First, the road surface was prepared by loosening the gravel (preblending) to facilitate better integration of the suppressant. Next, the suppressants were applied at their designated rates. For treatments involving water and soybean oil, water was applied first, followed by oil, to achieve the intended blend. After application, most sections were reblended (post-application blending) to ensure uniform distribution of the materials within the upper layer of the roadbed. The only exception was the unblended treatment (without postapplication blending), which was left undisturbed after application. Finally, rubber-tired rollers were used to compact the treated surfaces, completing the field preparation process. A summary of the treatment types, application methods, and dosage levels for all six field sections is provided in Table 4 and images from the field application process are shown in Figure 4.
Summary of Field Section Treatments
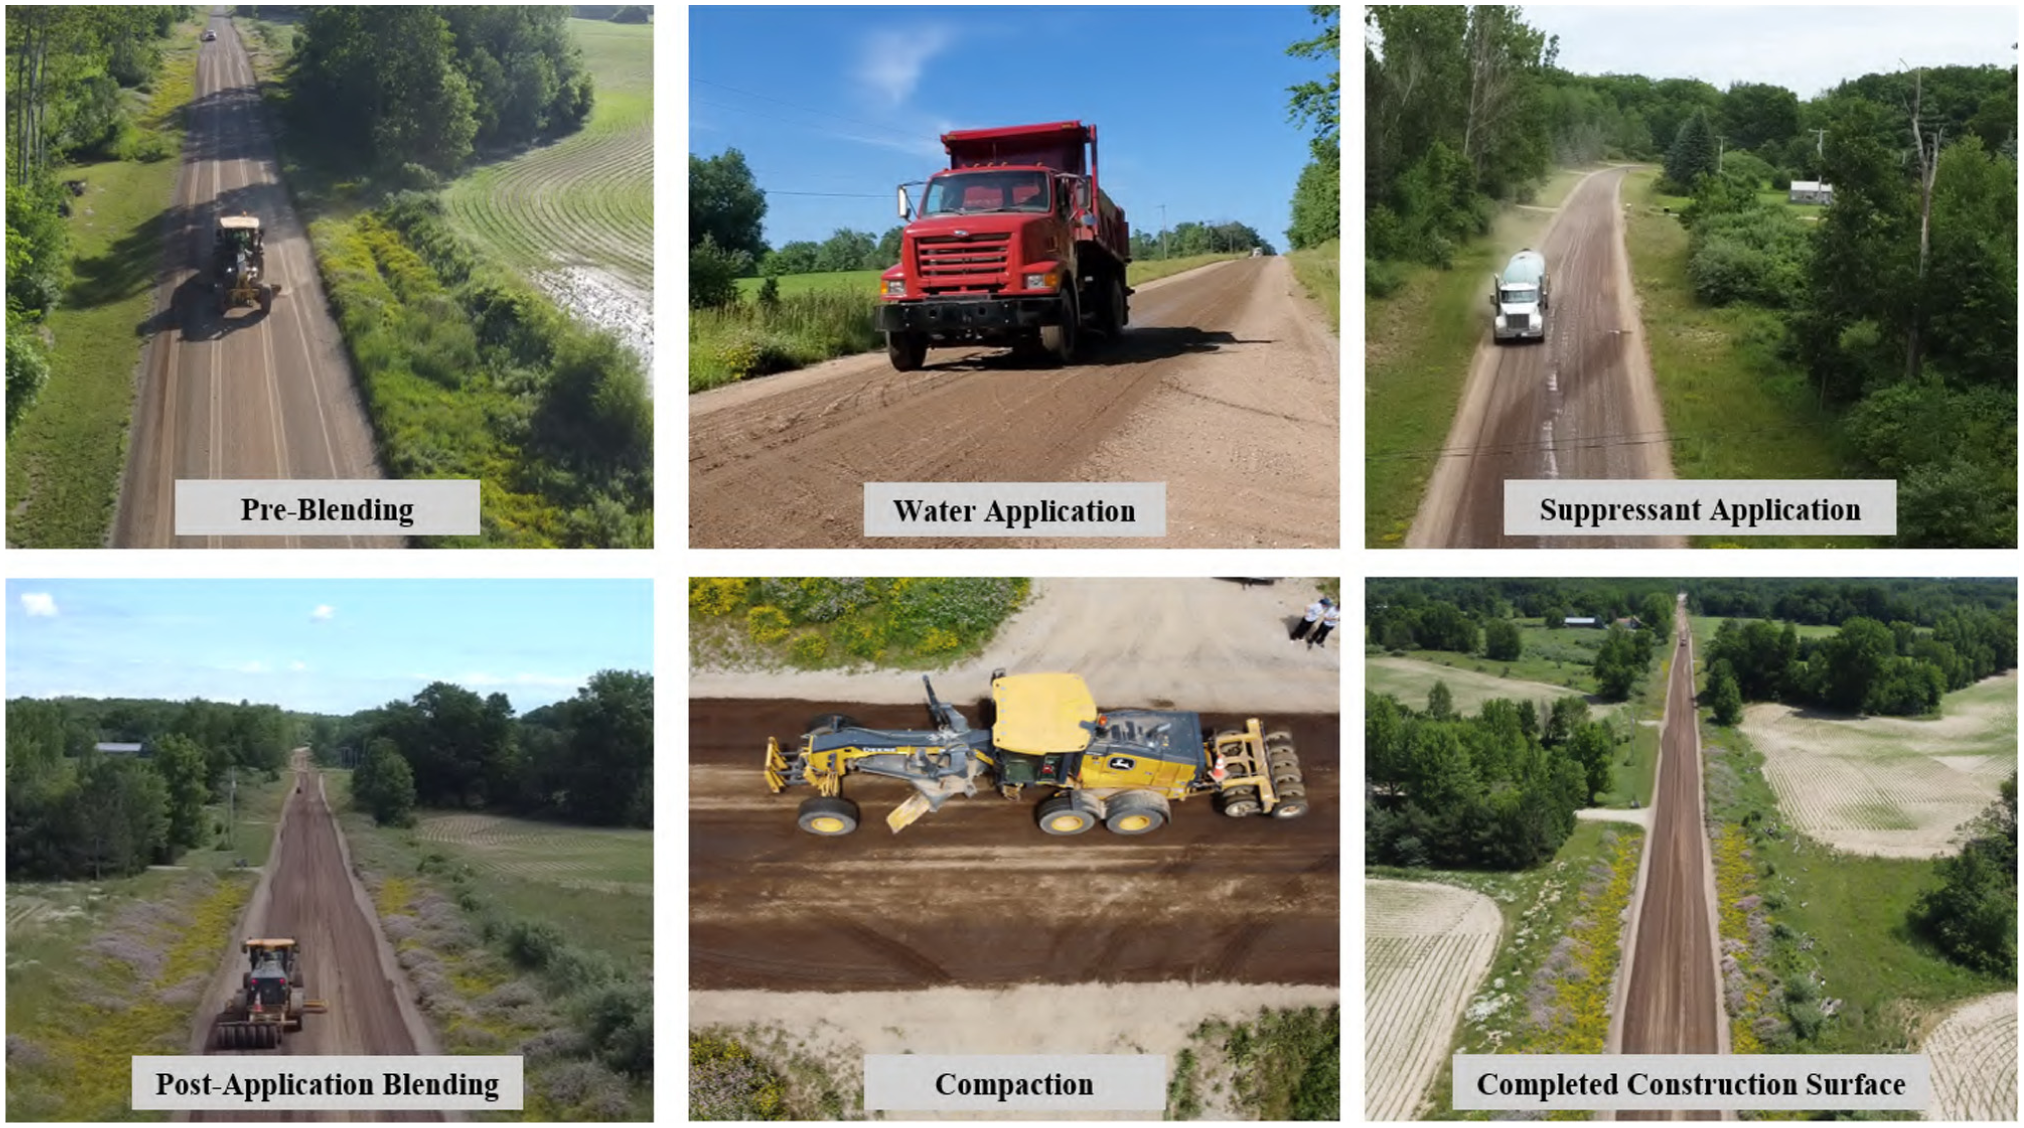
Field application process for dust suppressant treatments.
Field PM Measurement Methods
Two complementary methods were used to quantify dust emissions in the field: on-vehicle monitoring for traffic-induced particulate generation and blower-induced measurements for wind-driven particle release. Figure 5 illustrates the equipment and procedures used in both approaches. In the on-vehicle method, the PM sensor was mounted at the trailer hitch (Figure 5a) to record plume concentrations in the centerline wake during vehicle travel. For the blower-induced method, measurement points were laid out by marking fixed distances in front of the blower (Figure 5b), and PM data were recorded on the ground using sensors positioned downwind during each test (Figure 5c). These setups ensured consistent, repeatable, and spatially distributed measurements for all test sections.
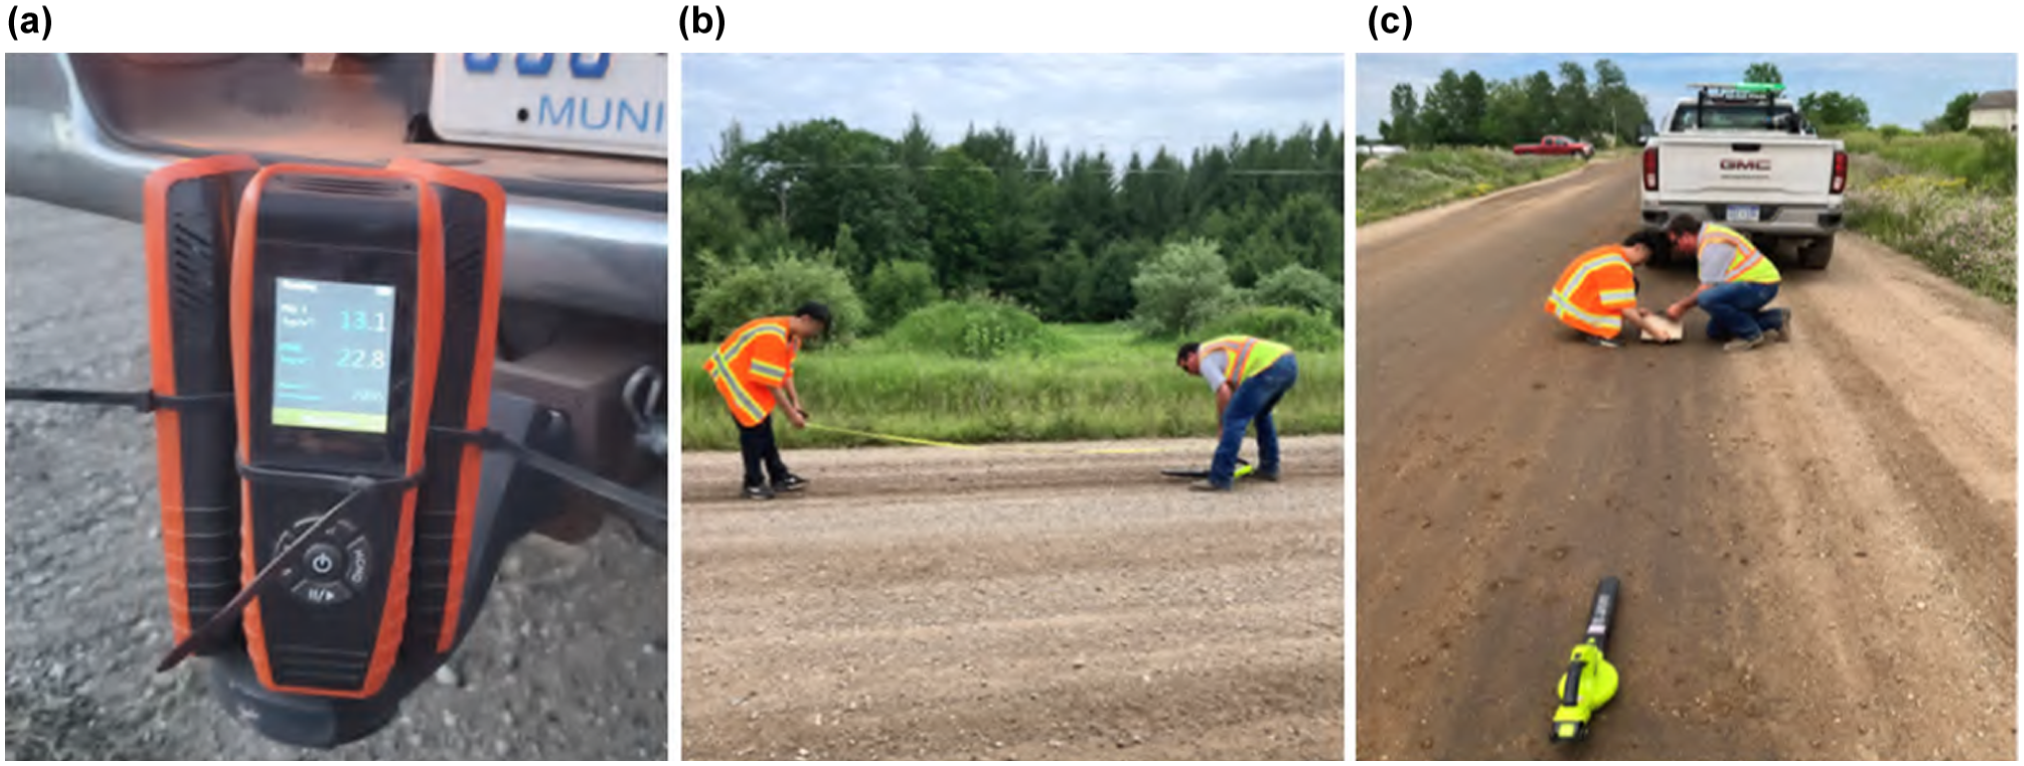
Field setup for on-vehicle and blower-induced particulate matter (PM) measurement: (a) on-vehicle PM measurement sensor mounted at trailer hitch; (b) layout of blower-induced PM measurement points; (c) recording PM data during blower-induced PM measurement.
On-Vehicle PM Measurement
Traffic-induced dust emissions were quantified using a pickup truck instrumented with three co-located particulate matter sensors mounted on a reinforced steel bracket fixed to the trailer hitch. This position placed the sensors in the centerline wake zone, where suspended dust is most representative of actual vehicle-induced plume formation. Each test run was conducted at a constant speed of 25 mph to ensure consistent aerodynamic entrainment across all sections.
The sensors logged
Before each test sequence, all sensors were warm-started and zero-checked, following manufacturer protocols. At the end of each testing day, raw data were downloaded, screened for signal dropouts, and time-synchronized. Data processing included: (i) trimming all entries outside the spatial limits of each test section, (ii) averaging the three co-located sensors to reduce random noise and instrument drift, and (iii) computing time-series statistics together with the area under the curve (AUC) to obtain an integrated PM emission metric for each section. This procedure ensured that the final values reflected actual plume strength, rather than instantaneous fluctuations or instrument noise.
Blower-Induced PM Measurement
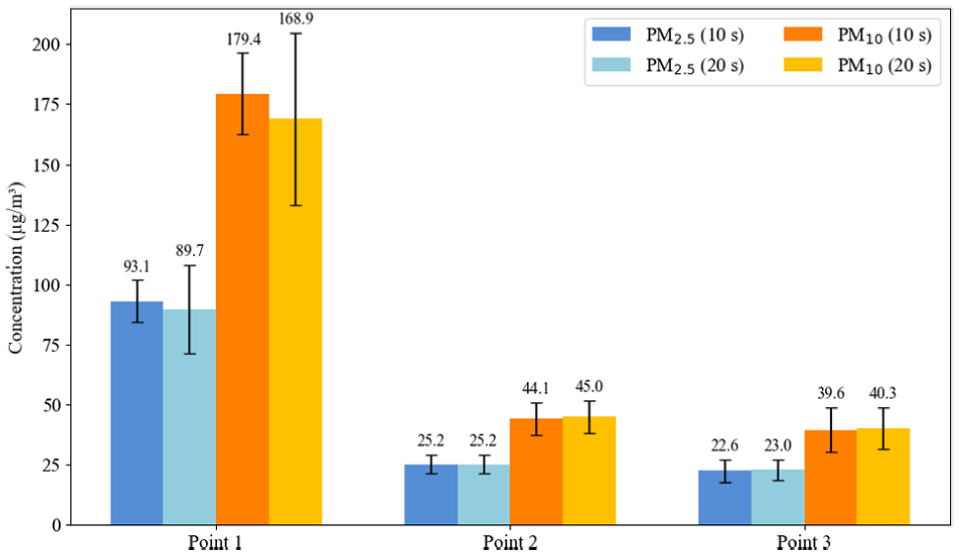
Wind-induced particulate emissions were evaluated using a portable gasoline-powered blower positioned upwind of the test location and angled slightly above the gravel surface. This configuration was selected to mobilize loose fines while avoiding scouring or base-layer disturbance. Three PM sensors were placed 10 ft (3.05 m) downwind of the blower to record the particle plume generated by the controlled airflow.
For each test point, the blower was operated for a duration of 90 s. Although the sensors collected continuous recordings during each run, the final dataset was derived through postprocessing. Synchronized video footage was used to mark time intervals, and
To evaluate spatial variability within each treatment, three independent test points were selected per section. In choosing locations, obvious wheel tracks, depressions, and road shoulders were avoided to ensure that measurements reflected typical surface conditions, rather than edge behavior or traffic load compaction zones. Because the blower test interrogates highly localized dust release behavior, measurements often exhibit dispersion when untreated patches or over-applied streaks are present.
To quantify the uncertainty associated with spatial heterogeneity, the standard error of the mean (SEM) was used when computing section-level averages. The SEM provides a more appropriate representation of accuracy than simple standard deviation for datasets derived from repeated spatial measurements.
Results and Discussion
This section presents comprehensive results from both laboratory and field investigations of soybean-oil-based dust suppressants. The findings are categorized by the type of test, and are followed by a detailed discussion, comparing the performances of different formulations and application methods against control groups.
Laboratory Evaluation Results
Wind Erosion Test
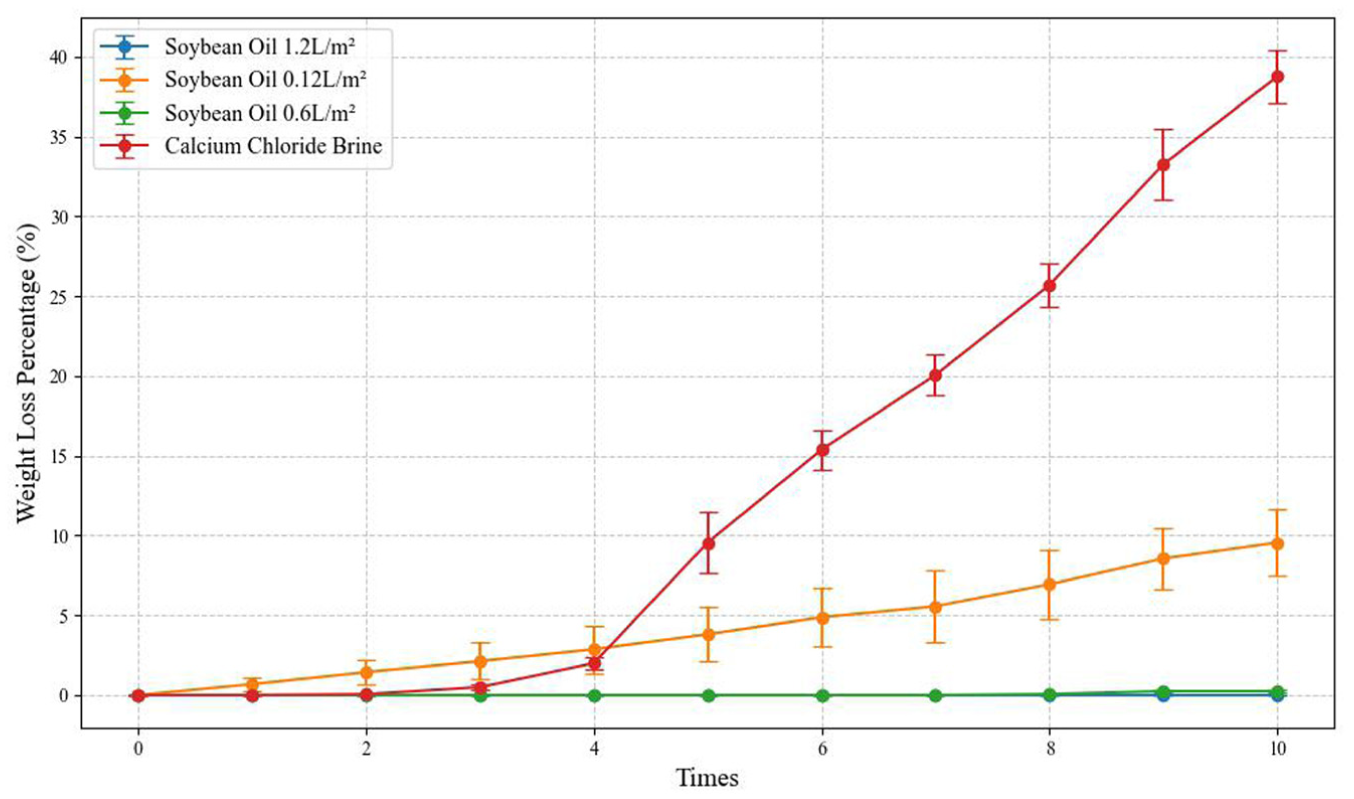
The wind erosion test results (Figure 6) clearly demonstrate the superior wind resistance of soybean-oil-based suppressants. The untreated dust samples experienced a severe mass loss of 97.65% after 720 min, confirming their high susceptibility to wind-induced particle detachment. In contrast, soybean oil applied at both 1.2 and 0.6 L/m2 showed complete resistance to wind erosion, with no measurable mass loss throughout the test period. Even at the lower dosage of 0.12 L/m2, soybean oil performed strongly, exhibiting only 0.13% mass loss.
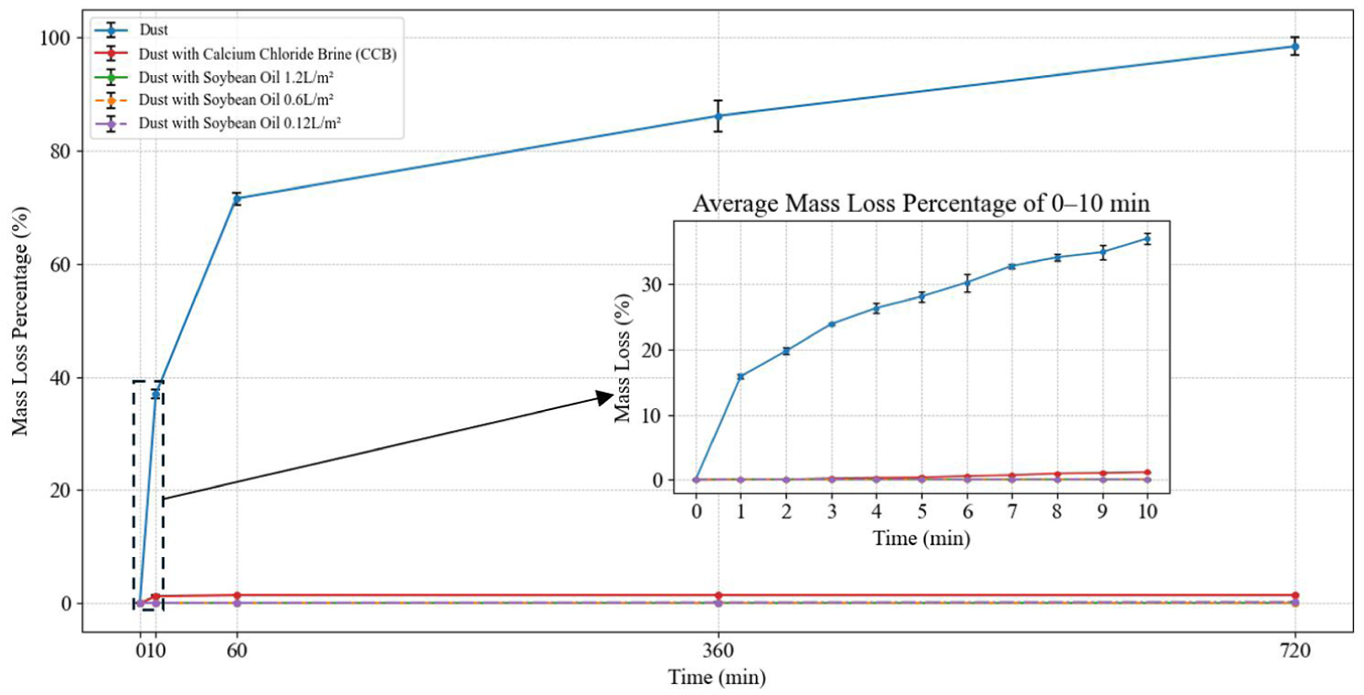
Average mass loss percentage in wind erosion test.
CCB also reduced wind-driven mass loss, compared with the untreated samples, but to a lesser extent than soybean oil. The CCB-treated group recorded a mass loss of 1.40%, which, although significantly lower than the untreated condition, remained an order of magnitude higher than that of the soybean-oil treatments. These results indicate that soybean oil—particularly at 0.6 and 1.2 L/m2—forms a highly stable wind-resistant surface layer, capable of withstanding sustained airflow at 4.2 m/s.
Furthermore, a specific analysis of the final mass loss percentage at
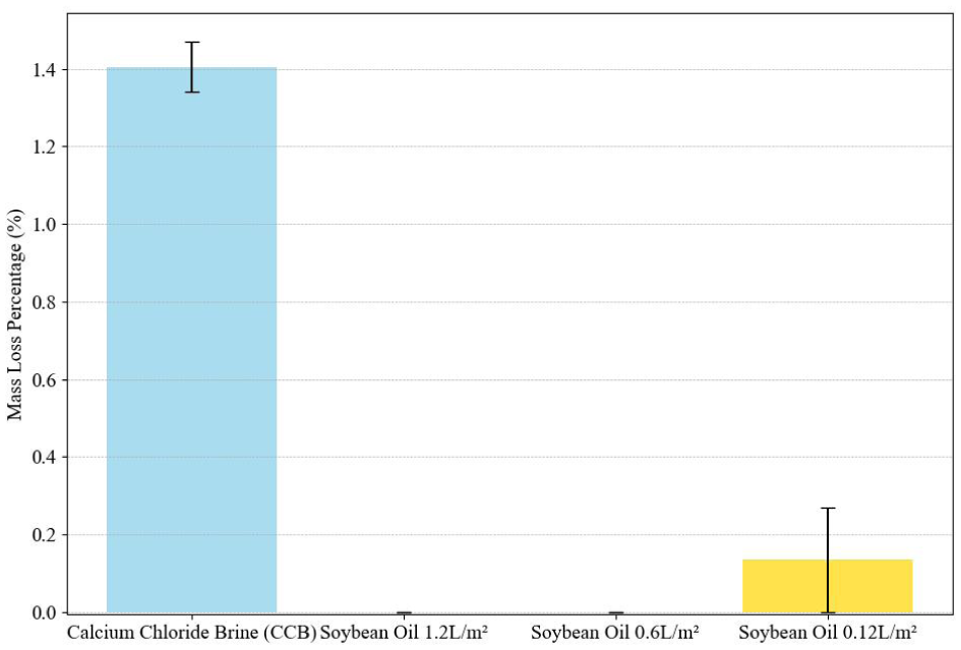
Mass loss percentage after 720 min in wind erosion test.
Wetting–Drying Durability Test
The wetting–drying cycling results reveal clear differences in durability between the five treatment groups (Figure 8). The untreated control set exhibited a relatively low cumulative mass loss of 2.88%, despite the absence of any chemical binder. This behavior indicates that wetting–drying cycling alone has limited influence on unbound road dust: most mass reduction occurred only when trapped air within the pore structure generated small bubbles that displaced fine particles beyond the sample container. Because no suppressant was present, the observed mass loss resulted solely from dust detachment, with no additional loss pathway, such as binder dissolution.
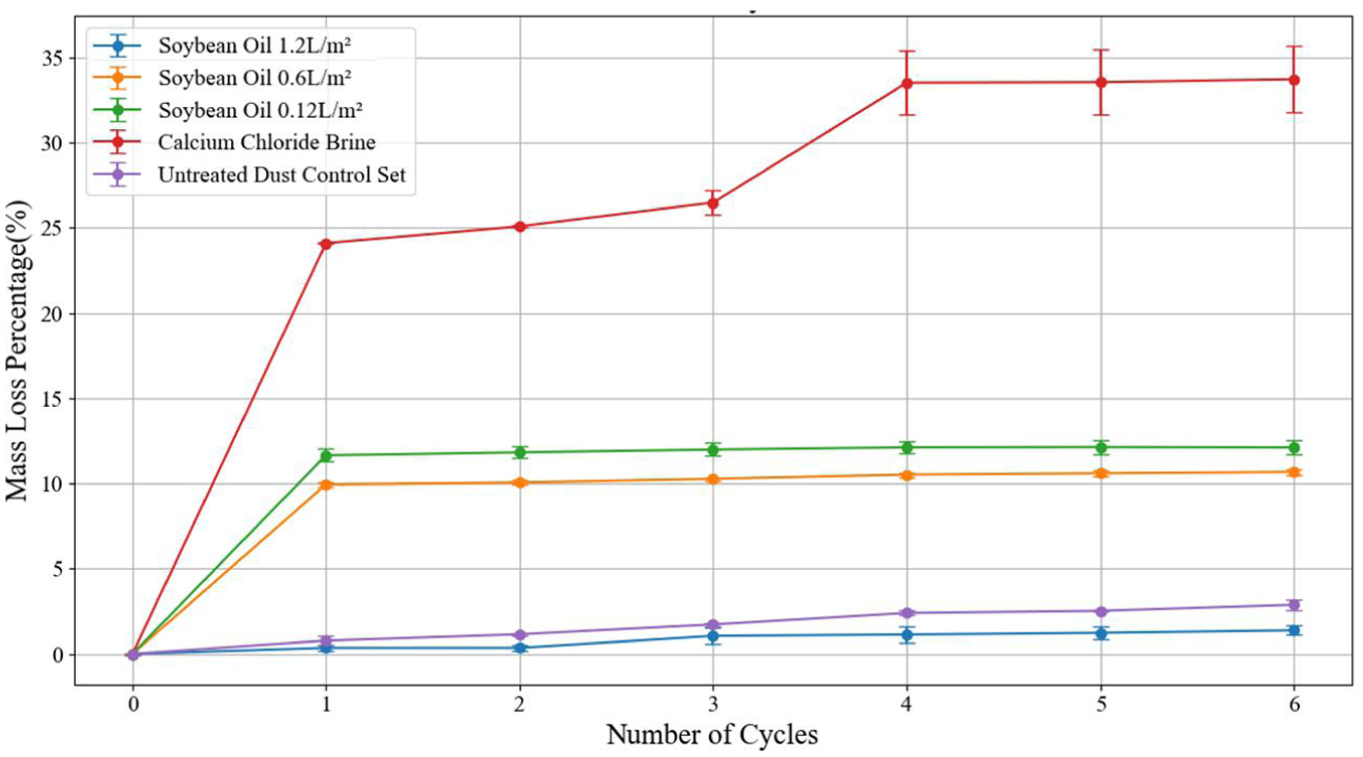
Comparison of wetting–drying cycle performance for untreated control, calcium-chloride-brine-, and soybean-oil-treated samples.
In contrast, the CCB group experienced the highest cumulative mass loss of 33.71%. As a hygroscopic salt, CCB dissolved rapidly on immersion, contributing directly to material loss as salts diffused into the surrounding water. This dissolution process also released internal air bubbles, producing vigorous bubbling that mobilized and transported dust away from the sample. These mechanisms are clearly visible in Figure 9, where the CCB samples exhibit strong bubbling and pronounced surface disturbance during soaking. The large initial spike in mass loss is consistent with this behavior. After the early cycles, most soluble salts had already dissolved, resulting in diminished bubbling and smaller incremental losses in cycles 4 to 6, indicating that the treatment had effectively lost its water resistance after approximately four cycles.
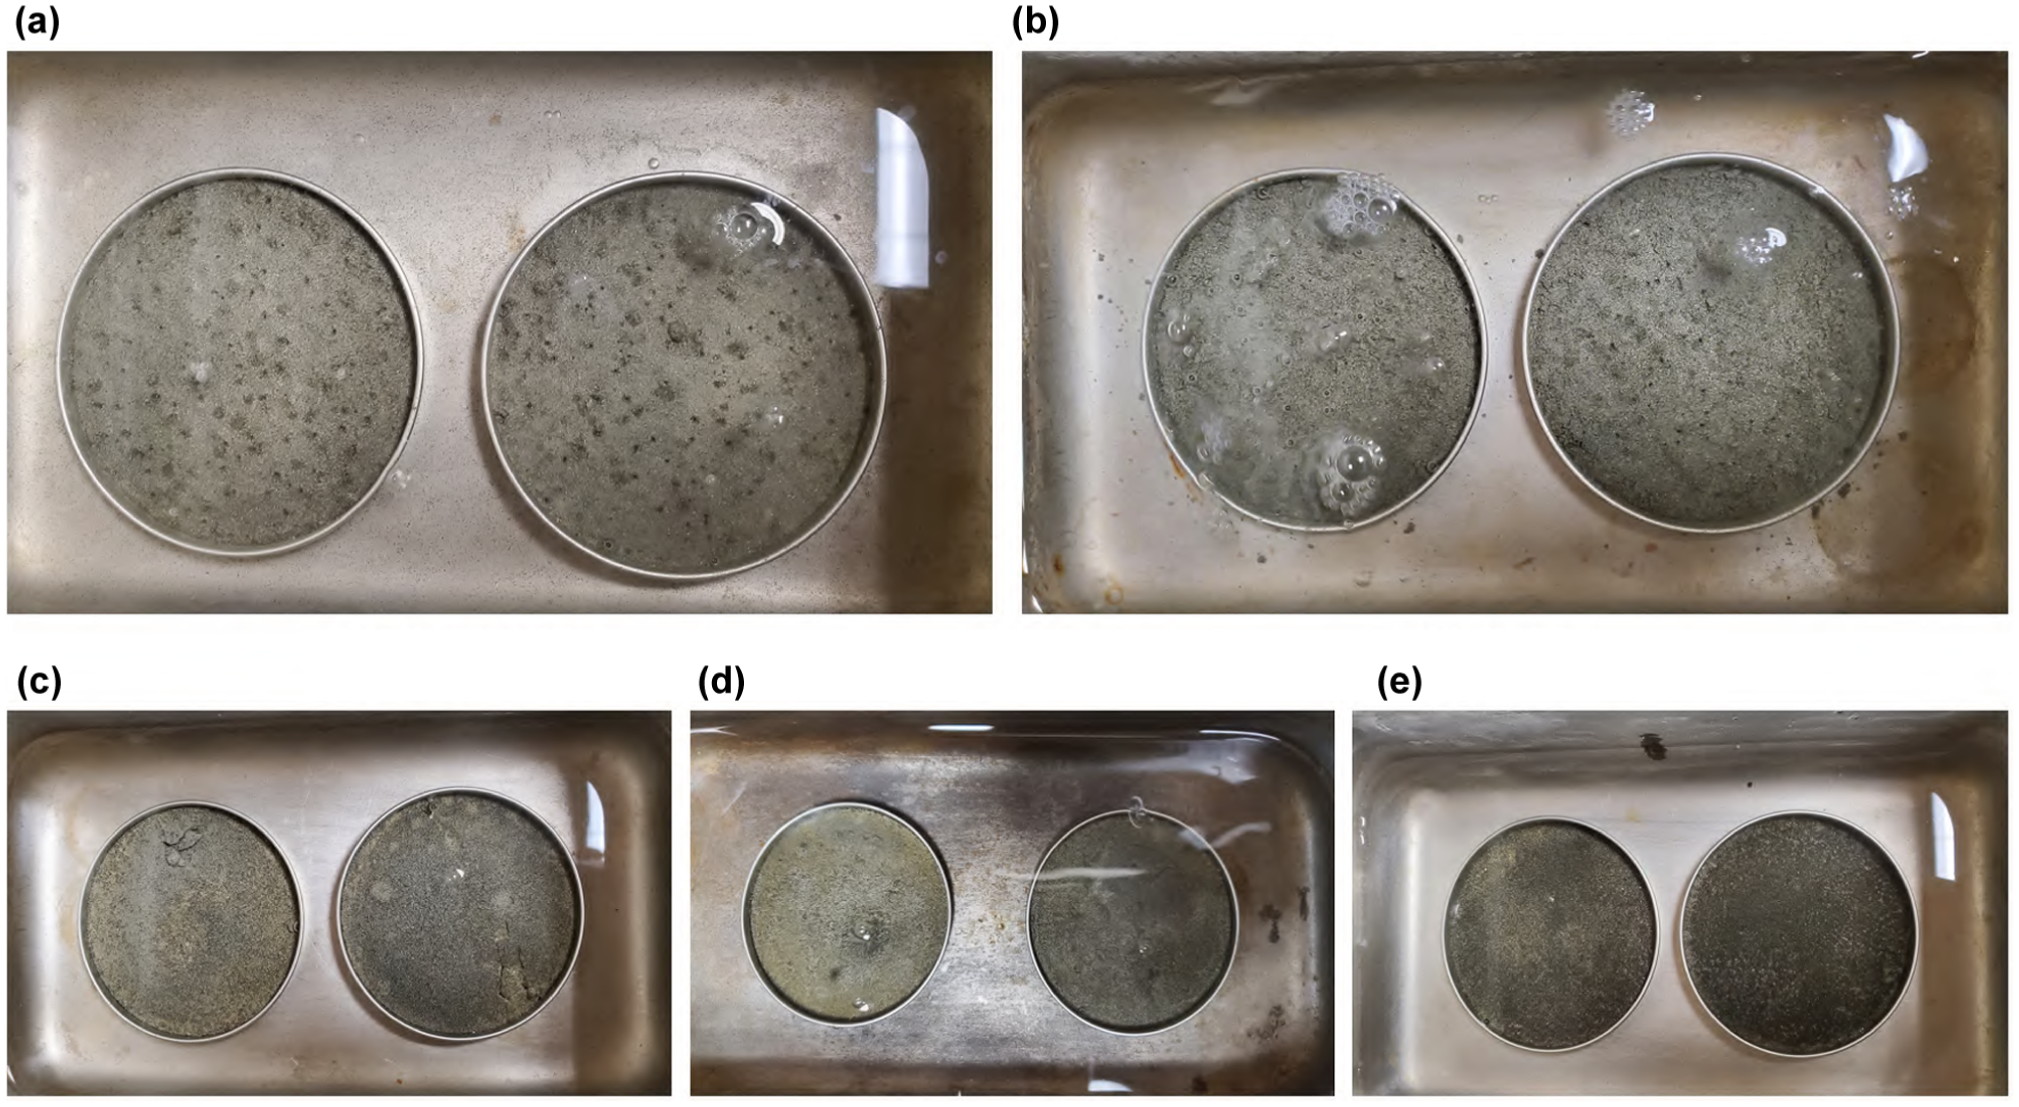
Comparison of water immersion performance for untreated control, calcium-chloride-brine-, and soybean-oil-treated samples: (a) control set; (b) calcium chloride brine; (c) 0.12 L/m2 soybean oil; (d) 0.6 L/m2 soybean oil; (e) 1.2 L/m2 soybean oil.
The soybean-oil-treated groups displayed intermediate behavior. Both the 0.6 L/m2 and 0.12 L/m2 dosages showed greater cumulative mass loss than the untreated control, at 10.67% and 12.12%, respectively. These higher losses reflect insufficient oil film thickness, which failed to prevent water infiltration. Limited bubble formation and partial disintegration of the dust–oil matrix led to the detachment of both fine particles and emulsified or leached soybean oil, resulting in elevated mass loss. This condition is also illustrated in Figure 9, where the low-dosage soybean-oil samples show partial surface disruption.
In contrast, the 1.2 L/m2 soybean-oil group exhibited the lowest cumulative mass loss of all the treatments, at only 1.38%. The thick, continuous, and hydrophobic oil film prevented water penetration, suppressed bubble formation, and maintained a cohesive oil–dust matrix throughout the entire cycling process. As shown in Figure 9, the 1.2 L/m2 samples remained structurally intact with no visible bubbling, confirming their superior resistance to water-induced degradation.
Traffic Load Stability Test
The traffic load stability test, summarized in Figure 10, evaluated the traffic load durability of the treated surfaces against repeated impacts, simulating vehicle traffic. The figure does not show the untreated dust control set because it almost lost all dust in the first cycle. Soybean oil at 1.2 L/m2 exhibited virtually no mass loss after repeated impacts, while the 0.6 L/m2 dosage showed only minimal loss (0.25%), indicating strong resistance to impact-induced degradation. This indicates that these formulations can effectively maintain the integrity of the road surface under traffic-induced loading, providing robust dust suppression, even with ongoing traffic. The 0.12 L/m2 soybean-oil group showed moderate mass loss, of 9.56%, suggesting a reduction in traffic load stability at lower application rates. Notably, CCB exhibited the highest mass loss, exceeding
Comparison of mass loss under repeated traffic load impacts (Vialit plate shock test) for samples treated with soybean oil and calcium chloride brine.
Field Performance Results
The field applications provided real-world validation of the laboratory findings, offering insights into the performance of soybean-oil-based suppressants in actual traffic and environmental conditions. The six test sections were denoted S1 (1.2 L/m2 soybean oil), S2 (0.6 L/m2 soybean oil; water:soybean = 1:1), S3 (0.12 L/m2 soybean oil; water:soybean = 9:1), S4 (0.8 L/m2 CCB), S5 (0.8 L/m2 soybean oil, unblended), and S6 (0.8 L/m2 soybean oil, blended). The details are given in Table 4.
On-Vehicle PM Measurement
The on-vehicle PM measurement results track
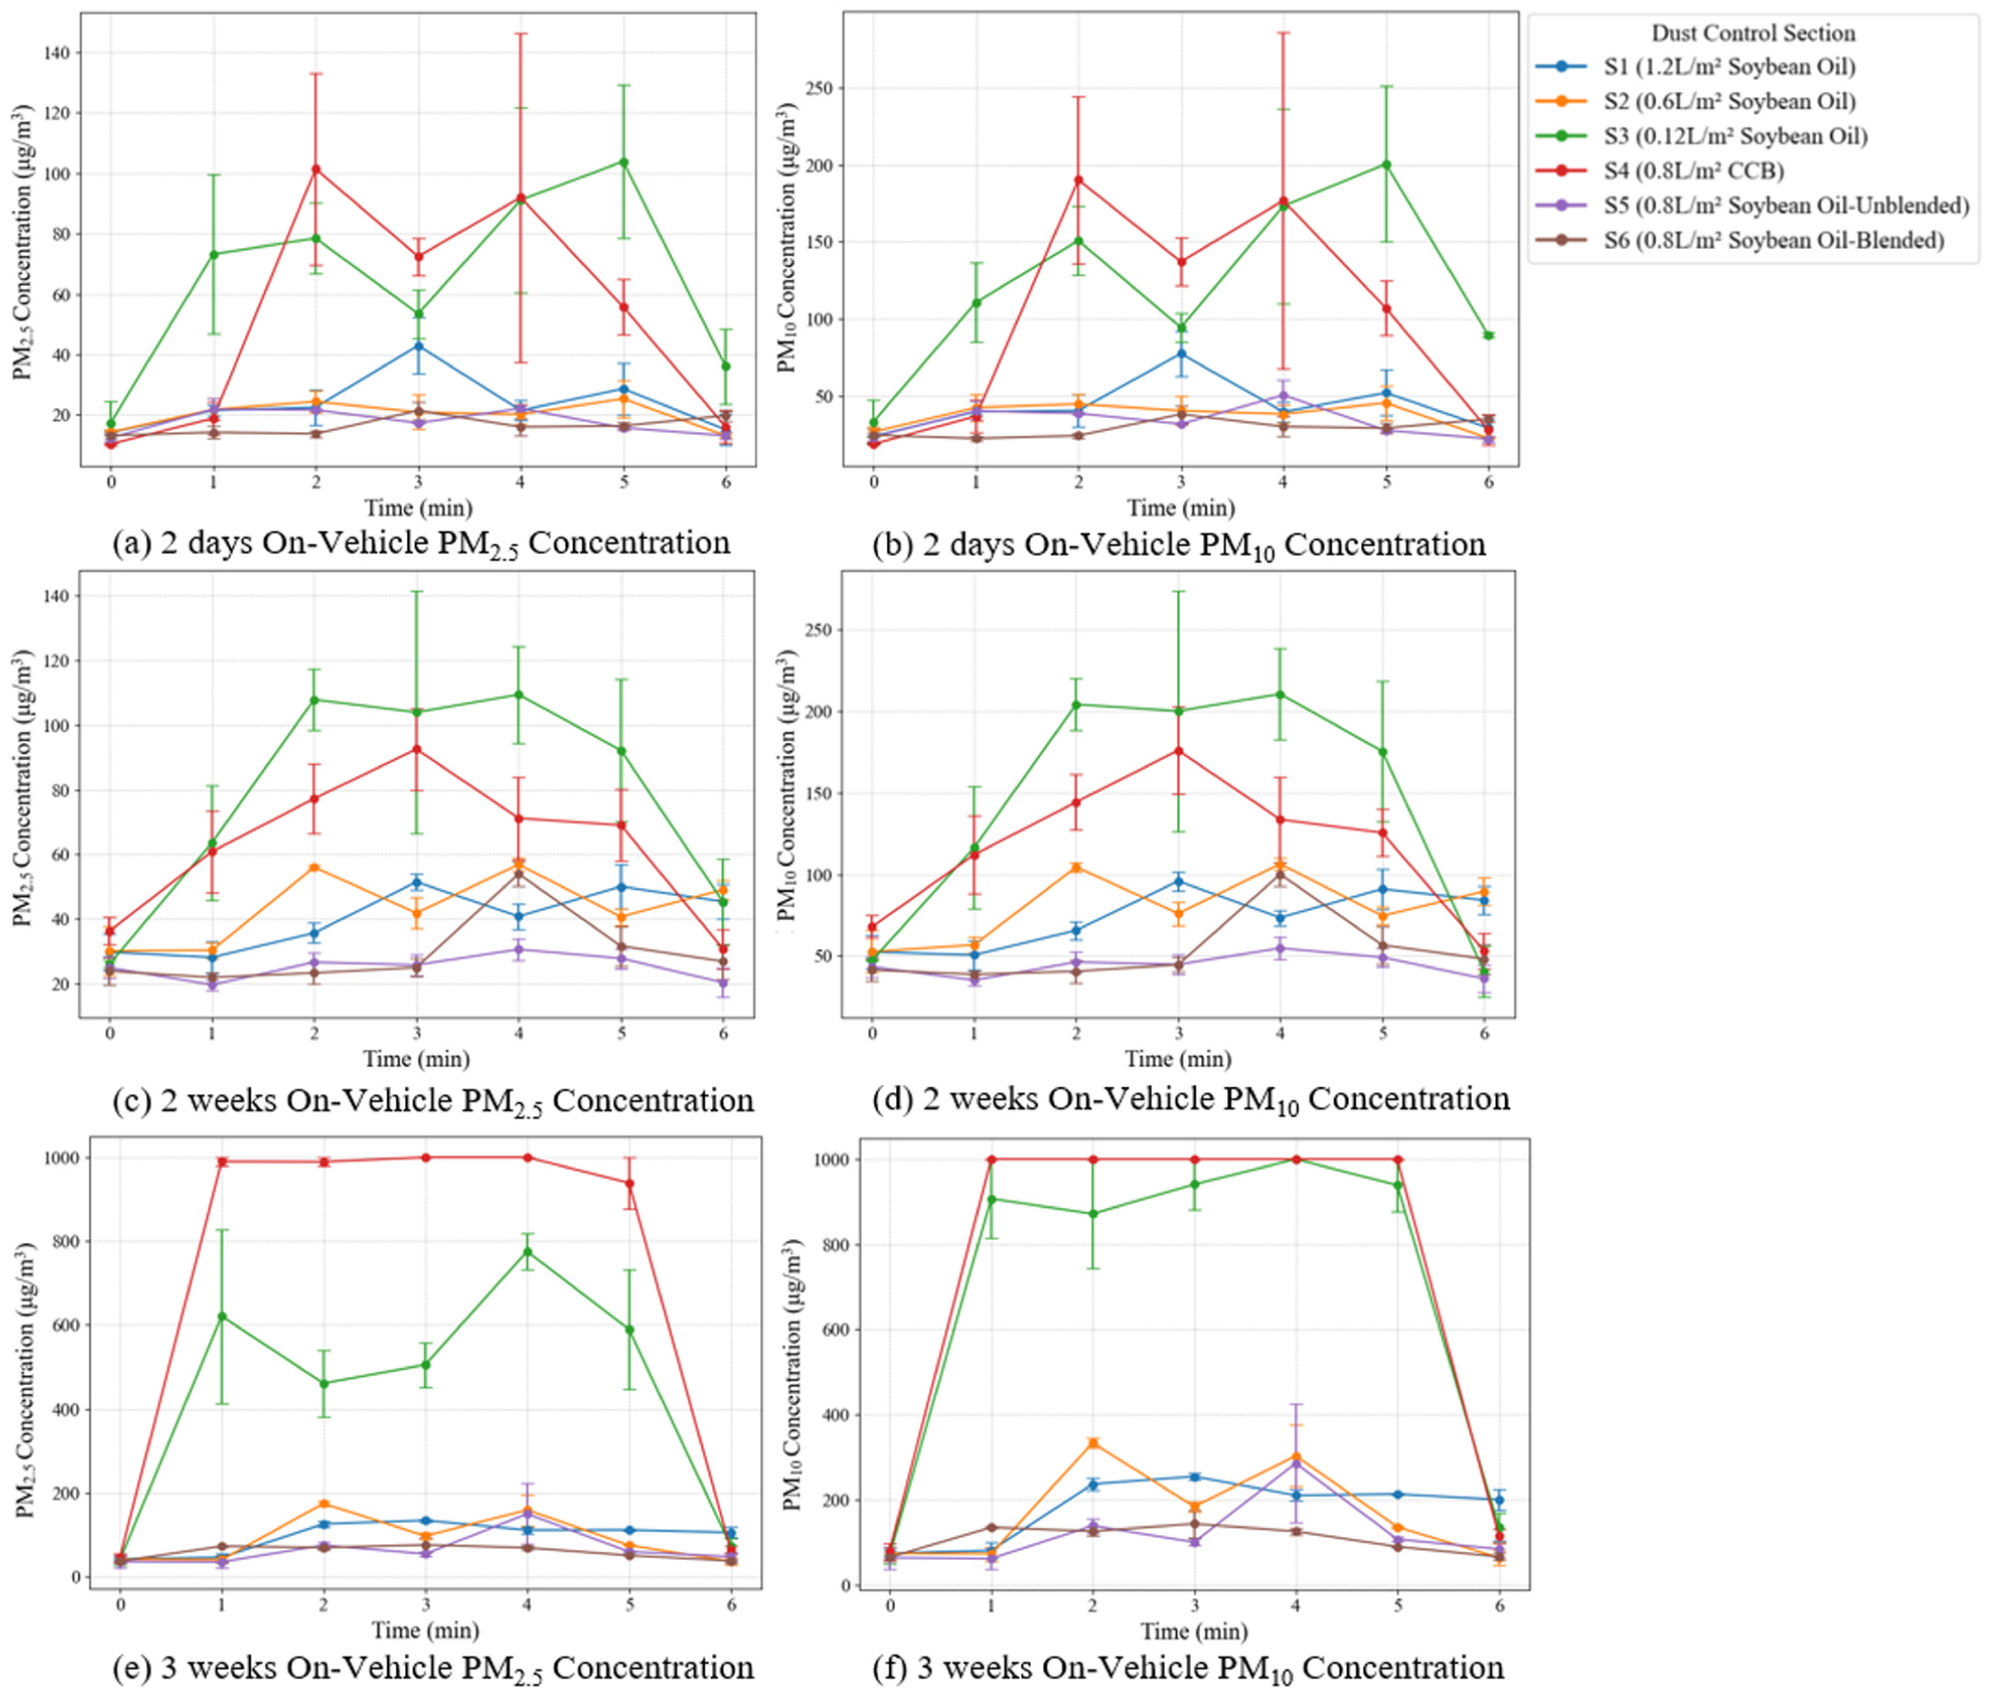
On-vehicle particulate matter measurement test results: (a) 2 days
At 2 days after application (Figure 11, a and
b
), the soybean-oil sections with higher dosages and blended application showed relatively low and stable concentrations. For S5 and S6, the mean
At 2 weeks after application (Figure 11, c and
d
), S5 clearly became the best-performing section. Its mean
By 3 weeks after application (Figure 11, e and
f
), differences between treatments became more pronounced. The blended soybean-oil section, S6, showed the most durable performance, with mean
The AUC, derived from the PM concentration versus time graphs for the on-vehicle PM measurement (Figure 12), provides a comprehensive metric for overall dust suppression performance. Lower AUCs indicate better performance. The AUC for performance is calculated as

where
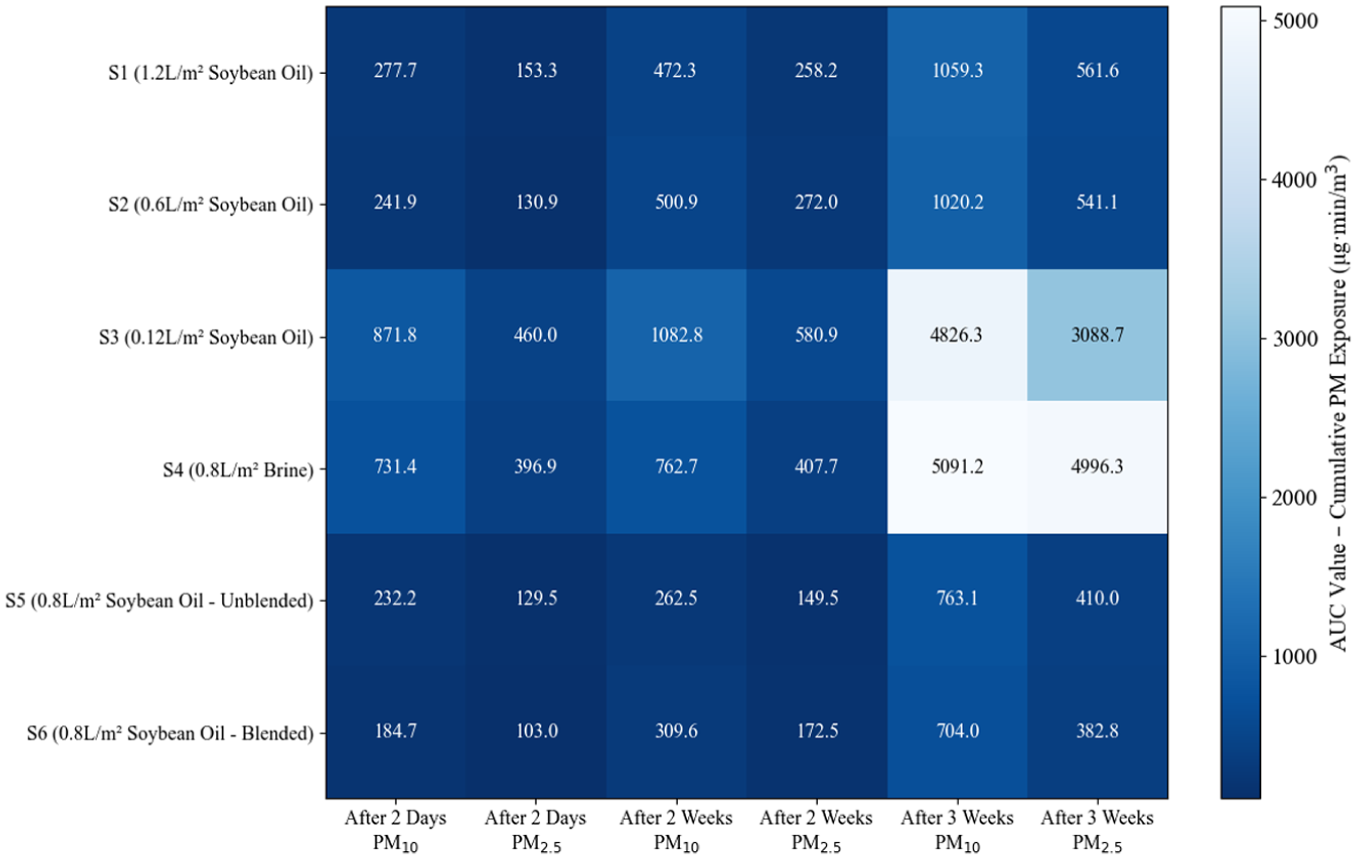
On-vehicle dust suppressant performance evaluated by area under the curve for
Across all time points (2 days, 2 weeks, 3 weeks), S5 and S6 consistently exhibit the lowest AUCs, confirming their superior and sustained dust suppression efficiency under traffic. Both S1 and S2 also show relatively low AUCs. In contrast, S4 consistently has high AUCs, especially at 3 weeks after application, highlighting significant performance degradation. S3 also shows high AUCs, indicating its limited effectiveness at low concentrations.
Blower-Induced PM Measurement
In the blower test, a controlled local airflow was applied to evaluate each treatment’s resistance to wind-driven particle release. Because the blower was applied to three independent points on each section, the resulting measurements exhibit localized variability—especially for the less effective treatments, such as S3 and S4. The measurement results are shown in Figure 13.
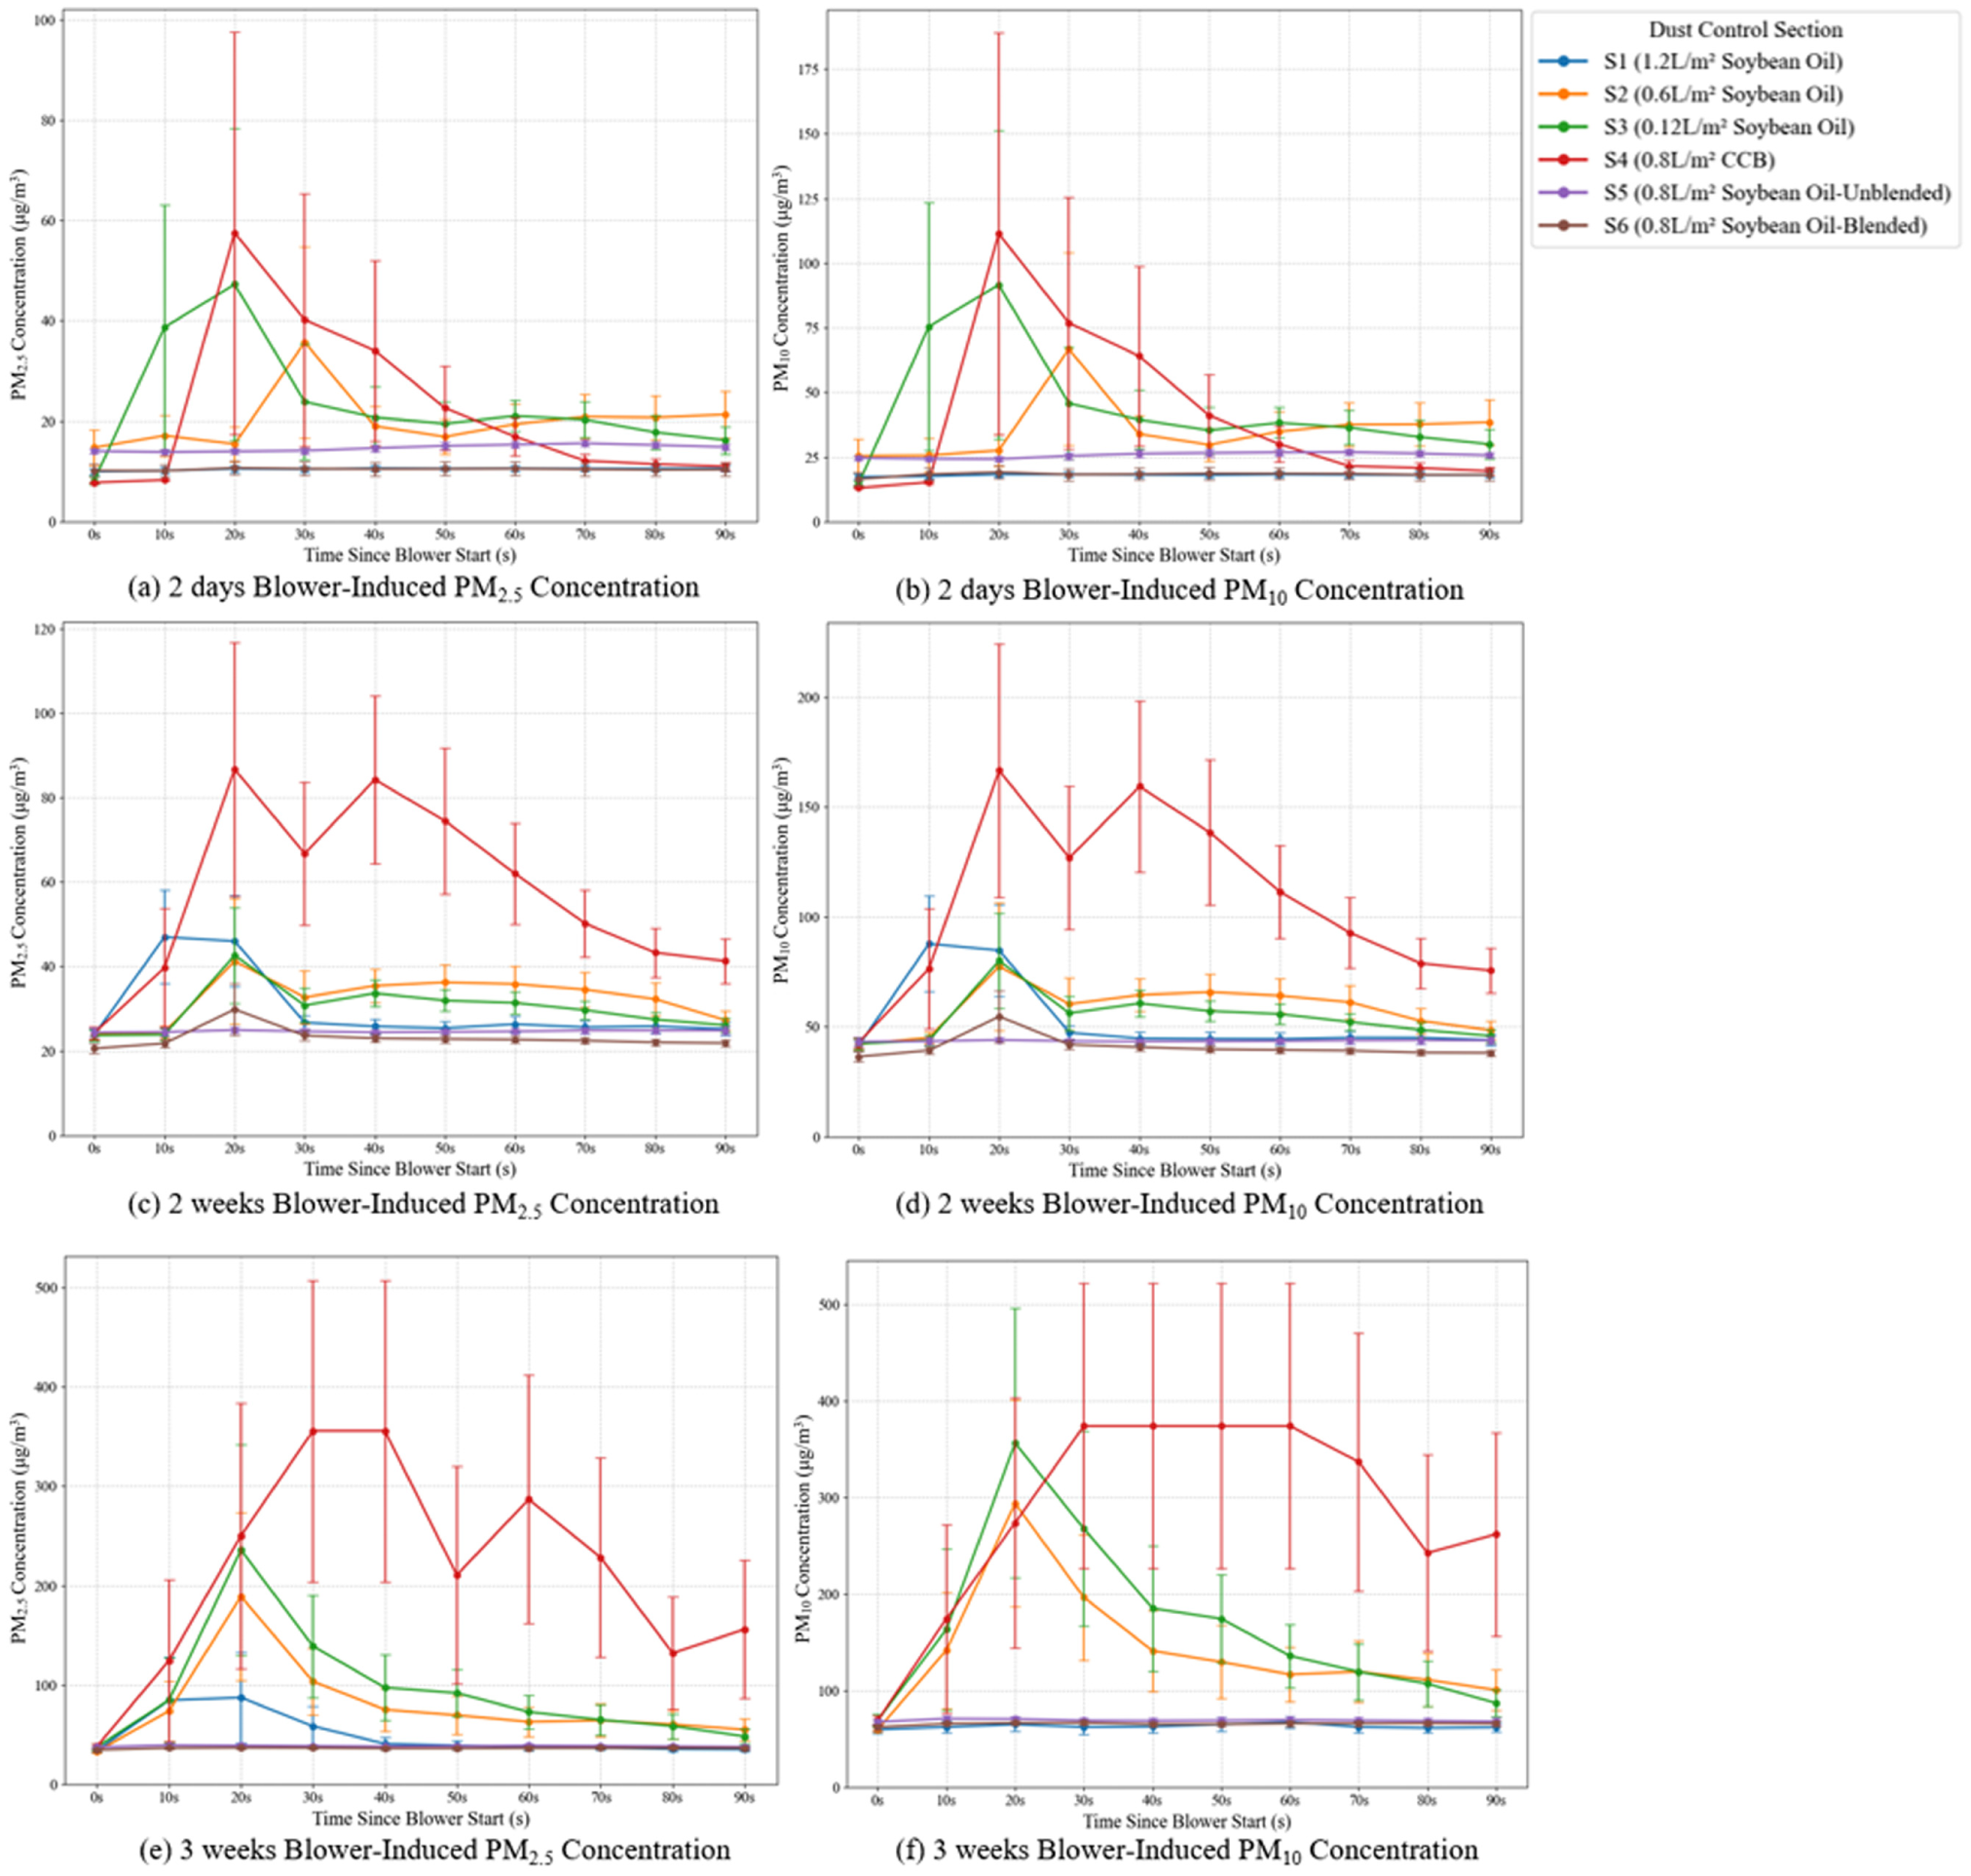
Blower-induced particulate matter measurement results: (a) 2 days
At 2 days after application (Figure 13, a and
b
), S1, S5, and S6 maintained consistently low and stable
At 2 weeks (Figure 13, c and
d
), S5 and S6 continued to demonstrate the most stable suppression across the test duration, with only minor increases in particulate concentration over time. Both S2 and S3 showed moderate rises but remained substantially lower than the weaker treatments. S4 exhibited the highest emissions and the largest error bars of all sections, indicating that brine lost much of its wind erosion resistance within 2 weeks. The corresponding
2 week blower-induced particulate matter measurement:
By 3 weeks (Figure 13, e and
f
), clear divergence between treatments became evident. S1, S5, and S6 continued to show relatively low emission levels and stable temporal trends, confirming the durability of soybean-oil-based suppression—especially for the blended S6 formulation. S2 displayed moderate degradation but still retained partial effectiveness. In contrast, S4 showed persistently high
Overall, the blower-induced PM measurements show only partial agreement with the laboratory erosion results. Soybean-oil treatments with moderate or high dosages generally provided stronger and more durable resistance to wind-driven particulate release than low-dosage applications or brine. However, the field blower test did not reproduce the laboratory ranking. In the laboratory, the 1.2 L/m2 treatment performed the best, but in the field, the blended and unblended 0.8 L/m2 treatments showed the most stable and persistent suppression. The 1.2 L/m2 treatment still provided reasonable control, although its performance was no longer the strongest of the soybean-oil formulations, probably because of field-level variability that was not present in the laboratory tests.
AUCs for the blower-induced PM measurement (Figure 15) provide a quantitative assessment of dust suppressant performance over time. Lower AUCs indicate reduced cumulative particulate release and thus stronger surface cohesion and wind erosion resistance. S5 (0.8 L/m2 soybean oil, unblended) and S6 (0.8 L/m2 soybean oil, blended) consistently recorded the lowest AUCs across all particle sizes and time points. For example, at 2 days, their
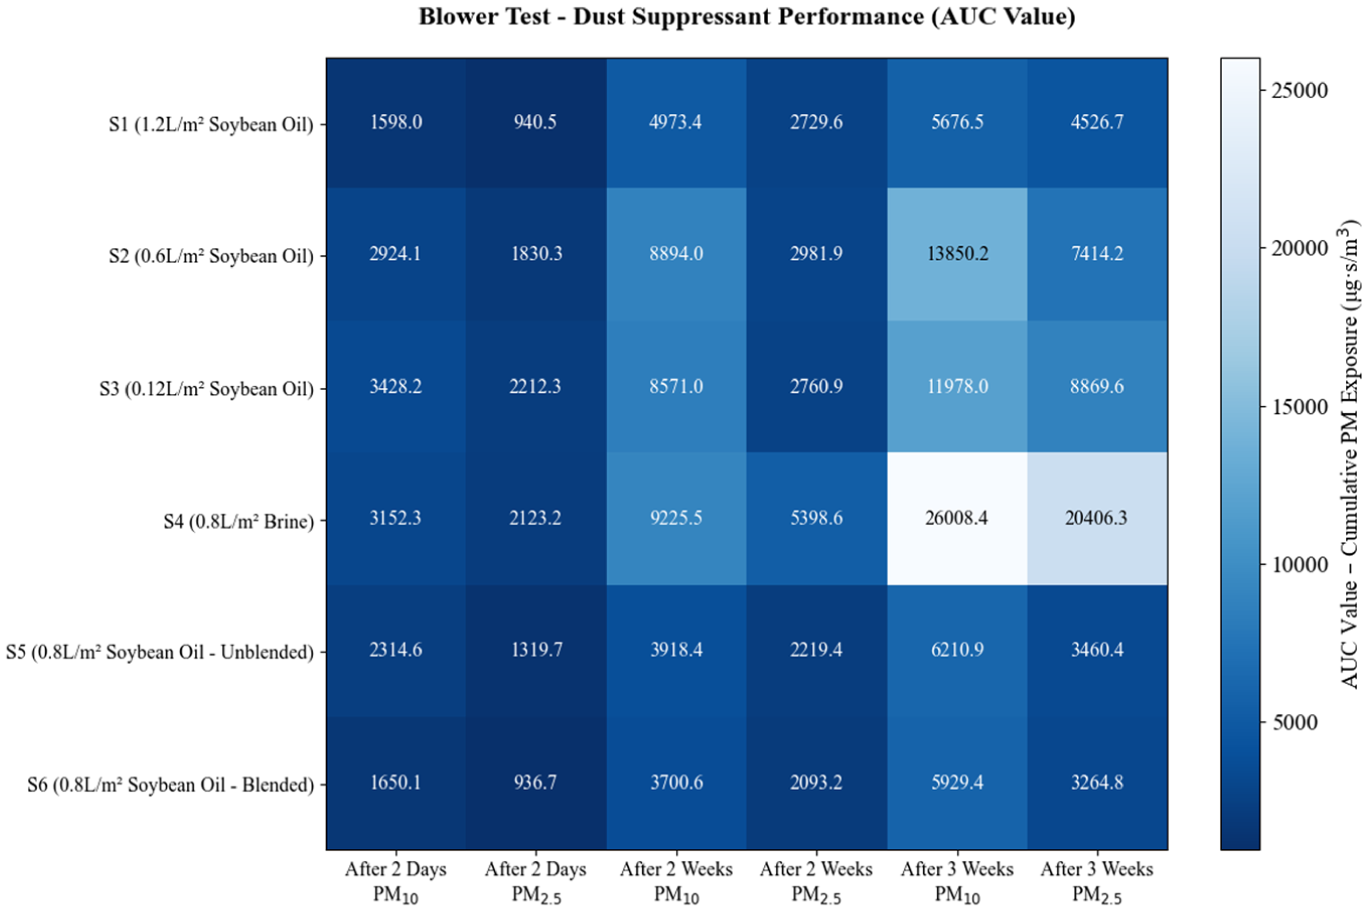
Blower-induced particulate matter measurement: dust suppressant performance evaluated by area under the curve for
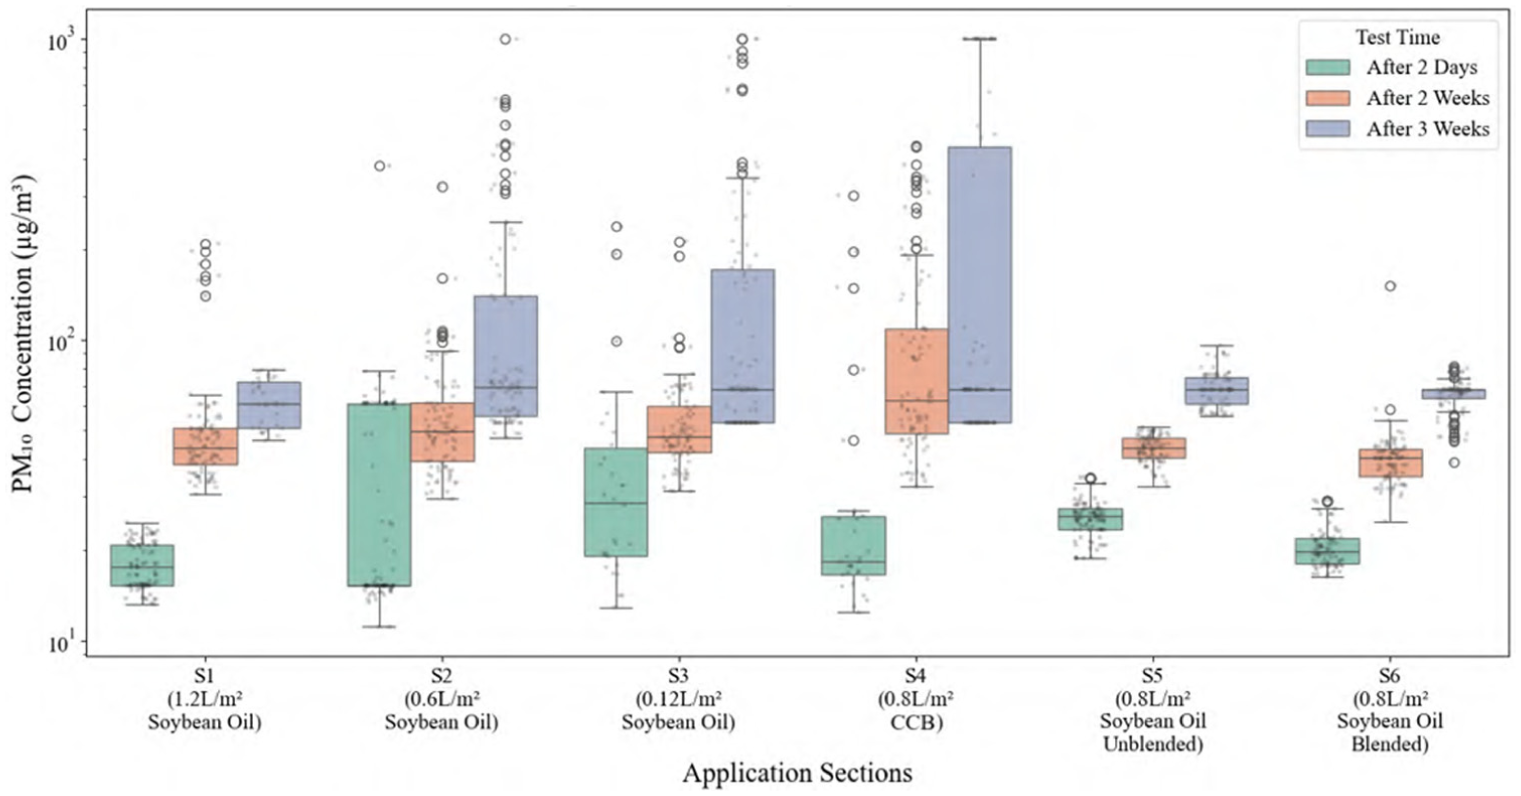
PM Concentration Distribution (Blower-Induced, All Time Points)
To further summarize the statistical behavior of particulate emissions from each treatment section, box plots of all
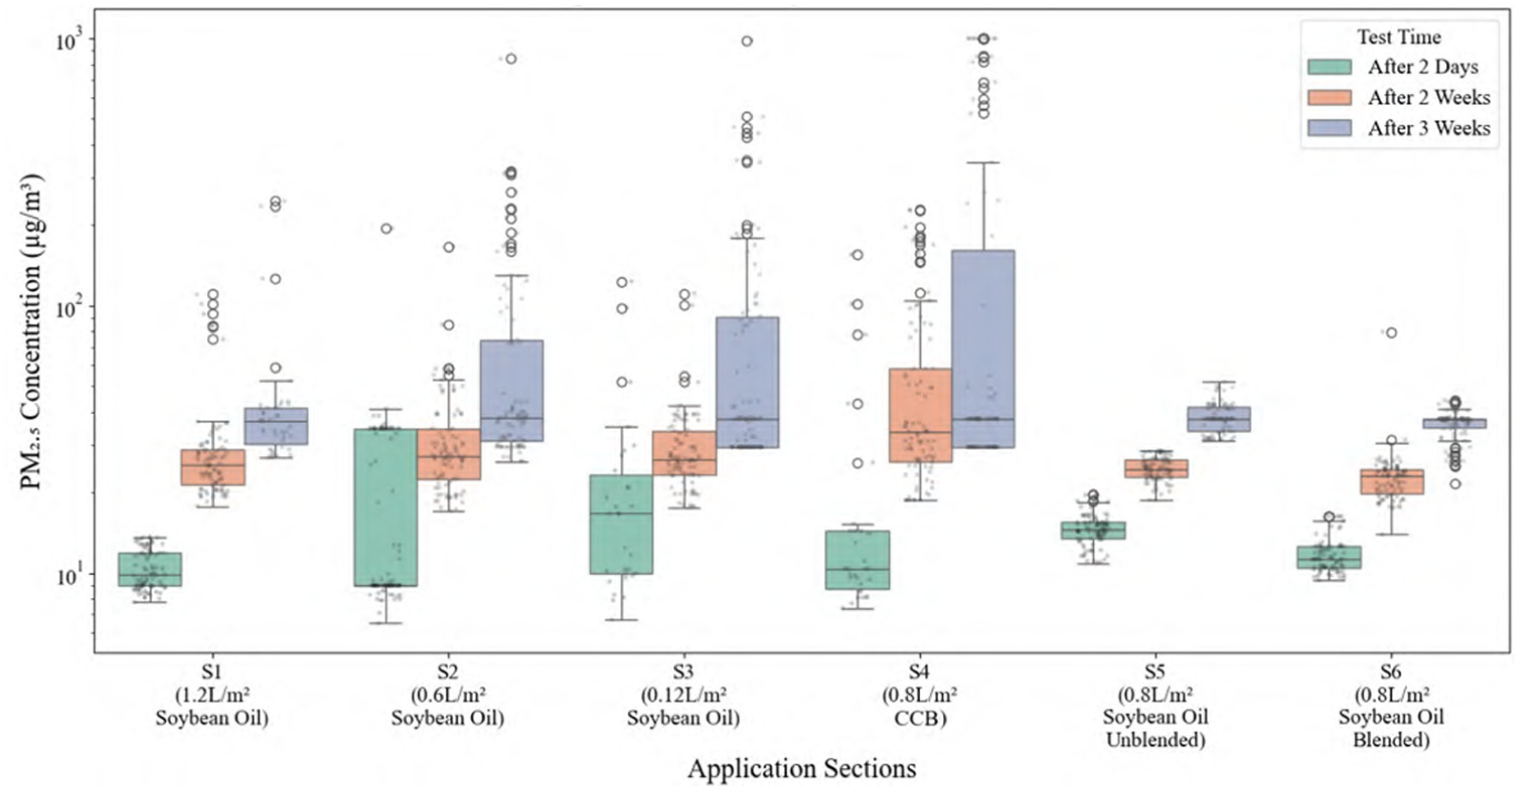
Blower-induced PM measurement:
Blower-induced PM measurement:
In each box plot, the median line represents the typical emission level, while the box height (interquartile range [IQR]) shows how consistent the measurements are across replicate points. Shorter boxes and narrower whiskers indicate more stable suppression, whereas wider boxes, long whiskers, and numerous outliers indicate unstable or degraded performance. The overlaid scatter points show all individual measurements, revealing localized failures or spatial variability within a section. A logarithmic y-axis is used to accommodate the multi-order magnitude differences observed between treatments.
Across all time points, S5 and S6 consistently exhibit the lowest medians, the smallest IQRs, and very few outliers, demonstrating highly stable and durable suppression. Both S1 and S2 show moderate variability, with S1 displaying occasional high-value outliers—consistent with the uneven field application observed on site. Both S3 and S4 show the highest medians, the widest spreads, and numerous extreme outliers, reflecting weak binding at low soybean-oil dosages (S3) and severe degradation of the brine treatment (S4). These statistical results corroborate the time-series PM trends and support the AUC-based durability assessment. They reinforce the superior and long-lasting effectiveness of soybean-oil-based suppressants, particularly at the 0.8 L/m2 application rate.
Durability Analysis (AUC Relative Change)
To further compare the long-term durability of suppressants, the relative increase in AUC between 2 days and 3 weeks was calculated for all sections and both test methods. This is presented in Figure 18. A lower relative increase indicates greater durability and sustained performance. The durability is calculated as the relative increase in AUC.

A value closer to zero indicates better durability (less degradation in performance over time).
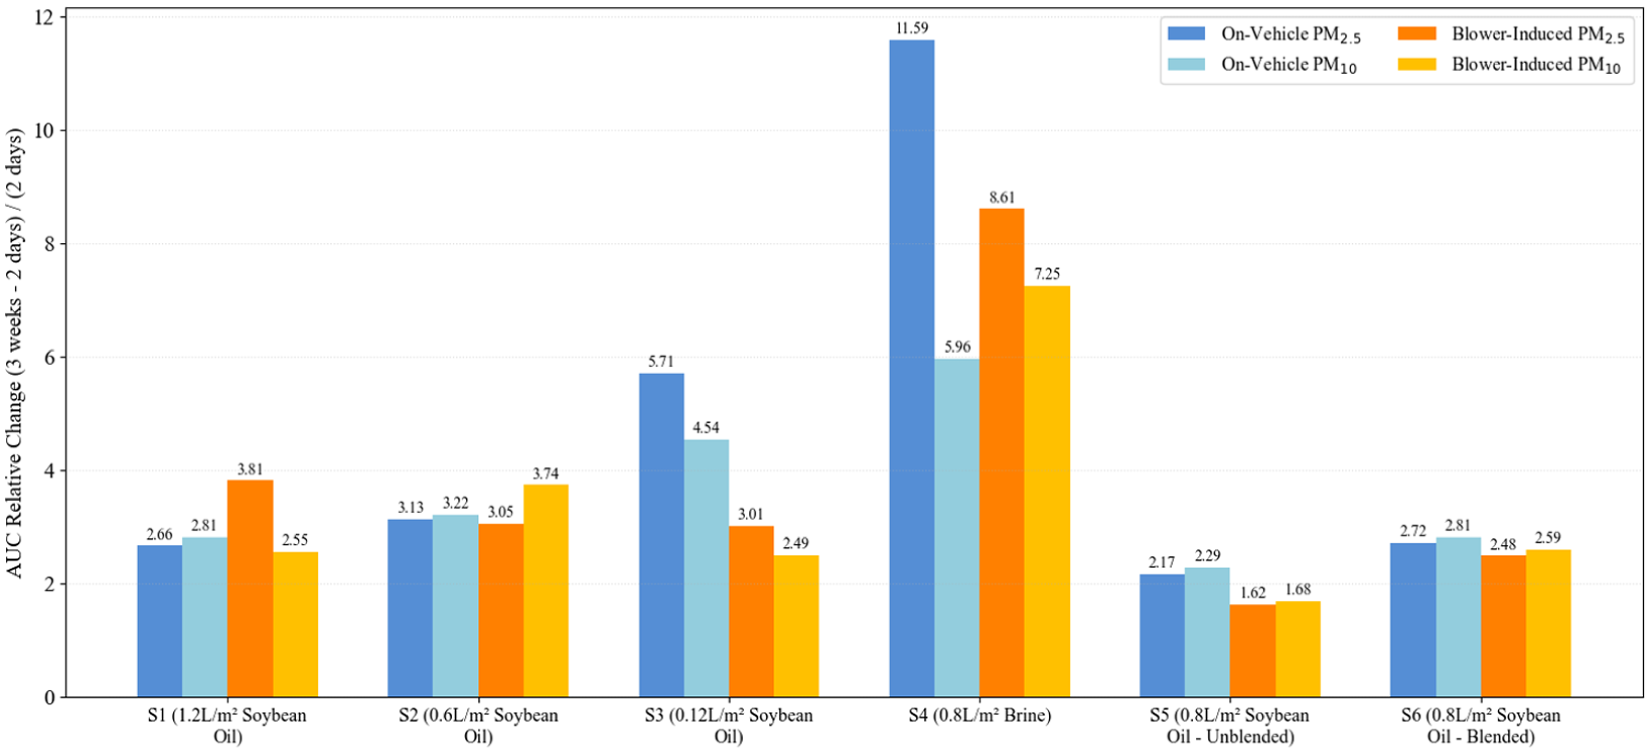
Durability analysis of dust suppressant performance based on relative increase in AUC between 2 day and 3 week measurements.
Soybean-oil-based treatments (S1, S2, S5, S6) consistently demonstrate lower relative changes in AUC, compared with CCB (S4) for both truck and blower tests for
These results support the conclusion that soybean-oil-based dust suppressants, especially at optimized application rates and methods, maintain their effectiveness significantly longer than conventional chloride-based solutions, leading to reduced reapplication needs and enhanced sustainability.
Discussion
Overall Efficacy and Durability of Soybean-Oil-Based Suppressants.
The combined laboratory and field results indicate that soybean-oil-based dust suppressants offer an effective and durable solution for controlling fugitive dust on unpaved roads, particularly compared with traditional chloride-based solutions, such as CCB. In laboratory settings, soybean oil applied at higher dosages (1.2 L/m2) demonstrated exceptional resistance to wind erosion and wetting–drying durability; this performance provided a clear advantage over the water-soluble CCB. The superior traffic load durability of soybean-oil-treated surfaces under simulated traffic loads reinforces its potential for long-term performance. Based on the laboratory wind erosion, wetting–drying, and traffic loading tests, 1.2 L/m2 was identified as the optimized laboratory dosage.
The field applications generally corroborate these laboratory findings. The higher-dosage soybean-oil treatments (S1, S2, S5, S6) consistently showed superior dust suppression efficacy in both traffic-induced and blower-induced PM measurements over 3 weeks. Notably, the performance of CCB (S4) degraded significantly over time, particularly by the 3 week mark in on-vehicle PM measurement, where it exhibited very high PM emissions (up to 1000 µg/m3), indicating a substantial loss of effectiveness. This means that it is limited in long-term effectiveness in the field, owing to wash-off and traffic load effects.
Effect of Application Method and Dosage
The results emphasize the critical role of application method and dosage in the performance of soybean-oil-based suppressants. In the laboratory, the 1.2 L/m2 soybean-oil treatment showed the strongest resistance to wind and wetting–drying durability. But in the field, the 1.2 L/m2 section (S1) did not give the best blower-induced response. The box plots of blower measurements in Figures 16 and 17 show that S1 has a wider distribution and higher upper values than S5 and S6. This indicates that S1 occasionally released much more dust at some locations, even though its median concentration remained moderate.
The statistical distributions observed here corroborate the time-history trends presented in Figure 13. For S1, one of the three blower measurement points often shows sharp peaks in both
Drone images provide direct visual support for this interpretation. Figure 19 compares S1, with 1.2 L/m2 soybean oil, and S6, with blended 0.8 L/m2 soybean oil. S6 shows a relatively uniform color and texture along the wheel paths and the center of the road. In contrast, S1 exhibits a light central band that appears almost untreated and much darker zones near the edges. This reflects the effect of the road crown, which directs fluid movement toward the shoulders and concentrates excess oil in those areas.
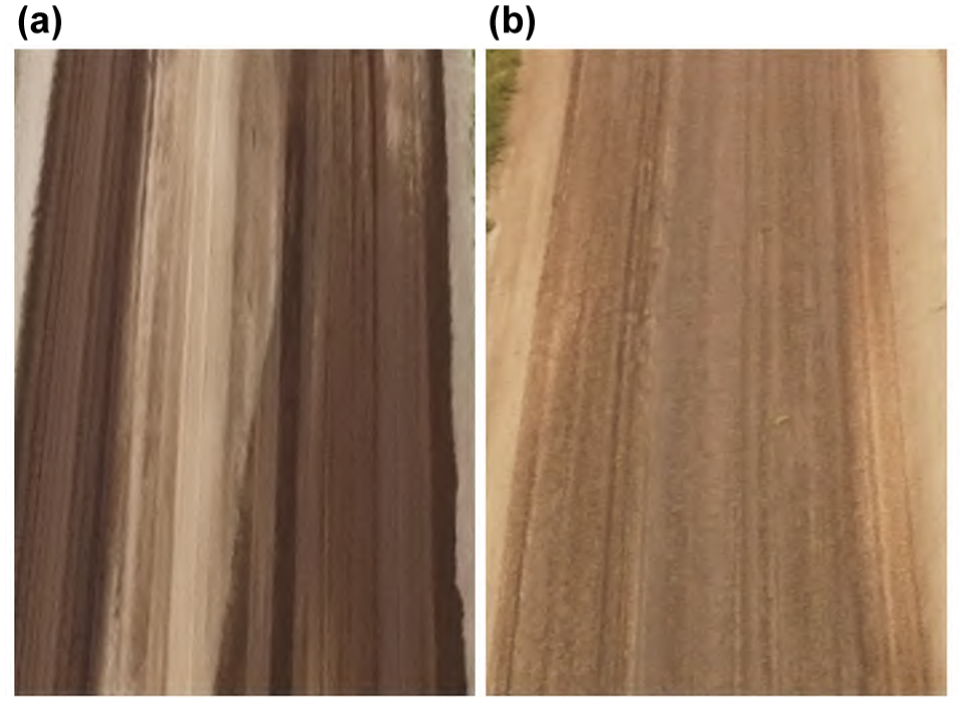
Drone photographs of treated road sections: (a) S1; (b) S6. S6, with blended 0.8 L/m2 soybean oil, shows a relatively uniform surface; S1, with 1.2 L/m2 soybean oil, shows a pale central band and darker edges that indicate strong spatial variation in oil content.
Figure 20 shows the darker zones in S1 in more detail. The central strip remains light, while the upper and lower bands appear much darker. This pattern supports the hypothesis that the high oil volume in S1 did not fully infiltrate the aggregate matrix. Instead, part of the oil migrated laterally along the camber and accumulated near the edges. As a result, some blower points were tested on over-treated areas and others on under-treated areas; this produced the large spread in the box plots and the isolated high peaks in the time series.
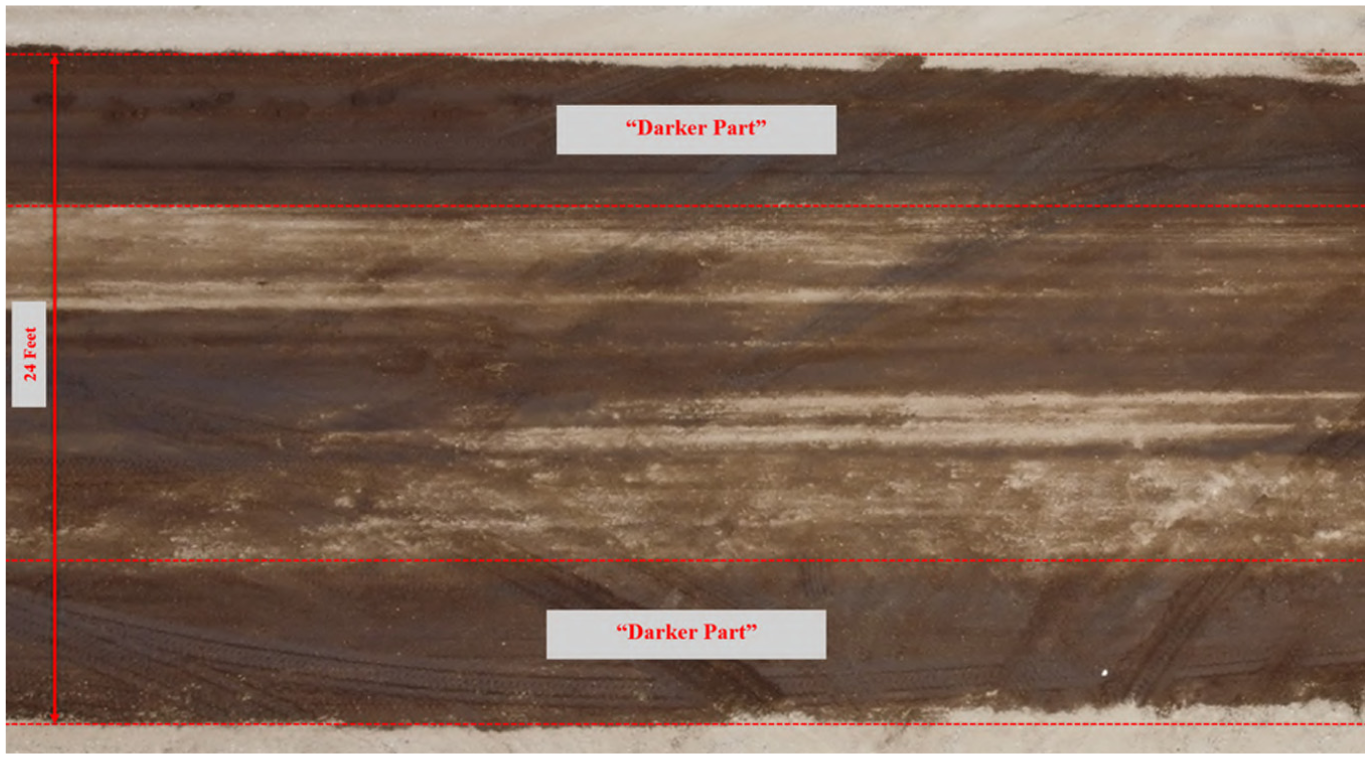
Drone photograph of S1 section with 1.2 L/m2 soybean oil. The darker bands near the edges and the lighter central band indicate highly nonuniform oil distribution along the cross section of the road.
This uneven distribution reduces the effective performance of what should be the strongest dosage. In contrast, S5 and S6, with 0.8 L/m2 soybean oil, show both lower median PM values and narrower IQRs in the blower box plots. The blended section, S6, in particular, combines a moderate dosage with more uniform mixing; this leads to consistent field behavior and stronger overall dust suppression.
Comparison with Commercial Standard (CCB)
The findings demonstrate a clear advantage of soybean-based suppressants over CCB in durability and long-term performance. While CCB showed good initial wind erosion resistance in the laboratory, its poor resistance to wetting–drying durability and traffic load effects under traffic became evident in both laboratory and field tests. The sharp increase in PM emissions from the CCB-treated section after 1 to 3 weeks in the field applications confirms its limited lifespan and the necessitation of a high reapplication frequency, which can lead to higher overall costs and environmental concerns. Soybean-based suppressants, with their inherent water resistance and traffic load stability, offer a more sustainable and durable alternative.
Implications for Sustainability
The superior long-term performance of soybean-based suppressants, particularly their resistance to water wash-off and traffic load effects, suggests that they require less frequent reapplication, compared with CCB. This reduction in maintenance frequency offers several sustainability benefits. Soybean-oil-based suppressants reduce the overall consumption of water and raw materials by decreasing the frequency of application. This also helps to reduce operational costs, as fewer reapplications translate to reduced labor, equipment use, and fuel consumption—ultimately minimizing long-term maintenance expenditure. Furthermore, the environmental effect is lessened: unlike salt-based products, soybean oil does not pose a risk of soil or groundwater contamination. The decreased reliance on petroleum-derived inputs and transportation further contributes to a lower carbon footprint.
Cost and Durability Considerations
A direct comparison of material price shows that soybean oil has a higher initial cost than CCB, as illustrated in Figure 21. However, material cost alone does not determine long-term economic performance. The durability results indicate that CCB loses effectiveness rapidly. For example, the AUC for CCB in the truck test increased by 11.59 times within 3 weeks. In the same period, the soybean-oil treatments showed much slower growth. This indicates that CCB would require more frequent reapplications to maintain adequate dust control, while soybean oil would remain effective for a longer period.

Typical market price comparison per application for soybean oil and CCB.
The range of soybean-oil application rates also provides additional flexibility for cost control. At the lowest dosage of 0.12 L/m2, the material cost is only about 1.34 times that of CCB, yet its overall performance, especially durability, is still superior. Although the initial suppression at this dosage is weaker than that of higher soybean-oil treatments, the rate of degradation remains slower than that of CCB. This means that even low-dosage soybean-oil applications can achieve a more stable performance over time.
When labor, equipment, fuel, and traffic interruptions associated with repeated reapplications are considered, the effective cost of CCB increases significantly. In contrast, soybean-based suppressants combine stronger performance with slower degradation. This combination suggests that their long-term cost profile can be competitive or even advantageous, particularly when agencies prioritize durability environmental safety and reduced maintenance frequency.
Comparative Durability Perspective: Chlorides, Stabilizers, and Soybean Oil
Dust control technologies can be considered along a durability continuum. Chloride-based suppressants, such as CCB, provide effective short-term control but degrade quickly under precipitation and traffic. At the opposite end of the continuum, chemical stabilizers (cement, lime, polymers) form long-lasting bonds but require intensive construction processes and higher application costs. Soybean oil operates in the intermediate range of this spectrum. Although it does not produce chemical stabilization, its hydrophobic film and particle binding capability allow it to sustain performance over several weeks, as evidenced by significantly lower emission growth relative to CCB. This positions soybean oil as a practical midterm solution for agencies seeking improved durability without the cost and structural modification associated with full soil stabilization.
Conclusion
The findings of this comprehensive study confirm that soybean-oil-based dust suppressants significantly outperform commercial CCB in both initial suppression effectiveness and long-term durability. Controlled laboratory experiments and 3 weeks of field monitoring consistently demonstrated that soybean oil maintains stronger resistance to erosion processes and produces substantially lower particulate emissions across a range of application scenarios.
Specifically, laboratory tests showed that soybean oil exhibited excellent resistance to wind erosion as well as minimal material loss under water exposure and traffic-induced loading. The laboratory-optimized dosage for maximizing durability was identified as 1.2 L/m2, which produced the least erosion and the most stable surface response under controlled conditions. Field observations indicated that the performance depended on uniform application. Excessive oil at this dosage tended to migrate laterally along the road crown, resulting in over-saturated shoulders and an under-treated center. In contrast, the most effective and stable field performance was achieved at the more uniformly applied 0.8 L/m2 dosage (S5 and S6).
Across 3 weeks of field measurements, soybean-oil treatments consistently maintained lower PM emissions than CCB. The durability advantage is most clearly demonstrated in the AUC results. The CCB-treated section showed an increase by a factor of 11.59 in the truck-test
Cost analysis further indicates that soybean oil can be a competitive option when durability and reapplication frequency are considered. Although its unit price is higher than CCB, dosage flexibility provides practical value. The lowest soybean-oil dosage tested (0.12 L/m2) costs approximately 1.34 times the price of CCB yet demonstrates superior long-term durability; this reduces cumulative material, labor, and equipment costs associated with repeated applications.
In conclusion, soybean-oil-based dust suppressants offer advantages in performance, durability, and environmental profile. Meanwhile, soybean oil also provides flexibility in balancing cost and treatment effectiveness. With optimized and uniformly implemented application practices, soybean oil is a viable, sustainable, and competitive alternative to CCB for unpaved road dust control.
Limitations and Future Work
Although the results support the effectiveness of soybean-based dust suppressants, several limitations warrant further research. First, the field study covered only a 3 week period, limiting the assessment of seasonal durability. Longer-term monitoring across varying weather conditions, freeze–thaw cycles, and repeated traffic load would provide a more complete understanding of service life and long-term cost performance.
Second, the field outcomes highlight the importance of uniform application. The high dosage of 1.2 L/m2 demonstrated excellent performance in laboratory settings but performed inconsistently in the field, owing to nonuniform distribution caused by road geometry and material absorption. Future work should be focused on developing standardized mixing and application procedures tailored to different road shapes, soil types, and equipment systems. Experiments designed specifically to study oil migration infiltration and particle encapsulation would further clarify the mechanisms behind field variability.
Third, the cost analysis in this study is limited to material unit prices. A full life-cycle cost assessment, including labor, equipment, transportation, maintenance intervals, environmental effects, and user-related costs, is needed. Such an analysis may demonstrate that soybean oil’s higher material cost can be offset by its superior durability and reduced reapplication frequency. More detailed economic modeling would provide transportation agencies with decision-support tools for selecting dosage levels (e.g.,
Finally, it should be noted that soybean oil functions as a physical dust suppressant, rather than a chemical stabilizer. Unlike polymer-, cement-, or lime-based additives, it does not form cementitious bonds with soil minerals. Therefore, soybean oil is best characterized as a medium-term dust control agent. Despite this, these results show that soybean oil maintained substantially better performance and durability than CCB over the 3 week evaluation period, indicating that its physical binding mechanism can offer practical and meaningful durability within real-world maintenance cycles.
Footnotes
Acknowledgements
The authors acknowledge Michigan Soybean Committee's support. The Clare County Road Commission and its Managing Director, Dewayne A. Rogers, provided essential assistance during the field application. The authors also gratefully acknowledge Mr. Greg Hilyard and other Clare County Road Commission staff for the valuable support during the field work.
Author Contributions
The authors confirm contributions to the paper as follows: study conception and design: Zhanping You; data collection: Zhongda Liu, Zhongqi Fan, Dongzhao Jin; analysis and interpretation of results: Zhongda Liu, Meng Wu, Lei Yin, Zhanping You; draft manuscript preparation: Zhongda Liu, Lei Yin, Meng Wu, Dongzhao Jin, Zhongqi Fan. All authors reviewed the results and approved the final version of the manuscript.
Declaration of Conflicting Interests
The authors declared no potential conflicts of interest with respect to the research, authorship, and/or publication of this article.
Funding
The authors disclosed receipt of the following financial support for the research, authorship, and/or publication of this article: support by the Michigan Soybean Committee.