
Abstract
Currently, the Manual on Uniform Traffic Control Devices for Streets and Highways recommends that the type of sign used at a pedestrian crosswalk be a warning sign instead of a regulatory sign. The same sign—a pedestrian crossing (W11-2) warning sign—can be used in advance of a pedestrian crosswalk. This article describes an FHWA project that aimed to develop and evaluate alternatives to the W11-2 sign for use at crosswalks. The research team investigated regulatory sign alternatives through human factors testing using a computer-based test (CBT) and in-field evaluations by observing driver yielding. The CBT showed that regulatory sign alternatives that included explicit commands (e.g., “Yield To”) were preferred and understood better than warning sign versions. Based on the CBT results and discussions with the project stakeholders, two signs were selected for the field test to compare with a base condition of the typical W11-2 sign. The field test signs included either the stop symbol or the stop word along with the word “for” and a walking pedestrian symbol within crosswalk lines. The sign shape was rectangular with a white background. The findings from field studies revealed similar driver yielding for the three signs tested. Stated in another manner, the test signs (regulatory with black text on a white background with a rectangular shape) developed in this research and the sign currently used at pedestrian crossings (warning with black text on a yellow background with a diamond shape) had a similar impact on a driver’s decision to yield or not yield to a crossing pedestrian.
Keywords
Introduction
As documented in several previous publications and as noted by leaders in traffic safety, the number of pedestrian injuries and fatalities has been trending upward and remains a significant portion of all crashes ( 1 , 2 ). Currently, the Manual on Uniform Traffic Control Devices for Streets and Highways (MUTCD) recommends that the type of sign used at a pedestrian crosswalk be a warning sign rather than a regulatory sign ( 3 ). The same sign—a pedestrian crossing (W11-2) warning sign—can be used in advance of a pedestrian crosswalk. No regulatory pedestrian sign exists for application on the shoulder at a crosswalk where the practitioner wants to provide a regulatory sign in lieu of (or in addition to) the W11-2 warning sign assembly. Current regulatory signs for use around a crosswalk include the “Yield Here to Pedestrians” sign (R1-5 or R1-5b) located with advance yield or stop line and in-street or overhead regulatory signs (R1-6 and R1-9), see Table 1 for a summary of crosswalk-related signs. Practitioners expressed a desire to better understand the effectiveness of pedestrian crossing signs for crosswalks that are not controlled by a traffic control signal, hybrid beacon, stop sign, or yield sign.
Overview of Pedestrian Crossing Warning Signs Included in the MUTCD ( 3 )
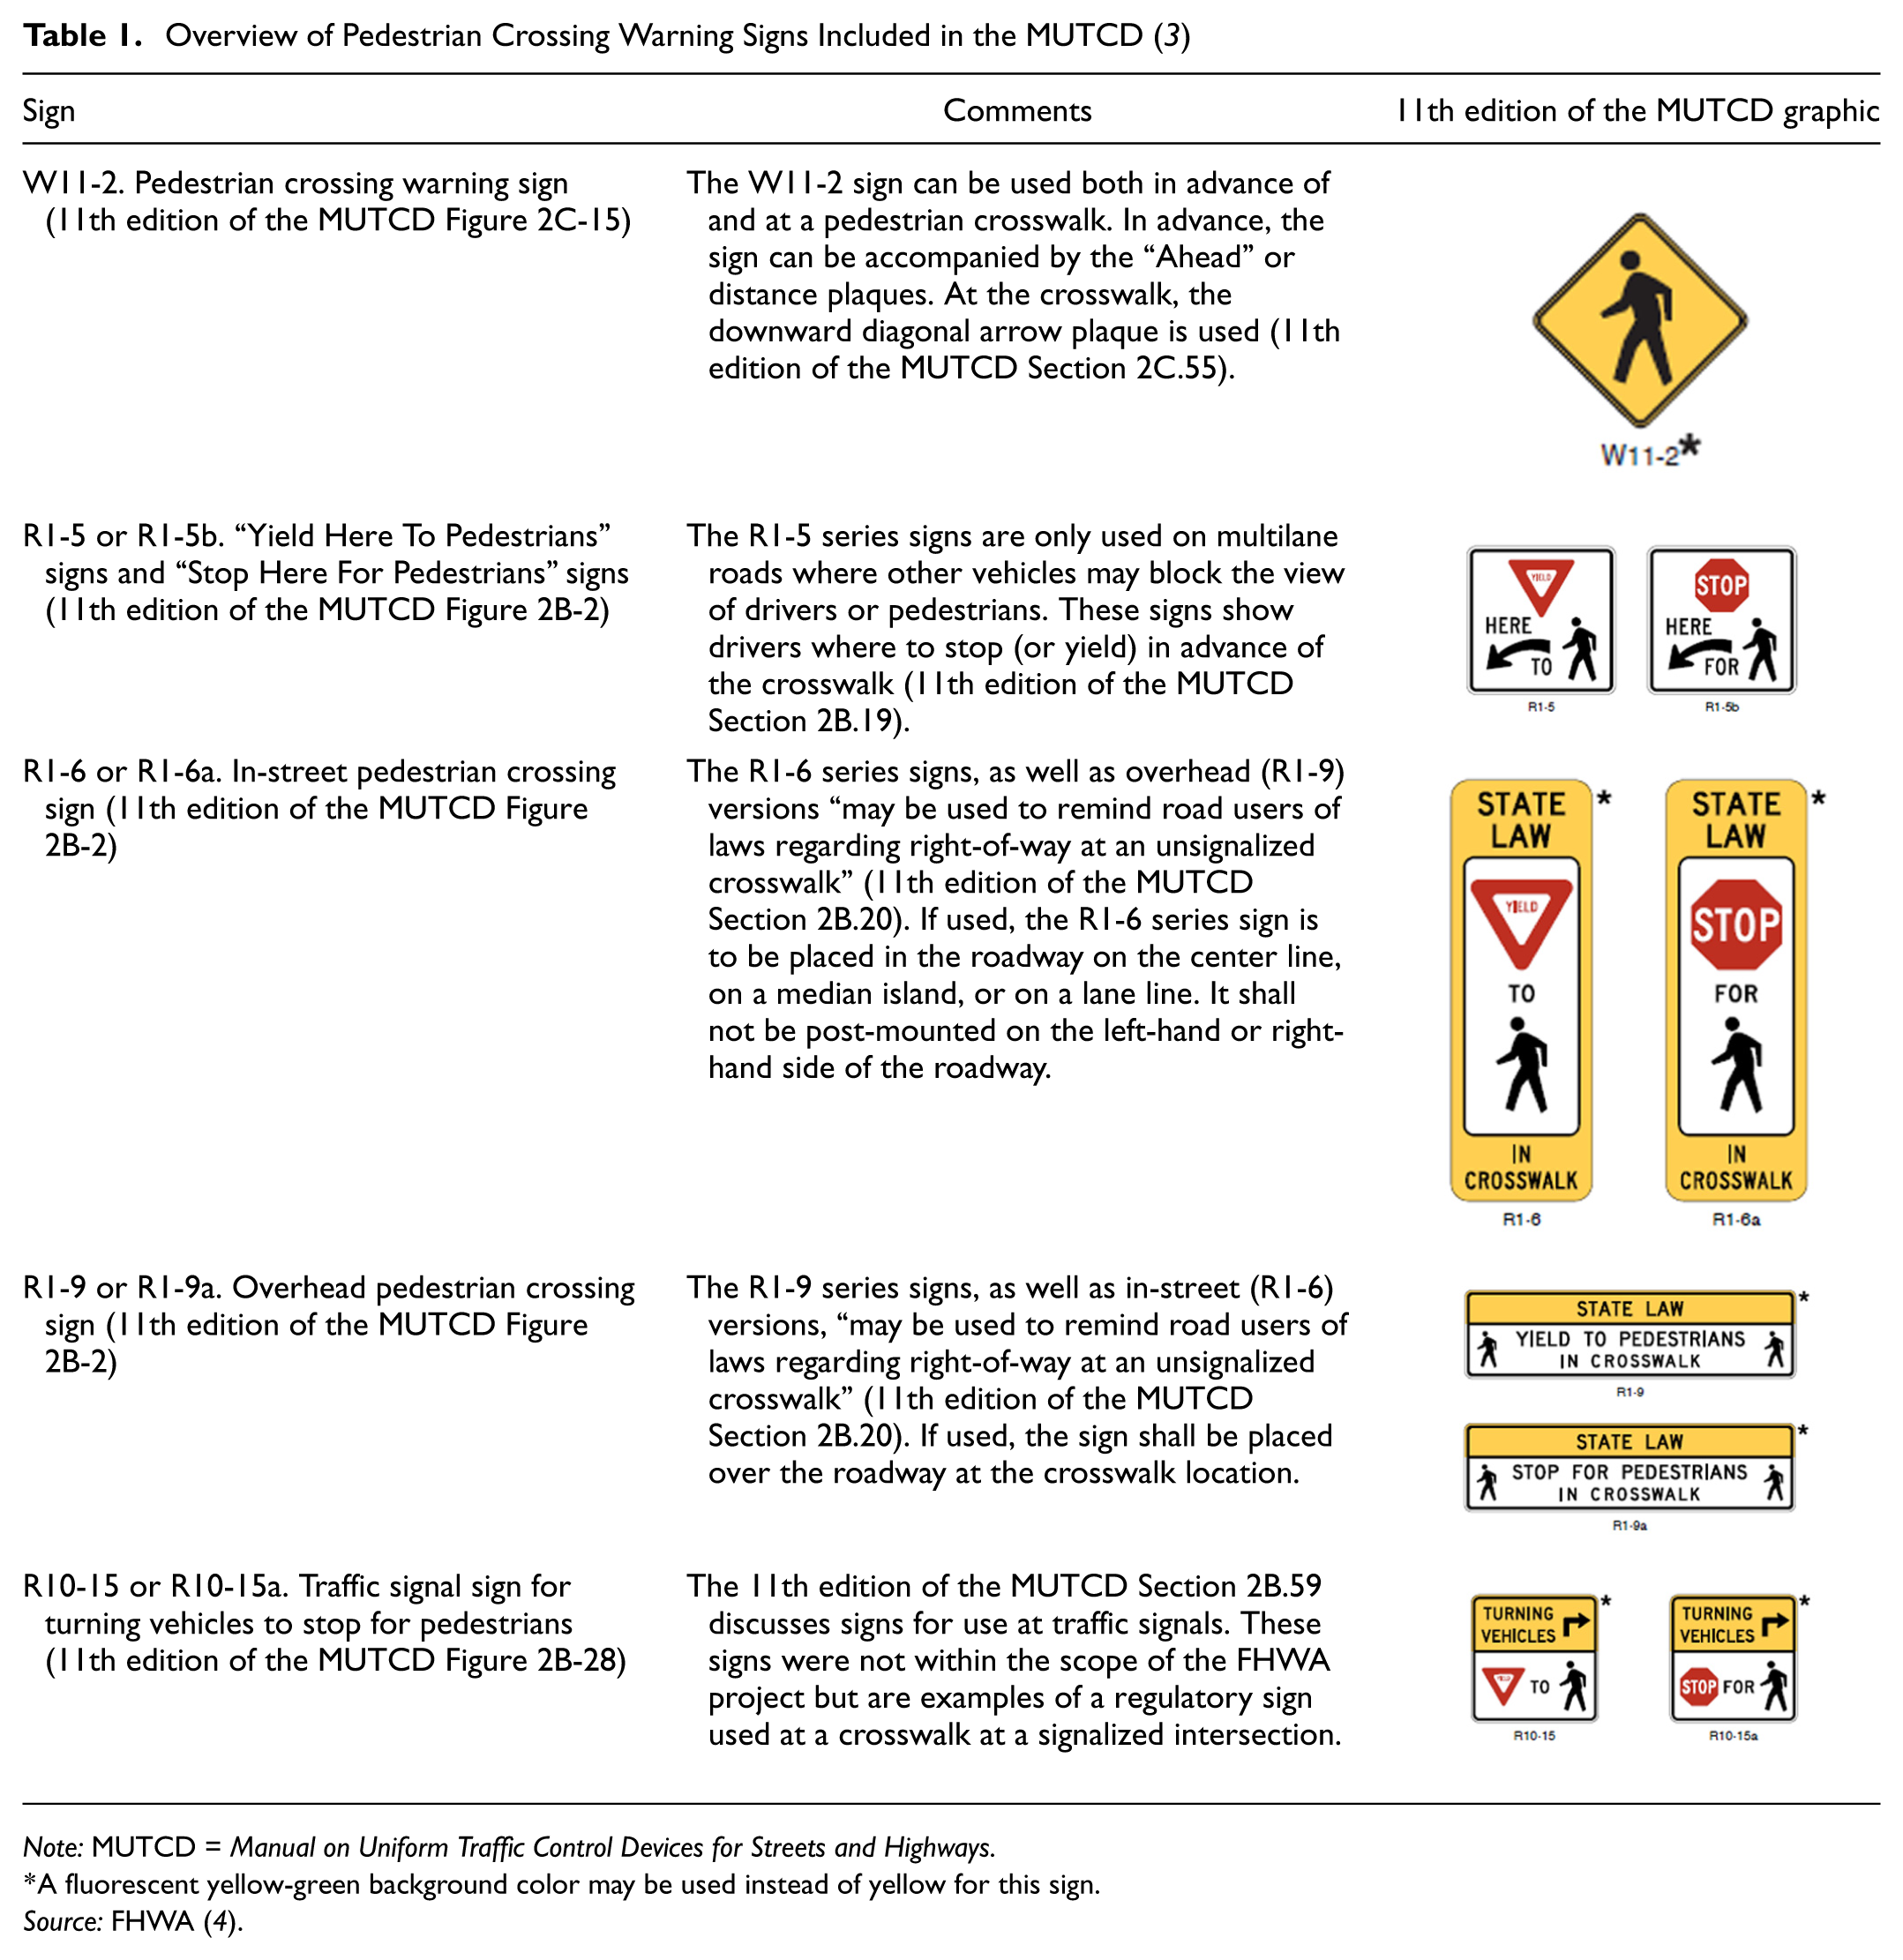
Note: MUTCD = Manual on Uniform Traffic Control Devices for Streets and Highways.
A fluorescent yellow-green background color may be used instead of yellow for this sign.
Source: FHWA ( 4 ).
FHWA administered a research project to examine regulatory sign applications at uncontrolled crosswalks ( 4 ). It was part of the traffic control device (TCD) consortium pooled fund study (PFS) ( 5 ).
From a behavioral perspective, TCDs influence driver decision making through perception, comprehension, and response processes. Signs that provide explicit, unambiguous instructions reduce cognitive load and improve compliance, particularly in situations requiring rapid decision making. In the context of uncontrolled crosswalks, drivers must detect a pedestrian, interpret right-of-way rules, and decide whether to yield. Therefore, sign designs that clearly communicate required actions (e.g., yield or stop) may be expected to enhance both understanding and yielding behavior.
Goal and Approach
The overall goal of the FHWA project was to develop and evaluate alternatives to the W11-2 sign for use at the crosswalk, focusing on the signs that might enhance driver comprehension, yielding behavior, and pedestrian crossing decisions. The research team investigated regulatory sign alternatives through human factors testing using a computer-based test (CBT) and in-field evaluations by observing driver yielding.
A pedestrian crosswalk (sometimes called a crossing) is a designated place for pedestrians to cross a street. A crosswalk that contains a traffic control signal, hybrid beacon, stop sign, or yield sign is called a controlled crosswalk. Uncontrolled pedestrian crosswalks are defined as an approach where vehicles are not controlled by a traffic control signal, hybrid beacon, stop sign, or yield sign. The FHWA project focused on uncontrolled pedestrian crosswalks that included only pavement crosswalk markings and pedestrian crossing warning signs (W11-2). These crosswalks could be midblock (i.e., two legs for traveling vehicles) or at an intersection (three or more legs).
Human Factors Study
The objective of the human factors CBT was to evaluate signing options at uncontrolled intersections through an Internet-based test, assessing interpretation, compliance, and preference. Owing to available space, the CBT also included questions on signs that can be used in advance of a pedestrian crosswalk.
Signs
Based on the literature review and the state-of-practice analysis conducted, the research team proposed a set of regulatory and warning signs to be used in advance of and at pedestrian crosswalks for the CBT. The TCD PFS members, including the FHWA MUTCD team, reviewed the proposed set of signs. They prioritized testing alternate versions of regulatory signs at crosswalks to potentially replace the use of the W11-2 pedestrian crossing warning sign that is currently used for both the advance and at-crosswalk locations. The research team refined the set of signs and Table 2 shows the test signs for the advance location, and Table 3 shows the test signs for the at-crosswalk location.
CBT Test Signs for Advance Location
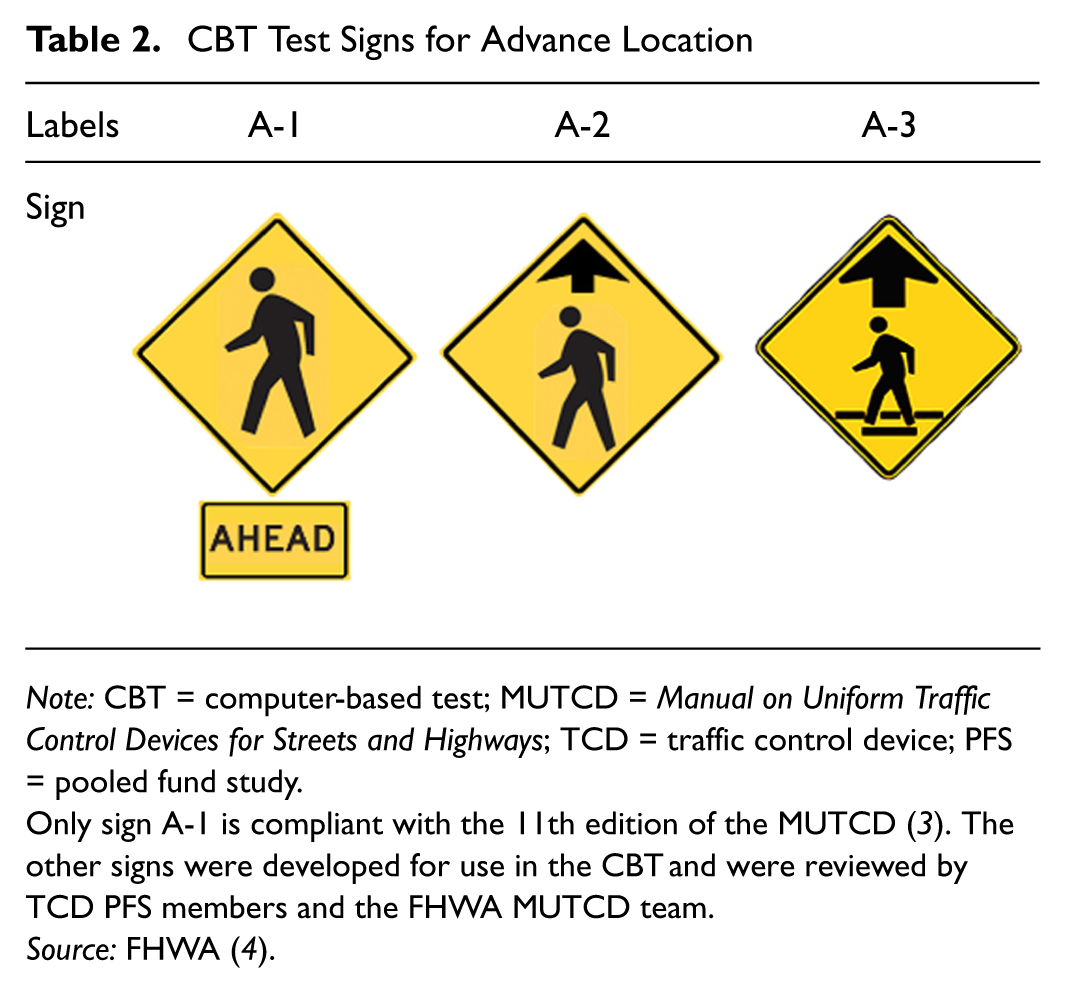
Note: CBT = computer-based test; MUTCD = Manual on Uniform Traffic Control Devices for Streets and Highways; TCD = traffic control device; PFS = pooled fund study.
Only sign A-1 is compliant with the 11th edition of the MUTCD ( 3 ). The other signs were developed for use in the CBT and were reviewed by TCD PFS members and the FHWA MUTCD team.
Source: FHWA ( 4 ).
CBT Test Signs for At-Crosswalk Location
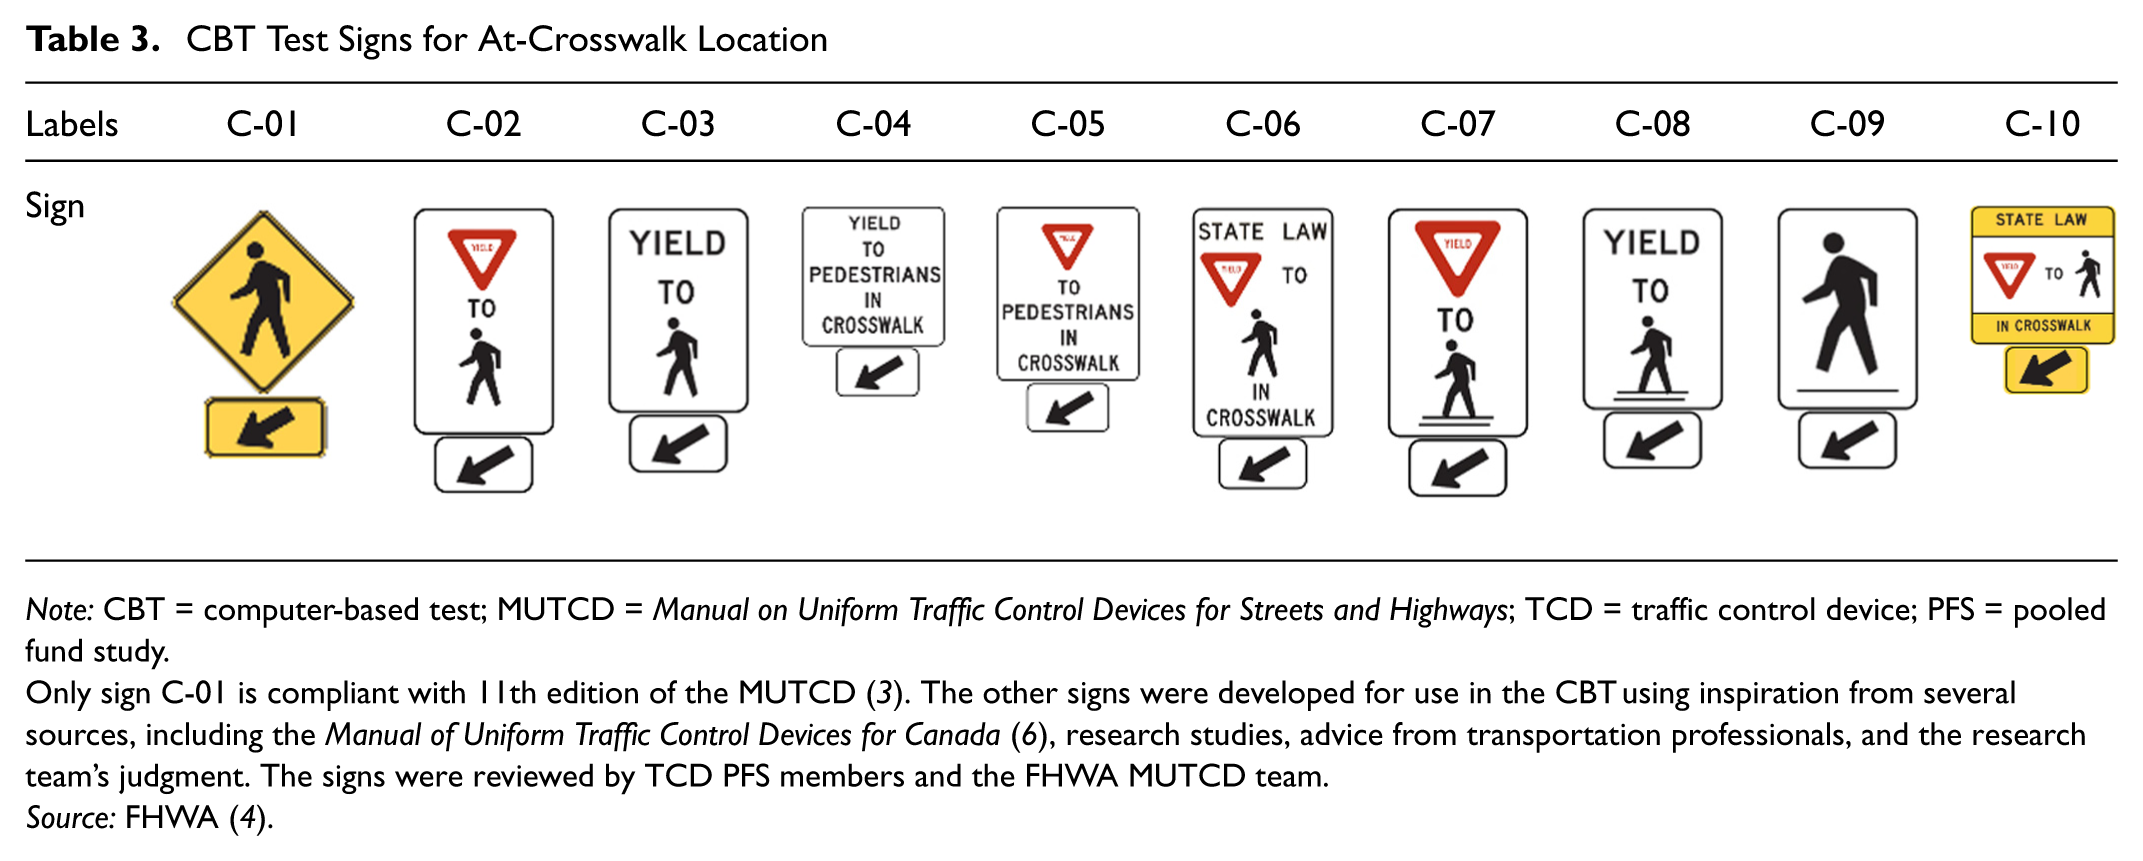
Note: CBT = computer-based test; MUTCD = Manual on Uniform Traffic Control Devices for Streets and Highways; TCD = traffic control device; PFS = pooled fund study.
Only sign C-01 is compliant with 11th edition of the MUTCD ( 3 ). The other signs were developed for use in the CBT using inspiration from several sources, including the Manual of Uniform Traffic Control Devices for Canada ( 6 ), research studies, advice from transportation professionals, and the research team’s judgment. The signs were reviewed by TCD PFS members and the FHWA MUTCD team.
Source: FHWA ( 4 ).
CBT Visuals
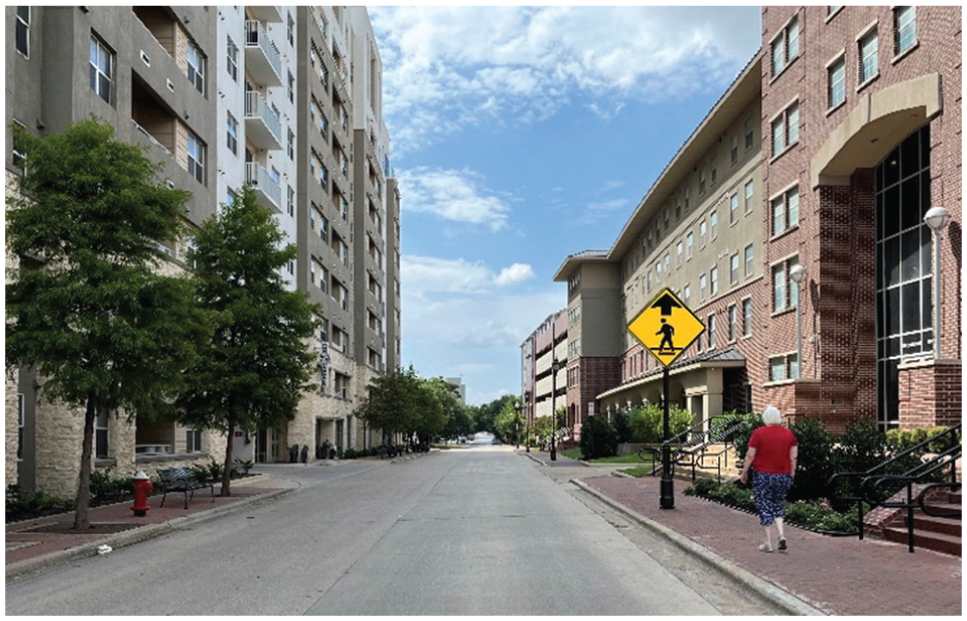
The research team digitally inserted the test signs into photographs taken in urban and suburban areas with and without pedestrians present, and at a crosswalk in a suburban setting with a sign and crosswalk markings with and without a pedestrian present. The photos were taken on two-lane streets with no other vehicles present from the perspective of a driver in the right lane. Photos for the at-crosswalk location had versions both with a pedestrian visible at the crosswalk looking toward the camera and with no pedestrian. The signs were sized correctly by using the Standard Highway Signs dimensions, using the actual sign on the road as reference ( 7 ). Figure 1 is an example of the image used in the CBT for the at-crossing location. Each subject saw a unique visual for the at-crossing location and for the advance location, either the urban setting (sample in Figure 2) or the residential setting (sample in Figure 3) visual. The programming ensured that each subject saw only one sign from the advance group and only one sign from the at-crossing group.
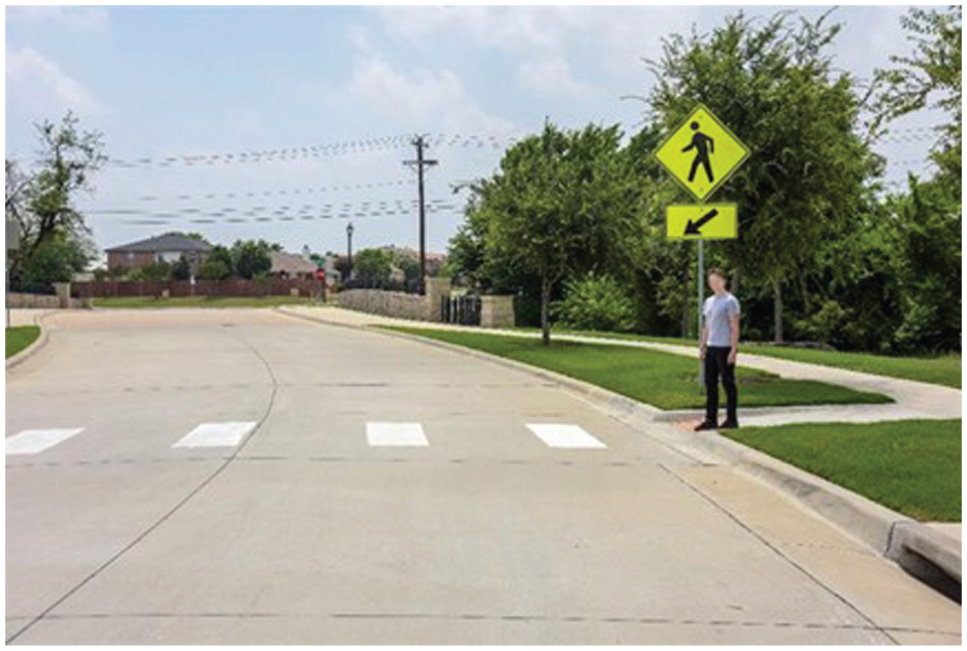
Example of an image used in computer-based testing for the at-crosswalk scenario with sign C-01 at crosswalk with a pedestrian.
Example of an image used in computer-based testing for the advance location in the urban setting with sign A-3 and a pedestrian.
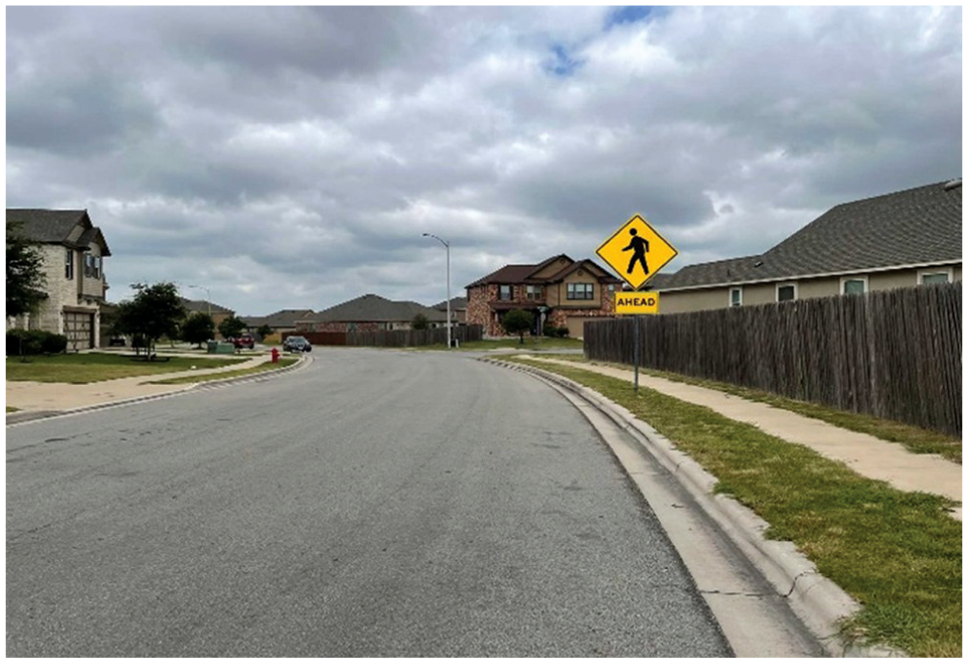
Example of an image used in computer-based testing for the advance location in the residential setting with sign A-1 and no pedestrian.
With the images, each subject answered questions after completing basic demographic questions. The questions asked what drivers would do if they saw the scene in the image (compliance), how much they agreed with statements about the interpretation of the sign’s meaning (comprehension), and then asked them to rank their preferences for all the test signs (preference). Subjects could also provide comments in open-ended text boxes.
CBT Question Format
The CBT was an Internet-based test. The software randomly determined the particular sign each subject saw, with the goal of presenting each sign an equal number of times across subjects. Each subject answered several questions about the signs after completing basic demographic questions. Each subject saw the same at-crossing sign image for all the questions related to the at-crossing scenario and the same advance sign image for those questions related to the sign’s placement before the crossing.
Subject Recruitment and Conducting CBT
The research team recruited subjects for the CBT through online advertisements and social media posts, as well as collaborations with some of the transportation agencies involved in the TCD PFS. The instructions asked the subjects to complete the Internet testing using a display device at least as large as a typical laptop screen or a full-sized tablet. Subjects provided demographic information. The instructions and consent also asked for confirmation that they were over the age of 18, could read and write English, and had a valid driver’s license.
The research team collected responses for 12 days in the summer of 2023. They received a total of 2,859 responses from 48 states. The filtering removed those subjects who indicated they used a device other than a full-size desktop, laptop, or tablet, as smaller devices did not have a sufficient display size to render the images and ranking matrices adequately. In addition, the research team excluded from the analysis any responses from individuals who lived outside of the United States, were not within the age range, or did not have a driver’s license. After the filtering was complete, the number of subjects was 1,404 across an age range of 18 to 89 years, with 59% of valid responses from males, 39% from females, and 2% choosing not to indicate.
CBT Results for Advance Sign
Figures 2 and 3 show examples of the images used for the advance sign location. The findings for both contexts (residential and urban) were combined, resulting in 1,404 responses. The preference ranking for best was 69% for A-1, 27% for A-2, and only 4% for A-3. The results for the advance sign location indicated that the current MUTCD W11-2 advance sign (A-1) with the “Ahead” plaque performed the best across all question types.
CBT Results for At-Crosswalk Sign
The results for at-crosswalk signs showed that across all the sign options, more people indicated that they would stop at the crosswalk, instead of slow down, when a pedestrian was present in the image. Researchers found no difference in these results based on the stop/yield laws in the state where the subject resided ( 8 ).
Table 4 summarizes the performance of each sign across all measures. The research team used the following measures in appraising the performance of the signs in the CBT based on the subjects’ responses: compliance, interpretation of whether drivers have to wait, interpretation of whether pedestrians have to wait, and ranking. The research team assigned a composite score of “+,”“−,” or “=” for a given sign and measure combination based on its relative performance compared with other signs and statistical analyses. A “+” sign indicated good compliance, interpretation, or high ranking relative to the other signs, whereas “–” represented the other extreme, and “=” reflected a score between both extremes. Table 4 summarizes these composite scores relative to other signs in the study.
Results by Measure for At-Crosswalk Location
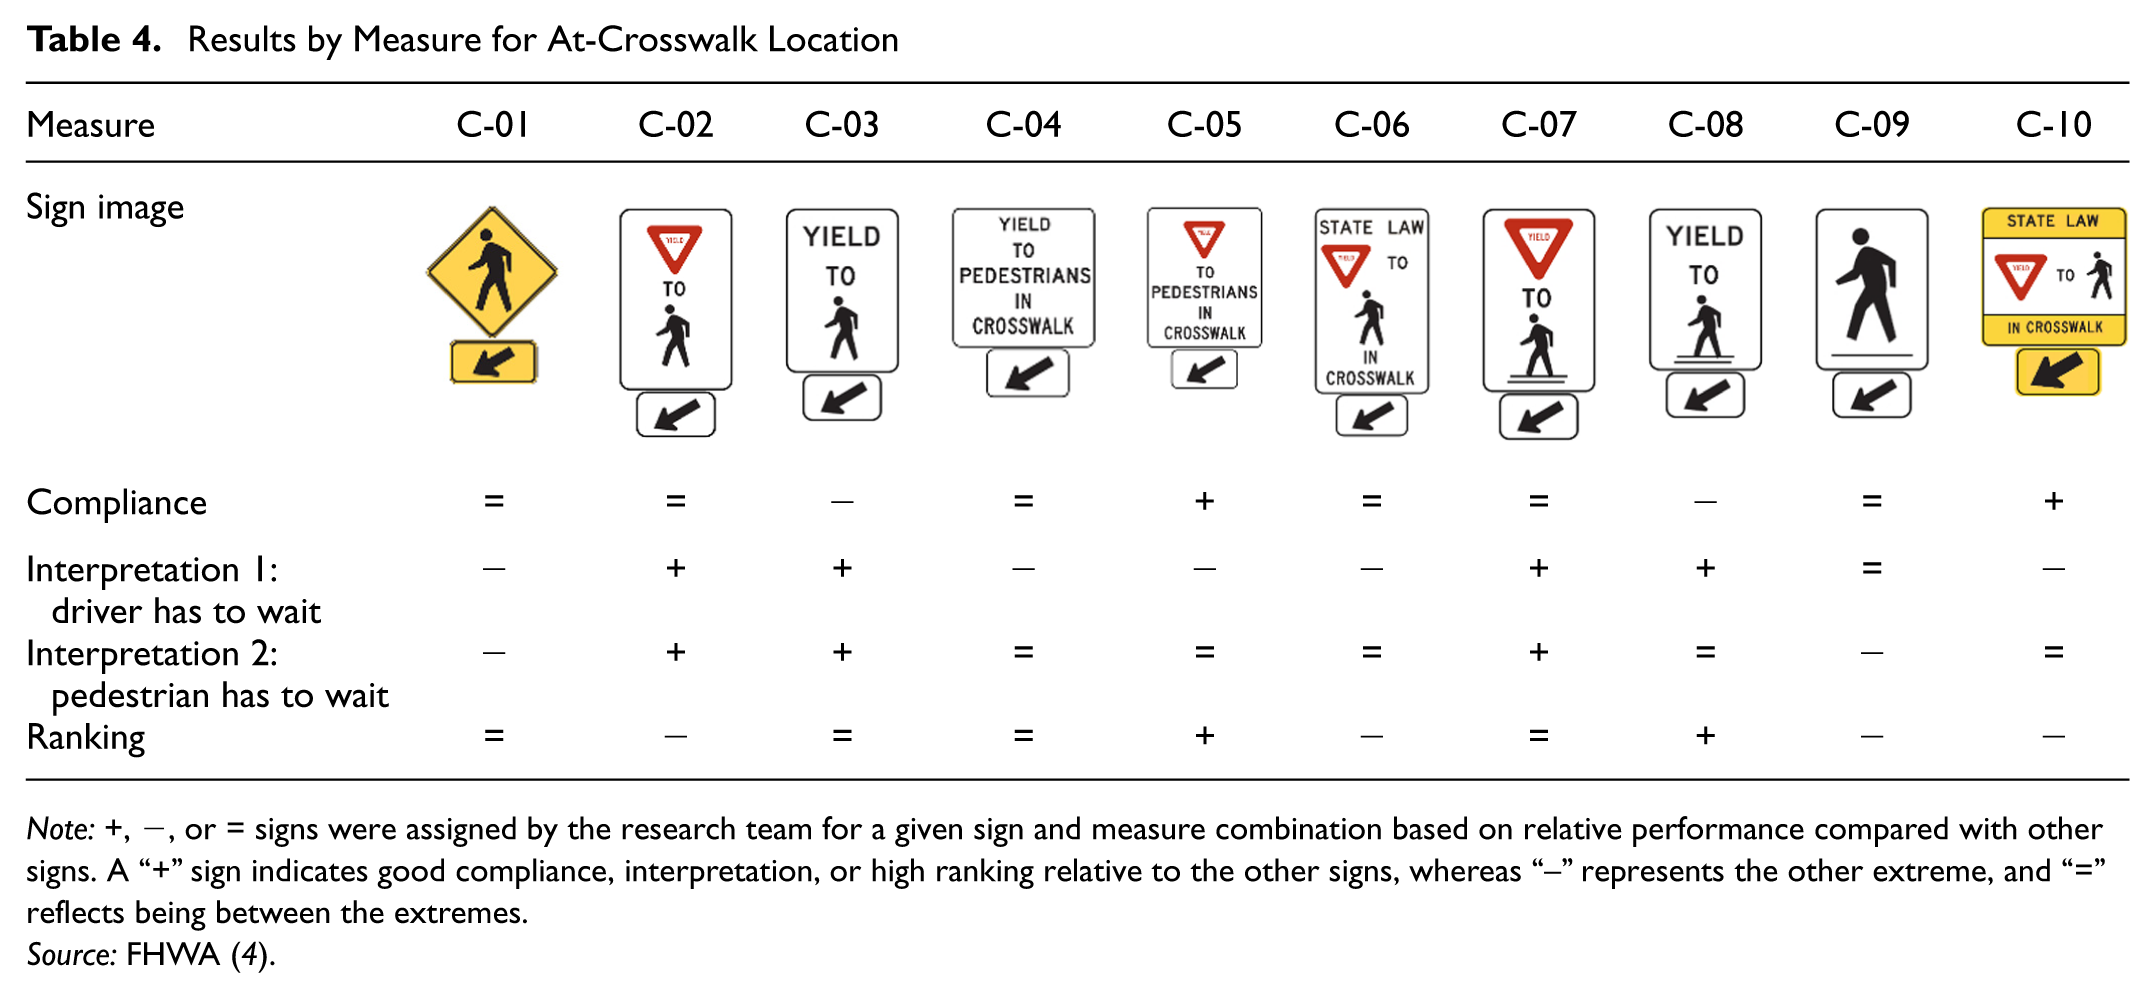
Note:+, −, or = signs were assigned by the research team for a given sign and measure combination based on relative performance compared with other signs. A “+” sign indicates good compliance, interpretation, or high ranking relative to the other signs, whereas “–” represents the other extreme, and “=” reflects being between the extremes.
Source: FHWA ( 4 ).
For the compliance questions, signs C-05 and C-10 showed a slightly better balance of slow and stop responses, but no statistically significant difference existed between the signs when pedestrians were not present in the images. Subjects were more confident in the correctness of their response when they said they would stop, compared with those who said they would slow down.
Subjects were then asked whether these signs were aimed at drivers or pedestrians. Overall, no statistically significant difference existed between the signs, with more than 95% indicating that the signs were primarily intended for drivers.
The next set of questions provided interpretation statements and asked whether subjects agreed with them. The first interpretation was that drivers have to wait for any pedestrians wanting to cross the street before proceeding. Signs C-02, C-03, C-07, and C-08 had the highest agreement rates with this statement. Additionally, for the current standard, C-01, 19% of people said that this interpretation did not occur to them, but they could see how it could apply, indicating some level of misunderstanding of the appropriate driving response. For sign C-05, 12% said it did not occur to them, and 15% did not agree at all that the sign meant that drivers have to wait.
The second interpretation statement was that pedestrians have to wait. For sign C-01, 14% indicated that pedestrians have to wait was the first thing that occurred to them, compared with 3% and 4% for signs C-07 and C-08, respectively. Lastly, the preference ranking showed that C-05 was ranked highest, followed by C-08 and C-07.
Overall, signs with the word or symbol for yield did better across all measures. This finding is consistent with human factors principles indicating that explicit, action-oriented messages improve comprehension and reduce ambiguity. Signs that directly communicate the required driver behavior (e.g., yielding or stopping) may facilitate faster cognitive processing compared with symbolic warning signs that require interpretation. Several subjects provided open-ended comments that explained that the yield word or symbol made it clear what the driver was supposed to do.
Signs Selected for Field Study
Based on the CBT results and discussions with TCD PFS members, the FHWA MUTCD team, and the FHWA contact, signs C-07 and C-08 were selected for the field test to compare with a base condition of C-01 (the typical W11-2 sign). The format of the signs used in CBT had to be refined to reflect the state law in the locations selected for the field studies. Because the in-field study was conducted in Texas and Washington the signs needed the stop symbol rather than the yield symbol.
Table 5 shows images of the three signs and the nickname used to describe them for the in-field study. “Stop word” was selected to describe the sign that uses the word message “stop” on the sign, and “stop symbol” describes the symbol version of the same sign.
Illustration of Signs for the In-Field Study
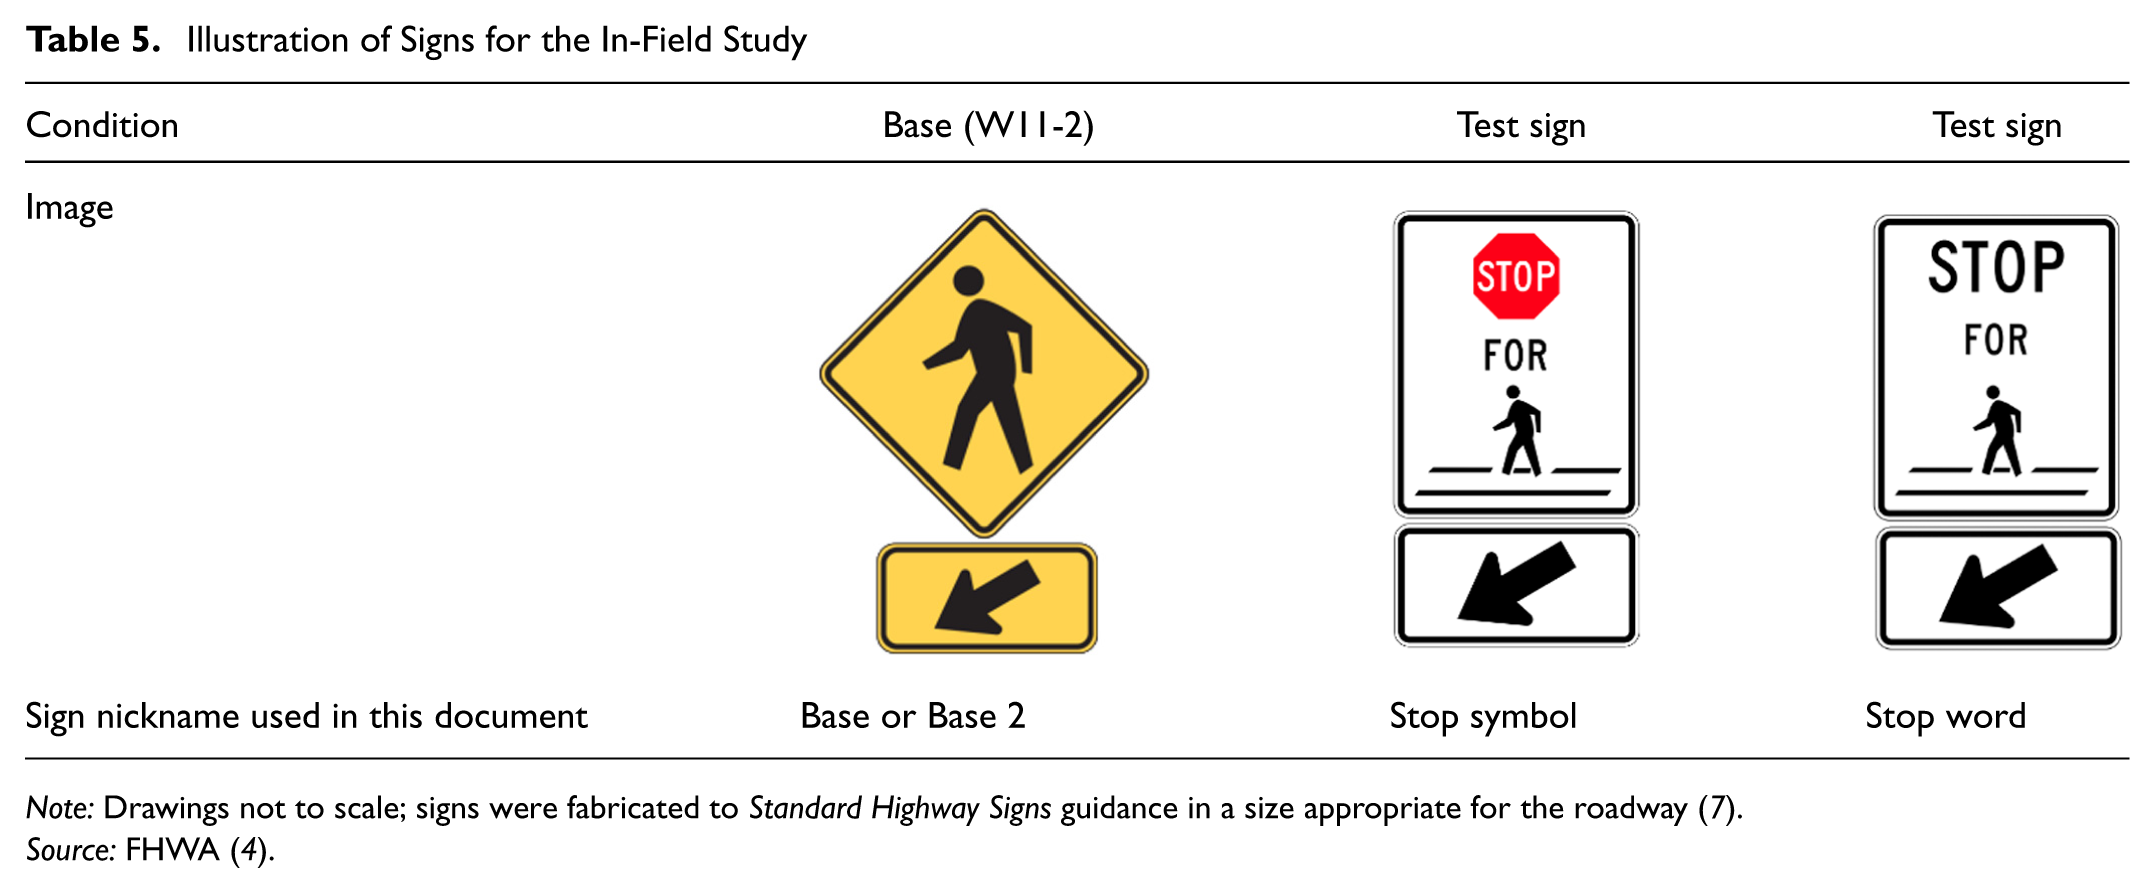
Note: Drawings not to scale; signs were fabricated to Standard Highway Signs guidance in a size appropriate for the roadway ( 7 ).
Source: FHWA ( 4 ).
In-Field Study
The objective of the in-field study was to evaluate the selected test signs in an open-road setting by observing drivers yielding to crossing pedestrians. Researchers were to gather data for all test signs at each selected location.
Site Identification
The research team suggested that the in-field observational study use a longitudinal (over time) design during which driver yielding and speed data would be collected at the same site for each installed sign. The initial installation (or final installation) would be the base sign, given that the city would already have the base sign installed or that the city would need to return the base sign to the site at the end of the study. Each new sign would be installed after the researchers had gathered the necessary data for the previous installation. With the available resources for this project, the research team estimated that in-field data could be collected for approximately 20 site-periods. Each site would need data collected for three periods (base plus two test signs); therefore, six sites could be included in this study. The six sites would be split between two regions. The two regions suggested for this research were Texas and a northern city. Texas was selected because of economies in data collection and the existing relationships the research team has with several Texas cities. Having the second region represent a city in the north provided geographic variation.
The criteria established for a site to be considered for this study were as follows:
Pedestrian crosswalk has pedestrian crossing (W11-2) signs;
A site containing a school (S1-1) or trail (W11-15) crossing warning sign will be removed from consideration;
A site containing beacons will be removed if they are present at, or in advance of, the crosswalk, but the crosswalk can have an advance warning sign;
The number of lanes at the crosswalk is either two or four;
Most sites should be at intersections instead of at midblocks; and
Land use that is retail or office is preferable; however, sites can be residential or near a park.
Site Selection
The research team, in coordination with FHWA, selected two cities to participate in this study: Frisco, TX, and Federal Way, WA. Researchers used the study criteria provided in the previous section to identify several potential sites within each city. The research team discussed these sites with representatives of the cities to determine whether there were potential issues, such as upcoming construction projects or unique user behaviors at the site. The candidate sites were reviewed with FHWA, and the acceptable sites were identified.
For the Federal Way region, two sites were selected, with one site located on a road owned by the City of Federal Way and the other on a road owned by Washington State. For Frisco, TX, all sites were owned by the city. The ownership of the sites affected who needed to be involved in approving the sign installations. Because the test signs are noncompliant in regard to the MUTCD, the participating agencies submitted Request for Experimentation memos to FHWA.
Site Characteristics
The research team used aerial photographs to identify the roadway geometric characteristics for each site, which were confirmed in the field as necessary. Table 6 lists the descriptions of the variables considered in the statistical analysis. Additional variables were collected for each site, such as whether one-way or two-way vehicle operation was present and whether bike or parking lanes were present; however, these variables were either uniform across all sites or were determined in the preliminary analyses not to be influential in regard to driver yielding. Table 7 provides the roadway characteristics by site. All sites had no parking lanes or bike lanes. The Texas sites had longitudinal bar crosswalk markings whereas the Washington sites had bar pair crosswalk markings.
Statistical Analysis Variable Descriptions
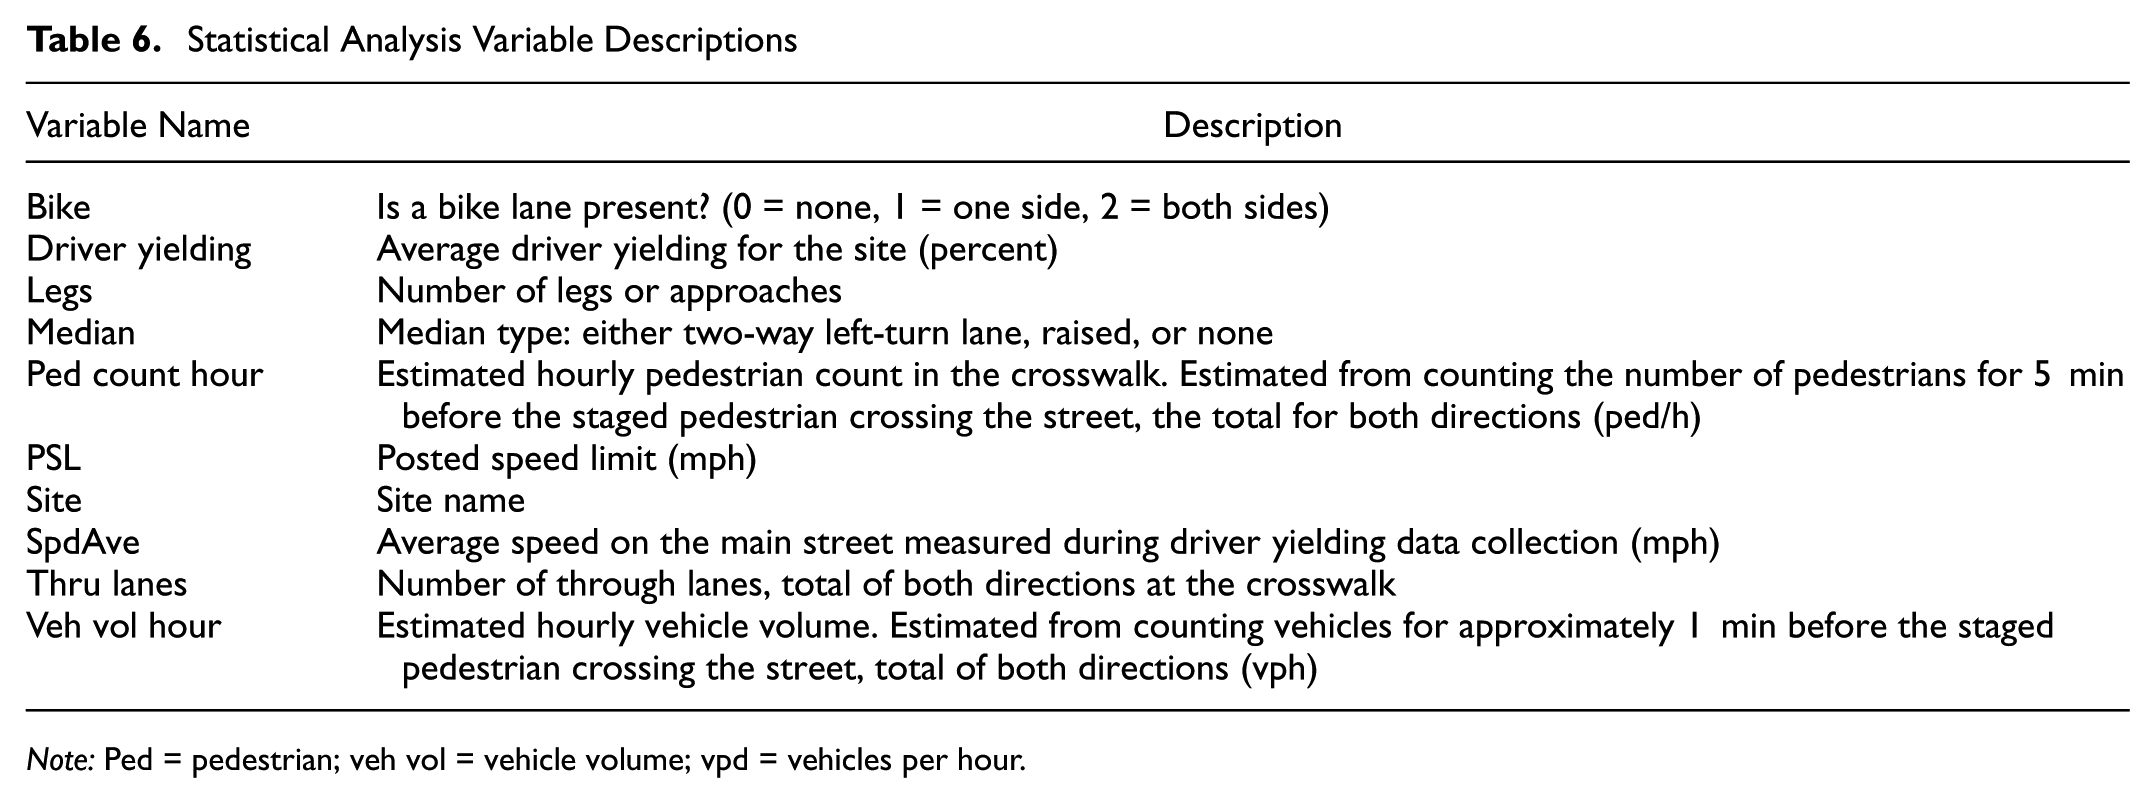
Note: Ped = pedestrian; veh vol = vehicle volume; vpd = vehicles per hour.
Roadway Characteristics by Site
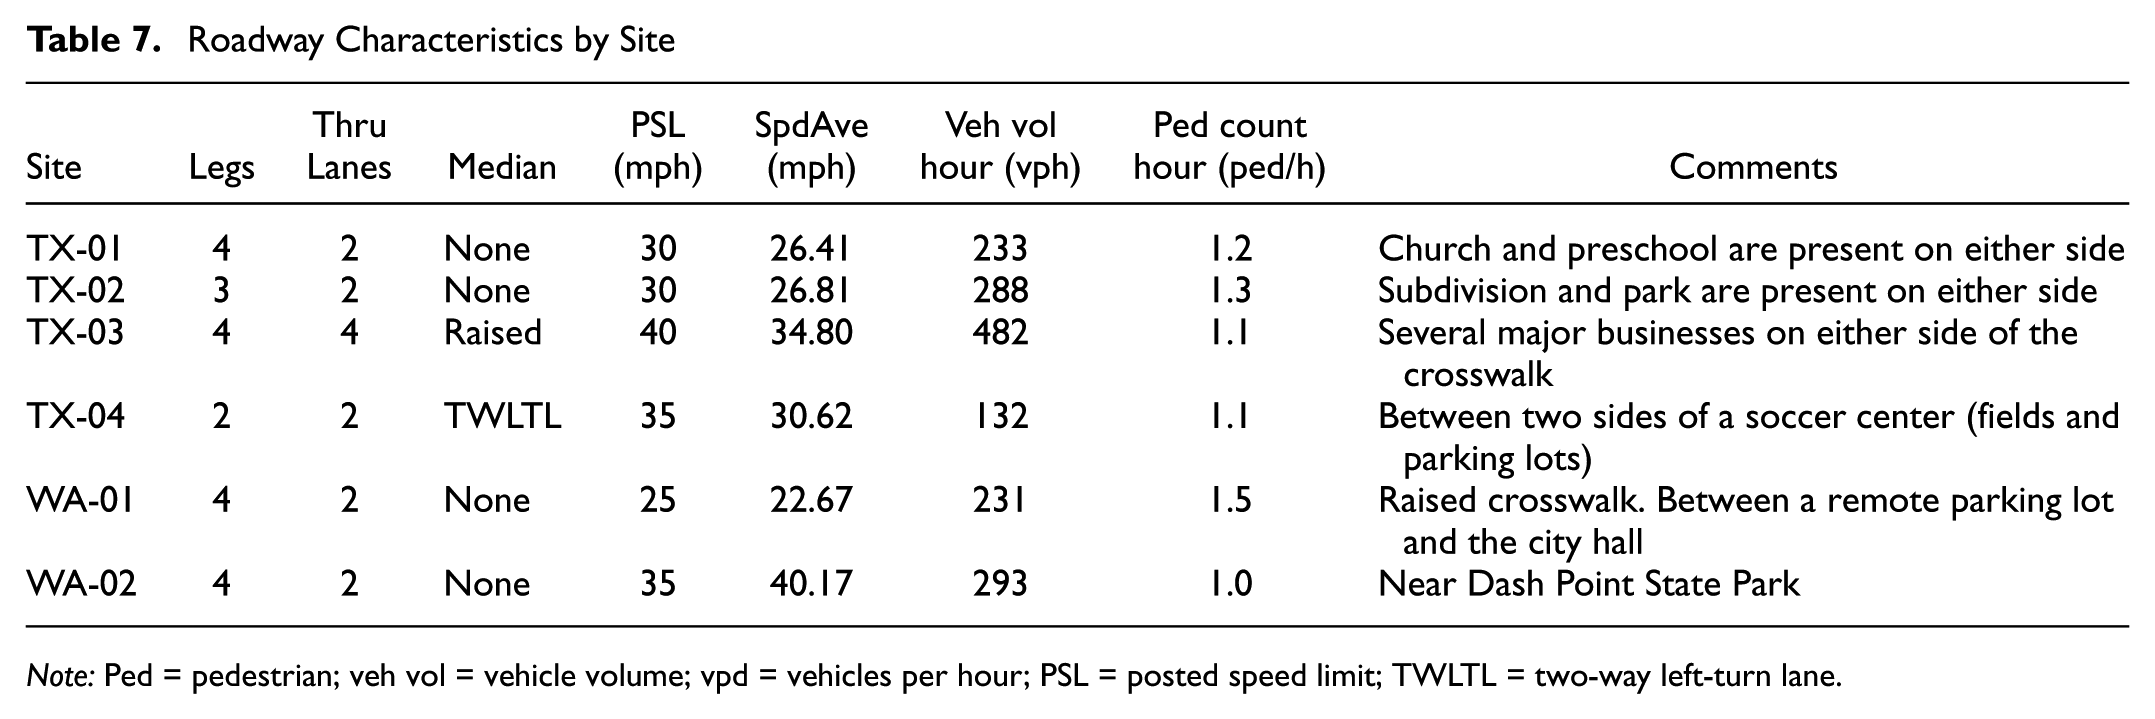
Note: Ped = pedestrian; veh vol = vehicle volume; vpd = vehicles per hour; PSL = posted speed limit; TWLTL = two-way left-turn lane.
Data-Collection Periods and Test Signs
Researchers collected data for each of the signs illustrated in Table 5. For all sites, the initial data-collection effort was with the base sign (W11-2). Because the weather was favorable during data collection in Federal Way, WA, the research team also collected data for the base sign after collecting data for the test signs, which produced two sets of base data for the Federal Way sites. Collecting base data a second time at the Washington State sites provided more data for the analysis at a very nominal cost.
The order of the test signs varied, with half of the sites having the test sign with the stop symbol tested first and the other half having the test sign with the stop word tested first. The size of the test signs was either 24 × 30 in. or 24 × 42 in., depending on the speed limit at the crossing.
Data-Collection Protocol
Researchers employed a staged pedestrian-crossing approach in this study to obtain a sufficient sample of pedestrian crossing observations. The research team based the protocol for data collection on the experiences gleaned from several previous research projects, including research on the pedestrian hybrid beacon and the rectangular rapid flashing beacon ( 9 , 10 ). The protocol used a team of two, with one staff member playing the role of the staged pedestrian while the other staff member recorded the driver yielding behavior. Before collecting data in the field, inexperienced data-collection teams received a copy of the written protocol and the data-collection sheets. After their review, an experienced team trained the new team members on the staged-pedestrian protocol.
The staged pedestrian was trained to approach the crosswalk in a similar manner for each location, minimizing the effects of pedestrian behavior on drivers and maintaining consistency among study locations in how the pedestrian approaches a crosswalk. The staged pedestrian wore a gray t-shirt or sweatshirt, blue jeans, and predominantly dark shoes. A hat and sunglasses were permitted. The staged pedestrians approached the crosswalk and placed one foot on the pavement while vehicular traffic was approaching a predetermined point in advance of the crosswalk. This point was determined based on the speed limit of the road and the expected vehicle stopping distance. Once the vehicles stopped, the pedestrian crossed the street. The staged pedestrian waited until all queued vehicles from the previous crossing had cleared before beginning another staged crossing so that drivers did not observe two consecutive crossings.
The researchers measured average speed on the main street using radar guns either during or immediately following the driver yielding data collection. The researchers installed a video camera to record the data-collection effort. The recordings served as a backup for the yielding data collected and were used to obtain the 1-min volume vehicle counts before each pedestrian crossing, defined in the next section.
Video Data Reduction
The research team used the video to count the following:
Number of vehicles driving across the crosswalk in both directions for 1 min before each staged pedestrian crossing.
Number of pedestrians using the crosswalk in both directions for 5 min before each staged pedestrian crossing.
The 1-min increment estimates the volume of vehicle traffic present just before the specific pedestrian crossing. When several vehicles are present, drivers may be hesitant to stop for the pedestrian because they fear their vehicles will be hit from behind. In a few cases, researchers used a time slightly longer than 1 min to avoid starting the count with a vehicle in the crosswalk. In a few cases, researchers used a shorter period to accommodate the start time of the video file.
The research team converted the 1-min traffic counts and 5-min pedestrian counts into hourly volumes by using the exact number of seconds reflected in the count.
Driver Yielding Rate Calculation
Each driver responding to a staged pedestrian crossing was coded as being either 1 (for yielding) or 0 (for not yielding). The equation used to determine the average driver yielding rate (DYR) was,

The DYR per site and per period was determined; Figure 4 shows the results grouped per site. As illustrated in Figure 4, the range of driver yielding for the site and sign type combinations was 6% to 87%.
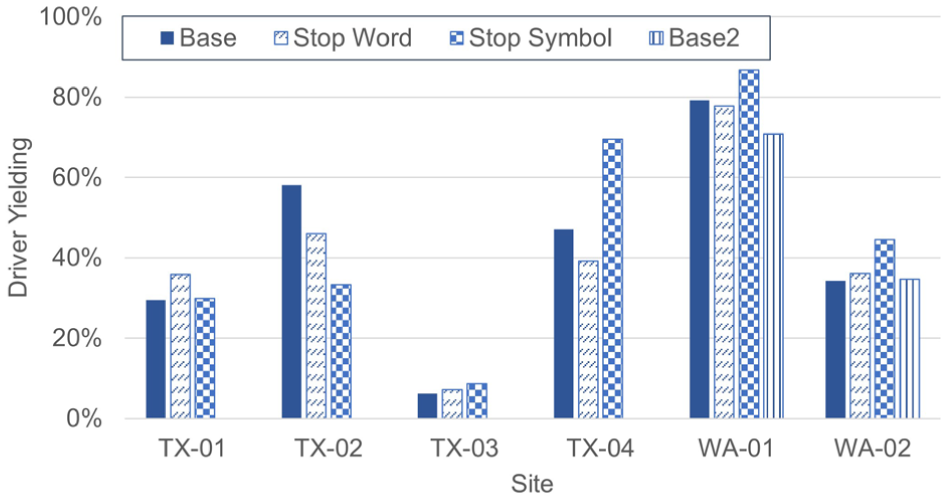
Distribution of per-site driver yielding by sign type.
Overall, yielding was higher in Washington (55% for the two sites) than in Texas (27% average for the four sites). Yielding was lower at the highest speed limit (8% for the one site with 40 mph speed limit) and highest at the lowest speed limit (78% for the one site with 25 mph speed limit). All but one of the sites had two through lanes, with the remaining site having four through lanes. The site on the four-lane road had an 8% DYR, whereas the sites on the two-lane roads averaged 48% driver yielding. Owing to the limited number of sites, these findings only indicate potential trends for speed limit, number of lanes, and state. A much larger sample size would be needed to conclude the influence of state, posted speed limit, or number of lanes on driver yielding.
Field Study Analysis
The research team considered both a per-driver and a per-site analysis approach. The objective of the per-driver analysis was to explore the relationship of driver yielding (expressed as the probability of yielding for each driver) with sign treatment and site characteristic variables, including traffic volume, and to assess their effects on the probability of driver yielding. The nature of the per-driver analysis allows for a detailed consideration of the traffic volume present when the staged pedestrian attempts to cross the street. The dataset contained the individual driver response to the crossing pedestrian—1 if yielding or 0 if not yielding—along with the sign type and the two-way hourly volume estimate based on a 1-min count for each crossing.
Like the per-driver analysis, the objective of the per-site analysis was to explore the relationship between site-period-level driver yielding (i.e., average DYR) with sign treatment and site characteristic variables. The per-site approach recognizes that most of the predictor variables are site based rather than individual crossing event based. Additional details on using a per-site and per-driver analysis approach are available in another FHWA study ( 11 ).
Per-Site Analysis
The per-site analysis considered the driver yielding results for the six sites and up to four data-collection periods. Table 8 provides the per-site-period driver yielding findings.
Per-Site and Per-Period Driver Yielding Findings
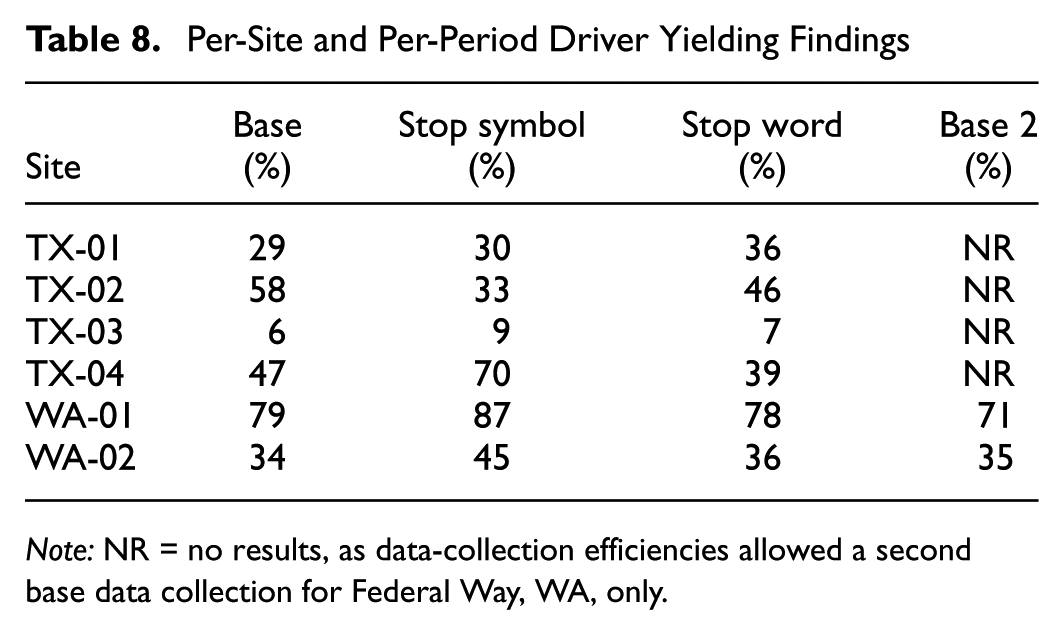
Note: NR = no results, as data-collection efficiencies allowed a second base data collection for Federal Way, WA, only.
For the statistical analysis, the research team began by using the logical variables in the model. The research team then explored other models that, overall, performed better in relation to model selection criteria along with variables, other than sign treatment. At this stage, variables with a p-value of 0.2 were removed based on the research team’s judgment that variables with p-values greater than 0.2 were not statistically significant and failed to add knowledge to the relationship with driver yielding. The pedestrian count resulted in similar values across all the sites and periods, generally being 1 pedestrian per hour (ped/h), with WA-01 being the exception, but still only 1.5 ped/h. This small range of data is probably the reason the variable was nonsignificant in the preliminary model. Both the average speed measured during data collection and the average hourly vehicle volume had p-values greater than 0.2 and were removed in the refined model. Although there was a range in the number of lanes at the sites (two or four through lanes), all but one site had two lanes. The number of legs at the site and median type are other variables that could influence driver yielding; however, most sites had the same site characteristics, which limited the ability to explore the influence of these variables on driver yielding. The influence of driver yielding for these variables, or rather the lack of influence in the models, was anticipated. The study design focused on the influence of sign treatment, and driver yielding data were collected at each site across the three (or four for Washington State) study periods.
An analysis of covariance framework was used to model average DYRs at the site-period level. The dependent variable was the proportion of yielding drivers during each site-period, with sign treatment included as a categorical explanatory variable.
The fixed-effect test for the model (Table 9) provides the estimated model coefficient and model fitting results with only the sign of the treatment variable retained. The treatment type was retained in the final selected model, even though it was nonsignificant, to demonstrate whether the type of sign used at the pedestrian crossing had an impact on driver yielding. As shown in Table 9, both the stop symbol and stop word treatments were nonsignificantly different from the base treatment (W11-2). The lack of statistical significance for sign treatment may indicate that differences in sign format (warning versus regulatory) are insufficient, on their own, to alter driver yielding behavior at uncontrolled crosswalks. This may be partially attributable to the number of sites in the study being insufficient to gather enough data for analysis.
Analysis of Covariance Model for Per-Site-Period DYR with Key Variables
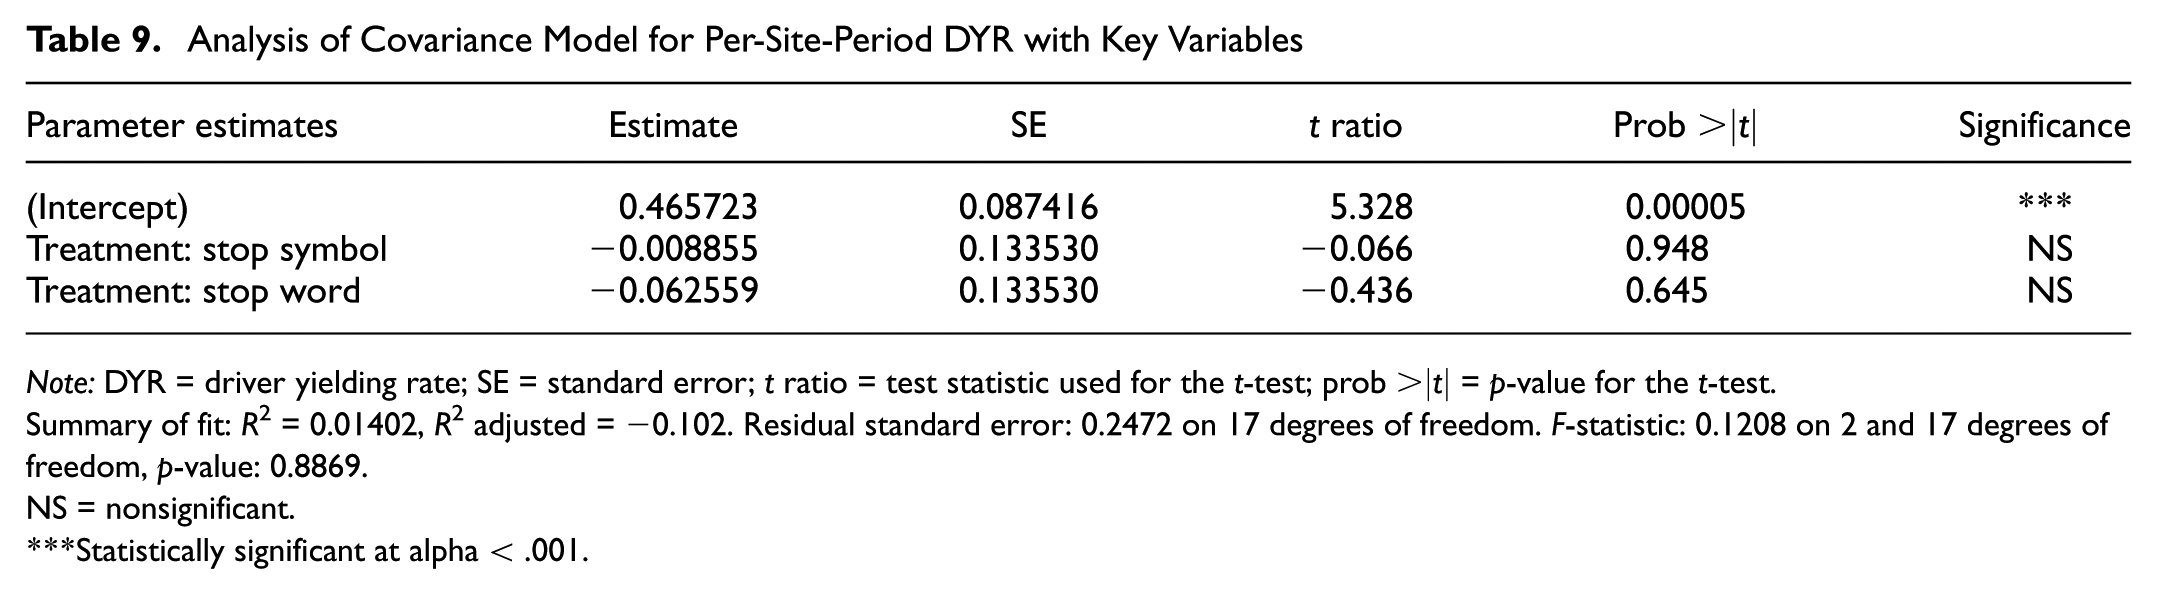
Note: DYR = driver yielding rate; SE = standard error; t ratio = test statistic used for the t-test; prob >|t| = p-value for the t-test.
Summary of fit: R2 = 0.01402, R2 adjusted = −0.102. Residual standard error: 0.2472 on 17 degrees of freedom. F-statistic: 0.1208 on 2 and 17 degrees of freedom, p-value: 0.8869.
NS = nonsignificant.
Statistically significant at alpha < .001.
Per-Driver Analysis
The per-driver analysis focused on those crossings where the traffic volume for the 1 min before the staged pedestrian crossing was available. Table 10 lists the number of drivers considered in the analysis and the hourly traffic volume range per site. Each of the 1,997 drivers chose to yield (716 drivers) or not (1,281 drivers). Several binary logistic regression models were explored, and the model that included only sign treatment is provided in this report; see Table 11 for the estimates of the model coefficients.
Number of Drivers Considered in Per-Driver Analysis, along with Hourly Traffic Volume
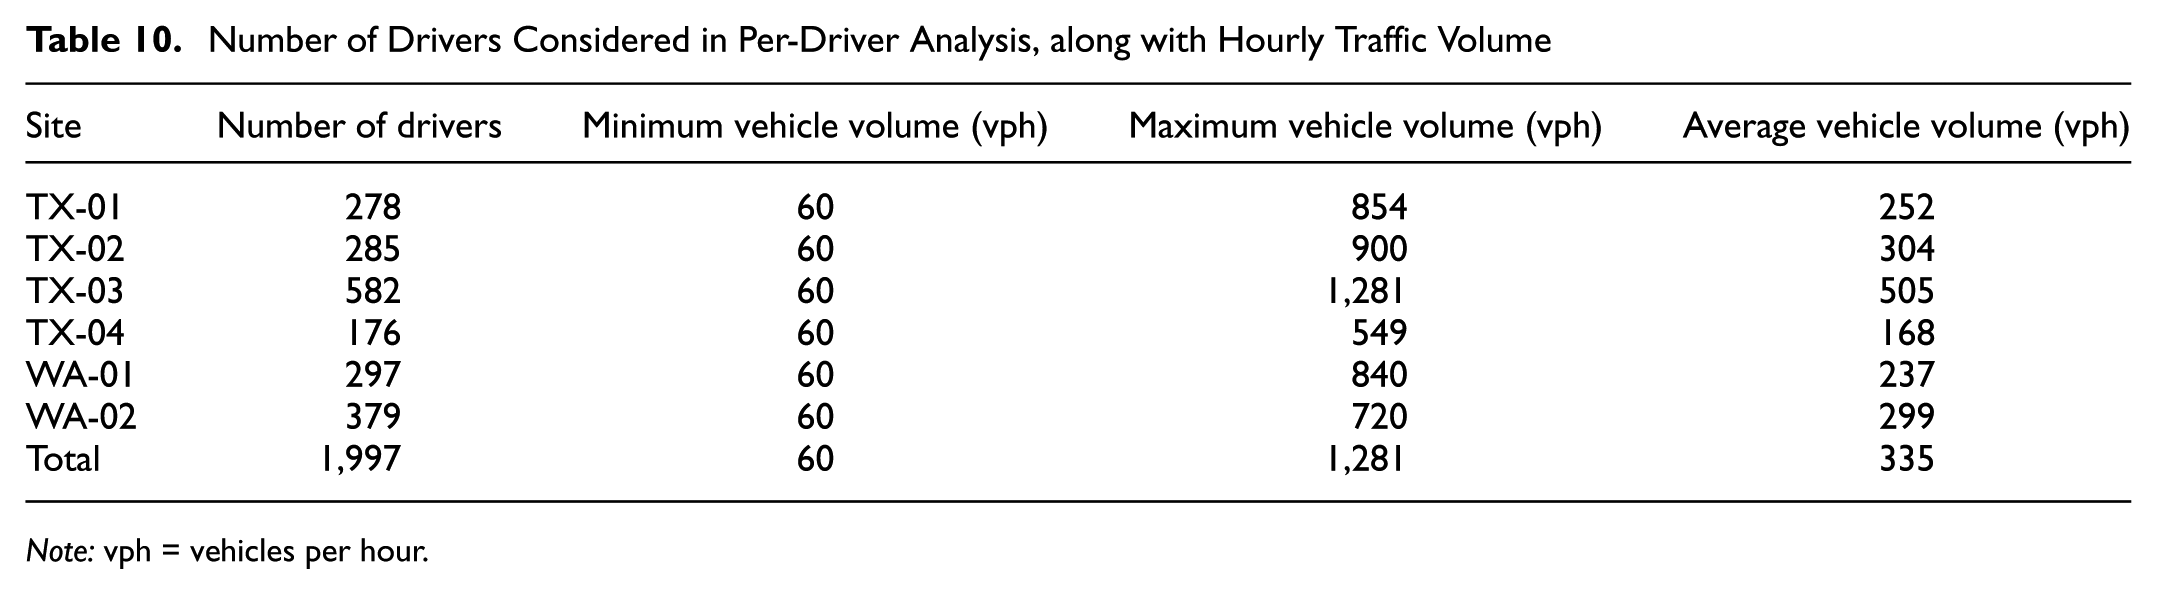
Note: vph = vehicles per hour.
Logistic Regression Model Coefficients
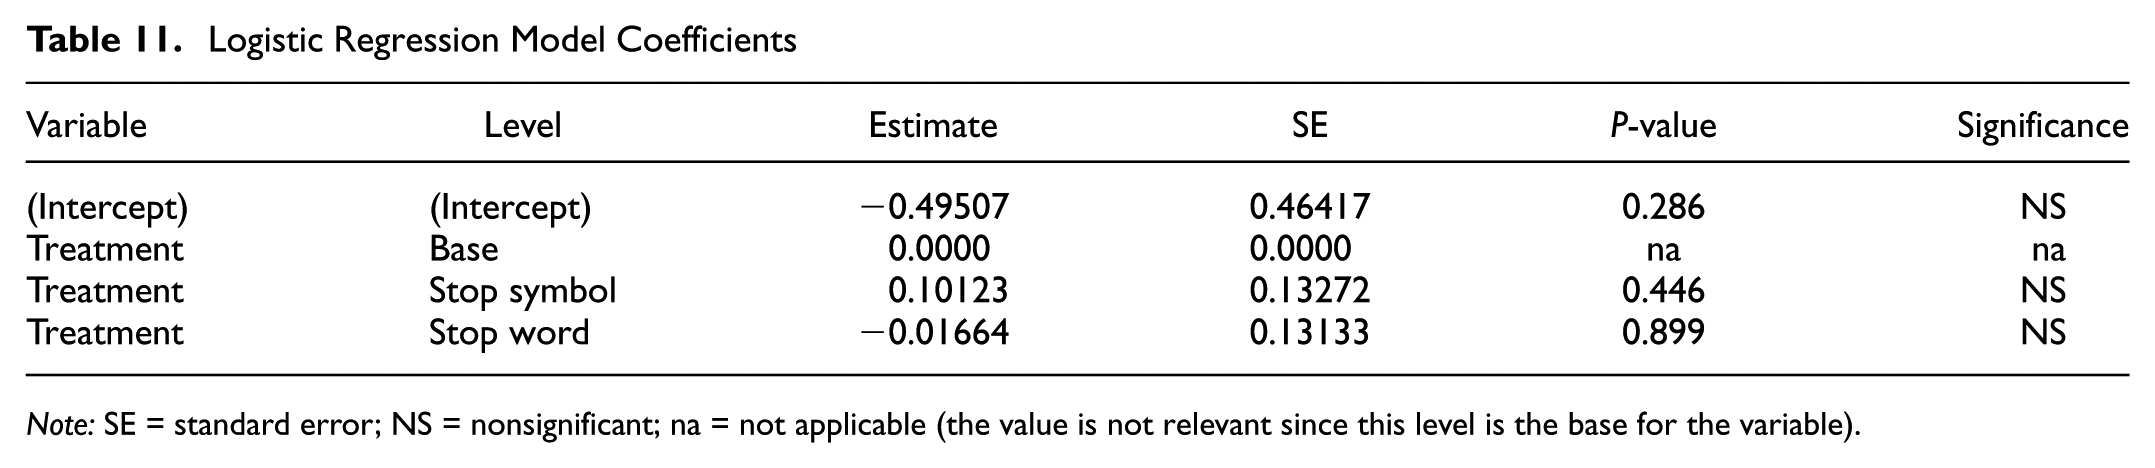
Note: SE = standard error; NS = nonsignificant; na = not applicable (the value is not relevant since this level is the base for the variable).
In the binary logistic regression model the dependent variable was defined as 1 if the driver yielded and 0 otherwise. The model assumes a logit link function of the form

where
The research team considered the equivalent hourly traffic volume (estimated from the 1-min vehicle count before the staged pedestrian crossing) to have potential since it varied by individual crossing. Table 10 provides the range of volumes for each site. The variable was nonsignificant in all of the models. The absence of a significant traffic volume effect may suggest that, within the observed range, the staged-pedestrian protocol reduced variability in driver response by standardizing pedestrian behavior across crossings.
Field Study Findings
In both the per-driver and per-site analyses, the key finding was that treatment (i.e., the warning or test signs) was nonsignificant. All three signs had similar driver yielding results. This lack of statistical significance suggests that, within the range of sign designs tested, drivers may respond similarly once a pedestrian is present at the crosswalk. This consistency in response may reflect a threshold effect, in which the presence of a pedestrian is the dominant cue, diminishing the marginal influence of variations in sign design.
Discussion
The field study results indicated that the regulatory sign alternatives did not produce statistically detectable differences in driver yielding relative to the existing W11-2 warning sign. Rather than indicating an absence of influence, this finding suggests that sign type alone may not be a dominant factor in shaping yielding behavior at uncontrolled crosswalks under the conditions studied. This outcome suggests the potential importance of other contextual factors, such as vehicle speed, roadway geometry, and driver expectations, which may override differences in sign format when drivers make yielding decisions.
One interpretation of this finding could be that since the test signs did not result in an improvement in driver behavior, the profession should preserve the status quo. This would also avoid other issues, such as costs for new signs, considering how the new sign should be designed for school crossings, or whether other signs used near or at pedestrian crosswalks (e.g., R1-5 or R1-6) would need to be changed.
The CBT showed that regulatory sign alternatives that included explicit commands (e.g., “Yield To”) were preferred and understood better than warning sign versions. The CBT results showed that drivers misinterpreted the current W11-2 sign when located at the crosswalk. Considering this finding and that the existing pedestrian crossing warning sign performed similarly to the test signs in the field, moving to a regulatory sign could provide potential benefits since these signs,
Tell the driver what to do (stop for, or yield to, the pedestrian),
Indicate that the pedestrian needs to be in the crosswalk, and
Reinforce the regulations concerning the driver yielding to a crossing pedestrian.
The divergence between CBT and field results can be interpreted through behavioral decision-making frameworks. Although improved comprehension is a necessary condition for behavioral change, it is not always sufficient. In real-world driving environments, yielding decisions are influenced by multiple competing factors, including vehicle speed, traffic flow, perceived risk, and driver expectations. As such, even if a sign enhances understanding, its effect on behavior may be attenuated when other contextual cues dominate the decision process.
The 11th edition of the MUTCD Section 2B.20 notes that the in-street and overhead signs (R1-6 and R1-9) “may be used to remind road users of laws in relation to right-of-way at an unsignalized crosswalk” ( 3 ). Implementing the newly developed test signs would also provide that driver education component.
Another benefit of using the newly developed test signs at the crosswalk is that the diamond warning sign would only be used in advance to warn of the downstream pedestrian crosswalk; a regulatory sign would be present for the actual crosswalk. Use of the regulatory shape sign would also be in line with other signs for use at pedestrian crossings such as the R1-5, R1-6, R1-9, and R10-15 (Table 1). This could improve the consistency of design and application among pedestrian crossing regulatory and warning signs. Although this research focused on the pedestrian crossing scenario, implementation of the findings from the research could have impacts on other signs, such as the signs shown in Table 1 or on signs used at school crosswalks. Figure 7B-1 in the 11th edition of the MUTCD shows the signs used in school areas and at school crosswalks ( 3 ).
This research tested both word and symbol versions of the regulatory signs. Currently, the MUTCD (Sections 2B.19 and 2B.20) allows only the symbols on the R1-5, R1-6, and R1-9 series ( 3 ). One consideration in implementing the findings from this research is whether both the word or symbol for the stop or yield message (depending on state law) of the sign would be the standard, with or without the option of using the alternate form.
The R1-5, R1-6, and R1-9 series are increasingly deployed by agencies, which generates the question that if these signs, which include a stop or yield symbol, are used in some places and not others, will drivers assume that at a crosswalk with only the W11-2, they do not need to stop or yield?
Study Limitations and Future Research Needs
This section summarizes the study limitations, along with future research needs identified during the study.
Limitations
Study limitations can be grouped by the study approach (CBT and in-field).
For CBT, the research team was unable to determine what else the subjects were doing while taking the test. In addition, the subjects could not ask for clarification because the CBT was Internet-based. Further, the human factors study used images rather than actual signs. Lastly, the format of the CBT did not allow for testing whether the context of the road (e.g., urban versus suburban) or the number of pedestrians at the crossing might make a difference in the responses.
On the other hand, the in-field study limitations included the researchers’ inability to ask drivers for their preferences among the test signs, or ascertain whether drivers even noticed that a different sign was present at the crosswalk. Researchers were unable to collect the demographic distribution of the drivers included in the in-field study. The research team was unable to test whether the number of pedestrians crossing would have made a difference in yielding across the three signs because a staged-pedestrian protocol was used. Collecting driver yielding data over a longer period so that driver yielding to natural pedestrians could be collected, or perhaps following a public relations campaign, could address some of the limitations of the staged-pedestrian protocol. Another potential limitation of this study was that with only six field study locations, the analysis may not have thoroughly considered the influence of site characteristics on driver yielding. The impact on driver yielding from site characteristics, however, was anticipated as the study design focused on the influence of sign treatment, and driver yielding data were collected at each site across the study periods during which each study period included a different sign treatment. A study with additional sites may be able to explore other questions, such as whether there is an interaction effect for sign type and number of lanes; for example, does the type of sign (warning or regulatory) influence yielding decision for drivers in the lane farthest from the sign?
Future Research Needs
The following are suggested research needs:
Investigate signing options for crosswalks that include advance yield or stop lines with the R1-5 sign. Are there concerns that the sign being used at the advance yield or stop line is blocking the view of the signs used at the crosswalk? Are there too many signs when using a sign at the advance line and at the crosswalk? In other words, is sign clutter an issue? There may be a greater need for this research if the R1-5 sign is permitted on two-lane roads. After the signing options at the crosswalk are developed with consideration of the presence of an advance yield or stop line with an R1-5 sign, tests on the open road should be conducted.
The R1-5, R1-6, and R1-9 series seem to be increasingly deployed by agencies, which leads to the question: If signs that include a stop or yield symbol are used in some places and not others, will drivers assume that they do not need to stop or yield at a crosswalk with only the W11-2 pedestrian crossing warning sign?
Should the word and symbol versions of the proposed new regulatory signs both be allowed, or just the symbol version, as for R1-5 and R1-6?
Footnotes
Author Contributions
The authors confirm contribution to the paper as follows: study conception and design: K. Fitzpatrick, S. Chrysler; data collection: K. Fitzpatrick, S. Chrysler, N. Johnson; analysis and interpretation of results: K. Fitzpatrick, S. Chrysler, B. Kutela, N. Johnson; draft manuscript preparation: K. Fitzpatrick, S. Chrysler, B. Kutela. All authors reviewed the results and approved the final version of the manuscript.
Declaration of Conflicting Interests
The authors declared no potential conflicts of interest with respect to the research, authorship, and/or publication of this article.
Funding
The authors disclosed receipt of the following financial support for the research, authorship, and/or publication of this article: This research was sponsored by FHWA as part of the following research project: Pedestrian Signing at Unsignalized Crossings. This material is based on work supported by the FHWA under contract number 693JJ322D000003.
This document is disseminated under the sponsorship of the U.S. Department of Transportation in the interest of information exchange. The U.S. Government assumes no liability for the use of the information contained in this document. The Federal Highway Administration (FHWA) provides high-quality information to serve Government, industry, and the public in a manner that promotes public understanding. Standards and policies are used to ensure and maximize the quality, objectivity, utility, and integrity of its information. FHWA periodically reviews quality issues and adjusts its programs and processes to ensure continuous quality improvement. Except for the statutes and regulations cited, the contents of this document do not have the force and effect of law and are not meant to bind the States or the public in any way. This document is intended only to provide information in relation to existing requirements under the law or agency policies. Any opinions, findings and conclusions, or recommendations expressed in this publication are those of the author(s) and do not necessarily reflect the views of the Federal Highway Administration or the U.S. Department of Transportation. The contents do not necessarily reflect the official policy of the U.S. Department of Transportation. The U.S. Government does not endorse products or manufacturers. Trademarks or manufacturers’ names appear in this document only because they are considered essential to the objective of the document. They are included for informational purposes only and are not intended to reflect a preference, approval, or endorsement of any one product or entity.