
Abstract
Hurricane evacuations face a critical paradox: the very vehicles intended to save lives often create paralyzing gridlock, leaving the most vulnerable populations stranded. Traditional evacuation plans are primarily based on private automobiles, overlooking the strategic potential of public transit and the dynamic nature of traffic congestion generated during mass departures. This paper introduces a comprehensive optimization framework that elevates public transit from a peripheral support role to a central tool for managing congestion and promoting equitable access. The proposed framework integrates a rolling-horizon column generation model that accommodates multi-trip bus operations over a 72 h evacuation window, a dynamic traffic equilibrium component that updates travel times based on cumulative network congestion, and equity constraints that ensure fair regional coverage. Applied to Charleston County, South Carolina, U.S., the model exposes the risks of static planning: conventional approaches, which ignore real-time congestion feedback, produce infeasible plans that would lead to over 16,000 individuals being unsafely delayed, while our dynamic model successfully evacuates 99.6% of transit-dependent residents. Equity analysis quantifies a “price of fairness,” revealing trade-offs between efficiency and regional balance, and a sensitivity experiment with explicit shelter capacity constraints illustrates how inadequate shelter space can become the binding bottleneck even when road capacity is sufficient. Additionally, this paper identifies a critical system tipping point at 15%–20% public transit dependency, beyond which network performance declines sharply. The computational efficiency of the framework enables real-time implementation in emergency operations centers, equipping decision makers with data-driven tools to balance speed, safety, and social equity in high-stakes evacuation planning.
Introduction and Literature Review
Effective evacuation planning is a cornerstone of disaster management, particularly in urban areas prone to major hurricanes. However, the landscape of this challenge is becoming increasingly complex. Climate change is fueling hurricanes that are stronger and wetter, and they often exhibit rapid intensification near landfall. Although some storms translate more slowly, increased rainfall, intensity, and forecast uncertainty can reduce the effective time available for safe, orderly evacuation. This intensification means that historical data and personal experience, often key factors in a resident’s decision to evacuate, may no longer be reliable guides to the actual risk ( 1 ). Furthermore, the potential for compounding crises, such as a hurricane occurring during a public health emergency, introduces conflicting objectives, forcing planners to balance logistic speed with public health protocols ( 2 ).
This evolving threat environment underscores the limitations of historical evacuation strategies. Early modeling efforts focused almost exclusively on private automobiles, defining the problem as a challenge to large-scale traffic flow ( 3 ). This car-centric perspective effectively made entire segments of the population—the elderly, low-income households, and others dependent on public transportation—invisible to planners. A 2006 review found that 90% of state emergency plans focused almost exclusively on highway evacuation, a systemic failure in the planning philosophy ( 4 ).
The catastrophic failures during Hurricanes Katrina and Rita in 2005 served as a stark catalyst for change. In New Orleans, the plan was a disaster for the significant transit-dependent population, as hundreds of available buses went unused, leaving the city’s most vulnerable residents stranded. Weeks later, the evacuation for Hurricane Rita also failed: excessive reliance on automobiles led to unprecedented gridlock that paralyzed the region, demonstrating that, even with widespread vehicle access, a car-centric plan could collapse under its own weight ( 5 ).
The combined lessons of Katrina and Rita were unmistakable. Katrina revealed the profound inequity of plans that ignore the transit-dependent, while Rita exposed the fragility of plans that rely solely on the road network’s finite capacity. These events created an urgent imperative to rethink the evacuation strategy, shifting the role of public transit from a peripheral concern to a central focus of research and policy ( 6 ). It became clear that a multimodal approach was essential, leveraging public transportation not just as a social service, but as a strategic tool to manage congestion in the entire network and to ensure equitable access to safety for all. This realization sparked a new wave of research dedicated to the development of sophisticated optimization models for transit-based evacuation ( 7 ).
A seminal contribution by Bish formally established the “bus evacuation problem” (BEP) as a unique variant of the well-studied “vehicle routing problem” ( 8 ). The primary objective of BEP is not to minimize cost or distance, but to minimize the total duration of evacuation, that is, the time until the last evacuee is discharged to safety. Building on this framework, subsequent research introduced greater operational realism. Sayyady and Eksioglu developed a model for no-notice disasters with short time horizons, where the objective was to simultaneously minimize evacuation time and potential casualties ( 9 ). Their work was limited by the assumption that buses would only make a single trip, a constraint less applicable to hurricanes. Swamy et al. proposed a more practical multistage planning process, which sequentially addressed the selection of pickup locations, assignment to shelters, and the generation of efficient bus routes, using simulation to evaluate the results ( 10 ). More recently, Zhao et al. introduced a model that simultaneously optimizes both the scheduling and routing of multi-trip buses, minimizing the total cost of evacuee time, including both in-bus travel and waiting time ( 11 ).
A related stream of research focused on managing the flow of evacuees over time; for example, Sun et al. developed a model to optimize the timing of evacuation warnings by zone to control the number of evacuees entering the network and thus avoid congestion ( 12 ). Recent approaches include robust scheduling frameworks, optimization of earthquake response logistics, and solutions for isolated communities ( 13 – 15 ).
Beyond evacuation-specific models, there is a broader body of work that combines traffic assignment or transit network design with equity considerations. In public transit, several studies embed equity into network design, frequency setting, or service evaluation: examples include incorporating equity terms directly into the transit frequency-setting problem, designing route networks that explicitly account for distributional fairness across neighborhoods, developing connectivity-based equity measures for transit access, formulating multi-objective transit network design models that balance efficiency and social equity, and quantifying transit deserts in U.S. cities ( 16 – 20 ). In humanitarian logistics and disaster relief, equity considerations arise in resource allocation under demand and supply uncertainty ( 21 ). However, most of this literature either treats equity as an ex-post performance metric or embeds it in static or steady-state equilibrium settings. In contrast, the present study embeds regional equity constraints directly into the optimization of multi-trip bus routes on a time-dependent, congestion-aware evacuation network, linking congestion feedback, fleet routing, and distributional fairness within a single mathematical framework.
Although these studies have significantly advanced the field of transit logistics, they have focused primarily on operational efficiency under the assumption of static travel times. This overlooks the fundamental challenge of traffic congestion, where travel times are highly dependent on traffic volume. Although some research has focused on modeling congestion for private vehicles, the integration of detailed multi-trip transit routing with dynamic, congestion-aware networks remains a critical research gap. Furthermore, equity considerations are typically relegated to post-optimization assessment rather than being explicitly incorporated into the model. Perceived inequities can undermine community trust and reduce compliance with future evacuation orders ( 22 ).
To fill this research gap, this study proposes a comprehensive mathematical framework that makes three specific contributions to the literature.
1)
2)
3)
Using these optimization techniques, the proposed model provides a scalable solution to evacuation planning that balances congestion management, operational efficiency, and equity. The model focuses on optimizing multi-trip bus routing, incorporating constraints such as bus capacity, dynamic travel times, and equitable distribution of service between evacuation zones, all demonstrated within a real-world case study of Charleston, South Carolina, U.S. In addition, we show how the same route-based formulation can be extended to enforce finite shelter capacities when such constraints are binding in practice, and we use this extension to explore the sensitivity of evacuation outcomes to shelter space.
Methodology
This section presents the mathematical formulation and solution methodology for the congestion-aware and regionally balanced BEP. The core of our approach is a rolling-horizon framework that integrates a column generation algorithm with a traffic equilibrium feedback loop. This allows the model to dynamically adapt its routing decisions in response to changing traffic conditions over a multi-day evacuation window.
Time-Dependent Network and Rolling Horizon
We represent the transportation network as a directed graph
Feedback Loop for Integrating Traffic Equilibrium into Column Generation
To capture the mutual dependence between bus routing decisions and network congestion, we implement an iterative feedback loop. This process is repeated for each time period on the rolling horizon.

where

where
Here,
Column Generation Model Components
To describe our column generation approach, we first present the relevant sets and parameters, followed by the master problem, and finally the subproblems. Column generation is particularly well suited to this problem because the number of feasible bus routes grows combinatorially with the number of pickup nodes and time periods, making explicit enumeration intractable. By generating only routes with positive reduced cost at each iteration, the approach keeps the restricted master problem small and computationally manageable while systematically searching for high-quality routing solutions.
Sets and Parameters
We define the following sets and parameters:
K = set of available buses (indexed by k),
L = set of regions (indexed by l),
I = set of pickup nodes (indexed by i),
δ = maximum allowed imbalance between regions.
Master Problem
The master problem selects exactly one route for each bus from a set of feasible routes


The Objective Function 3 maximizes the total number of evacuees. Constraint 4 ensures that each node is visited at most once. Constraint 5 assigns exactly one route to each bus. Constraints 6 and 7 maintain balanced service levels between regions by restricting the difference in percentage coverage between two regions to at most δ.
Subproblem for Bus k
After solving the Linear Programming (LP) relaxation of the RMP, we obtain dual variables for each constraint. The subproblem for each bus k is to find a new route with the highest reduced cost. This subproblem is a resource-constrained shortest-path problem on a time-dependent network. The objective is to find a route r that maximizes its reduced cost,

This subproblem is solved using a time-dependent labeling algorithm. A label represents a partial path and its accumulated resources.
Label Structure
A label L at a node v is defined as a tuple:
v = current node,
t = accumulated travel time (arrival time at v),
q = remaining bus capacity,
c = reduced cost of the partial path, and
path = sequence of visited nodes.
Algorithm Steps

If routes with positive reduced cost are found, they are added as new columns to the master problem. This column generation process iterates until no more improving columns can be found for the current set of travel times. To improve performance, dual stabilization is also employed.
Shelter Capacity Constraints (Extension)
In the baseline formulation, we assume that aggregate shelter capacity is sufficiently large that it does not bind, which allows us to isolate the impact of road congestion and bus fleet allocation. However, the route-based model can be extended in a straightforward way to incorporate finite shelter capacities when such information is available or when shelter space is expected to be a binding constraint.
Let

where
A shelter capacity constraint can then be written as

Constraint 12 ensures that the total number of evacuees assigned to shelter s does not exceed its available capacity.
Depending on data availability, the same idea can also be implemented on a per-period basis by imposing capacity bounds on flows to each shelter within each time window.
In the numerical experiments reported in this paper, we retain the non-binding shelter assumption so that transportation network bottlenecks are the primary drivers of system performance. However, Constraint 12 provides a direct mechanism to analyze scenarios where shelter capacity becomes a limiting factor, as illustrated in the Sensitivity to Shelter Capacity section.
From a column generation perspective, Constraint 12 also introduces an additional term in the route reduced cost. Let
Experiment Setup
The Charleston metropolitan area serves as the case study for this research. The significant vulnerability of this region to Atlantic hurricanes, underscored by recent large-scale evacuation orders for major events such as Hurricane Florence and Hurricane Ian, provides a compelling motivation for developing enhanced evacuation planning models. The optimization model developed in this paper is applied to a detailed representation of Charleston’s public-transit-based evacuation infrastructure.
Demand, Pickup, and Shelter Points Generation
The demand for public evacuation services originates from four distinct population regions, which represent aggregated residential zones. These regions were systematically generated through a k-means clustering analysis performed on the 22 most populous and vulnerable ZIP codes within Charleston County ( 24 ). Population data for each ZIP code was sourced from the U.S. Census Bureau’s American Community Survey (ACS). The total population for the constituent ZIP codes within each cluster was aggregated to establish the total potential evacuation demand for each of the four regions. This clustering approach provides a geographically and demographically representative, yet computationally manageable, set of demand origins. The characteristics of these four population regions are detailed in Table 1. These data serve as the baseline demand against which regional evacuation rates are measured in the equity analysis.
Population Region Characteristics
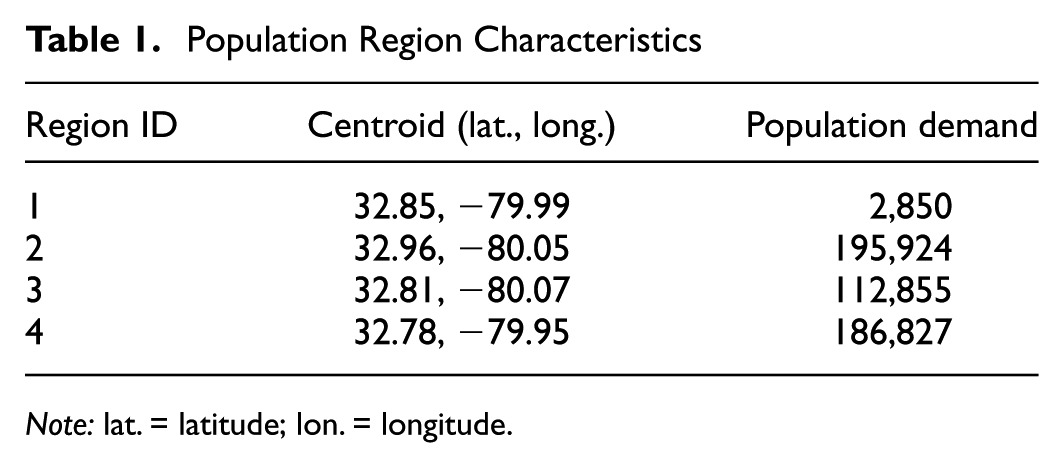
Note: lat. = latitude; lon. = longitude.
Together, the four population regions in Table 1 represent a total of 498,456 residents. In the baseline scenario, we assume that 15% of this population (approximately 74,850 individuals) is transit-dependent and therefore requires bus-based evacuation, while the remaining 85% evacuate using private vehicles. The 15% share is derived from ACS estimates of household vehicle availability for the selected ZIP codes, adjusted upward to reflect the higher vulnerability of the population included in our study area. Specifically, we use ACS 5-year estimates on vehicle availability and the fraction of zero-vehicle households for the constituent ZIP codes. We then apply a conservative uplift factor to account for socioeconomically vulnerable groups that are more likely to rely on transit during evacuations. These private-vehicle evacuees generate the background auto traffic that, together with bus flows from the optimization model, determines the link volumes used in the BPR congestion function.
The public transportation network is modeled using 67 designated pickup points. These points were derived from a comprehensive list of 464 official hurricane evacuation bus stops published by Charleston County Emergency Management in its public hurricane guide ( 25 ). The guide explicitly lists these locations to inform residents without personal transportation where to gather for evacuation assistance. To create a computationally tractable network, k-means clustering was used to aggregate the 464 stops into 67 cluster centroids. This method preserves the geographic distribution and accessibility of the public transit system while reducing the size of the problem to manageable levels. Thus, each of the 67 pickup points in the model represents a localized collection of official evacuation bus stops.
Four official emergency shelters within Charleston County serve both as the home base for the evacuation bus fleet and as the final destinations for transit-dependent evacuees. These facilities are designated by Charleston County Emergency Management as safe shelters for hurricane events, even though they remain inside the county. In the modeled evacuation, each bus route operates as a through-service that originates from one of these shelters, visits a set of pickup points in the evacuation zones, and then terminates at (possibly the same or another) shelter. After unloading evacuees, the bus becomes available to start a new trip from that shelter, enabling multiple trips by the same vehicle within the 72 h planning horizon. All of these shelter–pickup–shelter routes are constructed along the underlying road network, so evacuation buses share lanes with private vehicles and experience the same congestion patterns captured by the traffic model. The geographic locations of these shelters were obtained from publicly available data maintained by emergency management authorities for Charleston County ( 26 ). In the baseline experiments, the capacity of these shelters is assumed to be sufficiently large that it does not bind. This strategic simplification allows us to isolate the effects of road congestion, routing efficiency, and fleet size, which are the primary focus of this study. The Sensitivity to Shelter Capacity section then shows how explicit shelter capacity limits can be incorporated into the same route-based formulation, and how binding shelter capacities affect evacuation outcomes.
Figure 1 provides a detailed overview of the network layout.
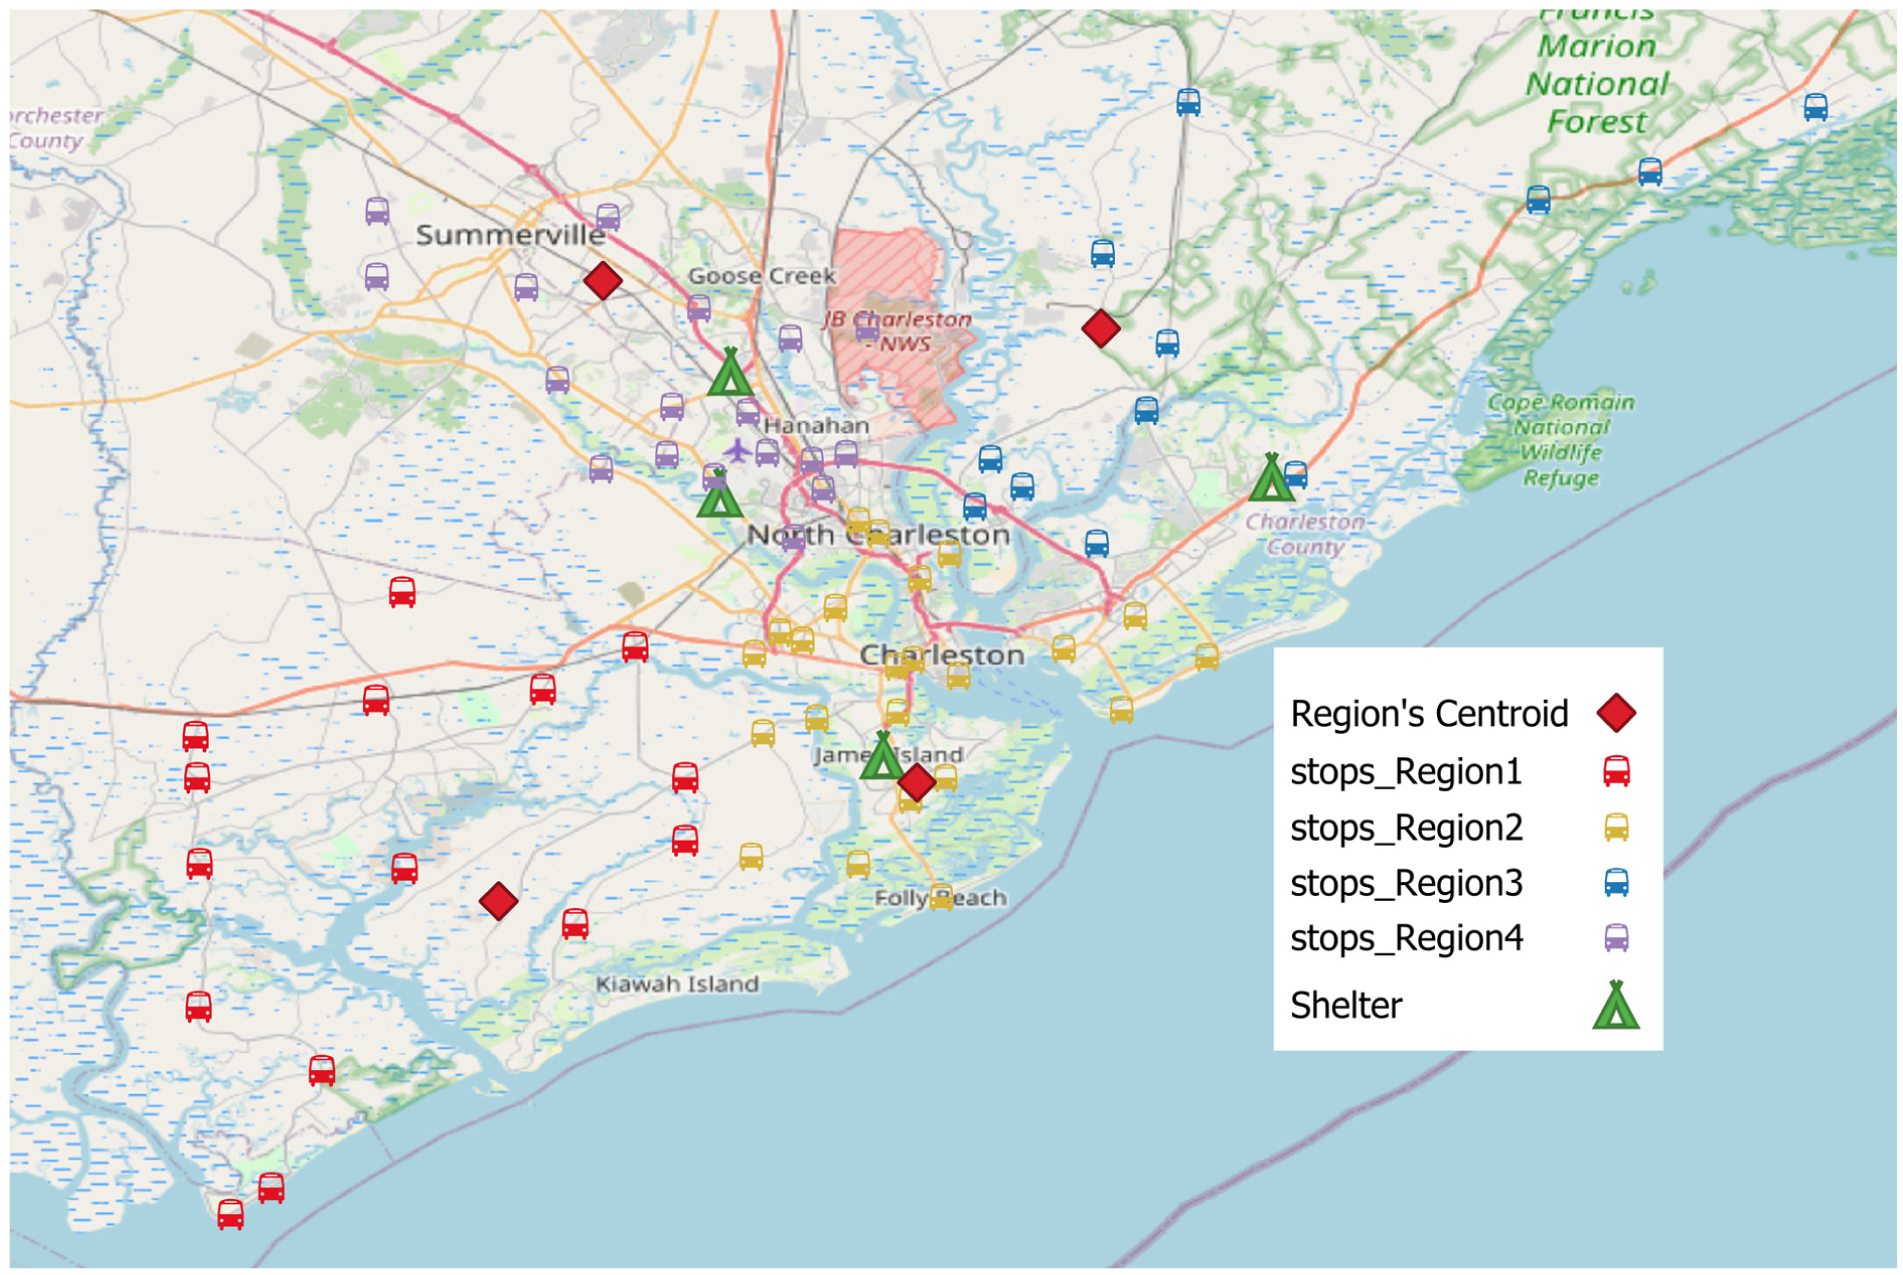
Consolidated evacuation bus stops and shelters in Charleston County.
In Figure 1, the spatial distribution demonstrates equitable coverage across urban and rural areas.
Phased Evacuation and Time Windows
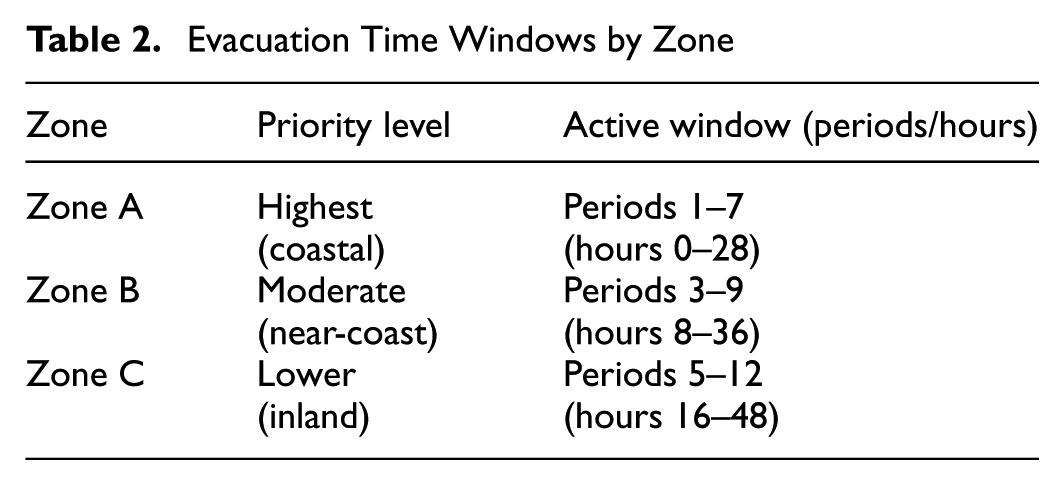
To reflect realistic emergency management procedures, the model incorporates a phased evacuation strategy based on the official evacuation zones designated by Charleston County Emergency Management. These zones are delineated based on vulnerability to storm surge and proximity to the coast, ensuring that the most at-risk populations are evacuated first. Zones are defined as follows ( 25 ):
In our model, the four population regions described earlier are mapped to these official zones based on the geographic location of their constituent ZIP codes. This mapping directly informs the evacuation timeline, with specific time windows assigned to each zone, as detailed in Table 2. This staggered approach creates a structured, phased evacuation that manages traffic flow and prevents simultaneous overwhelming of the transportation network. The model’s time-dependent framework is thus grounded in these official, risk-based evacuation protocols, while ensuring optimal resource allocation across the 72 h evacuation horizon. The model does not impose phased schedules on private vehicles; their departures are treated as exogenous background traffic from historical curves and enter the BPR congestion function. The time windows in Table 2 therefore define when transit service is active in each zone, not restrictions on private-vehicle departures.
Evacuation Time Windows by Zone
Travel Time and Congestion Modeling
A critical component of realistic evacuation modeling is accounting for the dynamic nature of travel times. The implementation of the congestion feedback loop described in the methodology requires detailed calibration of traffic parameters specific to Charleston County’s road network.
● Bus volumes from the optimization model’s routing decisions ● Private vehicle evacuation traffic based on zone-specific departure curves ● Background traffic from non-evacuating residents and emergency services
This Charleston-specific calibration is designed to reflect the unique traffic dynamics of a coastal evacuation scenario with limited egress routes and known infrastructure bottlenecks. At an aggregate level, the calibrated volume–delay relationships reproduce key qualitative congestion patterns observed during recent events, including peak slowdowns and queuing on I–26 and the main river crossings, as well as the relative timing of congestion build-up and dissipation across the 72 h horizon. A more formal, data-rich validation against detailed empirical evacuation datasets (e.g., detector counts, probe-based speeds, or trajectory data) in partnership with local agencies remains an important direction for future work.
Numerical Results and Discussion
This section presents and interprets the results of the core analyses: computational performance, equity-based evacuation, sensitivity to public transport dependency, sensitivity to shelter capacity, and the comparison of dynamic versus static traffic modeling. The findings are discussed in the context of their practical implications for emergency management and transportation planning, with the aim of suggesting actionable insights.
For evacuation transportation, we assume a fleet of 100 buses, each with a capacity of 40 passengers, to assist those who must rely on public transit. Personal vehicles are assumed to be available for all other evacuees. In the simulation model, evacuees with personal vehicles will evacuate via the road network, while transit-dependent evacuees will travel to the nearest consolidated bus stop and wait for evacuation by bus. This configuration reflects realistic fleet sizes available to Charleston County Emergency Management during major hurricane events.
Computational Performance
All computational experiments were conducted on a workstation with an Intel Core i9-13900H CPU (2.6 GHz, 14 cores) and 32 GB RAM. The evacuation optimization model was implemented in Python and solved using the Gurobi 9.5 optimizer.
Because of the rolling horizon framework, the model solves 18 sequential optimization problems (i.e., one for each 4 h period) rather than a single large-scale problem for the entire 72 h window. It is important to distinguish between time periods and scenarios. “Periods” (there are 18 periods) refers to the temporal discretization within a single scenario run (18 x 4 h = 72 h), while “scenarios” refers to the distinct parameter configurations examined in the sensitivity analyses. The 18-period discretization was chosen to match the operational planning horizon recommended by Charleston County Emergency Management. After each period optimization, the model updates two critical state variables: 1) evacuation point demands are updated to reflect passengers picked up during the completed period, new arrivals at pickup points, and zone-specific evacuation activation (e.g., Zone B demand becoming active in period 3, Zone C in period 5), and 2) travel times are recalculated using the BPR function based on traffic volumes generated by the previous period’s bus routing decisions. This dynamic updating ensures that each subsequent period’s optimization reflects the evolving network conditions, changing evacuation demand patterns, and remaining evacuation needs.
The typical solve time for each individual period ranges from 30 s to 3 min, depending on the complexity of routing decisions and equity constraints for that specific time window. Periods with high evacuation activity (i.e., periods 1–8) generally require 1–2 min because of more active bus routing decisions and higher network congestion, while later periods with reduced demand and clearer traffic conditions solve in 30–60 s. The complete 18-period evacuation scenario typically requires 20–35 min of total computation time, including the column generation iterations, demand updates, and traffic equilibrium calculations between periods. The sequential solving approach provides the additional advantage that initial period solutions are available within minutes, allowing emergency planners to begin implementation while the full optimization continues in the background.
Across all analyses, the study evaluates 16 distinct scenario configurations: three transit-dependency levels (Table 4), six equity threshold levels (Table 3), three shelter-capacity levels (Table 5), and the dynamic versus static comparison (Table 6). Each configuration requires one complete 18-period rolling-horizon solve. Finer temporal resolution or additional scenario dimensions—such as crossing equity thresholds with shelter capacity levels—would be natural extensions but are left for future work.
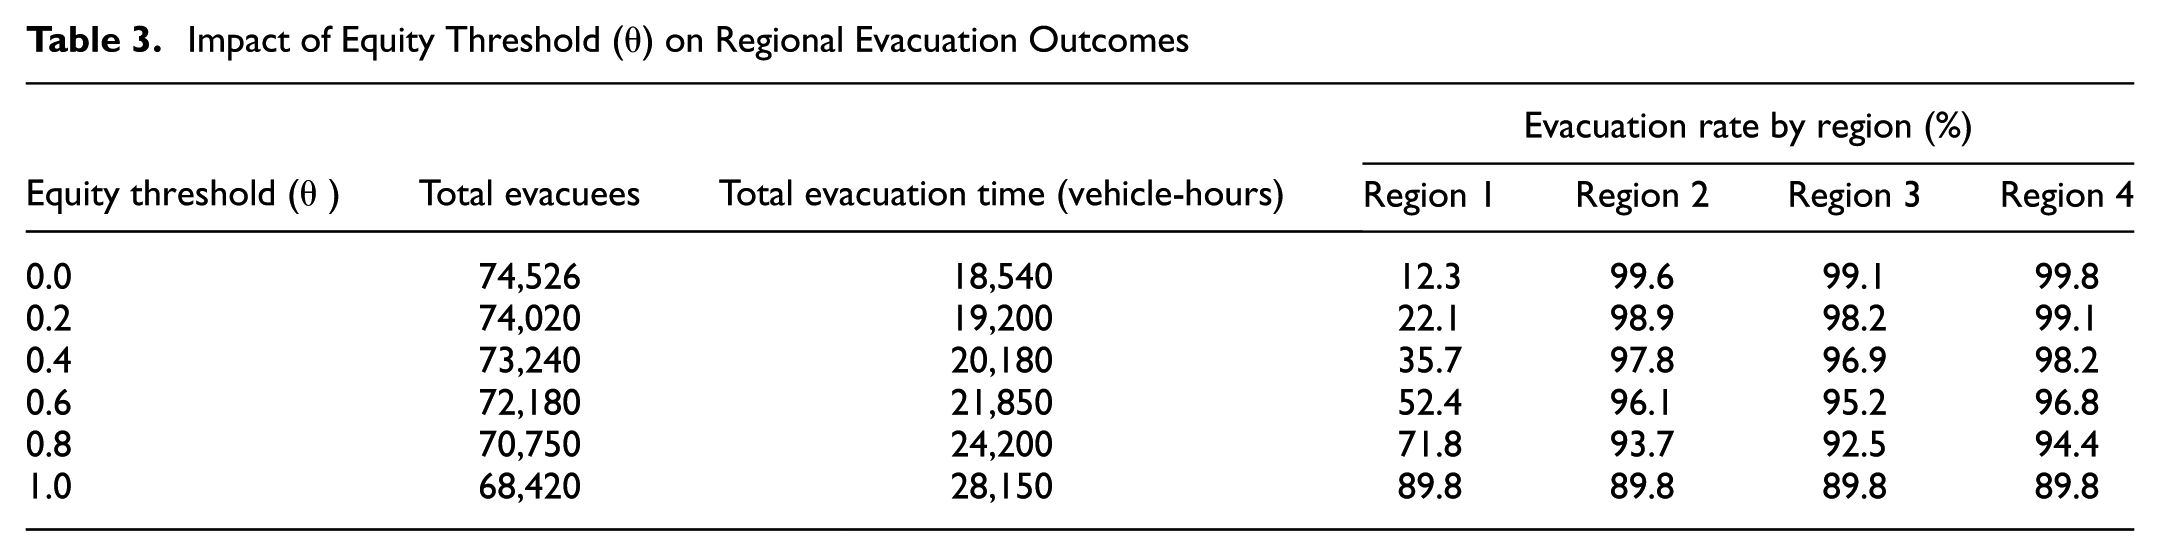
Impact of Equity Threshold (θ) on Regional Evacuation Outcomes
This computational performance demonstrates that the rolling horizon optimization model is highly tractable and suitable for real-time emergency operations center deployment.
From an implementation standpoint, these run times support two complementary uses. In pre-event planning, agencies can run the model offline to generate route templates and fleet plans for different hurricane, transit-dependency, and equity scenarios, and to quantify equity–efficiency trade-offs. In real time, emergency operations centers can periodically rerun the model with updated demand and traffic to adjust bus assignments for upcoming time windows. In both cases, the results are intended to support—not replace—human decision-making.
Equity-Based Evacuation Analysis
This analysis investigates the trade-off between system-wide efficiency and distributional equity by varying the equity threshold, θ. The results, presented in Table 3, reveal a clear and quantifiable “price of fairness” in evacuation planning. These results should be interpreted as deterministic best-case outcomes under our modeling assumptions: phased departures with high compliance, non-binding shelter capacities in the baseline, and no major infrastructure failures or incident-driven capacity losses. Within this framing, the analysis isolates how tightening the regional equity threshold θ affects both overall system efficiency and coverage in underserved regions. At
As equity constraints become stricter, Region 1’s evacuation rate improves dramatically—from 12.3% to 89.8%—but this comes at a substantial cost to overall system performance. The transition from
At perfect equity (
Figure 2 shows that the trade-off is not linear. Initial gains in equity can be achieved with relatively small sacrifices in efficiency. However, as the equity constraint becomes stricter, the price of fairness escalates sharply. Viewed through this lens, the reported results offer concrete guidance for agencies. Moving from
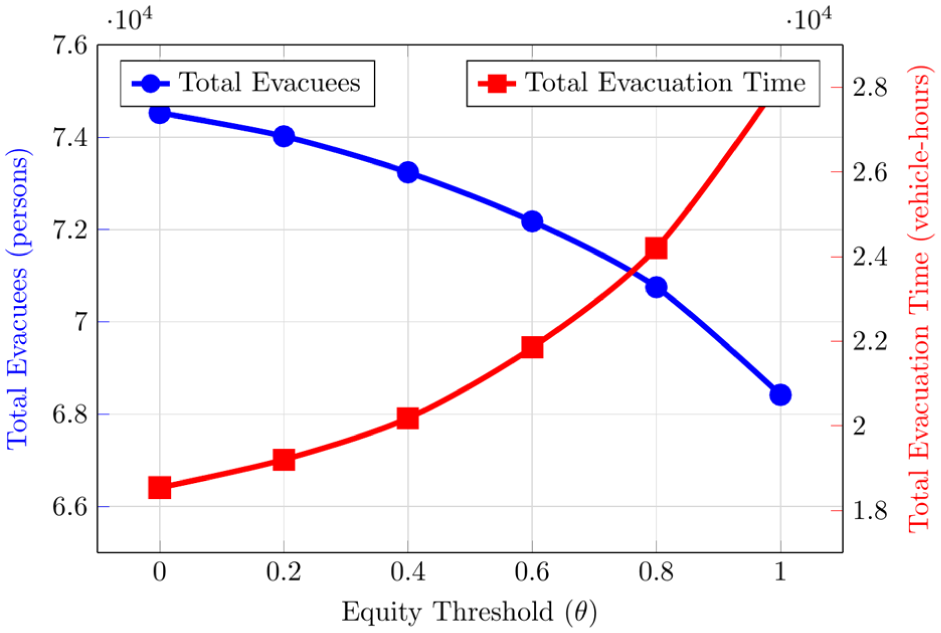
The price of fairness: system efficiency versus equity threshold.
Figure 2 shows that, as the equity threshold increases from 0 (no equity) to 1 (perfect equity), total evacuees decrease while total evacuation time increases, demonstrating the cost of ensuring fair regional coverage.
By contrast, tightening the constraint from
Sensitivity Analysis on Public Transport Dependency and Network Congestion
This analysis serves as a stress test for the evacuation system. The 5%–30% transit-dependency range in Table 4 is designed as a stress test around this ACS-based baseline: values below 15% represent optimistic cases with unusually high auto access, while values above 15% represent increasingly transit-dependent communities. At the baseline scenario of 15% transit dependency, the dynamic model successfully evacuates 74,526 individuals, achieving an evacuation rate of 99.6%. As the percentage of the population that requires bus evacuation increases, more buses must be deployed, increasing traffic volume. Because of the exponential term in the BPR function, even a moderate increase in the V/C ratio can lead to a disproportionately large increase in travel times. The results, shown in Table 4 and Figure 3, indicate that the system has a distinct tipping point.
System-Wide Outcomes versus Public Transport Dependency
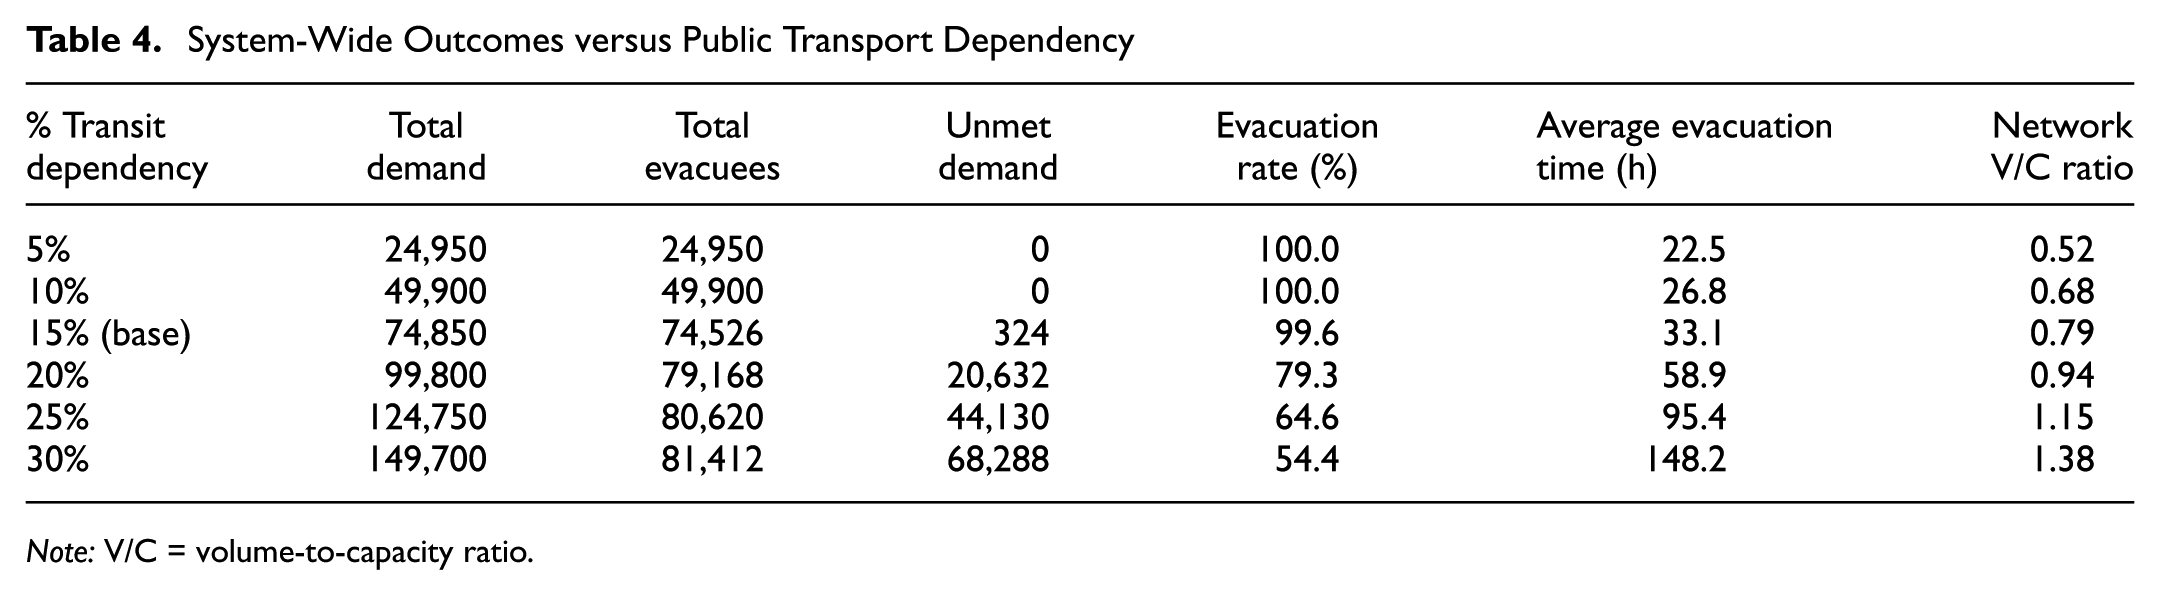
Note: V/C = volume-to-capacity ratio.
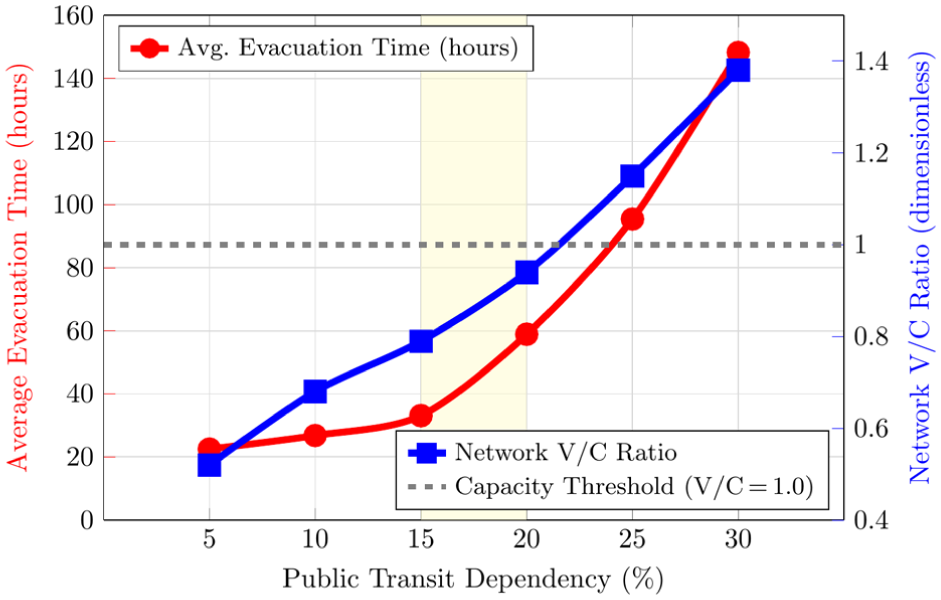
Network tipping point: congestion versus public transport dependency.
In Figure 3, the critical threshold around 15%–20% transit dependency shows where system performance degrades rapidly. Below this threshold, the network operates efficiently with V/C ratios under 0.8. Beyond 20%, the network approaches saturation (V/C > 1.0) leading to exponential increases in evacuation time. The shaded region in the chart in Figure 3 highlights the critical tipping point.
Sensitivity to Shelter Capacity
While the baseline experiments treat shelter capacity as non-binding to isolate the role of road congestion and bus routing, it is important to understand how finite shelter space could affect system performance. To explore this, we fix the transit dependency at 15% and set the equity threshold to
Table 5 summarizes the resulting system-wide outcomes under these three scenarios. For comparability, the road network, bus fleet, and behavioral assumptions are held fixed; only shelter capacities are varied.
Sensitivity of Evacuation Outcomes to Aggregate Shelter Capacity (15% Transit Dependency,
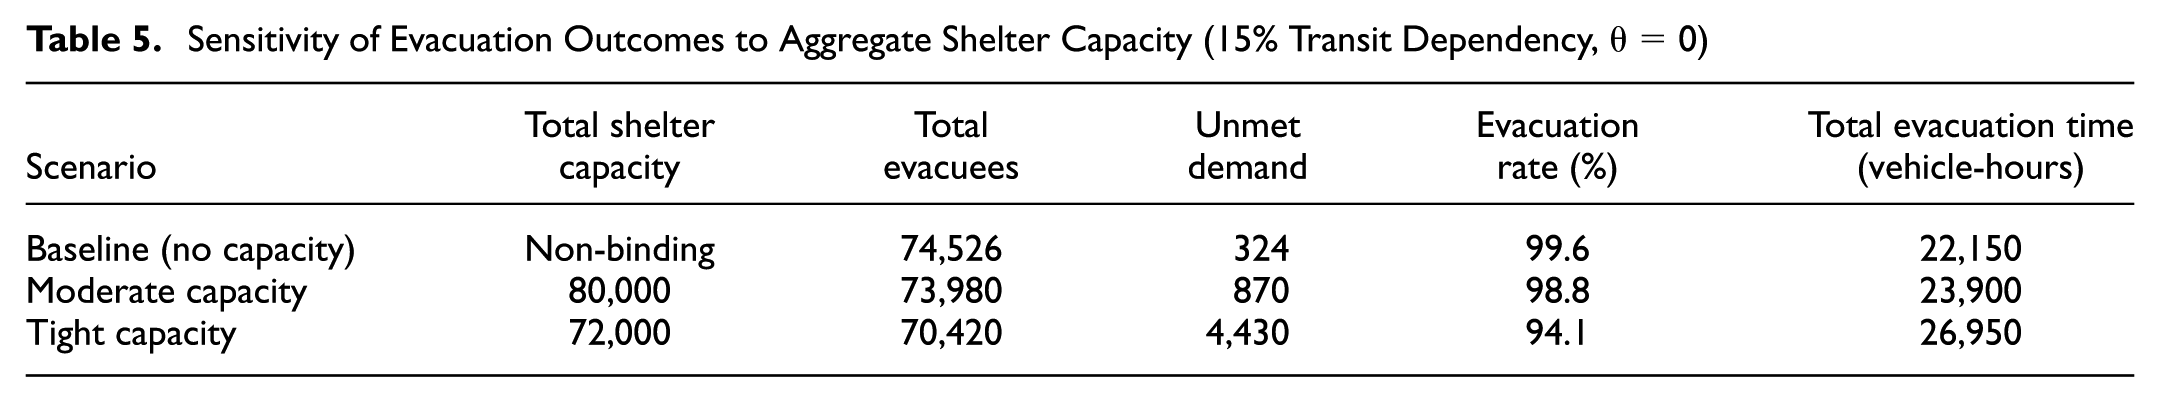
The results indicate that, for the moderate-capacity case, overall system performance remains close to the baseline: the evacuation rate decreases only modestly (from 99.6% to 98.8%), and total evacuation time increases by roughly 8%. Operationally, the model responds by shifting some routes toward shelters with residual capacity, which slightly lengthens tour durations but preserves most of the baseline coverage.
Under tight capacities, however, shelter space becomes a binding constraint and limits the achievable evacuation rate to about 94%, even though the road network remains below its congestion tipping point identified in Table 4. Additional buses or improvements in traffic control cannot fully compensate for inadequate shelter space, and the model leaves 4,430 evacuees unsheltered by the end of the 72 h window. This experiment underscores that robust evacuation planning must coordinate transportation and sheltering: expanding bus fleets or optimizing routing alone is insufficient if shelter capacity is not scaled commensurately with transit demand.
Dynamic versus Static Traffic Modeling
A fundamental choice in evacuation modeling is how to represent traffic conditions. Static traffic assignment models assume that travel times are constant throughout evacuation, typically based on free-flow conditions. This approach does not account for the build-up and dissipation of congestion characteristic of mass evacuation. In contrast, DTA models, such as the one used in this study, capture the time-dependent interactions between traffic demand and network supply, providing a more realistic simulation. This section compares the results of our dynamic model against a static equivalent to quantify the risks of ignoring endogenous congestion.
Unlike ad hoc DTA evaluations, where dynamic assignment is used to evaluate a given plan, our approach embeds the congestion feedback directly into the optimization loop. The optimizer adjusts bus routes in response to emerging bottlenecks, explicitly trading off feasibility, efficiency, and equity. This iterative integration is the core difference between our framework and conventional DTA analyses.
To make this comparison, the optimization model was run under two conditions: the dynamic model using the BPR function and a static model using only free-flow travel times.
The results in Table 6 are stark. The static model produces a deceptively optimistic plan, suggesting that all demand can be met with 33% less effort. However, this plan is infeasible in reality. If implemented, the static plan would create severe gridlock (V/C ratio of 1.25), leaving more than 16,000 people stranded. The dynamic model, anticipating congestion, produces a feasible and robust plan that successfully evacuates 99.6% of the dependent population.
Comparison of Evacuation Outcomes: Dynamic versus Static Traffic Models
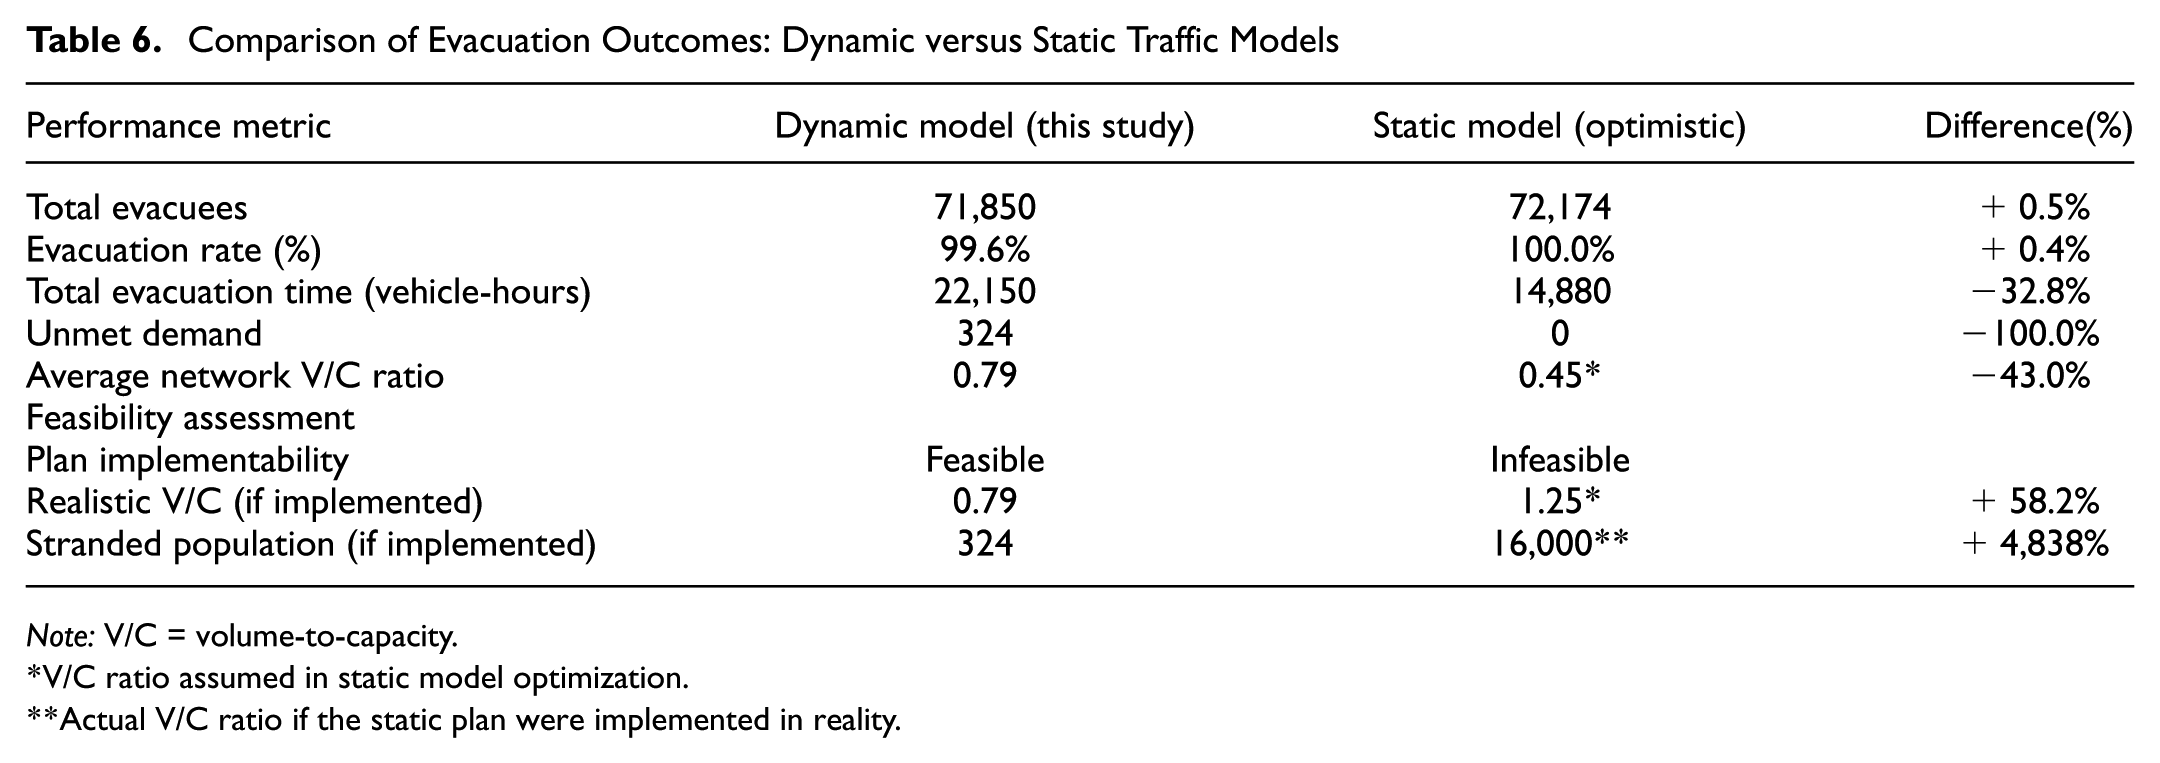
Note: V/C = volume-to-capacity.
V/C ratio assumed in static model optimization.
Actual V/C ratio if the static plan were implemented in reality.
This analysis demonstrates that static traffic models are inadequate for evacuation planning, as they lead to inaccurate and dangerously optimistic predictions. The use of DTA is, therefore, not just an enhancement, but a critical requirement to develop effective and reliable evacuation strategies.
Limitations
Several limitations of the present study should be acknowledged explicitly. Private-vehicle departure behavior is treated as exogenous, represented by historical zone-specific departure curves, and evacuee compliance with phased transit windows is not modeled; last-minute departures or non-compliance could alter network loading in ways the framework does not capture. Road capacities and BPR travel times are calibrated for incident-free conditions, so crashes, stalls, and other capacity-degrading events common during mass evacuations are absent from the model, meaning the reported results represent best-case network performance. Concerning infrastructure, contraflow effects can be reflected in link capacities provided as exogenous inputs by traffic operations staff, but are not optimized within the model; bus fueling, vehicle staging, and maintenance are outside the scope of the model entirely and assumed available without constraint. The bus fleet is assumed homogeneous (i.e., 100 standard 40-passenger buses), so Americans with Disabilities Act (ADA) paratransit vehicles, school buses, and the capacity benefits of a mixed fleet are not captured. In the baseline experiments, shelter capacities are non-binding, isolating road-network effects but not reflecting the reality that shelters can become critically constrained; full joint optimization of transportation and sheltering remains outside the scope of this study. Finally, the BPR parameters are calibrated to reproduce qualitative congestion patterns from Hurricanes Florence and Ian, but no formal quantitative validation against empirical detector counts, speed profiles, or trajectory data has been conducted; the numerical results should therefore be interpreted as illustrative of framework behavior on a realistic network rather than as precise predictions for a specific future event. Each of these limitations represents a direction for future research, as discussed in the following section.
Conclusion and Future Research
Hurricane evacuation planning faces a fundamental tension: the road network that enables mass departure is also the system most likely to fail under the demand it generates. This paper contributes to addressing that tension by developing a congestion-aware, equity-constrained optimization framework for bus-based evacuation, demonstrated on a realistic case study of Charleston County, South Carolina. The framework integrates rolling-horizon column generation with a traffic equilibrium feedback loop, enabling multi-trip bus routing decisions that adapt to evolving congestion across a 72 h planning horizon.
The central finding is not a number but a structural insight: static planning is not merely suboptimal; it is categorically unreliable. A plan that appears to evacuate everyone under free-flow assumptions can strand over 16,000 people when implemented in reality, because the plan itself generates the congestion that invalidates it. Dynamic, congestion-aware optimization does not just improve outcomes; it changes what counts as a feasible plan. A second structural insight concerns equity: the results show that fairness and efficiency are not sharply opposed in the moderate range. Moving from no equity constraint to a moderate threshold of
From a policy perspective, these findings carry direct implications for transit-dependent regions such as New Orleans, Charleston, and similarly constrained coastal cities. Agencies should consider two complementary levers: expanding effective fleet capacity to stay below the 15%–20% transit-dependency tipping point identified here, and adopting equity constraints that guarantee minimum regional coverage without driving the system into congestion collapse. Moderate equity thresholds (ensuring, for example, 50%–70% coverage in all regions) are likely more realistic and politically sustainable than perfect balance, and this framework provides a quantitative basis for having that conversation with stakeholders.
While the framework is not a fully automated operational system, its computational tractability (i.e., 20–35 min per complete scenario) makes it practical as a decision-support tool in two modes: offline pre-event planning to stress-test strategies across hurricane categories, transit-dependency levels, and equity thresholds; and periodic real-time re-optimization during an active evacuation to update bus assignments as conditions evolve. In both modes, the results are intended to inform, not replace, human judgment.
Several research directions follow naturally from the limitations acknowledged in the Limitations section. Stochastic and robust optimization could capture forecast uncertainty and incident-driven capacity losses. Bi-level or equilibrium models could allow routing decisions to interact explicitly with evacuee compliance and departure-time choices. The framework could be extended to jointly optimize bus operations, contraflow strategies, and supporting infrastructure (e.g., fueling, staging, and maintenance depots). Heterogeneous fleet modeling (including ADA paratransit, school buses, and feeder services) would improve both realism and political salience. Finally, formal empirical validation against detector counts, probe-based speed profiles, or trajectory data, in partnership with local emergency management agencies, is the most important next step toward operational deployment.
Footnotes
Authors’ Note
The authors used generative AI tools (Claude Sonnet 4 and Gemini 2.5pro) to assist in drafting and refining portions of this manuscript, including language improvements. All content was reviewed and validated by the authors for accuracy and originality.
Author Contributions
The authors confirm contribution to the paper as follows: study conception and design: M. Samieinasab, R. Batta; data collection: M. Samieinasab; analysis and interpretation of results: M. Samieinasab; draft manuscript preparation: M. Samieinasab, R. Batta. All authors reviewed the results and approved the final version of the manuscript.
Declaration of Conflicting Interests
The authors declared no potential conflicts of interest with respect to the research, authorship, and/or publication of this article.
Funding
The authors received no financial support for the research, authorship, and/or publication of this article.
Data Accessibility Statement
The datasets generated during and/or analyzed during the current study are available from the corresponding author on request.