





Abstract
Background: Osteochondral autografts and allografts have been widely used in the treatment of isolated grade IV articular cartilage lesions of the knee. However, the authors are not aware of any study that has prospectively compared fresh osteochondral autografts to fresh allografts with regard to imaging, biomechanical testing, and histology.
Hypothesis: The imaging, biomechanical properties, and histologic appearance of fresh osteochondral autograft and fresh allo-graft are similar with respect to bony incorporation into host bone, articular cartilage composition, and biomechanical properties.
Study Design: Controlled laboratory study.
Methods: Eighteen adult dogs underwent bilateral knee osteochondral graft implantation after creation of an Outerbridge grade IV cartilage defect. One knee received an autograft, and the contralateral knee received a fresh allograft. Nine dogs were sacrificed at 3 months, and 9 dogs were sacrificed at 6 months. Graft analysis included gross examination, radiographs, magnetic resonance imaging, biomechanical testing, and histology.
Results: Magnetic resonance imaging demonstrated excellent bony incorporation of both autografts and allografts. Biomechanical testing demonstrated no significant difference between autografts versus allografts versus control at 3 or 6 months (P= .36-.91). A post hoc calculation showed 80% power to detect a 30% difference between allograft and control. Histologic examination showed normal cartilage structure for both autografts and allografts.
Conclusion: Fresh osteochondral autograft and fresh allograft tissues are not statistically different with respect to bony incorporation, articular cartilage composition, or biomechanical properties up to 6 months after implantation.
Clinical Relevance: The use of fresh allograft tissue to treat osteochondral defects eliminates morbidity associated with harvesting autograft tissue without compromising the results of the surgical procedure.
Injury to the osteoarticular surface of the knee is common in the active population.23,35 Curl et al 16 noted that 20% of 31 516 knee arthroscopies had modified Outerbridge grade IV articular surface injuries, with 5% being found in patients younger than 40 years. More than one fourth of the patients younger than 40 years with documented grade IV lesions had multiple sites of involvement. Noyes et al 37 noted a 5% to 10% incidence of grade IV articular surface injury in patients with acute hemarthrosis of the knee. The treatment of these articular surface defects has remained a difficult challenge for the orthopaedic surgeon. The natural history of large, focal osteochondral defects is osteoarthritis, and this process is often accelerated in young, active individuals. Because the repair potential of hyaline cartilage is minimal,11,12 multiple treatment options for osteochondral defects exist, including arthroscopic debridement, abrasion arthroplasty, microfracture, autologous chondrocyte implantation, and osteochondral graft transfer. Unfortunately, a paucity of prospective comparative or randomized studies has prevented a consensus on the optimal treatment of these injuries.
Osteochondral autografts used in the treatment of articular cartilage defects in the knee are usually harvested from a nonweightbearing location such as the supracondylar ridge of the femur or the intercondylar notch. Advantages of autografts include no risk of rejection and no risk of disease transmission. However, there is potential morbidity associated with autograft harvesting,1,24,25,47 and harvesting is limited to smaller lesions. Osteochondral allograft plugs circumvent the size limitation and associated morbidity with autograft harvest. Allografts can be harvested from locations that correlate with the defects to be filled to allow for precise matching of the size and contour of the allograft to the surrounding recipient articular surface. Allografts do, however, introduce the potential of disease transmission, and allograft tissue is limited in its availability.
Several studies have been published discussing the outcomes of patients receiving osteochondral allografts for articular surface defects in the knee.3,13-15,33 Many studies have also reported the results of patients who have undergone autograft transplants.14,20,21,27,33 Despite these numerous reports of osteochondral graft implantation, there is a paucity of basic science studies.28,29,31,41,45
The purpose of this study was to prospectively compare fresh osteochondral autograft tissue to fresh osteochondral allograft tissue for the treatment of isolated grade IV articular surface defects using gross examination, imaging, biomechanical testing, and histologic analysis using the canine knee as a model. The null hypothesis was that there is no difference between fresh osteochondral autograft and fresh osteochondral allograft tissue.
Materials and Methods
After approval from our institutional animal care and use committee, 27 adult mongrel dogs of either sex with a mean weight of 25 kg were obtained for the study. The dogs were random-source animals so that any relation between the animals would be minimized. The dogs were housed in facilities that met the American Association for the Accreditation of Laboratory Animal Care guidelines and were allowed at least 48 hours to acclimate to their surroundings before surgery.
Surgical Technique
Three dogs were anesthetized for each surgical procedure (see Figure 1). After induction of a general anesthetic and administration of preoperative antibiotics, the hindlimbs of each animal were shaved about the knee joint. The dogs were laid supine on the operating table and were secured to the table at the trunk and forelimbs. Both hindlimbs were prepared with Betadine and alcohol and draped free using a sterile technique. A medial parapatellar arthrotomy was made, and the medial femoral condyle was exposed. The knee was then flexed to reveal the weightbearing portion of the medial femoral condyle. The dog designated as the “donor dog” had a single 5.5-mm-diameter by 10-mm-deep osteochondral plug removed from the center of the medial femoral condyle of both knees with the use of a tubular chisel (Acufex Microsurgical, Mansfield, Mass). This dog was then euthanized with pentobarbital sodium injection. The remaining 2 dogs served as the “recipient dogs.” For recipient dog 1, a 3.5-mm-diameter by 10-mm-deep osteochondral plug was taken from the center of the medial femoral condyle of the right knee with a tubular chisel and was discarded. From the left knee of the same dog, a 4.5-mm-diameter by 10-mm-deep osteochondral plug was taken using a tubular chisel, and this osteochondral plug was then transferred to the 3.5-mm defect in the right knee and secured in a “press-fit” manner so that the articular surface of the plug was flush with the surrounding native articular cartilage. The 5.5-mm allograft plug taken from the donor dog left knee was then transferred into the 4.5-mm defect in the left knee of recipient dog 1 using the same press-fit technique. The procedure for recipient dog 2 was identical except for the fact that the autograft/allograft limbs had been switched; that is, the allograft plug was placed in the right knee, and the autograft plug was placed in the left knee.
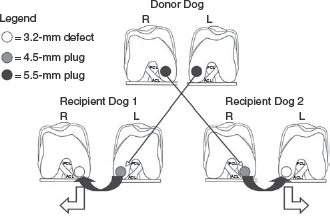
Diagram of the surgical procedure for osteochondral graft transfer. From the medial femoral condyle of each recipient dog, a 3.5-mm defect was made by obtaining a 3.5-mm plug, which was discarded. From the contralateral limb, a 4.5-mm plug was obtained and inserted into the 3.5-mm defect in a press-fit fashion. From the donor dog, 5.5-mm plugs were obtained from both medial femoral condyles. These plugs were inserted in a press-fit fashion into the 4.5-mm defect made by the autograft harvest in the recipient dogs. PCL, posterior cruciate ligament; R, right; L, left.
The arthrotomy wounds were then closed in layers with absorbable suture except for the skin, which was closed with nonabsorbable nylon suture. Before the dogs were awakened, AP and lateral radiographs were obtained of each knee joint. The dogs were then awakened and transferred to recovery pens with heating lamps.
Postoperative Management
Morphine sulfate was administered for immediate postsurgical pain management. Cefalexin (35 mg/kg) was administered orally twice daily for 72 hours postoperatively as antibiotic prophylaxis. Buprenex (0.01 mg/kg) was administered subcutaneously every 12 hours postoperatively for 72 hours for pain relief. The dogs were housed independently and allowed unrestricted activity with immediate weightbearing.
Postoperatively, 9 dogs were euthanized at 3 months, and 9 dogs were euthanized at 6 months with pentobarbital sodium injection. Evaluation of the specimens included gross characteristics, plain radiographic imaging, biomechanical testing, MRI, and histologic analysis.
Gross Analysis
After euthanasia, the hindlimbs were removed, and the original surgical incisions were reopened to expose the surgical sites. Analysis of gross characteristics included noting the general appearance of the cartilage surface of the osteochondral plug (smooth or irregular), the consistency of the articular cartilage (firm or soft), and the color of the articular cartilage compared with the surrounding native articular cartilage (white, slightly yellow, yellow).
Plain Radiographic Analysis
Plain radiographic imaging included AP and lateral radiographs of each knee joint after retrieval after euthanasia. Images were assessed subjectively for the presence of graft incorporation.
Biomechanical Testing
Biomechanical testing of the cartilage was performed in a manner similar to what has been previously published by Jurvelin et al 26 and Rasanen and Messner. 44 The test apparatus consisted of a flat-ended indenter attached to a counterweighted balance. The force imposed by the indenter was controlled by positioning the counterweight and was set at 0.1 N. The force was verified each day of testing with a thin film load cell (model LQB 630, Cooper Instruments & Systems, Warrenton, Va). Displacement of the indenter was measured with a laser (model LB-1001, Keyence Inc, Woodcliff Lake, NJ).
All knees were tested within 4 hours of harvest. The soft tissue surrounding the arthrotomy site was otherwise left intact. In most cases, the soft tissue formed a bowl that acted to contain the physiologic saline solution used to keep the samples moist. The joint was positioned with the test site roughly below the indenter, and the chuck was adjusted so that the test site was perpendicular to the axis of the indenter. The balance arm was then lowered until it was almost in contact with the test cartilage. Displacement data from the laser were collected with a data acquisition board (National Instruments, Austin, Tex) for at least 500 seconds. Test sites included the center of the graft and a control area just proximal to the graft on the medial femoral condyle.
A regression analysis of the displacement versus time graph was performed for each data set. A third-order logarithmic function was used to obtain a 15-second displacement value. Cartilage thickness was measured from histology slides with a calibrated microscope monocle. A 15-second cartilage shear modulus was approximated with the mathematical model developed by Hayes et al 22 with a Poisson ratio of 0.45. The Poisson ratio is a measure of the simultaneous change in elongation and in cross-sectional area within the elastic range during a tensile or compressive test. On completion of biomechanical testing, the knees were frozen and stored until MRI was performed.
Magnetic Resonance Imaging
Before imaging, the knees were thawed to room temperature. Specimens were imaged using a clinical 1.5-T magnet system (Signa Horizon LX, General Electric Health Care, Milwaukee, Wis) and a 3-in, linear, receive-only surface coil. The knee joints were oriented so as to minimize chemical shift misregistration through the femoral condyles. Initial fast spin echo MRIs were obtained in the coronal and sagittal planes using a previously validated pulse sequence 43 with a spatial resolution of 156 μ (in the frequency direction) × 156 μ (in the phase direction) × 1.3 mm. Spin echo T2 relaxation time maps were obtained in the sagittal plane using echo times of 10, 40, and 80 milliseconds; repetition times of 600 milliseconds; field of view of 8 × 6 cm; slice thickness of 2 mm; and at 1 excitation. The T2 mapping was performed to assess the collagen component of the extracellular matrix of the cartilage. 52 The T2 relaxation maps were then reconstructed using a monoexponential fit model to calculate T2 relaxation pixel by pixel (Functool 3.1.10, Advantage Windows Work Station, General Electric Health Care). Direct region-of-interest analysis was performed in the center of the graft and within native cartilage seen on the same slice but not at the interface with the graft.
Images were assessed for (1) signal intensity of the cartilage over the graft and compared with the cartilage over the adjacent condyle using a standardized region of interest analysis on the MRI workstation (Advantage Windows), (2) appearance of the subchondral plate and the articular surface (flush, depressed, proud, or displaced), (3) interface with the adjacent cartilage (smooth, partial-thickness, or full-thickness offset), (4) percentage “fill” of the defect by thirds, (5) trabecular incorporation of the grafts (complete, partial, or poor), (6) signal of bone graft (fat, edema, or fibrosis), and (7) cartilage over the adjacent normal-appearing condyle (measured as a standard reference).
The MRIs were evaluated by a radiologist specializing in musculoskeletal MRI who was blinded to graft type. Morphologic MRI data were correlated to the biomechanical testing and histologic findings. The T2 MRI maps were created and were correlated with histopathologic findings.
Histologic Analysis
The medial femoral condyles were fixed in 10% formalin. Knees were bisected in the sagittal plane through the center of the osteochondral plug, decalcified, and embedded in paraffin. Sections were made at 6-μm increments with the use of a microtome. Representative sections were stained with hematoxylin and eosin to evaluate the structural features of the osteochondral plug. Sections were also stained with safranin O to evaluate the amount of proteoglycan present, a marker of matrix production and indirect marker of chondrocyte viability. The safranin O sections were graded from 0 to 3 according to staining intensity (none, mild, moderate, intense), with intense staining representing normal cartilage.
For statistical analysis of the biomechanical data, Wilcoxon signed rank tests were used with the Bonferroni adjustment for multiple comparisons. The adjustment dictated that the P value was considered statistically significant if it was less than or equal to .0167. For statistical analysis of the quantitative T2 mapping MRI data and safranin O staining data, the Wilcoxon signed rank test was also used. Because no multiple-comparison adjustment was necessary, the P value for this analysis was considered statistically significant if it was less than .05.
Results
All 18 dogs survived the study period. No postoperative wound infections, fractures, or other complications occurred during the study period.
Gross Analysis
Gross examination of the harvested joints revealed normal-appearing anatomy in 35 of 36 knees, with the osteochondral plug cartilage appearing glistening white (Figure 2). One allograft from the 6-month group was noted to have some slight yellowing of the articular surface compared with the surrounding native cartilage. No gross fibrillation or fissuring of the articular surface was noted for autograft or allograft plugs at either time period.
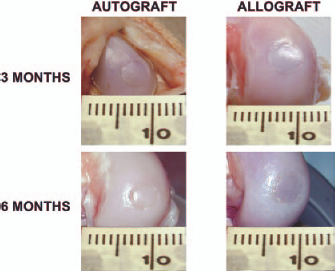
Gross appearance of osteochondral plugs at 3 and 6 months.
Radiographic Analysis
Plain radiographs of all knees revealed no abnormalities and no pathologic joint space narrowing or evidence of loose body formation. Full incorporation on radiographs was noted for all autografts and allografts at 3 and 6 months.
Biomechanical Testing
Nondestructive biomechanical indentation testing of the osteochondral plugs revealed no significant difference in shear modulus between autograft and allograft at 3 months (P = .36) and 6 months (P = .65). Furthermore, no significant difference in shear modulus was observed between autograft and surrounding native cartilage at 3 months (P = .65) and 6 months (P = .99), and no significant difference in shear modulus was noted between allograft and surrounding native cartilage at 3 months (P = .36) and 6 months (P = .91) (Figure 3). A post hoc power calculation revealed that the minimum detectable difference with a statistical power of 80% was 0.4. This represents an approximate 30% difference in graft versus control.
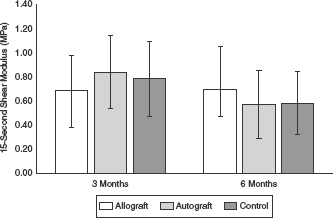
Biomechanical data of osteochondral grafts and control articular cartilage at 3 months and 6 months.
Magnetic Resonance Imaging
Three-Month Autograft
The MRI revealed partial trabecular bony incorporation in 7 of 9 (78%) bone plugs.
Complete incorporation was noted in the remaining 2 specimens. All grafts demonstrated bone marrow edema within the bony substance of the plugs. All graft articular cartilage surface signals were isointense with surrounding native articular cartilage. The graft articular cartilage surface was noted to be flush with the surrounding native articular cartilage in 7 of 9 specimens (78%). One specimen was noted to be depressed, and the remaining specimen was noted to be proud. Seven specimens (78%) had partial- or full-thickness clefts between the graft articular surface and the native articular surface.
Three-Month Allograft
Four of the 9 plugs (44%) revealed partial bony trabecular incorporation. The remaining 5 plugs were completely incorporated. Five of 9 grafts (56%) demonstrated bone marrow edema within the substance of the bone plugs. All graft articular cartilage surfaces were isointense with surrounding native articular cartilage. Six of 9 specimens (67%) were flush with the surrounding native articular cartilage. Two specimens were depressed, and 1 specimen was proud. Eight of the 9 grafts (89%) had partial- or full-thickness clefts between the graft articular surface and the native articular surface.
Six-Month Autograft
Eight of 9 (89%) specimens revealed complete bony trabecular incorporation. No grafts demonstrated bone marrow edema within the plugs. Eight of the 9 plugs were isointense with surrounding native cartilage. Eight of 9 (89%) graft surfaces were flush with the surrounding native articular cartilage. One plug was noted to be depressed. Seven plugs (78%) were found to have a partial- or full-thickness cleft between the graft articular surface and the native articular surface.
Six-Month Allograft
Eight of 9 (89%) specimens revealed complete bony trabecular incorporation. One graft demonstrated bone marrow edema within the plug. All graft articular cartilage surfaces were isointense with surrounding native cartilage. Six of 9 (67%) graft surfaces were flush with the surrounding native articular cartilage. Three plugs were noted to be depressed. Seven plugs (78%) were found to have a partial- or full-thickness cleft between the graft articular surface and the native articular surface.
Overall, good bony incorporation of both autografts and allografts was noted at 3 months (Figure 4) and 6 months (Figure 5), with 16 of 18 grafts appearing completely incorporated at 6 months. Fourteen of 18 grafts (78%) demonstrated bone marrow edema within the grafts at 3 months. Five of these 14 grafts were allografts. One of 18 grafts (6%), an allograft plug, demonstrated bone marrow edema at 6 months. Twenty-nine of 36 plugs (81%) were noted to have a cleft between the graft and host articular surfaces. Quantitative T2 mapping sequences showed no statistically significant difference between autograft and allograft specimens at 3 months (P = .16) or 6 months (P = .74). At the interface of the plugs with the host cartilage, there were discernable areas of prolonged T2 relaxation time.
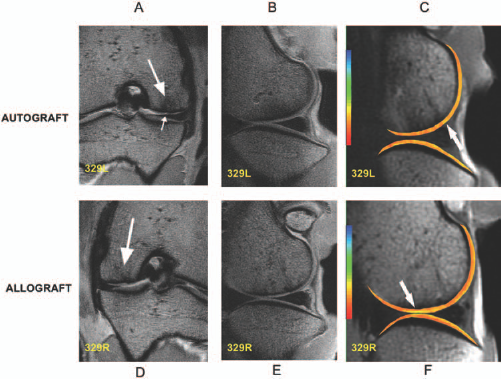
Comparison of osteochondral autograft versus allograft at 3 months. A, coronal fast spin echo MRI demonstrates good incorporation of the autograft bone with mild subchondral sclerosis (long arrow). Note the subtle fissuring at the medial interface (short arrow). B, sagittal fast spin echo MRI demonstrates smooth interface of the subchondral bone, good incorporation of the trabecular bone, and uniform thickness of the articular cartilage. C, subsequent color T2 relaxation map demonstrates moderate uniformity of T2 relaxation values over plug with a small focus of T2 prolongation (yellow focus at arrow) over the posterior interface, indicating that the water is slightly more mobile at the interface with the native cartilage (color scaled to maximum echo time of 150 milliseconds; longer T2 values are in yellow). D, coronal fast spin echo image of the allograft demonstrates mild subchondral bony remodeling but good incorporation of the graft (arrow). E, subsequent sagittal fast spin echo MRI also discloses good incorporation of the graft with a smooth interface of the subchondral bone. F, color map of quantitative T2 relaxation times demonstrates some T2 prolongation at the anterior interface (arrow) and in the overlying cartilage immediately adjacent to the graft (color scaled to maximum echo time of 150 milliseconds; longer T2 values are in yellow). Note the mild stratification of T2 across the tibial cartilage, which reflects the normal collagen alignment, with prolonged T2 in the transitional zone, where water is more mobile.
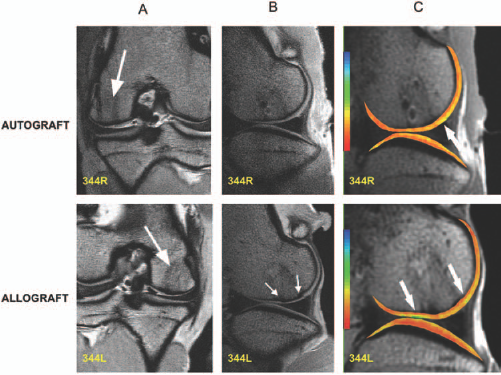
Magnetic resonance imaging appearance of osteochondral grafts at 6 months. A, coronal fast spin echo MRI of the autograft demonstrates good incorporation of the trabecular bone (arrow). B, similar findings are noted on the sagittal MRI with uniform thickness in the appearance of the articular cartilage. C, T2 relaxation color map discloses uniform appearance of the articular cartilage over the graft with prolongation of T2 in the superficial cartilage over the posterior interface (arrow; color scaled to maximum echo time of 150 milliseconds; longer T2 values are in yellow). Also, note the apparent stratification of T2 over the tibial plateau. D, coronal fast spin echo MRI of the allograft demonstrates good incorporation of the bone with mild subchondral remodeling at the medial interface (arrow). E, sagittal MRI discloses a slightly proud appearance of the subchondral bone of the graft (arrows). F, subsequent T2 color map also discloses uniform appearance of the T2 values across the repair site with prolongation over the anterior and posterior interfaces (arrows; color scaled to maximum echo time of 150 milliseconds; longer T2 values are in yellow to green).
Histologic Analysis
Three-Month Autograft
All plugs demonstrated normal-appearing hyaline cartilage. Seventy-eight percent of specimens had intense safranin O uptake, and 100% of specimens had either intense or moderate safranin O uptake. Morphologic appearance of the chondrocytes in lacunae was unremarkable. No fibrillation was noted at the graft surface or host-graft interface.
Three-Month Allograft
All plugs demonstrated normal-appearing hyaline cartilage. Seventy-eight percent of specimens had intense safranin O uptake, and 89% of specimens had either intense or moderate safranin O uptake. There was no significant difference in staining characteristics between autograft and allograft plugs at 3 months (P = .99). Chondrocytes were noted in lacunae and were comparable in number to autograft plugs. No fibrillation was noted at the graft surface or host-graft interface (Figure 6).
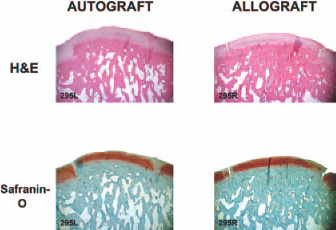
Histologic appearance of osteochondral plugs at 3 months. Note articular surface clefts between host cartilage and plug cartilage. Magnification, ×20.
Six-Month Autograft
All plugs demonstrated normal-appearing hyaline cartilage. Seventy-eight percent of specimens had intense safranin O uptake, and 89% of specimens had either intense or moderate safranin O uptake. Chondrocytes were present in lacunae. No fibrillation was noted at the graft surface or host-graft interface.
Six-Month Allograft
All plugs demonstrated normal-appearing hyaline cartilage. Sixty-seven percent of specimens had intense safranin O uptake, and 89% of specimens had either intense or moderate safranin O uptake. No significant difference in staining characteristics was noted between autograft and allograft plugs at 6 months (P = .38). Chondrocytes were seen in lacunae and were comparable in number to autograft plugs. No fibrillation was noted at the graft surface or host-graft interface (Figure 7).
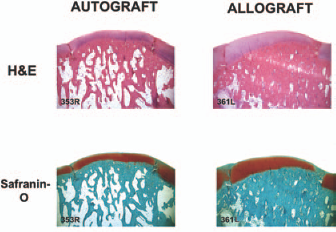
Histologic appearance of osteochondral plugs at 6 months. Note articular surface clefts between host cartilage and plug cartilage. Magnification, ×20.
Despite excellent incorporation of graft subchondral bone to native bone, 90% of knees (both autograft and allograft) showed a cleft between host and graft articular surfaces. The remaining 10% of knees filled the clefts with fibrous tissue.
Discussion
Articular cartilage has a limited inherent capacity to regenerate. Innate reparative mechanisms usually lead to the production of type I fibrocartilage instead of the native type II hyaline cartilage. Multiple studies have shown that the repair cartilage that forms as a result of articular injury has a different structure than does hyaline cartilage and has inferior mechanical properties and wear characteristics. 10 12 There is a paucity of published prospective, randomized controlled studies in humans comparing the outcomes of the various treatment options for articular injuries. As a result, no single treatment has been shown to provide superior results, and each technique is frequently practiced.
Several treatments of isolated cartilage defects have been studied in various animal models, including autogenous cancellous bone, 48 exogenous fibrin clot, 40 abrasion arthroplasty, 34 microfracture,6,34 and chondrocyte implantation.6-9,19,36 These studies produced results that have varied widely with respect to defect filling and the type of repair tissue produced. Animal studies investigating the use of osteochondral plugs have also had mixed results.29,31,38,41,45
In the current study, we attempted to compare the use of fresh, single osteochondral autograft and fresh allograft plugs for the treatment of isolated grade IV osteochondral defects created on the weightbearing portion of the medial femoral condyle in a canine model. On gross inspection, we found no difference between autograft and allograft specimens with the exception of 1 slightly discolored allograft at 6 months. No difference between autograft and allograft specimens was noted on conventional radiographic examination. The MRI evaluation demonstrated progressive incorporation of the grafts with 1 allograft demonstrating a persistent bone marrow edema pattern at 6 months, possibly reflecting prolongation of the creeping substitution of plug bone with host bone. As creeping substitution of the subchondral graft bone with native bone takes place, the bone marrow edema should subside. This is consistent with our findings of only 1 allograft plug demonstrating edema at 6 months, compared with 5 allograft plugs demonstrating an edema pattern at 3 months. Nine autograft specimens demonstrated edema at 3 months, but no autograft specimens demonstrated edema at 6 months. It is important to remember that a bone marrow edema pattern on MRI does not necessarily imply an increase in marrow water content but rather that regional water has been made more mobile, which is likely reflective of the remodeling process after graft placement.
Quantitative T2 mapping techniques provide a unique, noninvasive method of evaluating the collagen orientation of articular cartilage. Using this technique, degenerative changes in the matrix of the articular cartilage can be observed well before changes such as joint space narrowing are seen on plain radiographs. The stratification of T2 reflects the higher order of the collagen in the radial zone, where water is more restricted and T2 relaxation times are thus shorter, compared with the longer T2 times noted over the transitional zone, where the collagen is more randomly oriented and there is increased mobility of water. At clinical field strengths, the superficial zone is not visualized, particularly in this animal model with relatively thin cartilage. We noted no statistically significant difference between autograft and allograft specimens at the 3-month or 6-month time period. This would suggest that maintenance of the collagen architecture within the autograft and allograft articular cartilage is similar.
Nondestructive biomechanical testing revealed no significant difference between autograft and allograft at the 3- or 6-month time period. Furthermore, we found no significant difference between the biomechanical properties of either autograft or allograft and the native articular cartilage at the 3- or 6-month time period. Oates et al 38 reported similar findings at 3 months in a canine model. Although chondrocyte viability was not directly assessed, this would indicate that the chondrocytes in the plugs were able to produce the extracellular matrix, which gives the articular cartilage its viscoelastic properties.
No difference was noted between autograft and allograft specimens at either time period with respect to the appearance of the articular cartilage, the number of chondrocytes in lacunae, the amount of proteoglycan present, and the incorporation of subchondral graft bone with surrounding host bone. The study by Oates et al 38 demonstrated significantly less glycosaminoglycan in fresh osteochondral autograft tissue compared with control tissue and fresh osteochondral allograft tissue. No difference was noted between autograft and stored allograft tissue.
Interestingly, a persistent cleft was noted at the interface of the articular surfaces of the graft and host in 90% of all histologic specimens, although the subchondral bone was well incorporated. This region was commonly associated with prolonged T2 relaxation times at the graft-host interface on MRI. Similar clefts were seen in previous osteochondral graft studies involving dogs, 38 goats, 29 and sheep. 45 The presence of the persistent gap between host and graft articular surfaces in the present study and previous studies is evidence that articular cartilage is unable to regenerate across a physical gap.
Our research had several strengths. We directly compared fresh osteochondral autograft plugs with fresh allograft plugs using MRI to evaluate the bony incorporation of the osteochondral plug and to assess the matrix integrity of the overlying articular surface using a validated cartilage-sensitive pulse sequence 43 and quantitative T2 mapping techniques. The MRI sequences used in this study are extremely useful in assessing the integrity of the articular cartilage. The data obtained by the use of the MRI sequences in this study lend strong support to the results obtained by the biomechanical and histological analyses, which showed no statistical difference between autograft and fresh allograft osteochondral plugs. We used a canine model for this study, which has been shown in prior studies to closely resemble humans with respect to the healing response of articular surface injuries.46,49 In addition, canine femoral condyles have an articular cartilage thickness (around 1 mm) that more closely approximates the thickness of the human femoral condyle (3-4 mm) compared with other animal models with thinner articular cartilage that have been used to study osteochondral graft transplantation.
This study also had a few weaknesses. First, we did not use a control group to show the effects of a grade IV defect that was left untreated. Historic controls from previous studies using a canine model revealed that untreated defects filled with type I fibrocartilage. 40 It was thought that control lesions of this size would incapacitate the dogs and would be unethical. Second, the nondestructive biomechanical testing was performed on host cartilage that was just proximal to the graft cartilage. A better comparison would have been to perform the biomechanical testing on the native cartilage at a site more distant from the graft site to avoid the potential effect of the host's response to the graft on the biomechanical properties of the host cartilage. Another potential weakness was the nonrandomized sizes of the osteochondral plugs. The allograft plugs (5.5 mm) were 1 mm larger in diameter than the autograft plugs (4.5 mm). If stress is force divided by cross-sectional area, and the grafts are considered to be solid and under a uniformly distributed load, then each graft received the same induced stress regardless of size. If, however, the knee is not under a uniformly distributed load, then the stresses borne by the individual grafts would be different. Every attempt was made to place the grafts in the center of the medial femoral condyle of the flexed knee and flush with the surrounding articular surface. Certainly, human error would allow the grafts to be placed in slightly different positions. The biomechanical testing involved a load with a very small indenter placed in the center of each graft and, therefore, would not be affected by the size of the graft. A better comparison would have been to alternate the grafts such that there were equal numbers of autografts and allografts of each diameter.
The use of fresh osteochondral allograft tissue could also be considered a potential weakness of the study. This study used fresh osteochondral allograft tissue and represented an idealized situation that may not correlate with the use of fresh-frozen or cryopreserved graft tissue. In a previous study using osteochondral grafts in a canine model, Oates et al 38 reported no significant difference in biomechanical properties between fresh autografts, fresh allografts, and allografts stored in culture medium for 14 days. Truly fresh osteochondral allograft tissue is rarely used clinically because of the risk of disease transmission and logistical problems associated with its use. Allograft chondrocyte viability has been shown to diminish with storage time2,5,51 and preservation technique.32,39,42,50 Results from human studies using fresh osteochondral allograft tissue in the knee have yielded success rates of 53% to 94%.13,15,18,30 Two studies have reported the use of preserved osteochondral allograft tissue in the knee with success rates of 69% and 70%.4,17
Finally, the results presented in the current study are for a relatively short follow-up time period. Recently completed research is being analyzed to determine if any differences between osteochondral autograft and fresh osteochondral allograft plugs exist at longer follow-up.
Because articular surface injuries are common in the young, athletic population, and these injuries have no inherent capacity to heal, treatment is warranted to relieve pain and prevent further damage. Transplantation of an intact unit of articular cartilage with its underlying subchondral bone allows for restoration of the joint surface with articular cartilage and circumvents many problems associated with other repair/resurfacing techniques. Furthermore, the use of allograft tissue to treat these injuries would eliminate the morbidity associated with an autograft harvest and would allow for precise matching of graft contour with the defect to be treated. Our data in a canine model reveal no difference between fresh autograft and allograft osteochondral plugs for the treatment of isolated grade IV articular surface injuries with respect to gross appearance, radiographic imaging (including plain radiographs and MRI), biomechanical testing, and histologic analysis.
In summary, we have attempted to compare fresh osteochondral autograft and allograft tissue for the treatment of full-thickness (Outerbridge grade IV) articular surface defects in a canine knee model. Using a reproducible surgical technique, we found equal numbers of normal-appearing chondrocytes and excellent subchondral bony incorporation of both autograft and allograft specimens at 3 and 6 months postoperatively. Furthermore, nondestructive biomechanical testing revealed no significant difference between autograft and allograft cartilage or allograft and native cartilage at either time period. Despite subchondral bony incorporation, a persistent cleft existed between native and graft articular surfaces.