
Abstract
High shear stress and turbulence in a miniature axial blood pump are affected by the pump’s blade structure. which impacts the pump’s hemodynamics and hemocompatibility performance. This study designed blades for a miniature axial blood pump via computational fluid dynamics (CFD). The optimal blade angle distribution must improve hemodynamic and hemocompatibility performance under the designed operating conditions (45,000 rpm rotational speed and 3 L/min flow rate). First, the blade inlet angles β1 were varied from −100° to −220°. Second, using the optimal β1, the blade angle distribution was changed by setting different curvatures at different curvature positions. Finally, the relationships among blade angle distribution parameters and hemodynamic, hemolysis, and thrombosis risk were analyzed. The results indicated that angle distribution should avoid positive curvature, and that “the absolute value of negative curvature percentage should increase progressively with the increasing of curvature position.” Compared with the original impeller, the CFD and experimental results revealed an optimized impeller with a 17.4% increase in pressure head, a 2.1% increase in hydraulic efficiency, an 8.4% decrease in hemolysis index, and a 5.3% decrease in volume-averaged scaled activated platelet concentration. CFD-guided blade angle optimization can improve the hemodynamic and hemocompatibility performance of miniature axial blood pumps.
Keywords
Introduction
Acute heart failure is a clinical disease responsible for millions of hospitalizations annually. 1 Short-term ventricular assist devices are being increasingly used for among patients with acute heart failure, 2 and miniature axial blood pumps are frequently employed as short-term ventricular assist devices for emergency hemodynamic assistance.3,4
Miniature axial blood pumps facilitate minimally invasive intervention in the ventricle, eliminating the need for chest opening and avoiding the associated complications.5,6 Given their diminutive dimensions, these devices offer elevated rotational velocities to provide clinical circulatory support. However, elevated impeller speeds give rise to nonphysiological shear stresses, thereby increasing the likelihood of complications. 7 In addition to the magnitude of the shear stress, hemolysis is associated with prolonged exposure to the high shear stress 8 and turbulence generated by impeller rotation. 9 Thus, optimizing impellers is essential for reducing nonphysiological shear stresses, exposure time, and turbulence. Given the limited number of reports on miniature axial blood pumps, researchers typically use pressure heads and hemolysis to assess blood pump performance.10 –13 Previous studies have evaluated hemolysis (Zhang et al. 10 ), renal perfusion (Chen et al. 11 ), and cardiac output (Wang et al. 12 ) in axial pumps, but blade angle optimization remains understudied. Impeller optimization has been the preferred goal during the blood pump design process,14 –17 and computational fluid dynamics (CFD) has reduced the cycle time and cost of blood pumps. 18 Kohyar et al. 19 selected logarithmic and second-order relationships when designing of the centrifugal blood pump blade angle distribution and reported that the best performance was achieved by designing the blade angle distribution as a logarithmic relationship. Zhu et al. 20 optimized the original blades by increasing the blade rotation angle and decreasing the outlet angle; the flow field of the optimized blades had almost no backflow. These studies revealed that an optimized blade design positively influences blood pump performance. However, the blade angle distribution is key impeller design parameter, and its influence on hemodynamic and hemocompatibility performance remains unclear.
This work innovatively and comprehensively explores the effects of vane angle distribution on the hemodynamic and hemocompatibility performance of a miniature axial-flow blood pump. By systematically tuning the blade inlet angle and curvature distribution and using CFD models to predict hemolysis and thrombosis, we provide a new way to optimize the impeller. By combining CFD simulations and experimental validation, our in-depth study of the relationship between the microaxial blood pump vane geometry and multiple performance dimensions provides new insights and guidance for the field.
Materials and methods
Geometric model of a blood pump
The original impeller was designed with reference to the Impella CP heart pump. When the flow rate of the Impella CP is 4 L/min, the rotational speed approaches to 50,000 rpm and can only be maintained for approximately 5 min. Our design uses these parameters as reference to optimize and address performance issues. Figure 1(a) illustrates the conceptual design of the miniature axial blood pump presented in this work. The blood pump utilizes the original impeller, motor, housing, and diffuser. Under specified operating conditions (designed rotational speed of 45,000 rpm and flow rate of 3 L/min), a pressure head of 90 mmHg is achieved. Figure 1(b) shows that the blade angle distribution of the original impeller exhibits linear variation, and additional impeller dimensions are detailed in Table 1. The blade structure is optimized by modifying the blade angle distribution, which exhibits various patterns along the flow direction from the inlet to the outlet.
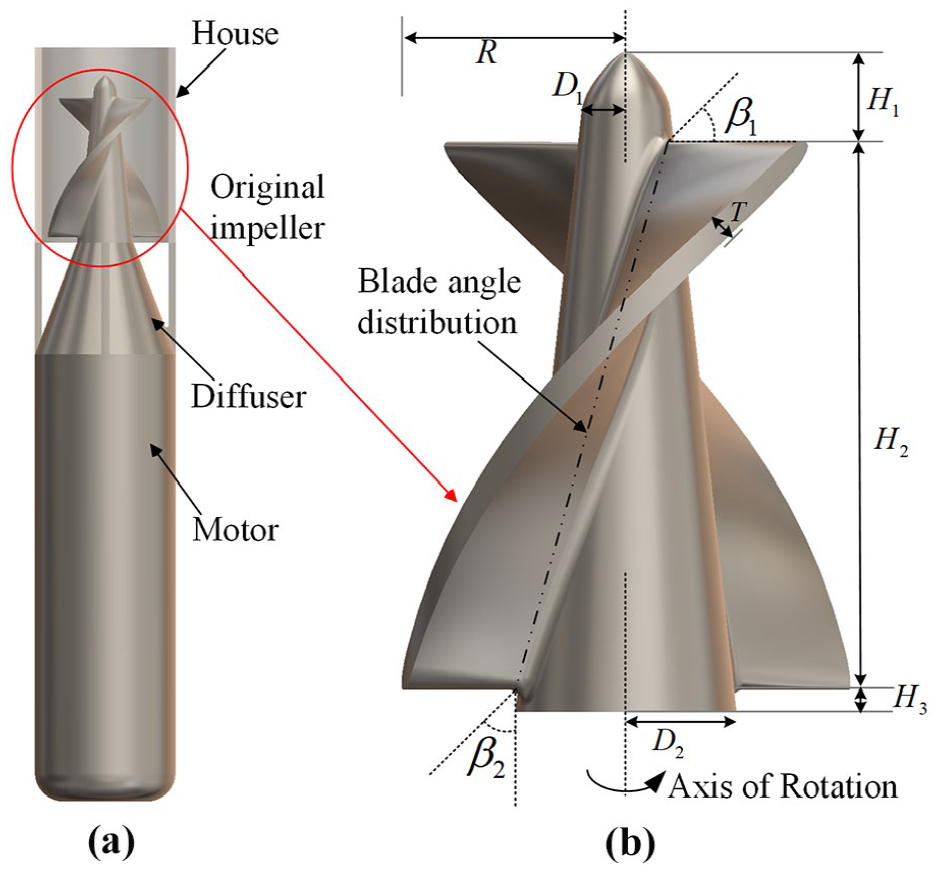
(a) Conceptual design drawing of the miniature axial blood pump and (b) schematic dimensions of the original impeller.
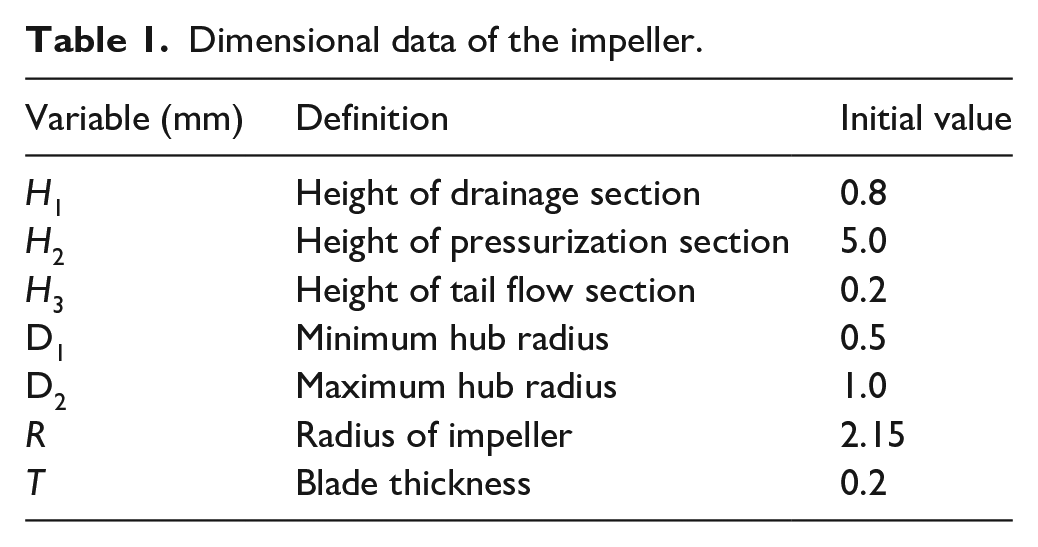
Dimensional data of the impeller.
Blade design methods
The 3D model of the impeller was designed in two steps:
(1) The blade outlet angle β2 is fixed to −20°, and the blade inlet angle β1 is changed. The design parameter β1 ranges from −100° to −200° with a difference of 20°, that is, −100°, −120°, −140°, −160°, −180°, −200°, and −220°; for details, see Supplemental Material Information S1. β2 was fixed at −20° on the basis of previous studies 20 and preliminary simulations, which demonstrated that this angle provides optimal exit flow characteristics and minimizes recirculation zones.
(2) A method for changing the blade angle β distribution is determined. On the basis of the optimal β1 obtained in step (1), the β distribution is changed as shown in Figure 2.
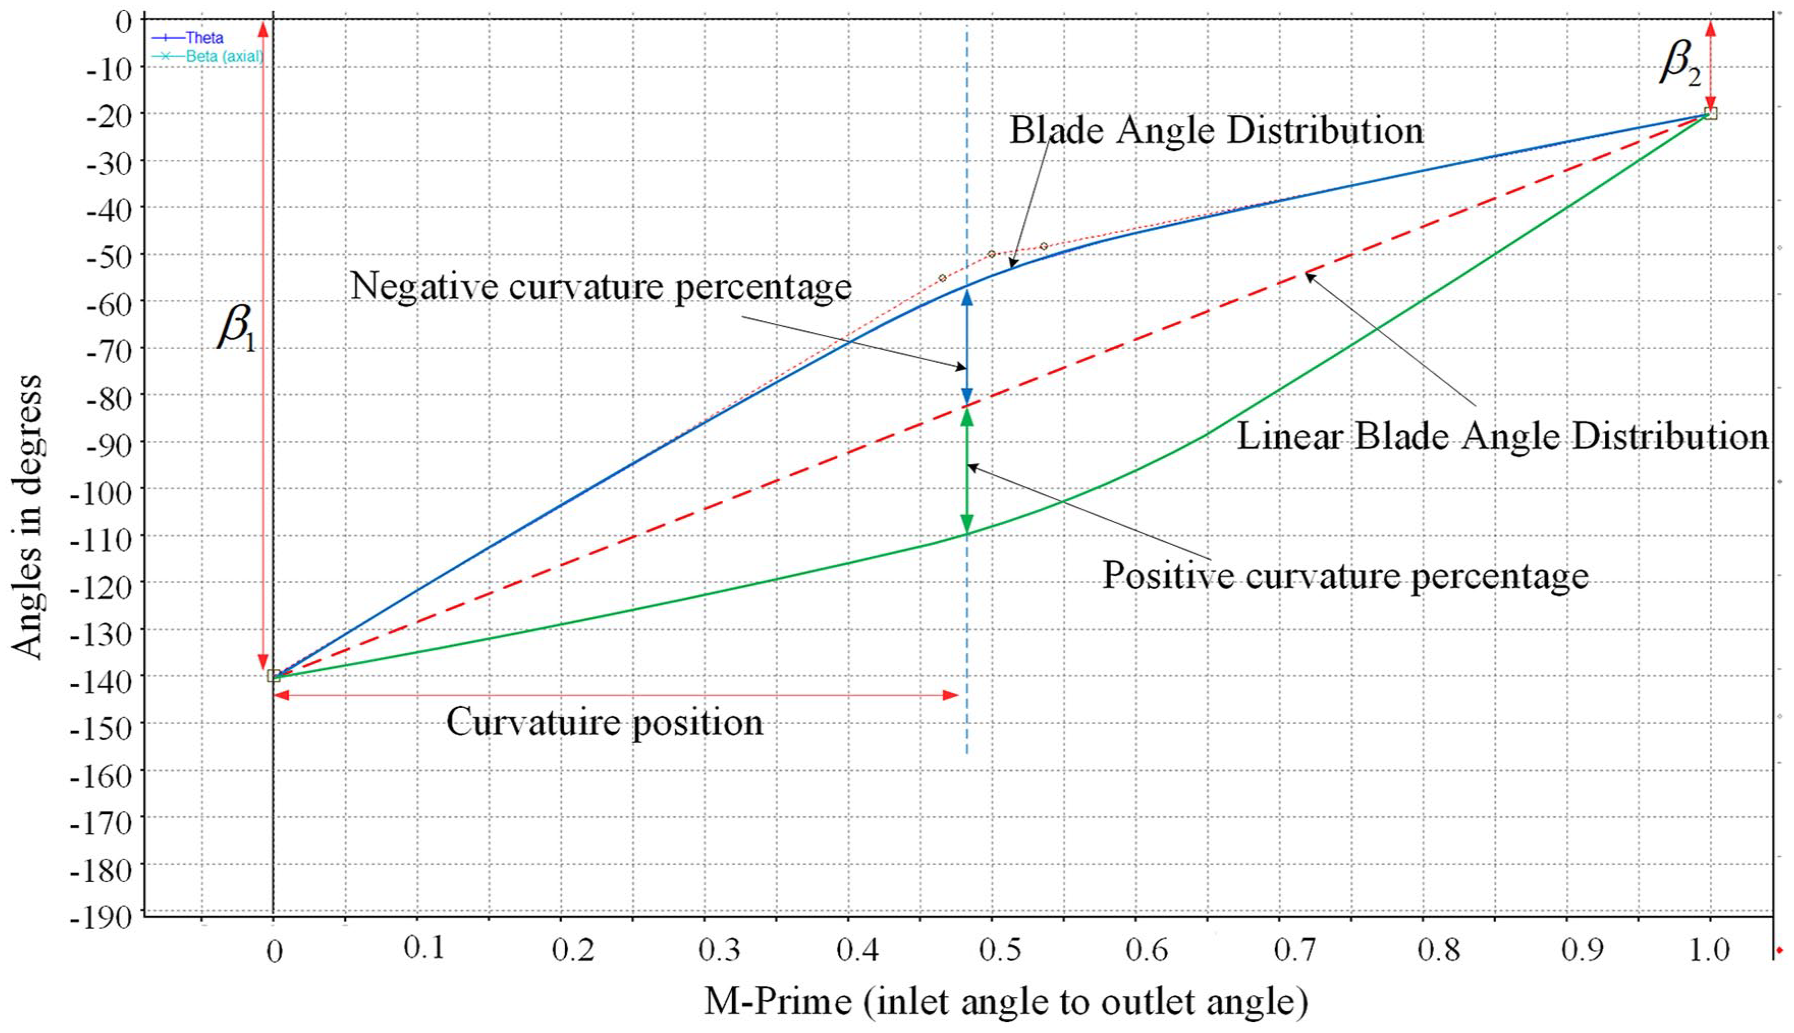
Descriptions of the curvature position and curvature percentage.
M-prime, which denotes a dimensionless parameter for the position of the blade streamline from the leading edge, ranges from 0 to 1, with 0 denoting the position of the inlet angle and 1 denoting the position of the outlet angle. The percentage curvature was defined to quantify the blade angle β downconcave distribution and upconcave distribution. Starting at an M - prime in the linear distribution of β, the angle is increased by a certain percentage to form a concave distribution (positive curvature percentage); then, again starting at an M - prime in the linear distribution of β, the angle was decreased by a certain percentage to form a concave distribution (negative curvature percentage).
Figure 2 depicts various terms such as the positive curvature percentage, negative curvature percentage, curvature position (M-prime), inlet angle (β1), and outlet angle (β2). Since each curvature position is the same at a curvature percentage of 0%, when nine curvature positions (0.1, 0.2, 0.3, 0.4, 0.5, 0.6, 0.7, 0.8, and 0.9) are designed with seven curvature percentages (−40%, −30%, −20%, −10%, 0%, 10%, and 20%), a total of 55 blade shapes are obtained. Details are provided in Supplemental Material Information S2.
Hemolysis model
In this study, hemolysis analysis of the blood pump is evaluated via the hemolysis index (HI), which is related to shear stress. The empirical hemolysis model developed by Hariharan et al. 21 was adopted, and the shear stress vector obtained from the CFD simulation flow field was converted to a scalar shear stress via the following expression:
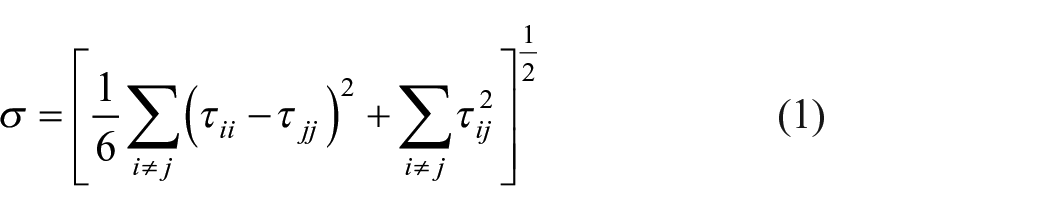
where τij is the Cartesian component of the shear stress.
The HI was calculated by solving the Eulerian scalar transport equation:
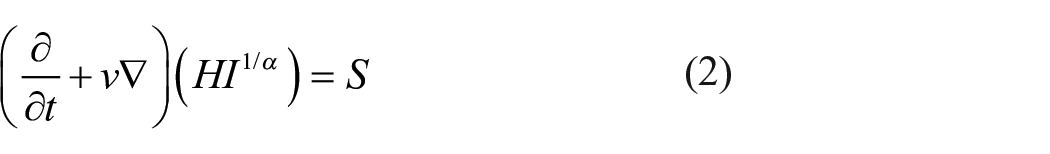
where v is the velocity vector and S is the source term defined as

with constant C = 1.21 × 10⁻⁵, α = 0.747, β = 2.004. 22
The distribution of HI in the pump can be obtained by solving the above scalar transport equation during CFD simulation. During this process, the inlet boundary condition for HI was set to zero. In addition, the mass-weighted average of the HI values at the pump outlet was considered the final hemolytic performance.
Thrombosis model
The thrombosis model used in this study is based on the thrombus model proposed by Taylor et al., 23 which uses three convective diffusion equations to describe the transport of substances from activated platelets (APs), nonactivated platelets (NAPs), and adenosine diphosphate (ADP).

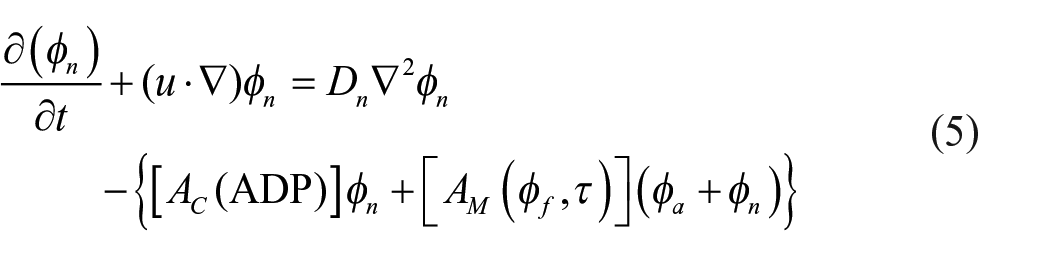
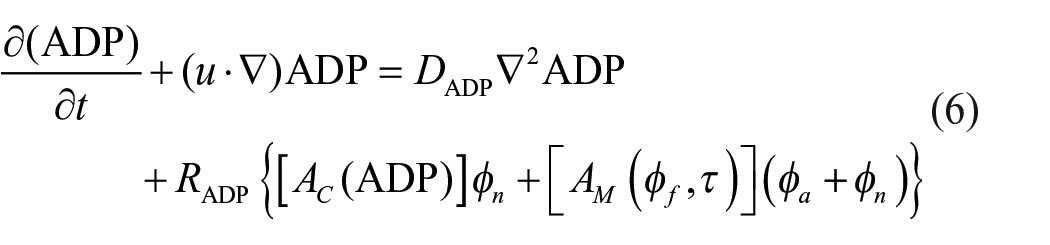
where Da is the diffusion coefficient of APs, Dn is the diffusion coefficient of NAPs, DADP is the diffusion coefficient of ADP, AM is mechanical activation, AC is chemical activation, and RADP is the amount of ADP contained in platelets.
Platelet activation can occur through mechanical cues on the basis of a power-law model of shear stress, as shown in equation (7). Alternatively, it can occur through chemical cues of threshold-based activation, which are triggered by the ADP concentration, as outlined in equation (8).
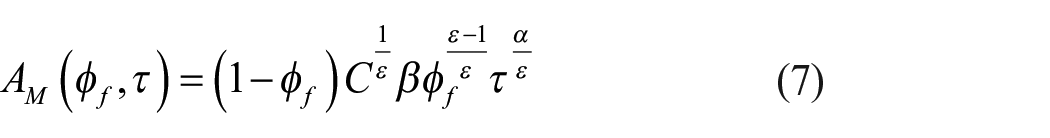
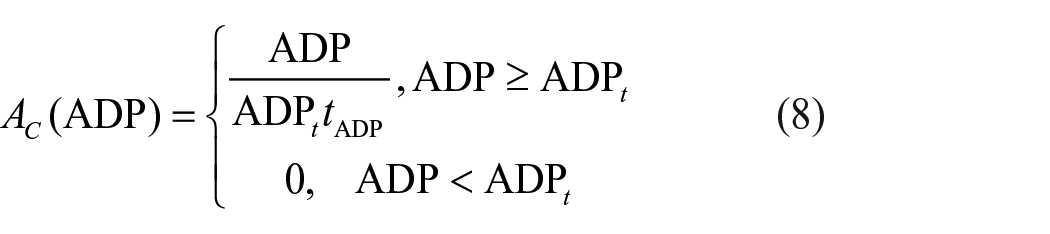
where ϕf is the ratio of activated platelets to total platelet count. α, Ɛ, and C are power-law model parameters from the literature. 24 ADP t , represents the threshold for chemical platelet activation, whereas the characteristic time of the platelet activation rate is represented by tADP. τ is the scale shear stress. ϭij is the individual component of the shear stress tensor. Mechanical and chemical cues are added to determine the platelet activation rate. The platelet activation rate NAR is a source component in the corresponding convection-diffusion equation.


The AP value is considered a model output and represents a thrombotic risk. To improve readability, thrombotic risk is characterized by the scaled AP concentration. The scaled AP concentration is the increase per cubic millimeter compared with the initial value of 2.5 × 10¹³ m−3.
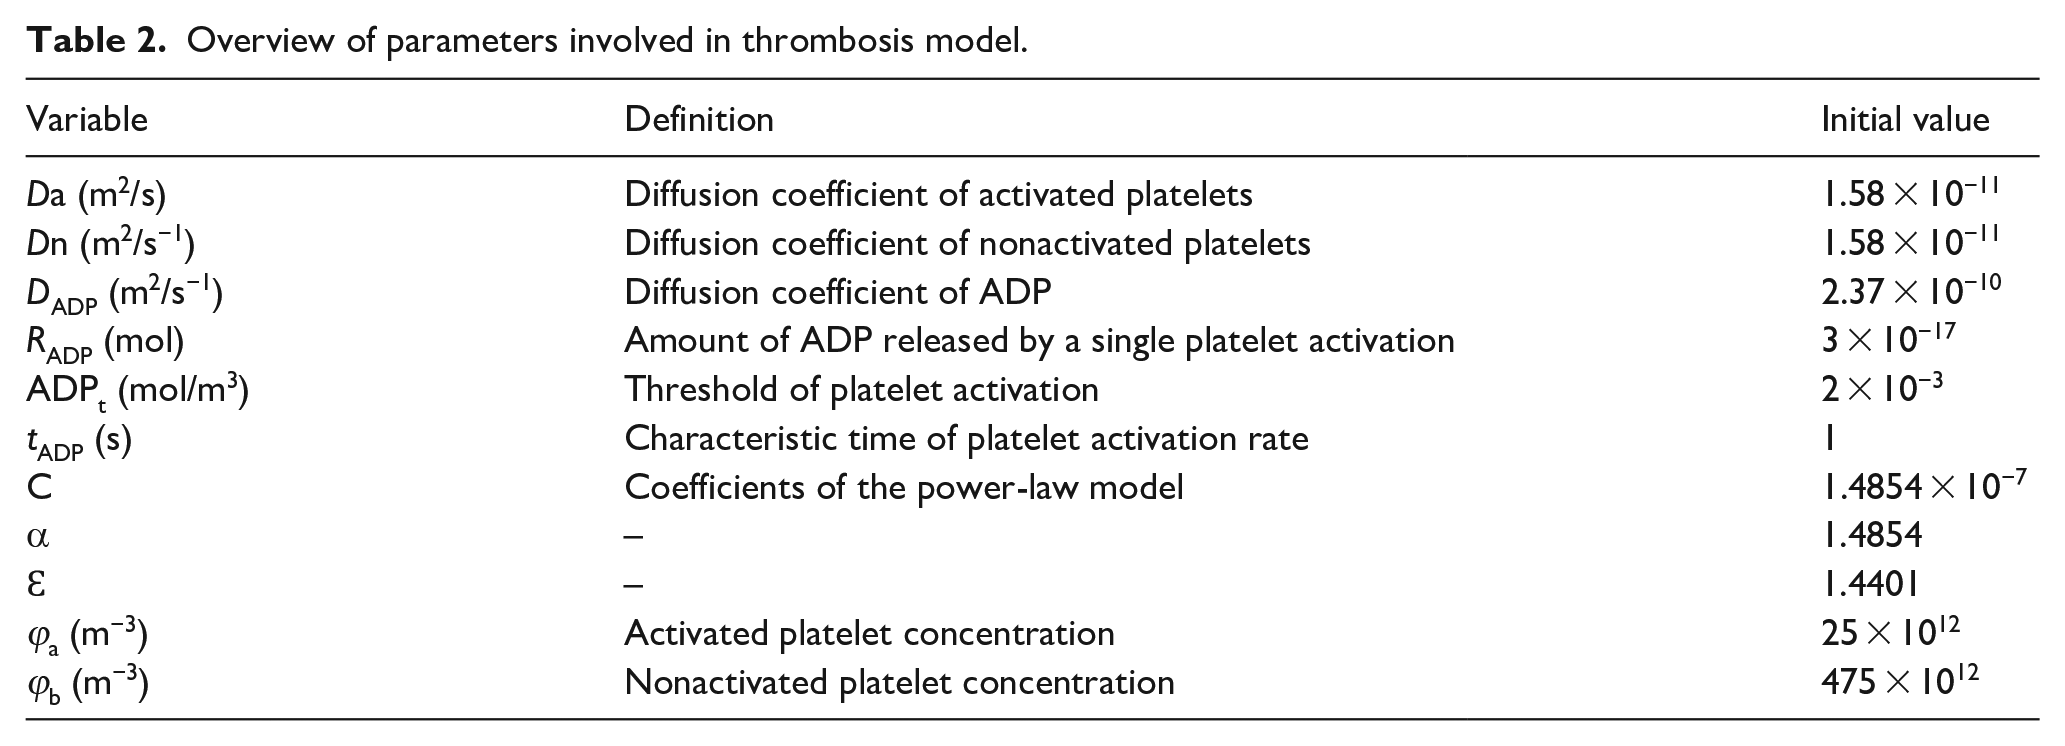
The symbols, definitions, and initial values of the formulas used in the thrombosis model are given in Table 2 (see Blum et al. 25 for details).
Overview of parameters involved in thrombosis model.
CFD analysis setup
According to the actual state of the blood pump, the rotating and static domains of the blood pump are separated to form three separate regions with different settings. The computational domain of the blood pump is shown in Figure 3(a), and the three computational domains are the inlet domain, impeller domain, and outlet domain. The pump geometry is automatically meshed using the ANSYS 2020 R2 meshing tool (ANSYS Inc., Canonsburg, USA).
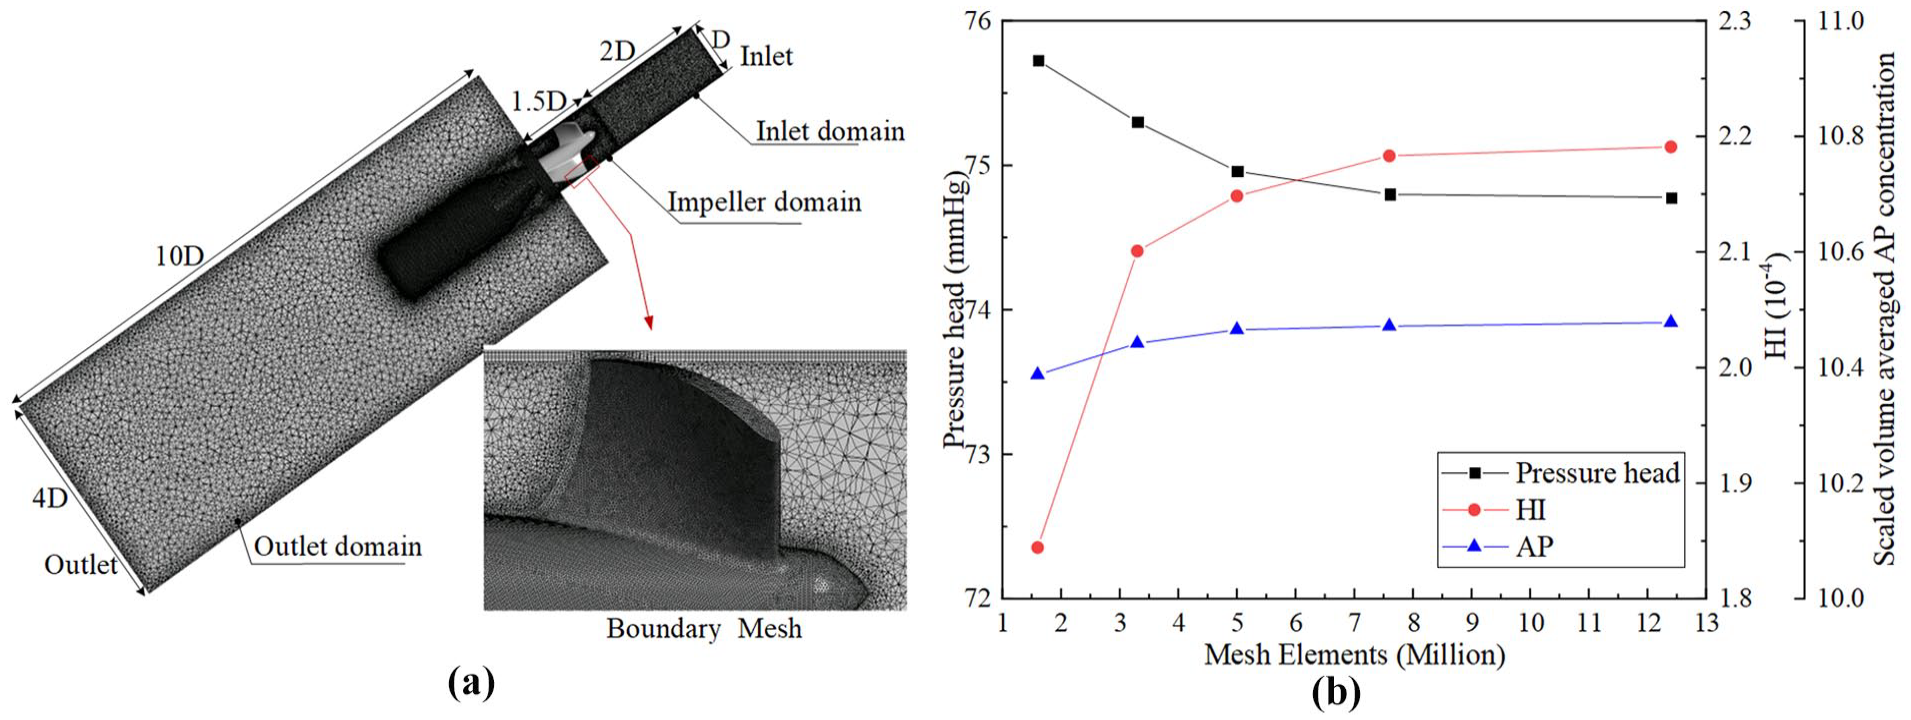
Computational domain setting and validation of CFD mesh independence: (a) schematic diagram of the blood pump mesh (D = 4.5 mm) and (b) changes to the pressure head, HI, and AP.
The working fluid in the axial blood pump was assumed to be incompressible, turbulent, and Newtonian. The blood’s density was 1055 kg/m3 and the dynamic viscosity was 0.0035 kg/(ms) . 26 A steady-state model is chosen for numerical simulation in the computational domain and a multireference model is used to set the rotational region and rotational velocity. The SST k–ω turbulence model is used. To satisfy the turbulence model requirements, wall boundary layer meshing is performed on the impeller and casing walls, and the Y+ value is presented in Supplemental Material Information S3. The convergence accuracy is set to 10−4. The rotational speed of the impeller is 45,000 rpm. The boundary conditions are set as follows: a mass flow rate of 3 L/min for the inlet, and the inlet fluid was set at a temperature of 37°C with a turbulent intensity of 5%; a static initial pressure of 120 mmHg at the outlet and considered to be in a fully developed flow condition. The pressure head, hydraulic efficiency, hemolysis index at the outlet, and stability of the volume-averaged scaled AP concentration in each domain are used as termination criteria.
Grid independence validation used the pressure head, hemolysis index, and volume-averaged scaled AP concentration of the impeller domain at a rotational speed of 45,000 rpm and an inlet flow rate of 3 L/min as rating criteria. When the total number of grids increased from 7.6 million to 12.4 million, the pressure head decreased by only 0.03%. Simultaneously, the hemolysis index increased by 0.36%, and the volume-averaged scaled AP concentration of the impeller domain increased by 0.06%. Considering the computational time cost, the total number of grids used in this study was set at 7.6 million. The quality evaluation of the final grid was judged by the grid skewness value, which was less than 0.7 for the total grid.
Experiment validation
The hydraulic performance testing device for the micro - axial blood pump is shown in Figure 4. An ultrasonic flowmeter was used to measure the flow rate. Pressure sensors were installed at the inlet and outlet of the pump. A flow control valve was employed to alter the flow velocity and pressure within the pipeline. Both the flow rate and pressure were collected through relevant controllers.
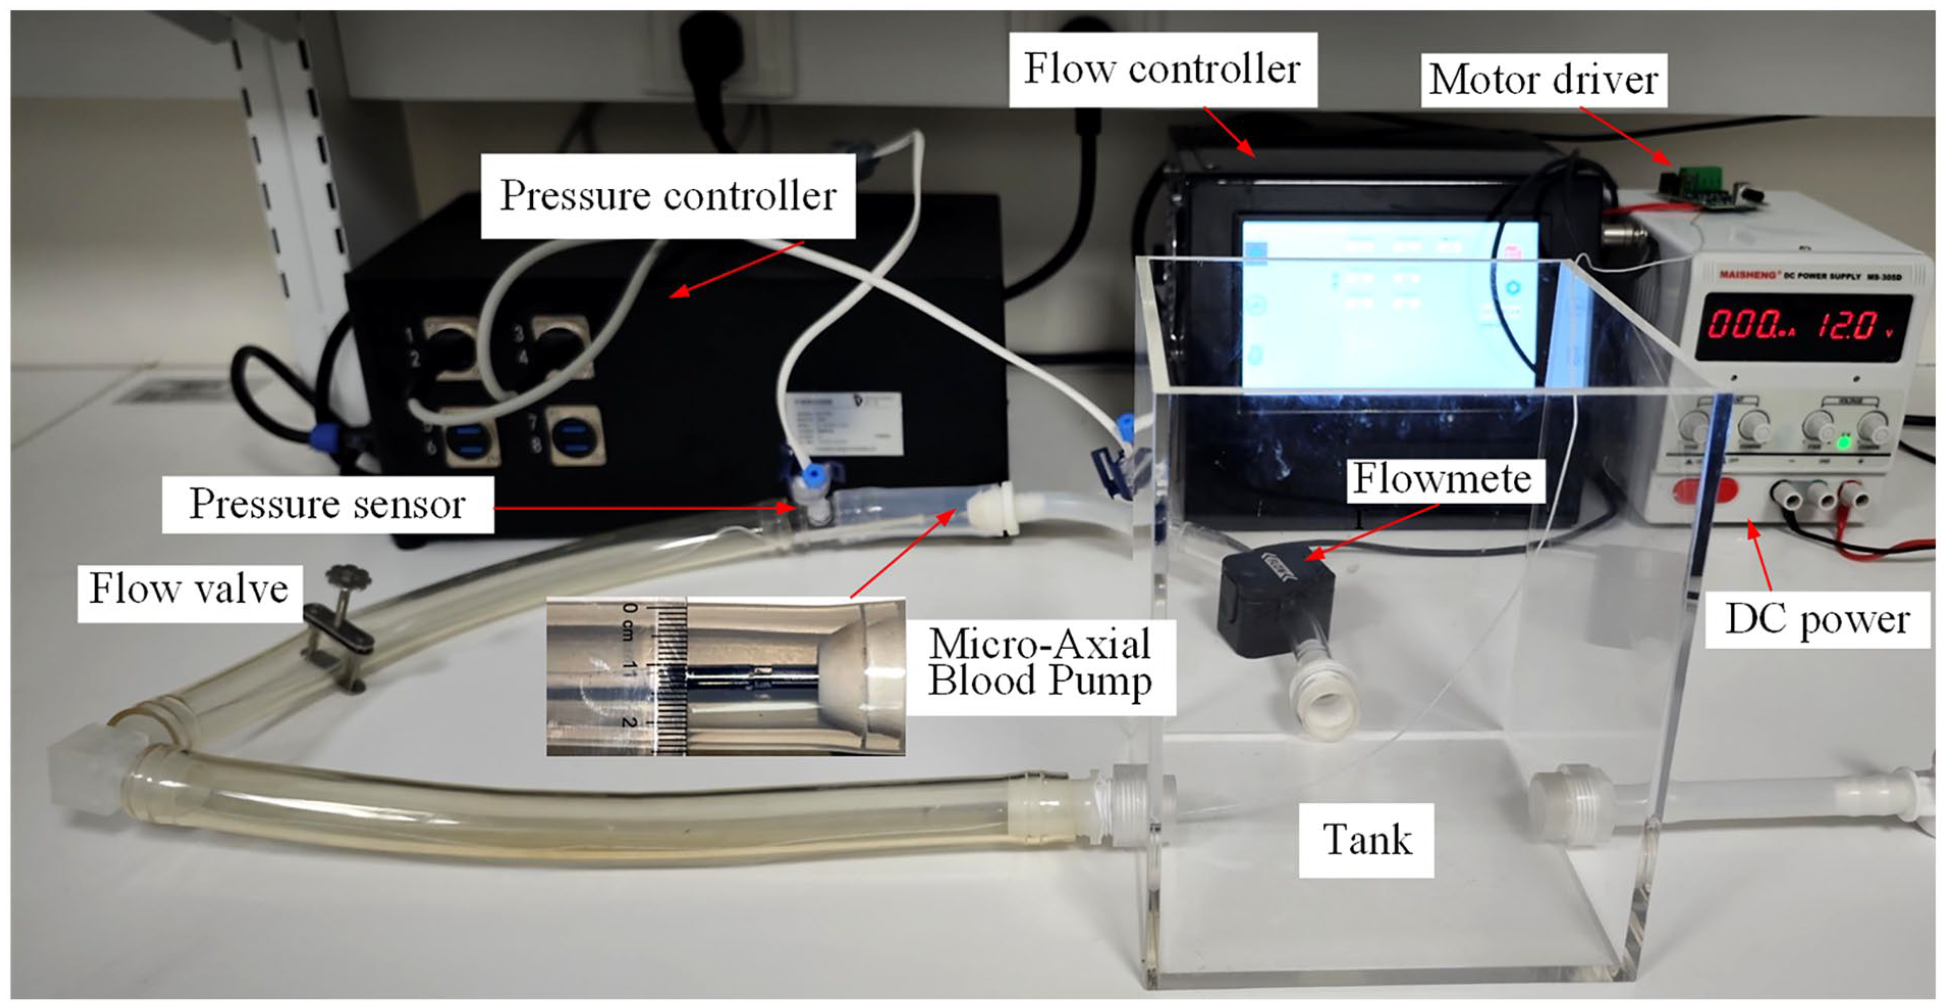
Hydraulic performance testing device for microaxial blood pump.
Results
Selection of the blade angle distribution
The effects of inlet angle β1 on the pressure head and hydraulic efficiency were analyzed under the design conditions. As shown in Figure 5, the pressure head first increased and then decreased as β1 increased. In contrast, the hydraulic efficiency increased with the increasing of β1 and decreased after it reached the peak value at β1 = −200°. The optimal inlet angle β1 of the original blade was selected as −140°.
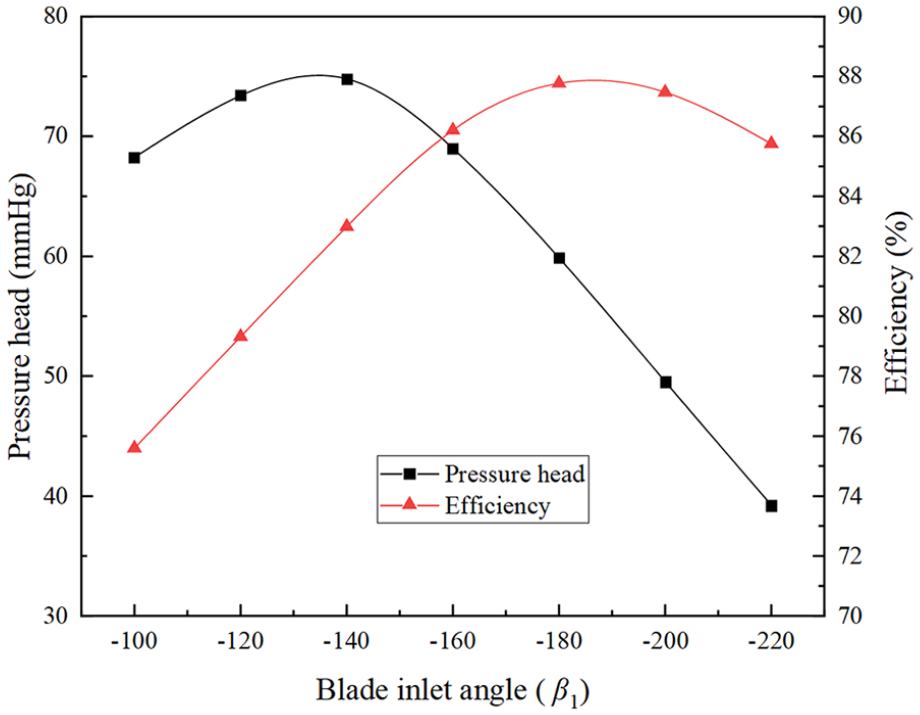
Variation in the pressure head and efficiency.
The geometric dimensions, such as the leading edge, trailing edge, hub, β1, and β2, remained unchanged. However, the blade angle distribution from the leading edge to the trailing edge changed, resulting in 55 blade models. The 55 blade models were simulated to analyze the effects on the pressure head, hemolysis index, and volume-averaged scaled AP concentration in the impeller domain.
Figure 6 shows the relationship between pressure head and curvature percentage based on the variations of blade distribution angles. The minimal pressure head for all curvature positions almost always occurred at the positive curvature percentage, indicating that the blade angle distribution for all curvature positions should avoid the positive curvature percentage. The maximum pressure head increased with increasing curvature position (from the leading edge to the trailing edge), corresponding to the absolute value of negative curvature percentage; for example, curvature positions of 0.3, 0.5, 0.7, and 0.9 obtained the maximum pressure head at curvature percentages of −10%, −20%, −30%, and −40%, respectively.
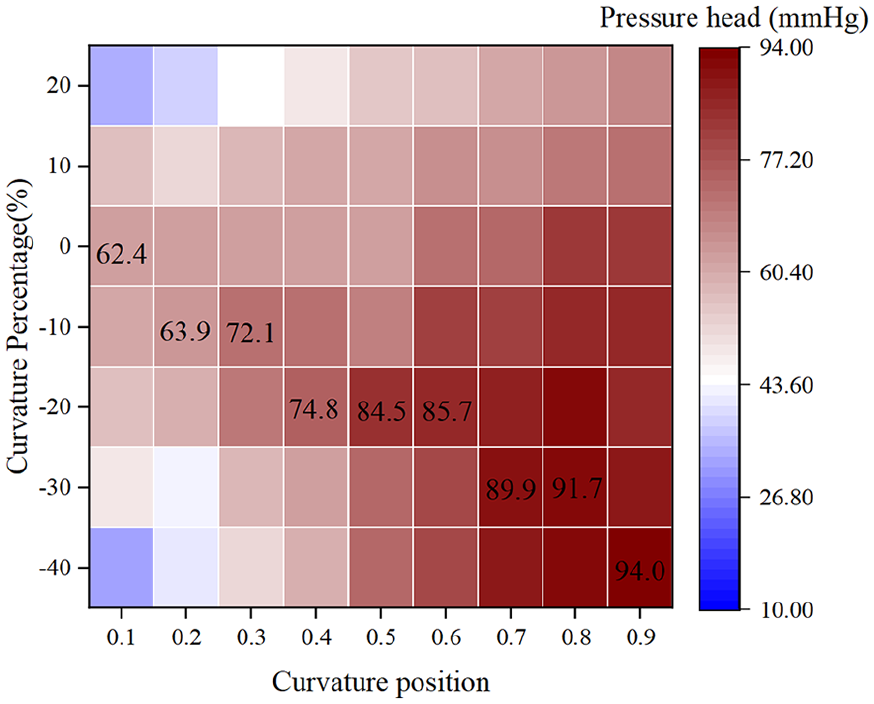
Pressure head versus curvature percentage for all curvature positions.
The hemolysis performance of the pump was represented by the HI calculated via the Eulerian scalar transport equation, and its thrombosis risk was characterized by the volume-averaged scaled AP concentration. Figure 7(a) illustrates the correlation between the HI and curvature percentage across all curvature positions, and the lowest recorded HI value for each position. The HI tends to increase as we move from zero curvature to negative curvature and reaches a maximum at a positive curvature percentage of 20%. The curvature positions of 0.1, 0.2, and 0.3 all have minimum HIs at a −10% curvature percentage, which are 2.537 × 10⁻⁴, 2.546 × 10⁻⁴, and 2.548 × 10⁻⁴, respectively. Curvature positions of 0.5 and 0.6 yield acquire minimum HIs at curvature percentages of −30%, 2.552 × 10⁻⁴, and 2.569 × 10⁻⁴, respectively. The HI tends to decrease and reaches its minimum at a negative curvature percentage of −40% when shifting from zero curvature to negative curvature percentage at curvature positions of 0.7, 0.8, and 0.9, which are 2.553 × 10⁻⁴, 2.602 × 10⁻⁴, and 2.594 × 10⁻⁴, respectively. Figure 7(b) shows the scaled volume averaged AP concentration versus curvature percentage for the impeller domain at all curvature positions, again showing the AP minimum for each curvature position. As the curvature position increases, the absolute value of the negative curvature percentage, which corresponds to the scaled volume-averaged AP concentration minimum in the impeller domain, gradually increases. For example, curvature positions of 0.2, 0.4, 0.6, and 0.8 yield curvature percentages correspond to scaled volume averaged AP concentration minima of 0, −10%, −30%, and −40%, respectively, in the impeller domain.
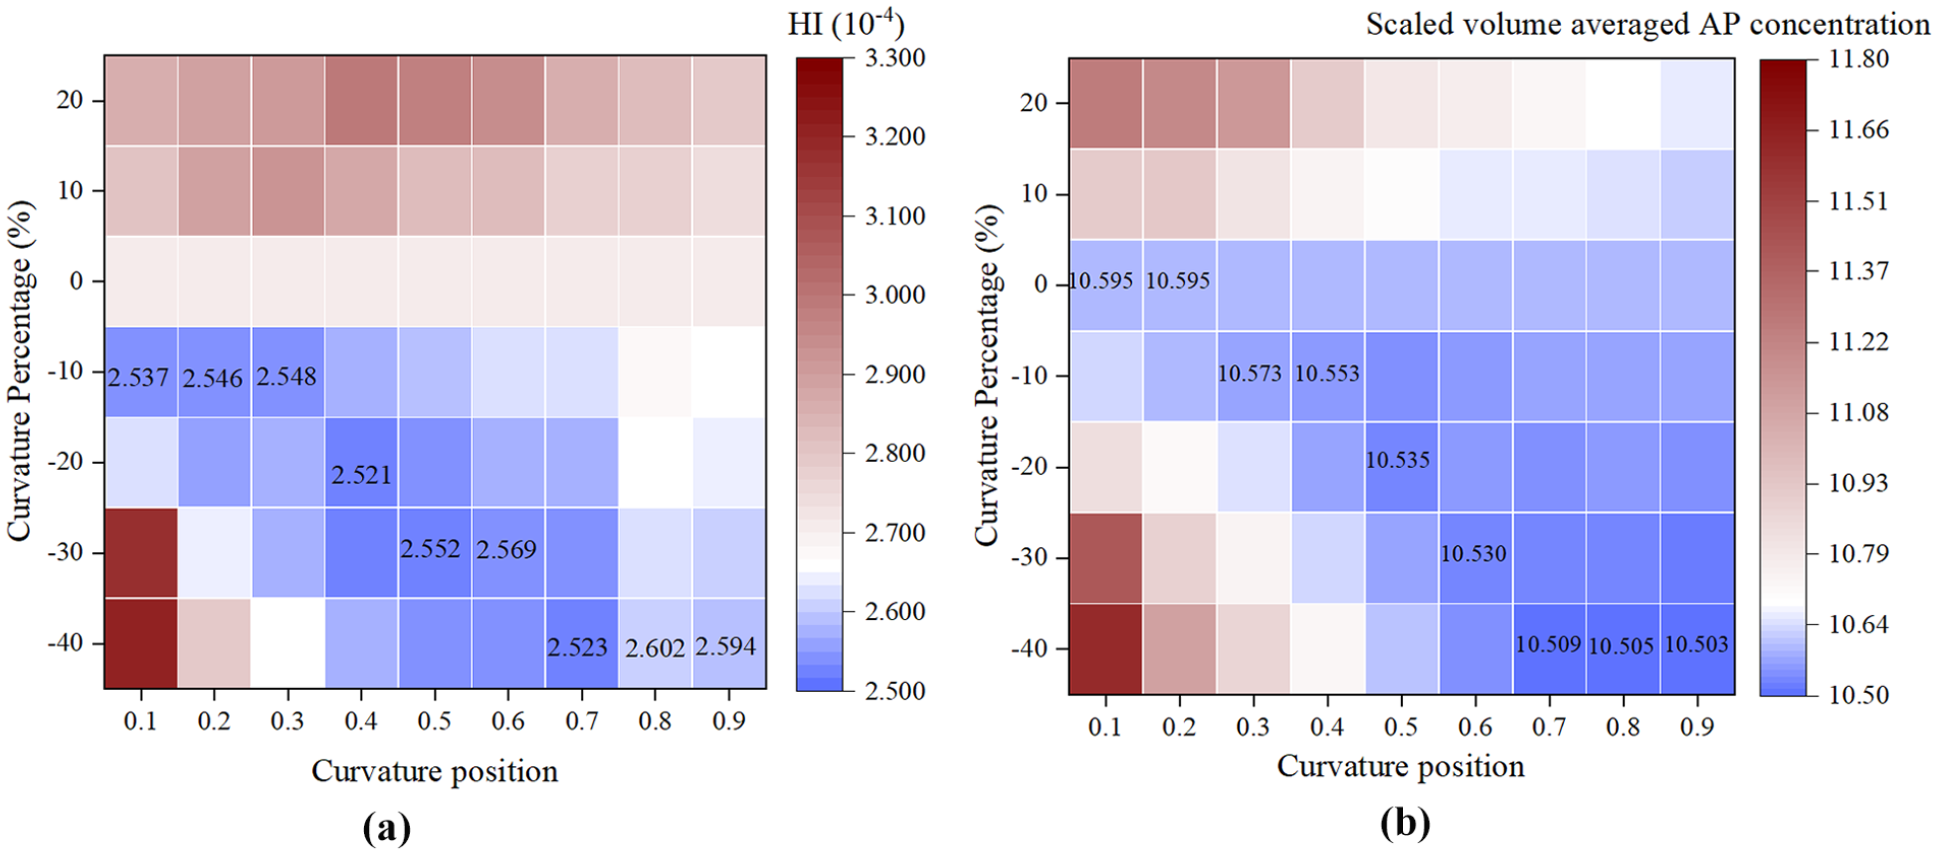
(a) HI versus curvature percentage for all curvature positions and (b) scaled volume-averaged AP concentration in the impeller domain versus curvature percentage for all curvature positions.
We analyzed the effects of curvature percentage changes at all curvature positions in Figures 6 and 7 on the pressure head, hemolysis index and volume-averaged scaled AP concentration in the impeller domain. The following laws can be used: (1) the blade angle distribution should prevent a shift from zero curvature to positive curvature; (2) as the curvature position increases (from leading edge to trailing edge), the blade angle distribution should gradually increase the absolute value of the negative curvature percentage. As shown in Figure 8, the blade angle distribution of the original blade is linear, and in this paper the original blade angle distribution is optimized by adjusting the curvature percentage at each curvature position.
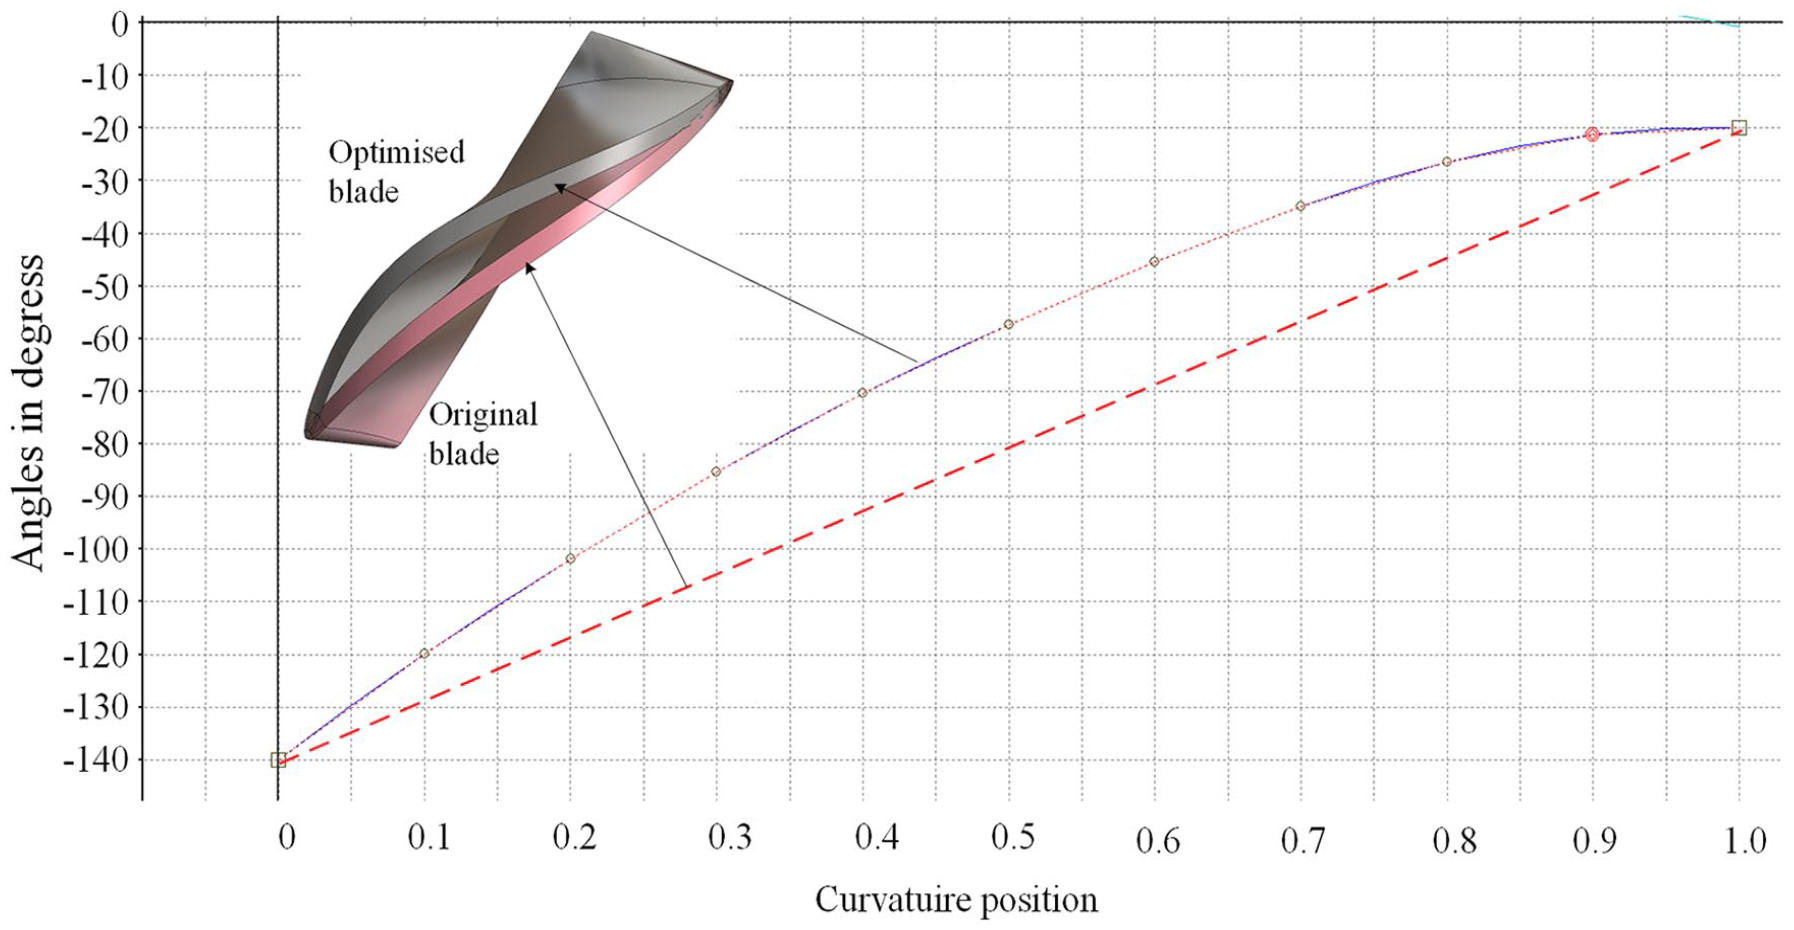
Comparison of original and optimized blades.
Hydraulic performance
Figure 9(a) presents the experimental and simulation results of the P‒Q curves for the original impeller, whereas Figure 9(b) shows those for the optimized impeller. For the original impeller, the maximum output flow rates at three different speeds are 3.5, 4.0, and 4.5 L/min. In contrast, the optimized impeller achieves maximum output flow rates of 4.0, 4.5, and 5.0 L/min under the same three - speed conditions. In terms of flow rate performance, the optimized impeller outperforms the original impeller. Moreover, the simulation results closely match the experimental results for both impellers, which validates the simulation model used in the study.
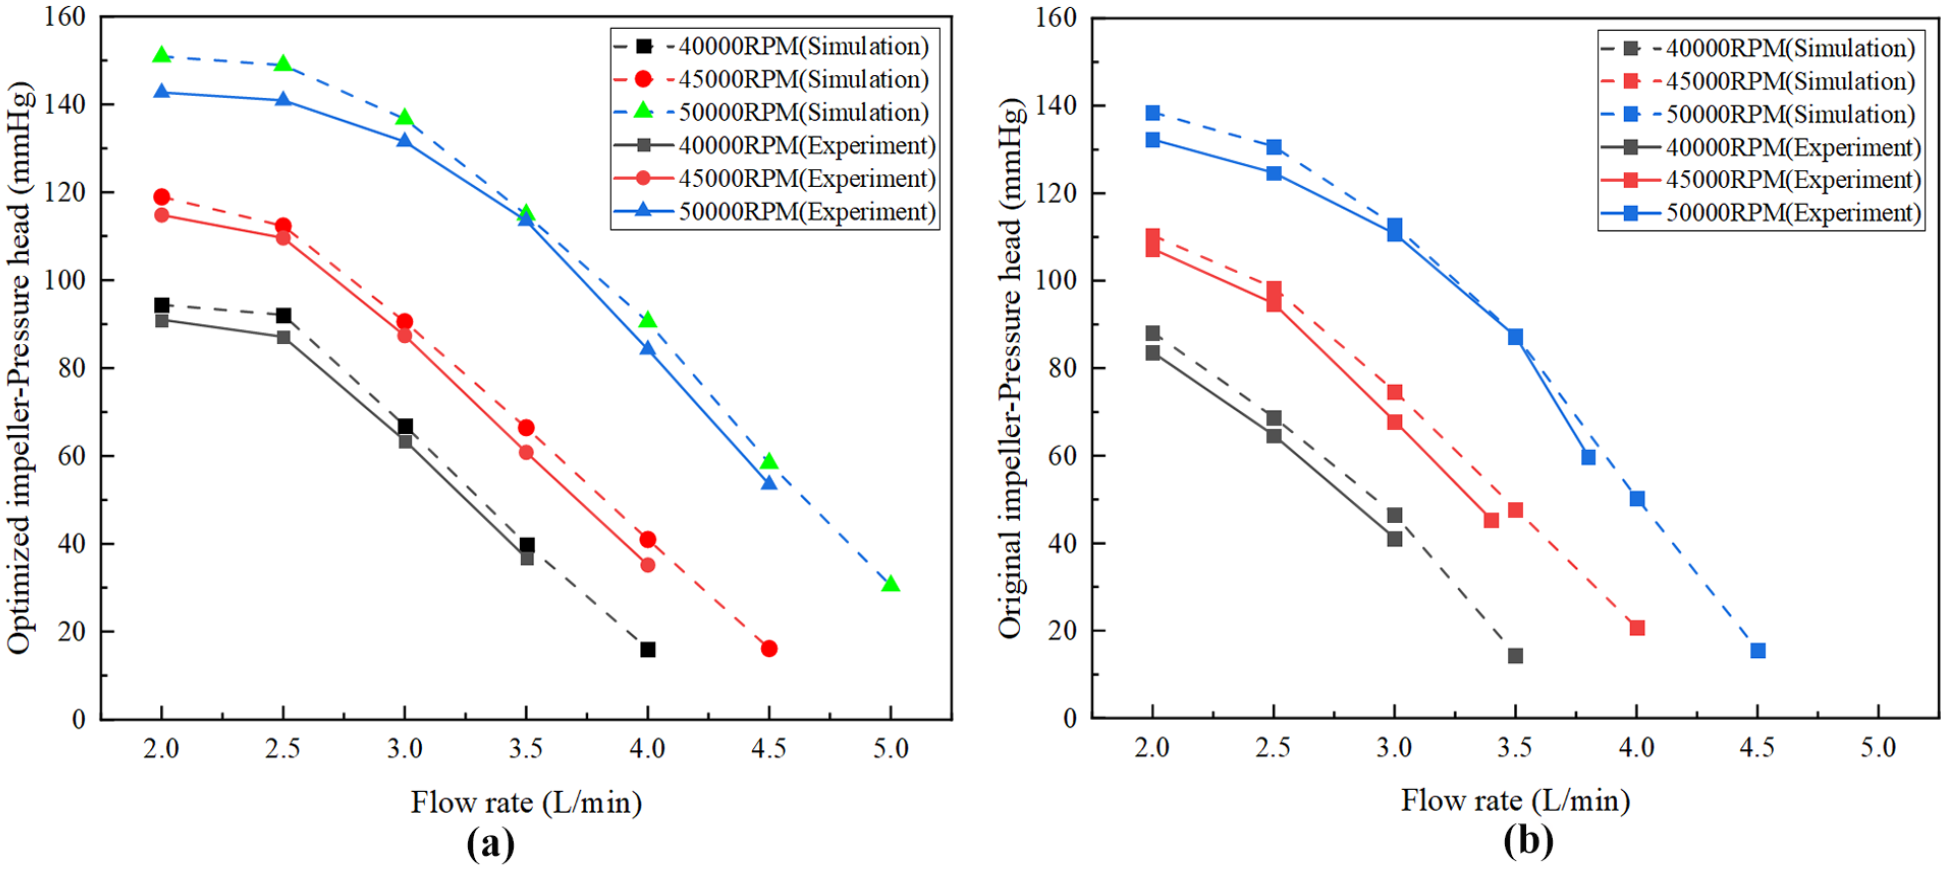
Experimental and simulation results of the blood pump P‒Q curve: (a and b) flow rate (L/min)
Optimal blade and comparison
This section compares the performance parameters between the optimized impeller and the original impeller under 45,000 rpm rotational speed and 3 L/min flow rate conditions. Cross-sections 1–4 were selected to evaluate the flow characteristics at critical regions. Figure 10 shows an analysis of the flow field and pressure characteristics of the microaxial blood pump for both the original and optimized impellers. For the original impeller, as illustrated in Figure 10(b), the flow velocity is highest at the radial clearance of the blades on Plan 1 and Plan 2, with backflow occurring in Regions I and II. In cross-sections 3 and 4, complex flow patterns are evident, with refluxes near the blades in Regions III and IV. The pressure analysis in Figure 10(c) indicates that the maximum pressure in all four planes occurs at the radial clearance of the blades, and the pressure distribution is correlated with the flow pattern. In the case of the optimized impeller, Figure 10(e) shows that the flow field is more uniform on Plans 5 and 6, although backflow is still present near Regions VII and VIII. In Plan 7 and Plan 8, the flow field distributions are also more consistent than those in the original design. In Figure 10(f), the maximum pressure continues to occur at the radial gap of the blades; however, the overall pressure of the optimized impeller is significantly lower than that of the original impeller in all four planes, which indicates that the optimized design performs more effectively.
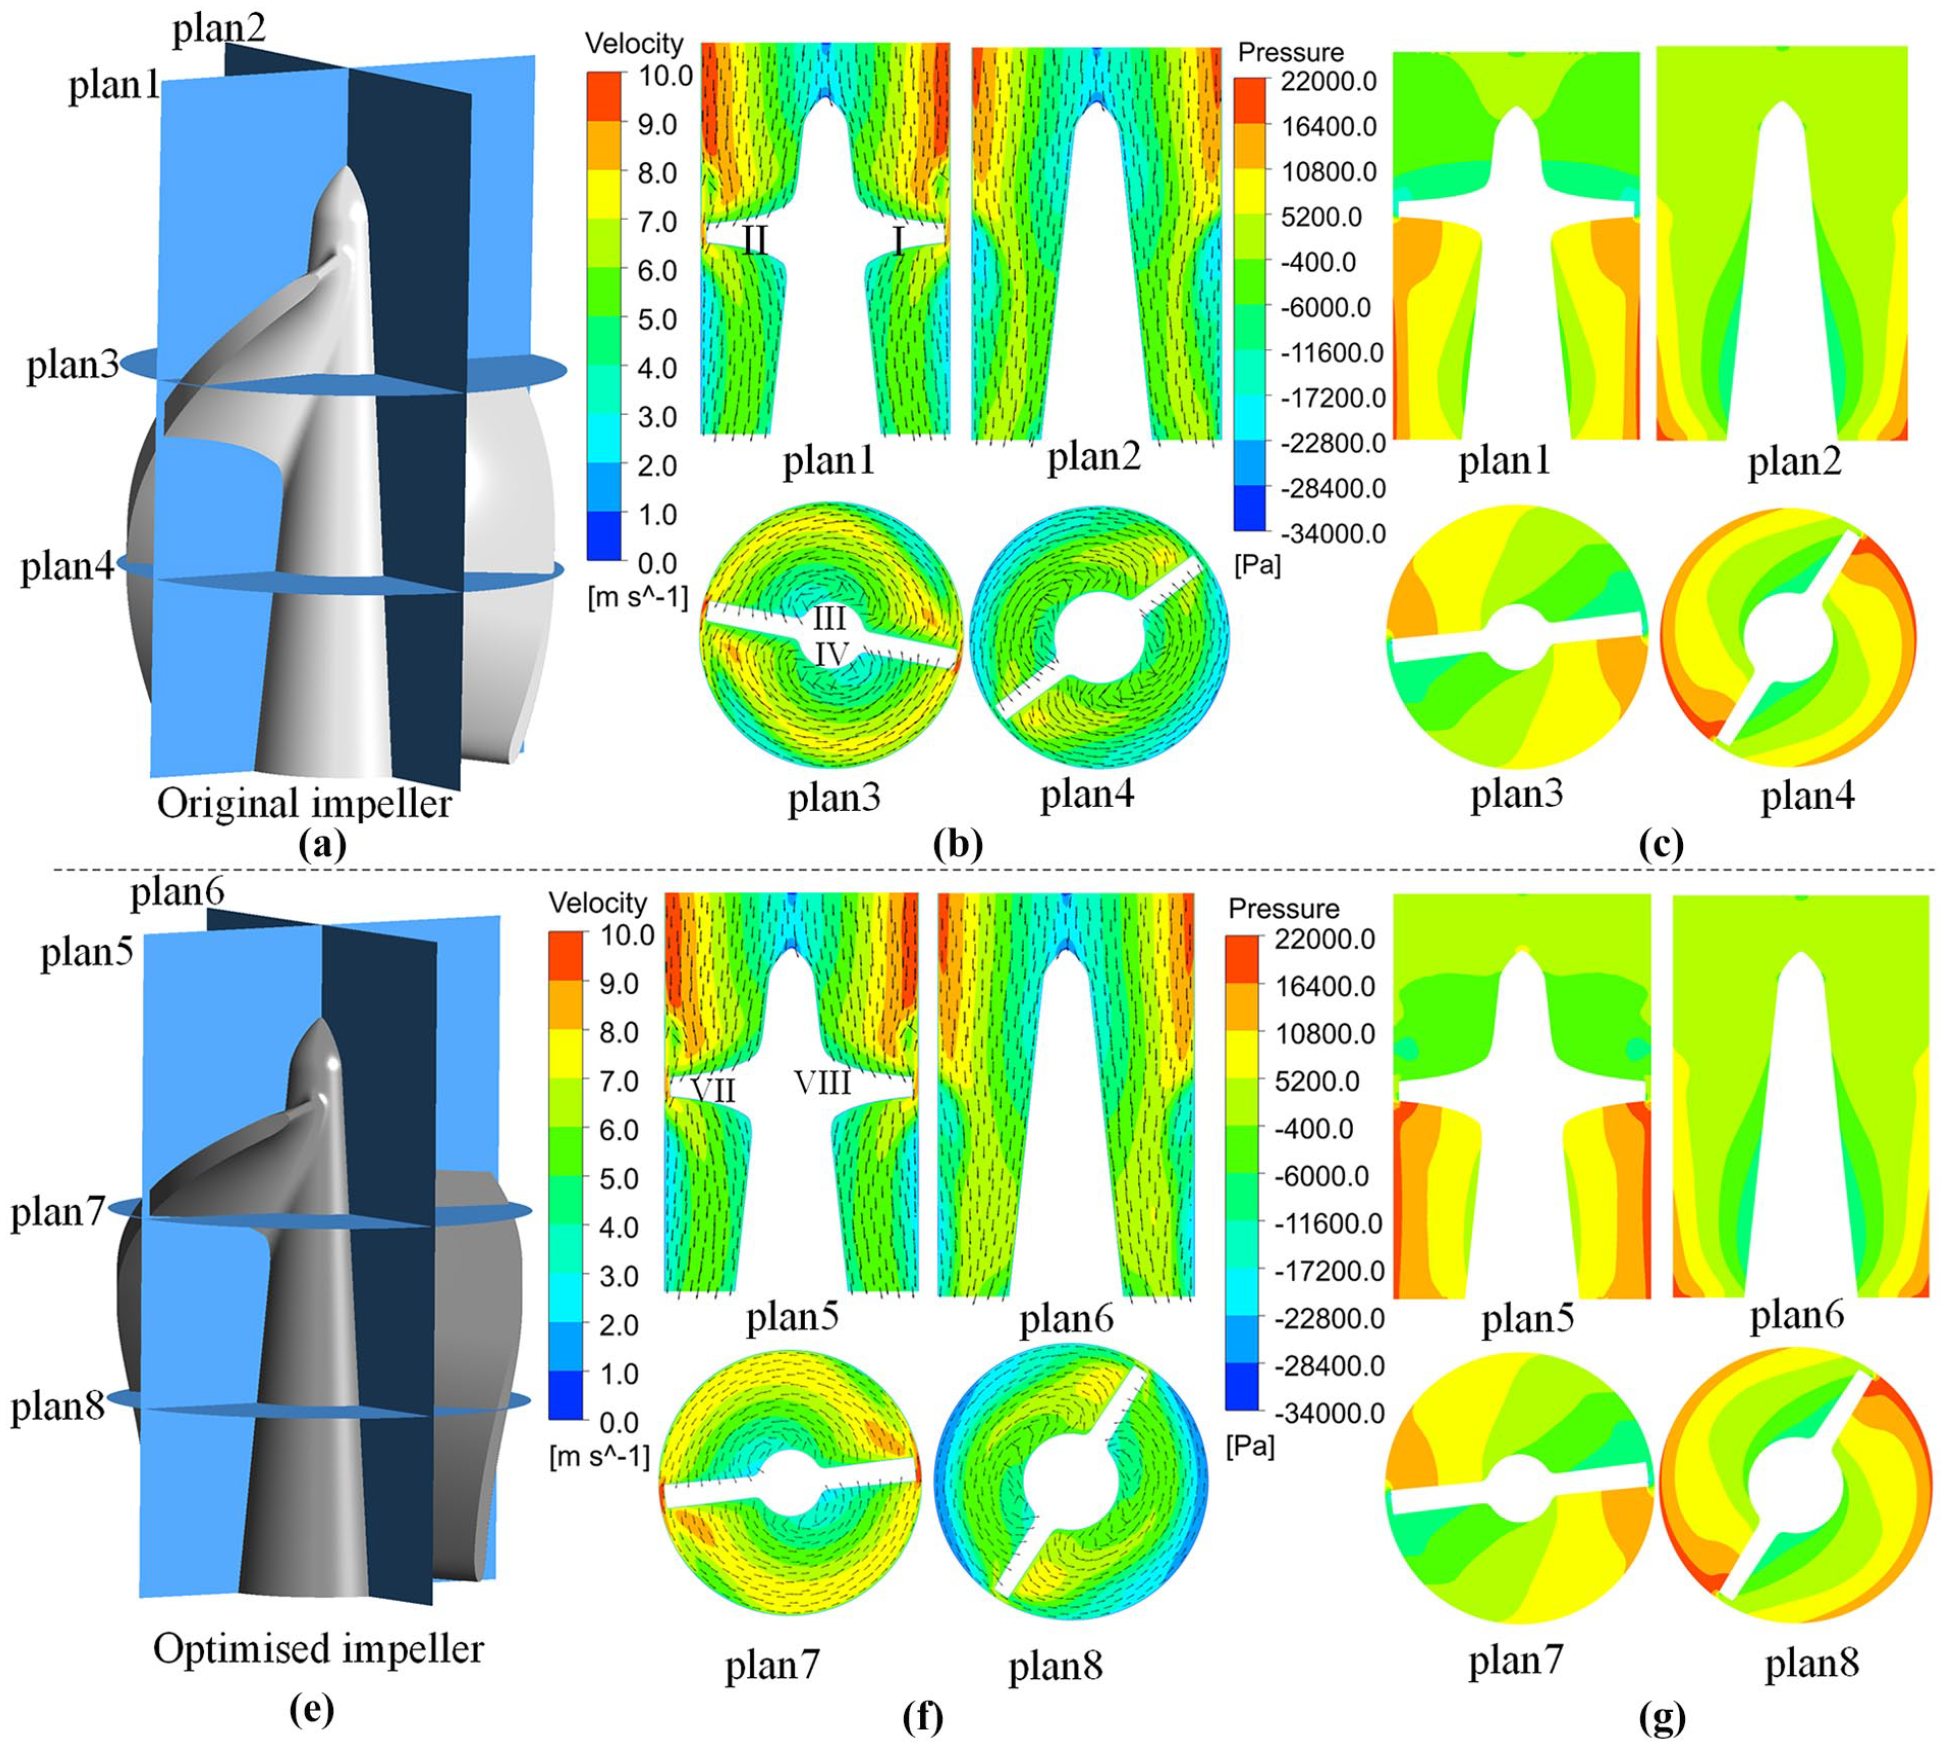
(a) Four observation surfaces of the original impeller at Plans 1, 2, 3, and 4, (b) velocity cloud of the original impeller, (c) pressure cloud of the original impeller, (d) optimized impeller with two viewing surfaces Plans 5, 6, 7, and 8, (e) optimized impeller velocity clouds, and (f) pressure cloud for the optimized impeller.
SSS and time are key factors in hemolysis calculations. Figure 11(a) shows the wall shear contours of the original and optimized impellers. The highest degree of wall shear occurs near the leading edge and tip surfaces, which are potentially dangerous areas for blood damage. The optimized impeller’s wall shear is clearly smaller than that of the original impeller. Figure 11(b) shows the time flow plots of the original impeller and the optimized impeller, with the longest time passing through the original impeller being 17 ms and the longest time passing through the optimized impeller being 10 ms. Figure 11(c) shows the HI in the x–z plane and demonstrates that the radial blade gap has the highest hemolysis index. This phenomenon can be attributed to the high liquid shear stresses resulting from the large velocity gradient in the tip gap and the presence of vortices. However, the optimized impeller has a significantly lower HI in the radial blade gap than the original impeller does. Figure 11(d) shows the scaled volume averaged AP concentration in the x–z plane for the original and optimized impellers, with the maximum values occurring in the blade radial gap. The optimized impeller has a significantly lower scaled volume-averaged AP concentration than the original impeller does.
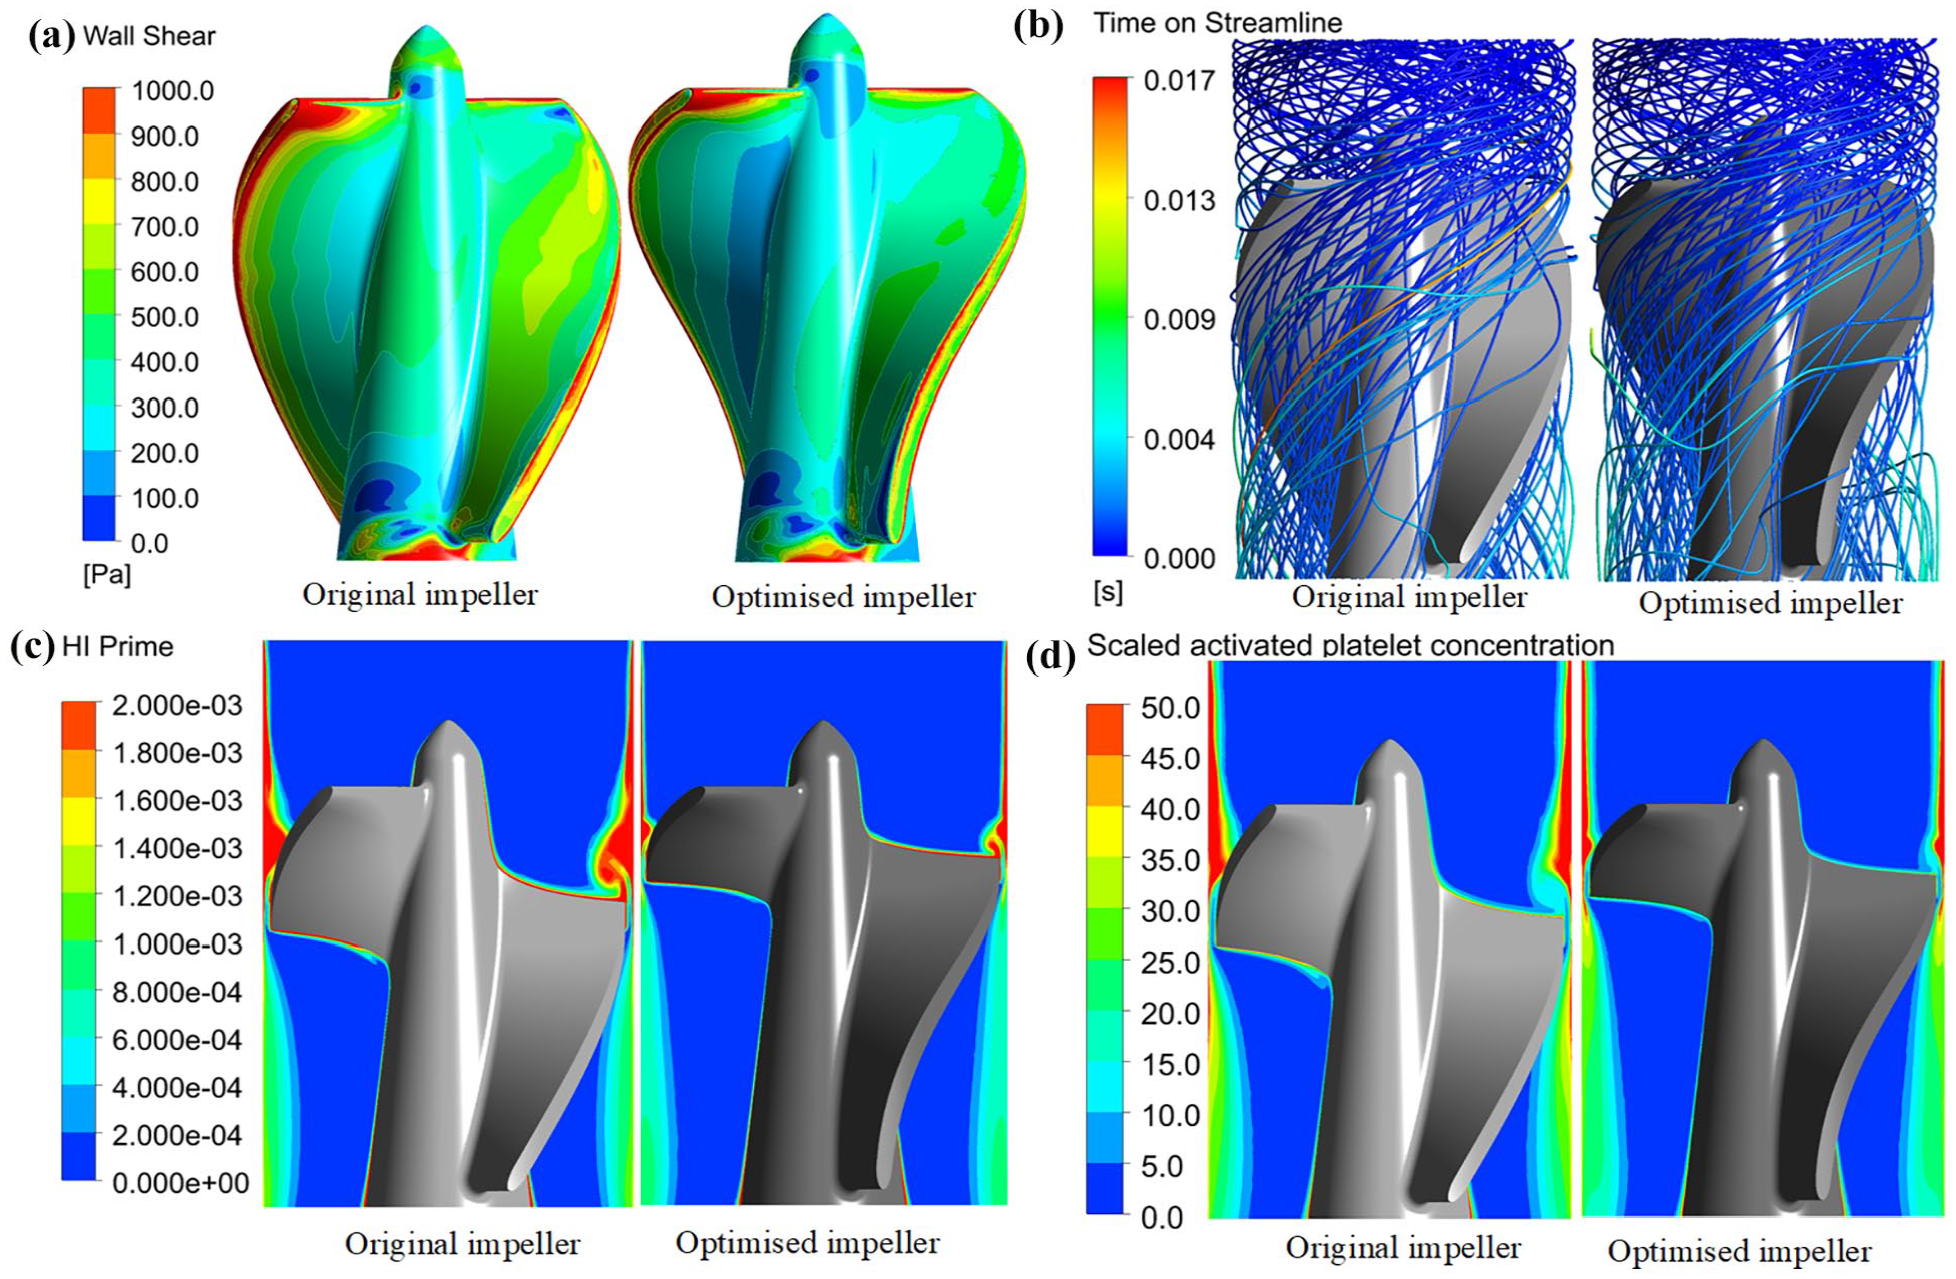
Comparison between the original impeller and the optimized impeller: (a) distribution of SSS, (b) streamline plot of exposure time, (c) contour plot of HI Prime, and (d) contour plot of volume averaged AP.
According to Chen et al., 27 scalar shear stress (SSS) can cause platelet activation and hemolysis when it exceeds 100 Pa. The distribution of SSS for the original and optimized impellers is shown in Figure 12(a), where the percentage of SSS in the optimized impeller that falls into the physiological category (⩽9 Pa) is 6.9%, which is greater than that of the original impeller (5.6%). The percentage of SSS of the optimized impeller in the range of 9–100 Pa is slightly less than that of the original impeller by 2%, and the percentage of SSS in the range of 100–500 Pa is slightly less than that of the original impeller by 0.1%. In comparison, the percentage of SSS in the nonphysiological range (>500 Pa) for the optimized impeller is 0.9% greater than that of the original impeller. This suggests that the optimized impeller has less shear stress and that the risk of hemolysis is improved. Figure 12(b) compares the percentages of the original impeller and the optimized impeller over the range of volume averaged scaled AP concentrations. The percentages of optimized impellers with volume averaged scaled AP concentrations of 0–5 and 5–10 were 22.8% and 43.7%, respectively, higher than those of the original impellers. Statistically, the percentage of optimized impellers at high scale AP concentrations greater than 10 was 33.5%, which was much lower than the 37.7% for the original impeller. This further indicates that optimizing the impeller reduces the risk of thrombosis.
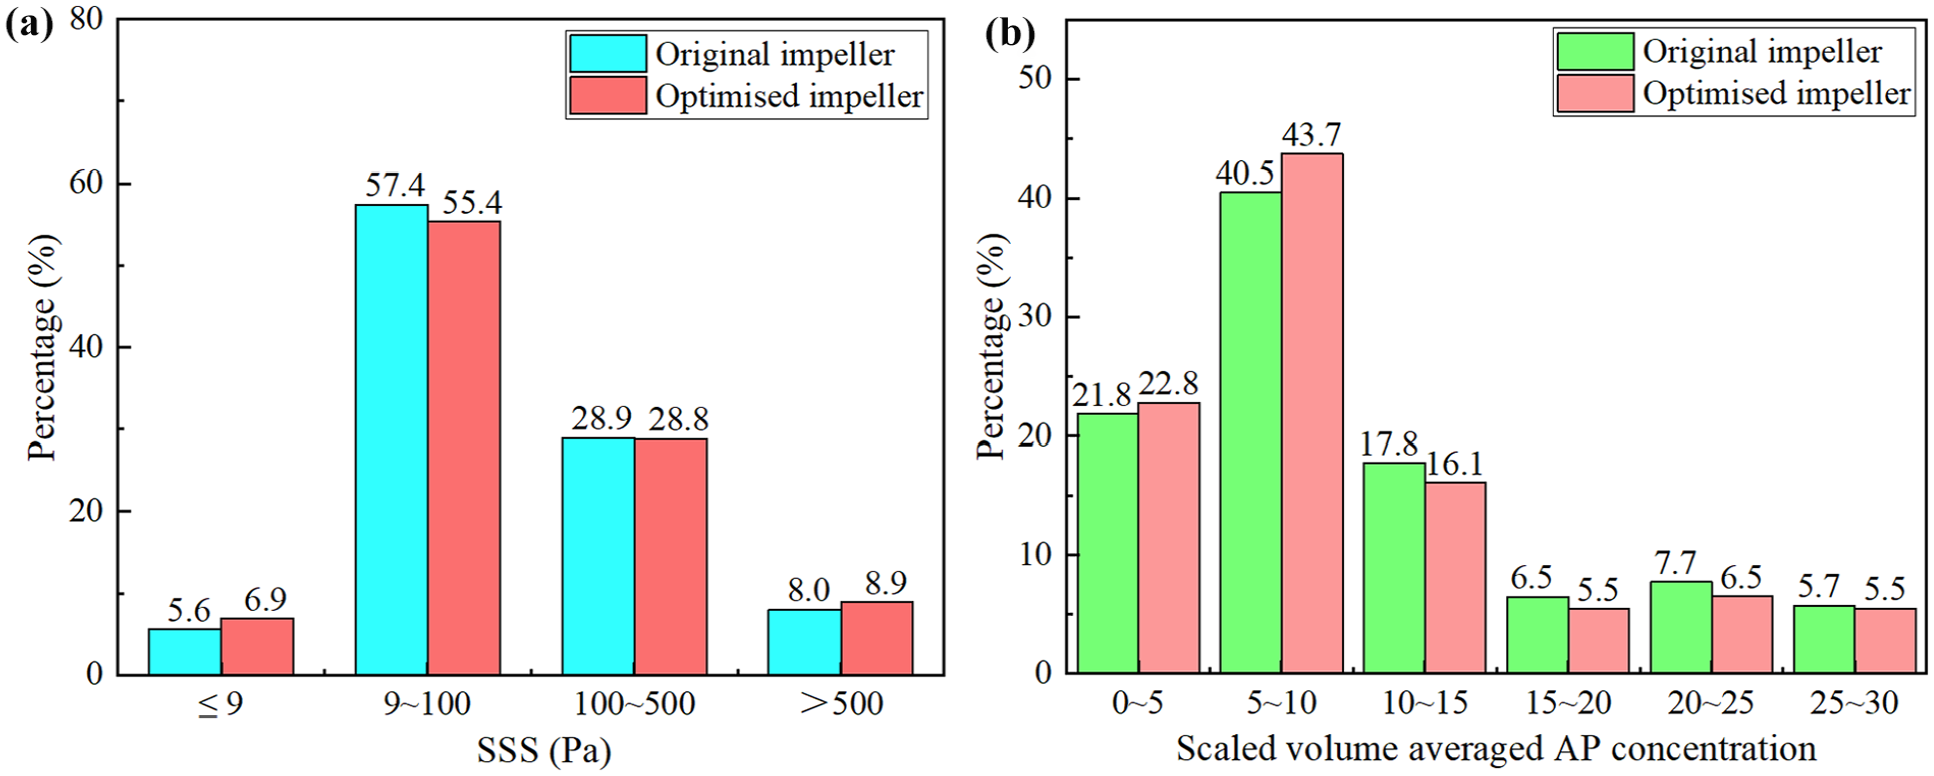
(a) Comparison of SSS in different ranges for the original impeller and the optimized impeller and (b) comparison of volume averaged scaled APs in different ranges for the original impeller and the optimized impeller.
Discussion
This study presented a method to optimize the blade structure of a miniature axial blood pump by changing the angular distribution of the blades. This study also analyzed the hemodynamic and hemocompatibility performance of the impeller at different curvature percentages for different curvature positions via a validated hemolysis model and a thrombosis model. First, the inlet angle β1 was changed under the condition of a fixed outlet angle β2 of −20°, and the pressure head and efficiency decreased with increasing β1. This change occurred because after β2 remained unchanged and β1 increased, the blade became longer, and the ability of the blade to restrain the fluid increased. Moreover, friction loss also increased, and theoretically, there must be an optimal blade wrapping angle. Then, the blade angle distribution was changed according to the curvature percentage at different curvature positions. The results in Figures 6 and 7 show that when each curvature position is steered from zero curvature to positive curvature, the pressure head is significantly reduced, and the hemolysis index and volume-averaged scaled AP concentration increase. The absolute values of the negative curvature percentage of the pressure head maximum, hemolysis index, and volume-averaged scaled AP minimum gradually increased with increasing curvature position. This pattern was consistent with impeller designs in literature. 20 In other words, the blade angle between the inlet and the axial direction should be large, allowing blood to enter the impeller smoothly. The blades are almost parallel to the axial direction at the trailing edge, allowing the blood flow to acquire a better axial velocity component.
According to recommendations in the literature,13,17,27 the clinical requirement of miniature axial blood pumps is to fulfill a pressure head of 80–100 mmHg at a flow rate of 3 L/min. The experimental results confirmed that the proposed method can optimize the original impeller in this paper. The pressure head of the original impeller with linear distribution of blade angles was 74.8 mmHg under operating conditions, whereas while the pressure head obtained from the optimized impeller was 90.6 mmHg. The higher the pressure head supplied by the blood pump is, the more backflow can be prevented from occurring, and the optimized impeller minimizes the risk of backflow. The velocity streamline diagram in Figure 10 shows that the optimized impeller has almost no vortex or backflow in the blade radial gap compared with the original impeller. The vortex and backflow tend to produce concentrated shear stress, destroying red blood cells. The disappearance of the vortex in the blade radial gap of the optimized impeller is due to the reduction in the pressure gradient change. A comparison of the pressure diagrams reveals it could be seen that the pressure change is evident in the region where the vortex occurs. However, a significant vortex was still present in the hub surface-optimized impeller. The vortex is the leading cause of blood damage in blood pumps, 28 and the optimized impeller reduces the risk of blood damage; however, further optimization is still needed. The presence of vortices near the hub is because the shape of the blades near the hub still needs to be perfectly designed, with sharp edges where the blades meet the hub, which could lead to localized flow separation as the fluid flows through this area. Subsequent impeller designs should be chamfered at the intersection of the blade and hub, and the shape of the impeller blades and the size of the mounting angle should be fine-tuned.
Nonphysiologically shear stress and exposure time are critical factors for hemolysis. The change in the angular distribution of the blades allowed the blood to enter the impeller smoothly, and the blood flowed out of the blade radial gap quickly. As a result, the wall shear of the optimized impeller was significantly reduced, especially at the leading edge and tip positions. Compared with the original blade, the optimized blade resulted in a 1.3% increase in the percentage of SSS belonging to the physiological category (⩽9 Pa), a 2.0% decrease in the percentage of SSS in the range of 9–100 Pa, an 8.4% reduction in the hemolysis index, and a 4.0% reduction in volume-averaged scaled AP concentration in the impeller basin. This finding demonstrated that the blood pump with optimized blades increased the pressure head while also reducing the hemolysis index and volume averaged scaled AP concentration, thus reducing the risk of blood damage from the blood pump. The optimal HI value for interventional blood pumps in the literature 13 is 6.48 × 10⁻⁵, and the hemolysis level for catheter pumps in the literature 29 is 2.70 × 10⁻⁵. Compared with the above studies, the hemolysis index of the optimized impeller in the present study is 1.998 × 10⁻⁴, whereas that of the original impeller is 2.183 × 10⁻⁴. Although the optimized impeller has a reduced the hemolysis value, the high shear region of the impeller is concentrated in this region, and the significant change in velocity is responsible for the concentration of high shear stresses. Therefore, there is still an unavoidable risk of hemolysis and thrombosis in the blade radial gap.
For the original impeller, Figure 10(b) reveals distinct recirculation in Regions I and II (Plans 1 and 2) as well as Regions III and IV (Plans 3 and 4). These irregular flow patterns generate uneven structural forces, significantly increasing the local shear stress, as shown in the pressure analysis of Figure 10(c). This chaotic flow exacerbates hemolysis and thrombosis risk. Additionally, the original impeller’s longest time streamline in Figure 12(b) reaches 17 ms, indicating fluid stagnation, which further heightens these risks. Conversely, the optimized impeller results in more orderly flow in Plans 5–8 (Figure 10(e)), with diminished recirculation intensity. This regularized flow improves structural efficiency, resulting in a more uniform shear stress and pressure distribution (Figure 10(f)). Moreover, the optimized impeller’s 10 ms streamline in Figure 11(b) minimizes fluid retention. Overall, optimizing flow characteristics not only enhances structural performance but also reduces shear stress, thereby lowering hemolysis and thrombosis risks and improving hemocompatibility.
The power-law model of platelet activation, used in thrombosis simulation of blood pumps, quantifies the nonlinear relationship between shear stress and platelet activation, such as mechanical and chemical activation factors. This model simplifies the complex coagulation cascade into transport equations for non-activated/activated platelets and ADP. However, it fails to capture dynamic shear features (such as high-frequency oscillations and turbulent pulsations) and platelet mechanosensitive to frequency-domain stress components. Consolo et al. 30 demonstrated that platelet activation is highly sensitive to the frequency components of shear stress, with high-frequency oscillations driving prothrombotic behavior even at low magnitudes. The power-law model, however, does not explicitly include frequency or dynamic change parameters. In addition, the platelet activity state model used by Boraschi et al. 31 employed a platelet activity state model in ventricular assist device studies, integrating stress accumulation and rate to describe activation in unsteady flows with vortices or pulsatile patterns. Li et al. 32 developed a multiphysics model combining shear stress, residence time, and coagulation factors, solving transport equations to simulate platelet-factor interactions. Their model validated that high-shear, long-residence regions correlate with clinical thrombosis data. Meng et al. 33 identified two distinct activation pathways: shear-induced activation in high-shear zones and bioagonist-driven activation in stagnant areas, showing thrombus initiates in high-shear regions and spreads via biochemical accumulation. Feaugas et al. 34 emphasized CFD-based frameworks integrating platelet tracking and non-Newtonian rheology to resolve shear gradients and flow heterogeneity, critical for predicting thrombogenicity in complex geometries. The limitation of using the power-law model is its reliance on static shear parameters and empirical coefficients, failing to account for dynamic shear rate fluctuations, platelet mechanosensitive to frequency-domain stress components, and biochemical feedback loops. For example, in micro-axial flow pumps, residual hub vortices introduce unsteady shear rates that the model cannot resolve, potentially leading to underestimation of activation rates in oscillatory regions. Future research is deserved to explore the benefits of more advanced models of platelet activation to predict the effect of blade angle distribution in terms of hemolysis and thrombosis in micro-axial flow pumps.
This approach could optimize the blade angle distribution by increasing the pressure head and hydraulic efficiency and reducing hemolysis and thrombosis risk. However, the following deficiencies remain: (1) In this work, blade angle curve distributions of different shapes were not made for each inlet angle, nor were more detailed studies on the curvature percentage and the curvature position carried out. Moreover, various models need to be analyzed to better understand the impact of the blade angle distribution on the hemodynamic and hemocompatibility performance. (2) The CFD simulation in this paper was designed as a steady-state model, ignoring more complex and subtle flow characteristics. In contrast, a transient model could effectively predict hydraulic performance and the trend of blood pump-induced hemocompatibility damage very well. (3) Only flow rate and pressure rise experiments were conducted without hemolysis tests, leaving physiological hemolysis unverified due to a lack of physical experiments and time constraints.
Conclusion
This study systematically investigates the influence of blade angle distribution on the hemodynamic and hemocompatibility performance of a miniature axial blood pump using CFD and experimental validation. The main findings of the paper were as follows:
(1) By adjusting the blade inlet angle (β1) and curvature distribution, an optimal design that improves pump efficiency and blood compatibility can be identified. Key findings reveal that varying β1 from −100° to −220° significantly impacts the pressure head and hydraulic efficiency, with β1 = −140° yielding the best balance.
(2) Subsequent curvature optimization demonstrates that avoiding positive curvature and increasing the absolute value of negative curvature along the blade (from M-prime 0.1 to 0.9) minimizes shear stress, hemolysis, and platelet activation. Compared with the original linear design, the optimized impeller achieves a 17.4% increase in pressure head, a 2.1% improvement in hydraulic efficiency, an 8.4% reduction in hemolysis index, and a 5.3% decrease in activated platelet concentration.
(3) These results are validated through experimental P‒Q curve testing, confirming the reliability of the CFD-based optimization framework. The optimized design reduced nonphysiological shear stress (⩽9 Pa) in 6.9% of the flow domain, decreased recirculation, and shortened blood residence time, reducing blood damage risk. However, residual hub vortices indicate room for improvement.
This work provides a novel methodology for blade angle optimization in axial blood pumps, offering a systematic framework to guide future blood pump improvements. Expanding parameter studies, transient simulations, and experimental hemolysis validation could further refine the design. Collectively, these advancements underscore the potential of geometric optimization to increase the performance and safety of miniature axial blood pumps.
Supplemental Material
sj-pdf-1-jao-10.1177_03913988251349000 – Supplemental material for Study of the influence of blade angle distribution on hemodynamic and hemocompatibility performance in a miniature axial blood pump
Supplemental material, sj-pdf-1-jao-10.1177_03913988251349000 for Study of the influence of blade angle distribution on hemodynamic and hemocompatibility performance in a miniature axial blood pump by Zhi-Peng He, Shen Lv, Guang-Mao Liu and Sheng-Shou Hu in The International Journal of Artificial Organs
Footnotes
Declaration of conflicting interests
The author(s) declared no potential conflicts of interest with respect to the research, authorship, and/or publication of this article.
Funding
The author(s) disclosed receipt of the following financial support for the research, authorship, and/or publication of this article: This research was supported by Shenzhen Key Medical Discipline Construction Fund (No. SZXK080); Shenzhen Key Laboratory of Cardiovascular Disease, Fuwai Shenzhen Hospital, Chinese Academy of Medical Sciences (Grant No. GSP-ZDSYS-001); Shenzhen Science and Technology Program (No. JCYJ20210324130408023); Young Talent Program of the Academician Fund (No. YS-2022-001); Shenzhen Science and Technology Program (NO. JCYJ20240813151810015); Shenzhen High-level Hospital Construction Fund; and Shenzhen High-level Hospital Construction Fund (No: GSP-QNPY-B2025015).
Supplemental material
Supplemental material for this article is available online.
References
Supplementary Material
Please find the following supplemental material available below.
For Open Access articles published under a Creative Commons License, all supplemental material carries the same license as the article it is associated with.
For non-Open Access articles published, all supplemental material carries a non-exclusive license, and permission requests for re-use of supplemental material or any part of supplemental material shall be sent directly to the copyright owner as specified in the copyright notice associated with the article.