
Abstract
Much prior research has examined the individual-level, major-specific, and institutional correlates of college students’ choice of major, as well as the variation in labor market outcomes associated with this important choice. Extant accounts, however, largely overlook the process by which individuals change their major throughout college. This study provides a comprehensive description of major switching, and considers its relevance to concerns about stratification in postsecondary education. Drawing on survey and transcript data from students at three large universities in the United States, I find that switching is widespread, and that many students change their majors multiple times. Students appear to change majors in an effort to better fit their interests and abilities, as students seek out majors that are generally less competitive and easier. Major change further contributes to gender segregation, particularly as women leave science, technology, engineering, and math (STEM) fields after initially selecting these at lower rates than men.
Keywords
Introduction
The decision-making process about one’s educational attainment extends far beyond whether or not to attend college. Today’s students routinely decide to delay their initial transition into college following high school, take breaks after enrolling, and move between postsecondary educational institutions (Denice 2019; Elman and Weiss 2014; Goldrick-Rab 2006; Roksa and Velez 2012). The pathways taken by college students have become so complex and varied that what we think of as “the traditional pathway to a bachelor’s degree characterizes the experience of a minority of students” (Milesi 2010:32). The varied ways in which individuals enroll in college reflect the growing heterogeneity of the students themselves (Goldrick-Rab 2006). More than 90 percent of high school students expect to attend college (Reynolds et al. 2006), and roughly 70 percent of recent high school graduates have enrolled in a two- or four-year postsecondary institution, up from about half in the early 1980s (National Center for Education Statistics 2016, Table 302.10). In addition to whether and where one attends college (Gerber and Cheung 2008; Hout 2012), variation in how one proceeds through college represents “an additional layer of stratification in higher education,” particularly since such variation is patterned demographically and socioeconomically and can have negative consequences for students’ ultimate educational attainment and later-in-life employment outcomes (Goldrick-Rab 2006:73).
Beyond decisions about whether, where, at what intensity, and for how long to enroll, college students’ choice of major represents another kind of postsecondary “swirl” (McCormick 2003) relevant to processes of educational stratification. While the correlates and consequences of college major selection have been studied at great length, most scholarly accounts conceptualize and measure the decision to major in a particular field of study in terms of a one-time choice. For instance, students decide whether or not to major in a science, technology, engineering, or math (STEM)–related field (e.g., Wang 2013), students are asked about their current or intended major (e.g., Arcidiacono, Hotz, and Kang 2012), or researchers measure variation in employment outcomes based on a student’s final major (e.g., Altonji, Kahn, and Speer 2016). To be sure, these are important questions, and efforts to address them have yielded valuable insights. They demonstrate the importance of considering educational stratification across both its vertical (e.g., years of schooling) and its horizontal dimensions (Gerber and Cheung 2008)—the latter of which includes institutional types, selectivity, and college major choice.
However, major selection can be better understood as a process that unfolds over a student’s educational life course, with important short- and longer-term consequences for their postsecondary achievement, progress, and persistence. Major change is quite common. About 30 percent of undergraduates in associate’s and bachelor’s degree programs change their major at least once within three years of their initial enrollment (Leu 2017). When students change their major, they may be responding to the characteristics of, their performance, and their integration in their institution and initial major. Field of study decisions also shape patterns of stratification and segregation in educational institutions. In particular, women are less likely to initially choose certain majors—particularly those related to science and math—and they leave STEM majors when they encounter a “chilly climate,” experience gender-based discrimination, or perceive the major to be more welcoming to men than to women (Ganley et al. 2018; Riegle-Crumb, King, and Moore 2016). Yet less is known about the extent to which the choice to switch majors contributes to gender field of study segregation.
This study contributes to the rich literature on major choice specifically, as well as to the broader research on heterogeneity in college students’ pathways. I draw on unique survey and transcript data from samples of students at three large U.S. universities to answer four sets of research questions: First, how prevalent is major switching in college, and how often do students make more than one change? Second, what individual-level and major-specific factors are related to major switching? Third, how do the majors students leave compare to their new majors? Finally, what are the consequences of major switching for patterns of gender segregation and for students’ postsecondary performance, progress, and persistence? By providing a fuller, more holistic understanding of the processes by which students choose and change their majors, this study offers a high-dimensional account of a particular mechanism of stratification in higher education.
Background
Choosing a Major
The selection of one’s major is a high-stakes decision that shapes students’ experiences, learning, and satisfaction in college as well as their occupation, earnings, and job stability post-college (Kinsler and Pavan 2015; Ma 2011; Monaghan and Jang 2017; Pitt and Zhu 2018; Porter and Umbach 2006; Thomas and Zhang 2005). Research refutes the anecdotal take in the popular media that one’s “college major doesn’t matter” (Cain 2018; Stahl 2015). Students who complete a bachelor’s degree in a STEM field, for instance, can expect to earn an additional $800,000 in lifetime earnings relative to those who majored in a social science field (Kim, Tamborini, and Sakamoto 2015). Majoring in a particularly lucrative field like engineering or finance (in contrast to fields like the fine arts or philosophy) can shield individuals from the negative effects of recessions on earnings and employment (Altonji et al. 2016), and offset the earnings disadvantages associated with attending less selective institutions or coming from a lower social class (Ma and Savas 2014).
Given the variation in labor market returns, scholars of higher education are interested in how students’ background interacts with their future employment expectations to sort them into more and less lucrative majors (Ma 2009; Morgan, Gelbgiser, and Weeden 2013; Porter and Umbach 2006; Quadlin 2020; Zafar 2013). For instance, students from lower socioeconomic status backgrounds are more likely to choose vocational majors even after accounting for other factors like tested proficiency, college characteristics, expectations, and work values (Goyette and Mullen 2006). Gender emerges as a particularly salient dimension in the horizontal stratification by major field of study. Although women in the United States currently surpass their male counterparts in terms of college attendance, there is a high degree of gender segregation across fields of study (DiPrete and Buchmann 2013; Mann and DiPrete 2013). Women are especially underrepresented in fields, like STEM, with high economic returns (Charles 2017; Davies and Guppy 1997; Morgan et al. 2013). Because male-dominated majors are often associated with higher earning careers, the difference in major choice represents a key contributor to the gender wage gap (Brown and Corcoran 1997). While race and ethnicity pattern college major choice as well, such variation is small compared to gender differences (Dickson 2010).
Changing Majors
The disproportionate concentration of student subgroups in particular majors, coupled with the differential earnings returns to fields of study, illustrates how the choice of major serves as a “significant component of stratification after college” (Goyette and Mullen 2006:501). Furthermore, such issues necessitate a better understanding about the process by which students leave college with their particular majors. By treating the choice of major as a one-time or binary decision (e.g., with a focus on the first or last major selected in college, or on whether a student selects a STEM major), the extant research has paid less attention to the choices many students make to change their field of study over time. According to recent estimates, about 30 percent of undergraduates in associate’s and bachelor’s degree programs change their majors at least once between their initial enrollment and exit from college (Dickson 2010; Leu 2017).
While some work does examine major switching (Astorne-Figari and Speer 2019; Chen 2013; Griffith 2010; Ma 2011; Ma and Liu 2017; Maltese and Cooper 2017; Rask 2010; Solnick 1995), this literature remains relatively thin compared to the vast body of work examining the correlates and consequences of the initial major choice. Even when thinking of major choice in terms of change, researchers generally compare students’ initial major to their final one. Such comparisons are important, but they belie any changes made in between the initial and terminal choices, and do not consider how different those intermediary majors are. These related questions can help us get purchase on why students change their majors and on what it means—that is, what might motivate students to change their majors and how switching might shape gender field of study segregation and student’s own academic experiences and outcomes in college.
Like students’ persistence and success in postsecondary education more generally, whether students remain in their initially chosen fields of study can be explained in terms of their integration into the social structure of their institutions and majors (Bean 1983; Tinto 1997). Students enter college and select an initial major with a set of background characteristics as well as expectations and perceptions about their chosen major. Such perceptions are almost certainly incomplete at the outset of college (Stinebrickner and Stinebrickner 2014), and students may feel overwhelmed by the myriad of course and major offerings (Rosenbaum, Deil-Amen, and Person 2007). As they progress through college, students’ experiences in their classes can alter or reinforce their preferences and expectations, and shape their decisions about future course-taking and whether they persist in or change their major (Attewell, Heil, and Reisel 2012; Chen 2013; Crisp, Nora, and Taggart 2009). Students with higher levels of social and academic integration (as measured, for example, by their grade point averages [GPAs]) are thus expected to be less likely to change their majors.
Students’ experiences of integration, and therefore their propensity to seek out new majors, may be patterned by their prior academic achievement and other background characteristics. In particular, students from lower socioeconomic backgrounds—that is, those whose parents have not attended college or completed a degree—likely face a steeper learning curve about the rigor, demands, and realities of college life (Pascarella et al. 2004). They may find that their expectations about their initially chosen field of study are inaccurate, and seek a different major that better suits their interests, abilities, and career goals. Thus, I expect first-generation status to be positively associated with major switching. Similarly, students who struggled in high school may find their notions of college and their chosen field of study challenged and revised to a greater extent than students who took more advanced courses and who evinced stronger performance in their coursework and on standardized achievement tests. There may also be gendered responses to the mismatch between one’s major and their interests and abilities. Researchers have shown that men gravitate to riskier and more competitive fields (Alon and DiPrete 2015; Astorne-Figari and Speer 2019), and so they may be less likely than women to change their major even if their interests and abilities are not perfectly aligned with the coursework and difficulty of their initially chosen majors.
In addition to student-level characteristics, features of the majors themselves—and how these features interact with students’ background—may shape students’ decisions to persist in or leave their fields of study. Fields with a high degree of social closure, like STEM, often have social conditions and cultures that work to exclude certain student groups (Han 2016). While the expansion of higher education has improved the gender balance in STEM fields, women remain underrepresented (Bradley 2000; Mann and DiPrete 2013). And even when traditionally excluded groups, notably women, initially select STEM majors, they often leave when they encounter a “chilly” environment, discrimination, or feelings of “tokenism” in their classes (Ganley et al. 2018; Riegle-Crumb et al. 2016; Sax 1996). Female students who begin in STEM may be “lured” away from their majors by more positive experiences and better grades in courses in the humanities and other non-STEM fields (Ost 2010). Even among STEM majors, women eschew math and science courses, and take more courses in the social sciences and humanities than their male counterparts (Mann and DiPrete 2013). As a result, I expect women to be particularly responsive to the STEM content of their majors: The more their current major requires STEM-related courses, the more likely women will be to switch majors.
Consequences of Major Change
The decisions made by women and men about whether or not to remain in their majors likely contribute to gender segregation. Certainly, segregation across fields of study results in part from the different choices men and women make when they first enroll in college and initially select a major (Alon and DiPrete 2015; Charles and Bradley 2009; Morgan et al. 2013; Quadlin 2020). But as students re-evaluate their selection of and performance in these initial majors, gender segregation can improve or worsen if men and women leave certain fields and enter particular new fields at different rates. Prior research shows that men and women are attuned to the gender composition of their majors. Whereas men who enter a female-dominated major are more likely to switch to a new major relative to men in other fields (Riegle-Crumb et al. 2016), women tend to leave male-dominated fields, especially when gender segregation is higher at their institutions (Legewie and DiPrete 2014). Therefore, I hypothesize that aggregate patterns of major change will increase field of study segregation.
Additionally, switching majors can be productive for individual students. To the extent that selecting a new major improves the fit with their interests and abilities, major change should boost students’ performance (i.e., course grades and GPA) and persistence in college. A major change might further signal a lack of integration into the academic life of a student’s institution—either because they do not feel like they belong (which might precipitate a change) or because they have not been in a new major long enough to develop relationships with faculty and classmates (Bean 1983; Tinto 1997). While some research has found that the initial choice of college major is related to whether or not a student persists in college (Leppel 2001; St. John et al. 2004), whether major changes impact a student’s likelihood of remaining enrolled in college remains an open question. At the same time, major change may impede students’ academic momentum (Adelman 1999, 2006; Attewell et al. 2012), or their progress toward their degree. Because majors entail a set of course, credit, and performance requirements, it is possible that students who want to switch their major will need to retake courses in which they initially performed poorly or spend time making up required coursework of their newly chosen major. This can disrupt or slow students’ momentum, and prolong the time it takes to complete credits.
I further expect that these individual-level consequences—improved performance, a higher likelihood of persistence, and lower completed credits—will be most pronounced when students make relatively large or substantial changes between majors. When switching between broad major groupings (e.g., transferring into or out of STEM, or switching between business and education), students will likely encounter larger differences between their former and new majors. In this way, the degree to which students can optimize the fit between the demands of the major and their own interests and abilities may depend in part on how far afield their new major is relative to the major they are leaving.
In this study, I offer among the first comprehensive descriptions of college major switching patterns, looking specifically at students who make more than one change. This paper has four aims: (1) to describe the prevalence and timing of major switching, (2) to examine the individual-level and major-specific correlates of changing one’s major, (3) to compare the majors students leave to the new ones they enter on a range of academic and nonacademic factors, and (4) to investigate the implications of major switching for gender field of study segregation and for students’ postsecondary performance, progress, and persistence.
Data and Method
Toward these ends, I use recently collected data from the Pathways through College Survey (PTCS). 1 Survey respondents were drawn from two public comprehensive universities and one private institution located in the western, Midwestern, and eastern regions of the United States. At each institution, researchers collected data from students who began college between 2013 and 2015. Respondents were selected via stratified probability samples of first-time, first-year students, and the sample is representative of the populations of entering students at the three institutions. These institutions, in turn, are diverse in terms of their geographic location, size, and sector (public/private).
The original goals for the survey focused on understanding students’ entry into and persistence in STEM fields. As such, students majoring in these fields are well-represented; roughly three quarters of the sample initially declared a STEM major. This represents a strength of these data for the present examination of the correlates of major switching (where experiences in particularly difficult STEM majors may encourage students to switch; e.g., Crisp et al. 2009) and of gender segregation by field of study (in which STEM majors are implicated; e.g., Riegle-Crumb et al. 2016). Furthermore, the focus on STEM students among respondents does not preclude the ability to study non-STEM majors, as many of the factors related to the choices of remaining in, moving on from, or transitioning into STEM and non-STEM majors are similar.
Students were surveyed up to five times: in the fall and spring semesters of their first year enrolled at one of the three institutions, in the fall and spring semesters of their second year, and in the spring semester of their third year. Response rates on the initial survey varied from 36 to 82 percent, depending on the institution and cohort, with most rates above 60 percent. The survey contains detailed information about students’ academic and interpersonal experiences in college, their preparation in high school, and expectations about their future (e.g., their likely educational attainment). The survey data are linked to students’ transcripts, which provide information about the number of credits they attempt and complete, the courses in which they enroll, and their course grades. The institutions also provided administrative information about their students’ gender, first-generation status, high school GPA, and SAT and ACT scores.
The initial data includes information on 2,720 students. I exclude 352 students whose data records contain too little information because they responded only to one round of the survey (and thus any changes in their major cannot be tracked), because their transcript is missing, or because they appear to have completed no course credits at the institution from which they were sampled. Another 162 students are excluded from the analytical sample because of missing data on key covariates. Thus, the final sample for these analyses consists of 2,206 students. Table 1 presents descriptive statistics for the sample overall and by the number of changes a student makes to their college major.
Descriptive Statistics of Sample, Overall and by Number of Major Changes.
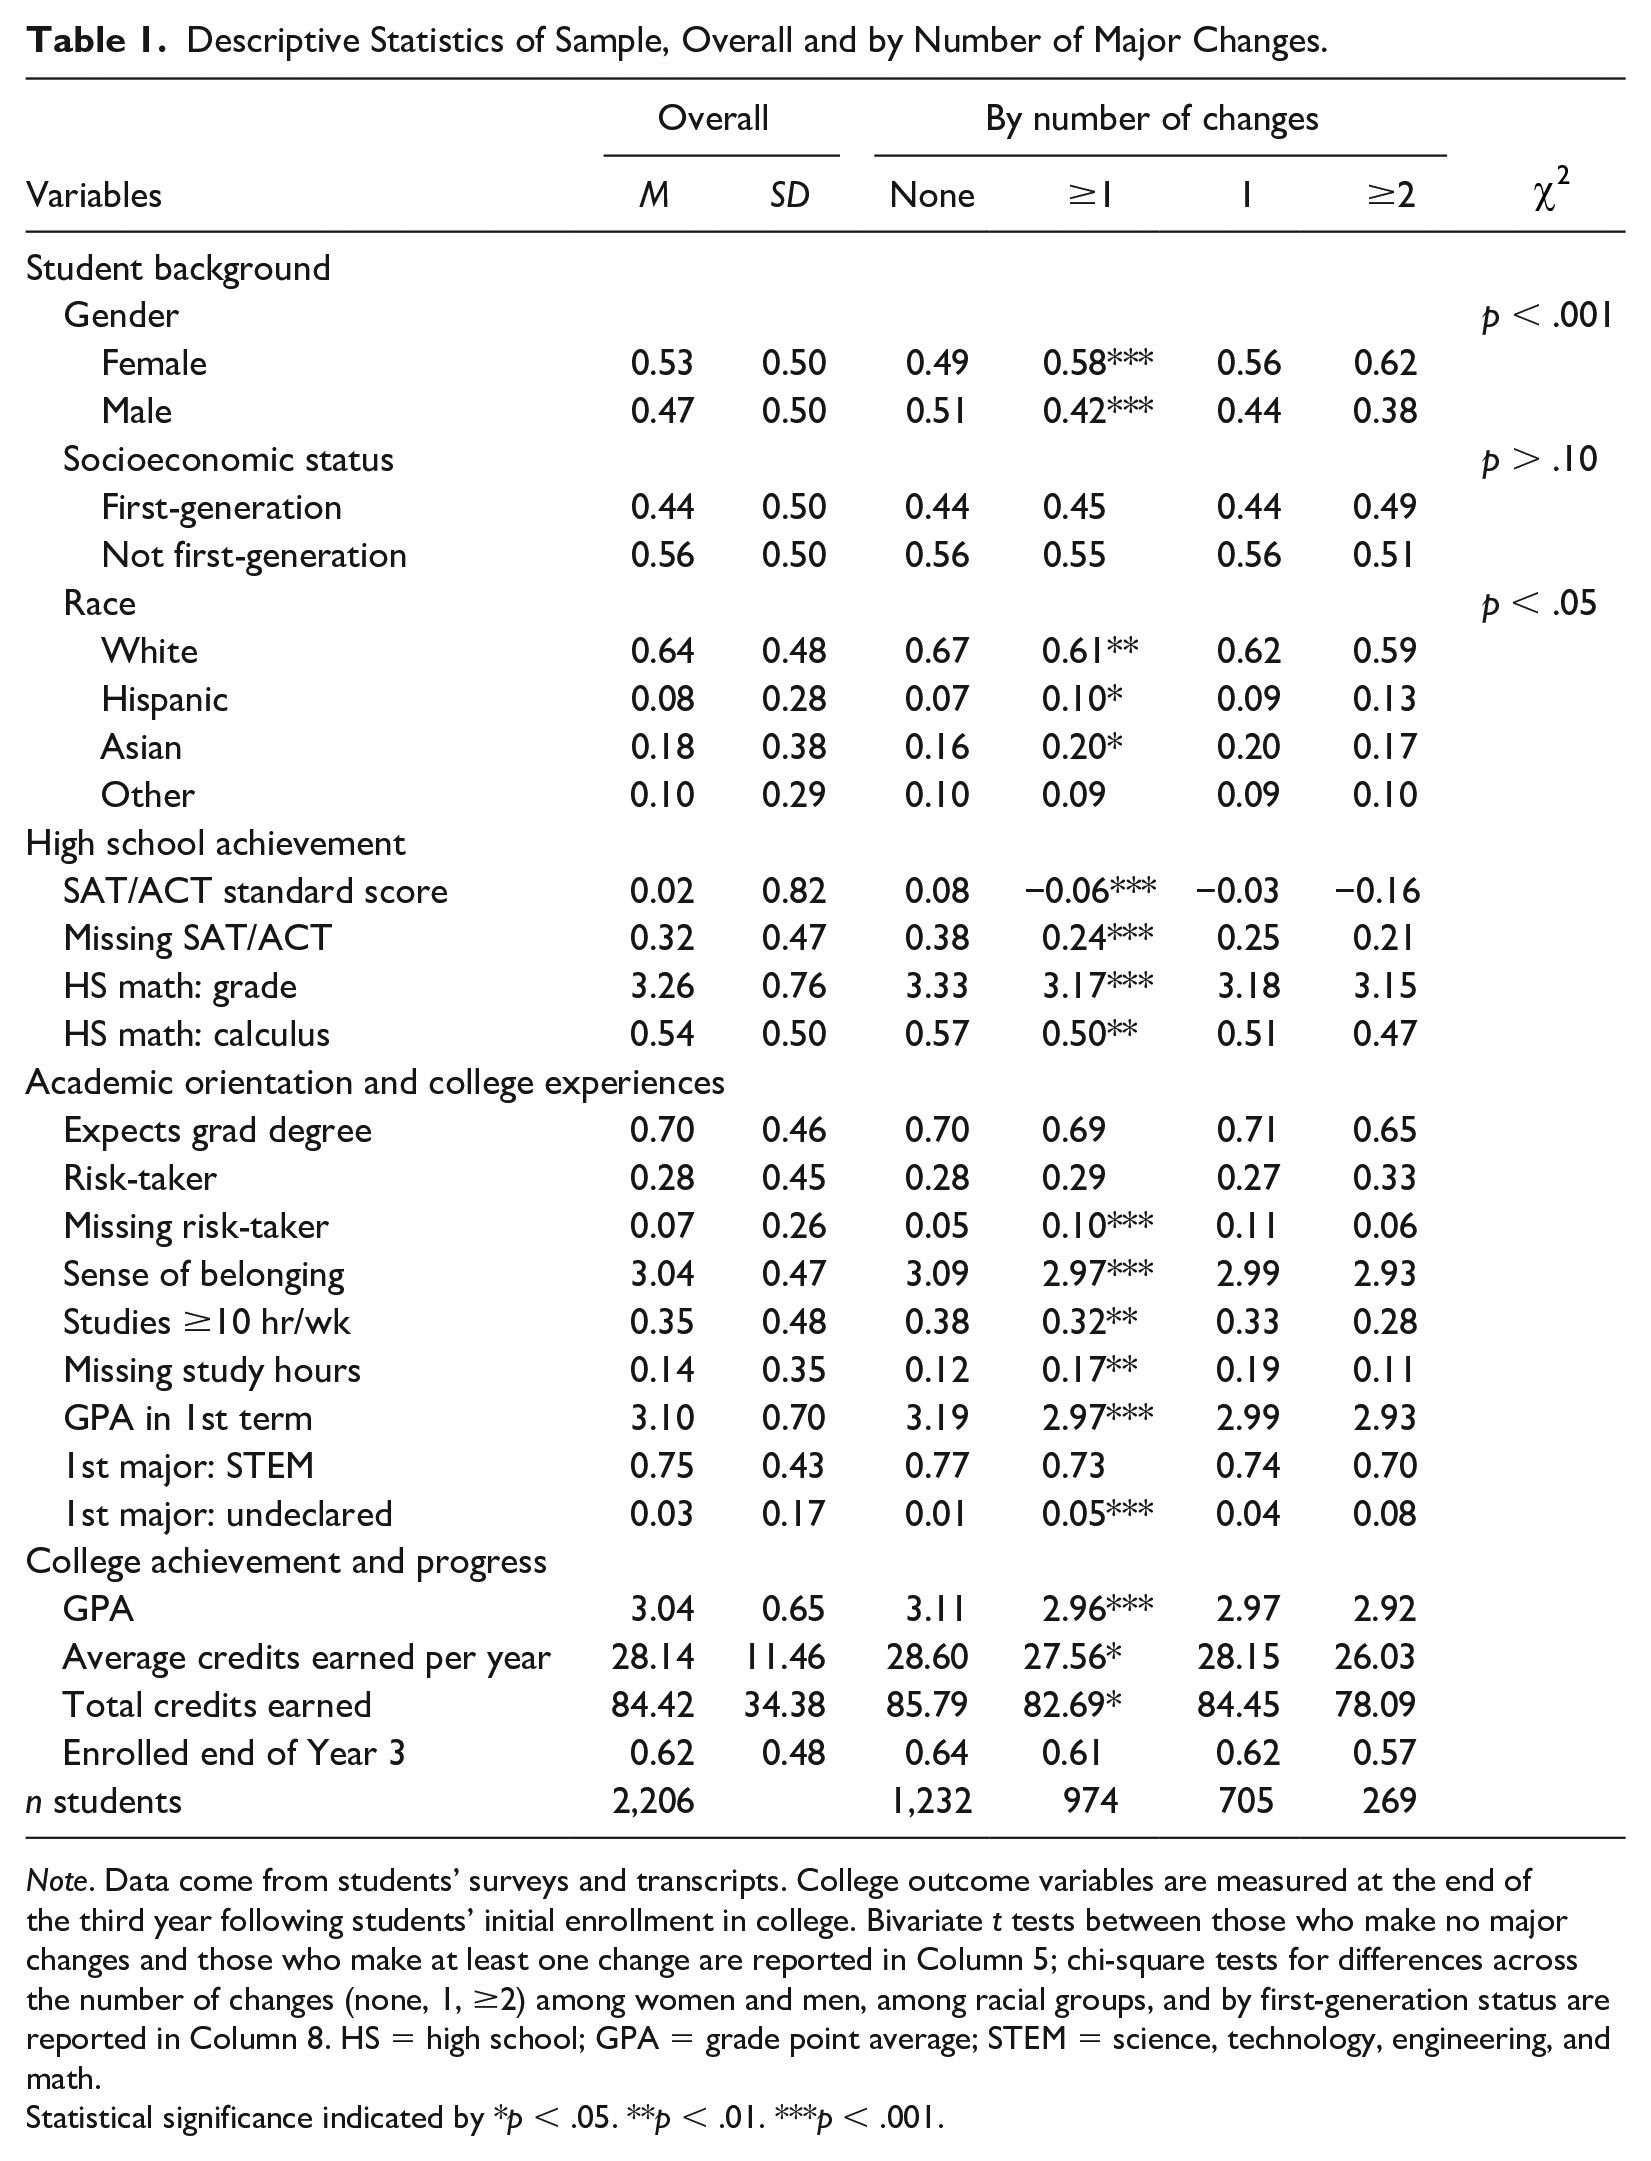
Note. Data come from students’ surveys and transcripts. College outcome variables are measured at the end of the third year following students’ initial enrollment in college. Bivariate t tests between those who make no major changes and those who make at least one change are reported in Column 5; chi-square tests for differences across the number of changes (none, 1, ≥2) among women and men, among racial groups, and by first-generation status are reported in Column 8. HS = high school; GPA = grade point average; STEM = science, technology, engineering, and math.
Statistical significance indicated by *p < .05. **p < .01. ***p < .001.
Measuring Students’ Majors over Time
In each round of the survey, respondents are asked about their current major. I code students as changing their major if their entry in one survey round does not match their entry in the next. Students entered their major in a text field, which I lightly edit for clarity and consistency. For example, I recode an entry of “EMET” to “Electrical mechanical engineering technology” (the full name of a major at one of the institutions). This ensures that a student who simply misspells or enters in the same major differently from one survey round to the next does not get coded as having changed their major. To the extent possible, this grouping has been cross-referenced with the three institutions’ major listings. Because not all students respond to every survey round, I fill in missing majors when it is likely that a student did not change their major. For a student who, for instance, lists “Sociology” as their major on their first round survey, does not complete a survey in the second round, and again lists “Sociology” as their major in Round 3, I impute their major in the second round using their listed major in Rounds 1 and 3. Students who explicitly indicate that they have not yet declared a major (either by answering the question “Have you declared a major?” in the negative, or by entering text for their major that indicates they have not yet declared one) are coded as “undeclared.”
Measuring Major Characteristics
To describe students’ majors, I categorize the detailed fields above into broader groupings. First, I create a seven-category measure with the following categories: agriculture; arts, humanities, and social sciences; business; education; health; science and math; and undeclared. Second, I aggregate students’ majors as either STEM or non-STEM. Students who list majors that fall under the broad categories of agriculture (with the exception of business-related agricultural fields), health, and science and math are coded as having chosen a STEM major; students listing majors that fall under the broad categories of arts, humanities, and social sciences; business (including business-related agricultural fields); education; and undeclared are coded as non-STEM. By observing students as they change their major within or between these sets of broader categories, we can get an initial sense of how different students’ majors are.
Additionally, I match students’ majors to the federal Classification of Instructional Programs (CIP) major codes. Not all of the 47 total two-digit CIP codes are present in the data; respondents’ majors can be matched to 30 of them. These codes allow me to incorporate information about students’ majors useful for describing how different majors are from one another and for testing hypotheses about the major-specific correlates of switching.
In particular, I use the two-digit CIP codes to attach institution-specific major composition information from the Integrated Postsecondary Education Data System (IPEDS). I aggregate data from 2013 to 2016 to smooth year-to-year noise. For each of the three institutions in the data, I calculate the proportion of bachelor’s degree graduates from each major who are women and who belong to an underrepresented minority (i.e., black, Hispanic, and American Indian). These major characteristic measures are standardized within institution. Additionally, similar to Carmen Astorne-Figari and Jamin D. Speer (2019), I merge major content information from the Baccalaureate and Beyond (BB) 2008/2012 survey. Each major is matched to the average number of credit hours taken in STEM by students with that major in the BB data. The BB data also provide measures of the average GPA and average SAT math score of students in each major. 2 To the extent that a major’s average GPA proxies for grading standards and students’ performance, it can be considered a measure of each major’s relative difficulty. And insofar as a major’s average SAT math score reflects students’ prior achievement and the strength of their college application, we can think of it as a measure of a major’s relative competitiveness. I standardize the BB measures within the full set of 47 two-digit CIP codes.
For undeclared students, I assign them the mean (i.e., 0 for the standardized variables). The assumption here is that individuals who have not yet chosen their initial major could select one, for instance, with a relatively high or relatively low STEM course content or female share. Recognizing the potential difference between students who change from one major to another and those who select a major after a period of being “undeclared,” I reran the analyses by excluding those who initially enter college with their major undeclared; results are substantively similar to those presented here and are available upon request.
Additional Measures
Student background
I measure students’ background with their gender (whether they are female), their race (a four-category measure including Hispanic, Asian, and other, with white as the referent group), and a proxy for their socioeconomic status (whether they are a first-generation college student). As can be seen in Table 1, just over half of this sample are female and 47 percent are male. Roughly two thirds of the sample are white, 8 percent are Hispanic, 18 percent are Asian, and 10 percent are classified as another racial group. About 44 percent of students in the sample are the first in their families to go to college.
High school achievement
I measure high school achievement and academic preparation for college with three variables. First, I combine SAT and ACT test scores into a single measure by standardizing each measure separately within the sample. Roughly one third of the sample is missing information about both their SAT and ACT scores, either because they did not take these exams or because their scores were not included in the administrative data. A dummy variable identifies these students, and I set their standardized combined score to 0 (the mean). Students’ prior academic achievement and preparation is additionally measured by their grade in the highest math course they took in high school. Students reported their math grade as a letter, which was recoded to a continuous 4.0 scale. Although these would seem to measure similar constructs, they are quite weakly correlated (
Academic orientation and experiences in college
Students also responded to a range of questions about their academic orientation and their experiences in college. In the first survey round, students are asked about their educational expectations. I code students as expecting to complete a graduate degree if they said that the highest level of education they expect to complete was a master’s degree, doctorate degree, medical degree, law degree, or other advanced degree; the referent for this measure includes those who expect to attend college but not complete a degree or to complete either an associate’s or bachelor’s degree. To capture a students’ commitment to their studies, I dichotomize students who report spending at least 10 hours per week studying (results are substantively similar if I use a higher cutoff of 15 hours). To measure students’ integration into the academic and social life of their institution (Tinto 1975), I average students’ responses to seven questions about their sense of belonging. To each of the following questions, students responded on a 4-point scale ranging from “strongly disagree” (coded as 1) to “strongly agree” (coded as 4): (1) I feel that I belong at this college; (2) I am comfortable with the students in my classes; (3) My professors know who I am; (4) I often feel alone at this school; (5) If I have trouble in class I can turn to a classmate for help; (6) Faculty at this school want their students to succeed; and (7) If I had to do it over again, I’d go to college somewhere else (questions 4 and 7 were reverse-coded). Finally, changing one’s major may involve a certain degree of risk. Survey respondents were asked, “In general, how likely are you to take risks?” They responded on a scale of 1 (“not at all likely”) to 5 (“extremely likely”), and students were coded as risk-takers if they responded that they were very or extremely likely to take risks.
College achievement and progress
Measures of students’ college achievement (grade point average) and progress (number of credits attempted and earned) come from their transcripts. Finally, all models include fixed effects for students’ cohort 3 and their institution to capture any unmeasured temporal variation or school-specific factors related to students’ propensity to change majors or to their college performance and persistence.
Analytical Plan
The analysis proceeds in four stages. To address the first research question, I describe the prevalence and timing of major switching. These patterns of major change are summarized with descriptive statistics and Kaplan–Meier survival curves, where “survival” refers to not changing one’s major.
Second, in order to investigate the individual-level and major-specific determinants of changing one’s major, I estimate a series of Cox proportional hazards models for repeated events (Box-Steffensmeier and Zorn 2002). Students may change their major at any time they are enrolled in their postsecondary institution. In this analysis, they are treated as “at risk” of major change throughout the entire period from their initial enrollment through the end of their third year (at which point they were last surveyed) or until they are right-censored due to attrition from the survey or from the institution at which they were recruited. Furthermore, because students can (and often do) change their majors more than once, I allow for the possibility of repeated events by returning individuals to the risk set immediately after a change.
In conceptualizing the choice of major as a process that unfolds over time, it is necessary to determine how to measure duration. A standard approach would have been to use elapsed time—that is, the number of years or academic terms since students’ initial enrollment in college. But elapsed time is likely a noisy measure of persistence in and progress through postsecondary education, particularly as the time spent enrolled increases. This definition cannot distinguish between enrolled time and stop-out time (Yue and Fu 2017). It is also unable to account for the variation in enrollment intensity, or how quickly or slowly students take and complete courses. Indeed, many students take breaks after initially enrolling or they attend part-time (Bound, Lovenheim, and Turner 2012). Zachary Mabel and Tolani A. Britton (2018) show that both the average number of credits attained and the variation therein increase over time.
Instead, I measure duration in terms of students’ academic momentum and progress (Adelman 1999; Attewell et al. 2012)—specifically, by the number of course credits they attempt. This measure of duration incorporates students’ decisions to enroll in college as well as their enrollment intensity. Another approach would have been to use the number of earned or completed credit hours. However, a focus solely on successfully completed credits risks ignoring important information that students might get from courses they enroll in but do not finish. A student who attempts to complete credits in courses related to a given major (or unrelated, especially if they are thinking of switching out of their current major), even if they fail to complete them, likely learns something about their potential program of study and about their performance and interests.
To account for the ordering of events—as the second major change cannot occur before a student changes their major a first time—the model is stratified by the event number. In so doing, the baseline hazard is permitted to vary by event number while the covariate parameters remain constant across the ordered events. Stratifying by event number preserves the ordering of events, rather than assuming that such ordering is not important. To address the likelihood that events within a given individual are not independent, I cluster standard errors by student.
Third, focusing on students who switch their majors, I compare the majors they leave to the new ones they enter on a range of academic and nonacademic factors. I describe students’ former and new majors in terms of their competitiveness (a major’s average SAT math score), difficulty (a major’s average GPA), STEM course content, and the proportion of bachelor’s degree recipients from each major who are female or who belong to an underrepresented minority.
Fourth, to address this study’s last research question, I examine the consequences of major switching for patterns of gender segregation and for students’ postsecondary performance, progress, and persistence. I begin by documenting gender segregation using an index that contrasts the female-to-male ratio in each broad major to the “average” field of study (Charles and Bradley 2009; Charles and Grusky 1995). Each major-specific index,
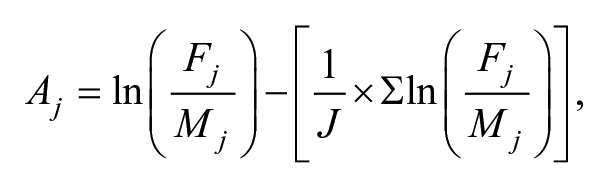
Where
Finally, to explore the individual-level short- and longer-term consequences of changing one’s college major, I estimate a series of multiple regression equations with various dependent variables. Students’ academic achievement is measured in two ways. First, students’ cumulative GPA is calculated through their third year in college from their transcripts. Second, I calculate the difference between student’s GPA in their first term to their cumulative GPA at the end of their third year in college; positive values indicate their third-year GPA was higher than their initial GPA, while negative values indicate they performed better during their initial enrollment compared to their overall performance across three years. A third outcome measures students’ progress and is defined as the total number of earned (or completed) credit hours at the end of their third year in college. This measure differs from the number of credits that students attempt. Whereas the number of attempted credits include any courses that a student registered for in a given term, students’ number of earned credits excludes courses from which they withdrew, courses that they repeated later (in order, for instance, to improve upon their grade), and courses in which they failed or received an incomplete grade. Last, students’ persistence is measured dichotomously based on whether or not a student was enrolled through the third year following their initial enrollment. As the first three dependent variables are continuous and approximately normal in their distribution, I use ordinary least squares regression. For the dependent variable measuring enrollment at the end of the third year, I use logistic regression and report odds ratios.
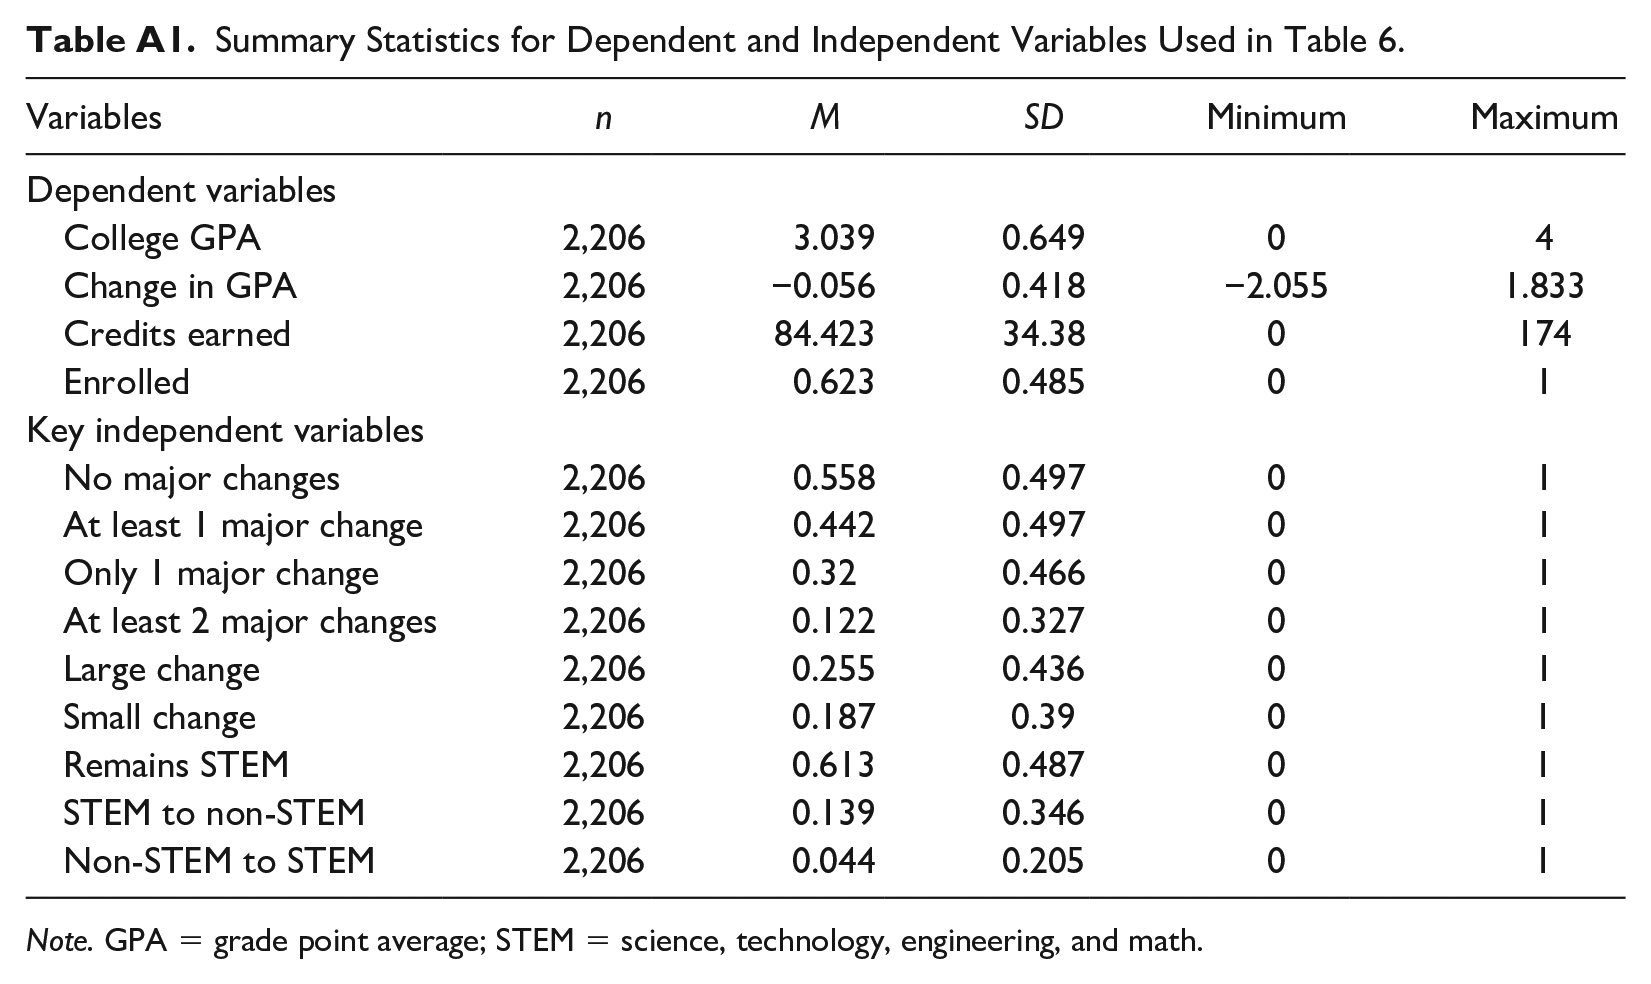
For each of these four dependent variables, I estimate separate models with four sets of key independent variables measuring major change. First, I compare all those who changed their major at least once to those who never changed their major. Second, I disaggregate the first group into students who change their major (1) once or (2) two or more times, comparing these groups to students who never change their major. Third, students are divided into those who make at least one large change (defined as switching between broad major categories) and those who make only small changes (defined as those who change majors within the same broad category); again, the referent group consists of students who do not change their major. Finally, I categorize students based on their movement into and out of STEM majors: (1) students who begin in a STEM field and do not switch out of STEM; (2) students who begin in a STEM field and switch into a non-STEM major; (3) students who begin in a non-STEM field and switch into a STEM major; and (4) students who begin in a non-STEM field and do not change into a STEM major (which serves as the referent group). Summary statistics for the dependent and key independent variables used in these analyses can be found in Table A1 of the Appendix.
Findings
How Prevalent Is Changing Majors?
Changing majors at least once in the three years following students’ initial enrollment is widespread. As Figure 1 illustrates, nearly one third of students change their majors once and another roughly 12 percent change their majors two or more times. While most students in this latter group change their majors twice (83 percent), a nontrivial share (17 percent) changes their major three or four times as well. All told, over 4 in 10 students in this sample make at least one major change through their first three years enrolled in college. These figures are on par with nationally representative estimates. As the National Center for Education Statistics found in a recent report, about one third of students who enrolled in bachelor’s degree-granting institutions ever changed their major within three years of their initial enrollment in 2011–2012 (Leu 2017). Of those who change their major once, about one quarter (27.6 percent) go on to make at least one more change.
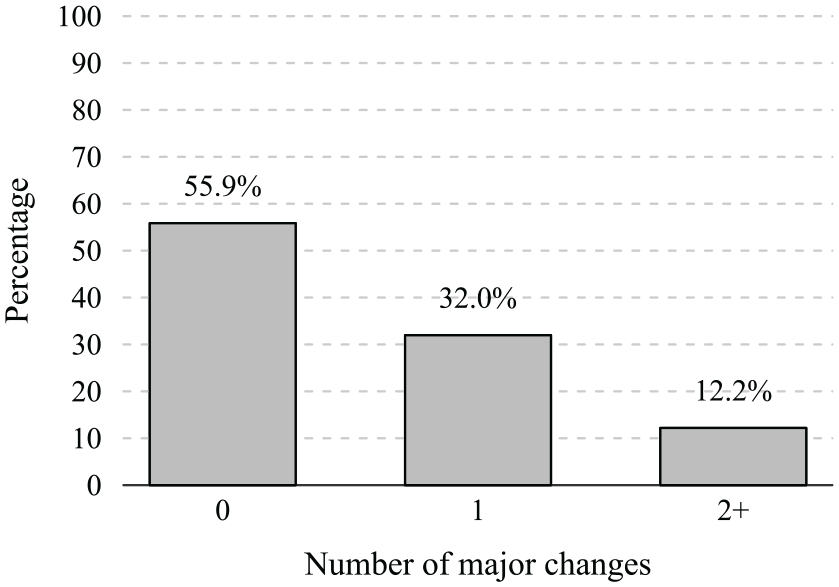
Distribution of students by their total number of major changes.
Of course, the percentages displayed in Figure 1 give only a sense of the overall rate at which students change their major. To provide an initial indication of the timing as well as of the shifting rate given differential attrition or persistence through the first few years of college, I estimate two Kaplan–Meier survival curves. Figure 2 illustrates the results by showing the cumulative incidence of major switching over the number of credits attempted. Students were at risk of making their first major change (the green line) until they initially changed their major or until they were censored out of the data; similarly, students were at risk of making their second major change (the orange line) until either their second change or censoring.
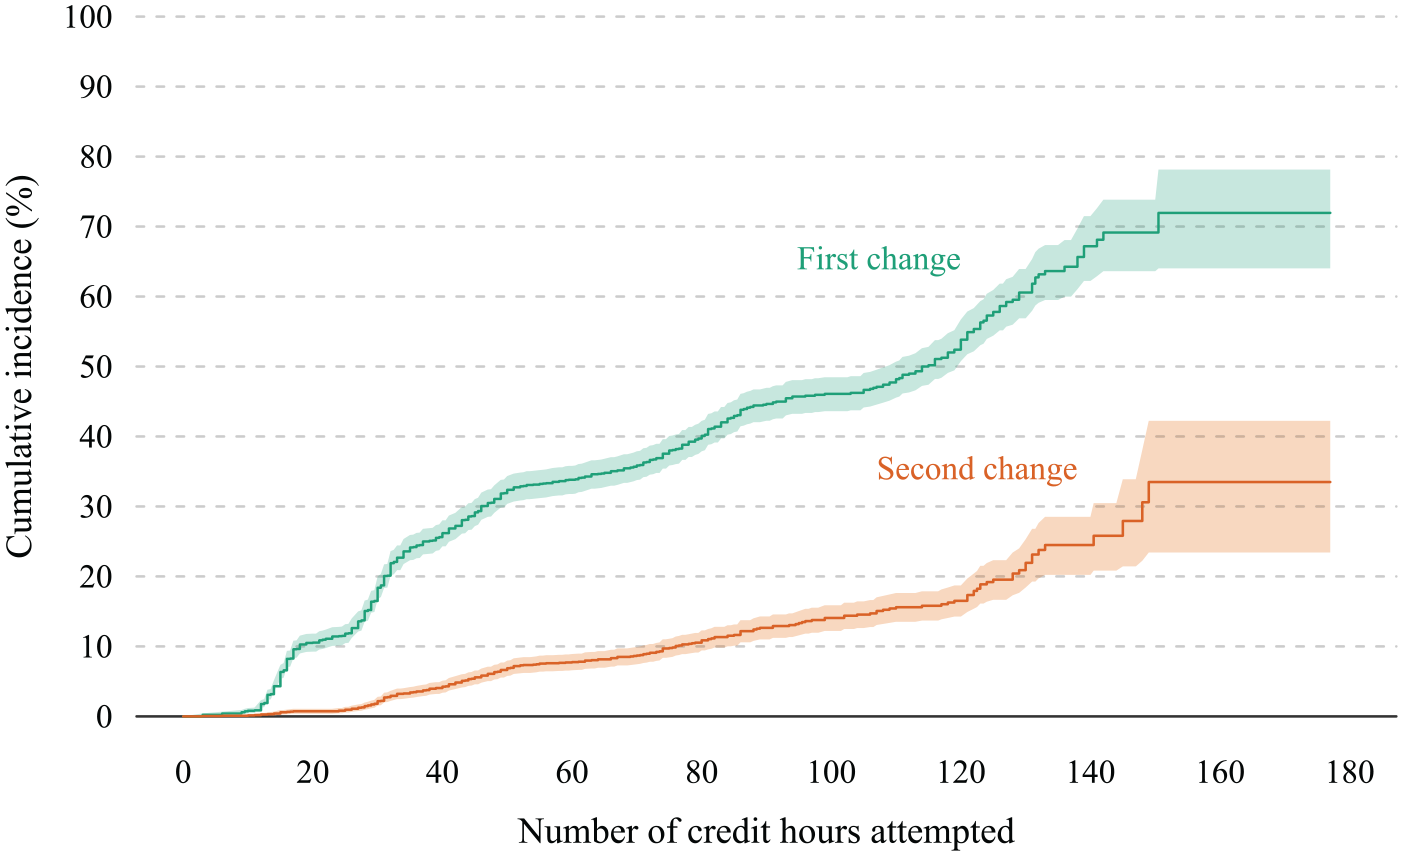
Cumulative incidence of major switching over credits attempted.
Figure 2 shows large increases in the likelihood of making a first major change between about 10 and 50 attempted course credits (i.e., during the first few semesters of college). The cumulative incidence then levels off and increases more steadily through the median number of credits attempted (just shy of 120 credits), at which point it increases quickly again. Of those who persist to 140 attempted credits, roughly 70 percent have changed their majors. The survival curve fit to the probability of changing one’s major for the second time evinces a more gradual and consistent rise in the cumulative incidence over time. At about 140 credits, a quarter of students have changed their majors for a second time. 4
Who Changes Their Major?
How do students who change their majors at least once during the first three years of college compare to those who do not switch majors? A few patterns stand out from among the summary statistics displayed in Table 1. Women appear more likely to change their major—and to change more often—than men. While women account for 49 percent of students who never change their major, they comprise 58 percent of students who switch majors at least once. By contrast, men comprise just over half of those who do not switch majors, and only 42 percent of those who change at least once. Put differently, whereas nearly half the women in the sample (48.3 percent) change their major at least once, a smaller percentage of men (39.5 percent) do so. And about 15 percent of women change their major at least twice, compared to less than 10 percent of men. Over the study period, women change their major on average of 0.66 times, and men change on average 0.51 times (this difference is statistically significant at
Major switchers also have lower prior academic ability. Compared to non-switchers, they have lower SAT/ACT scores and lower achievement in their high school math classes, and they are less likely to have taken calculus in high school. Major switchers further appear to feel less like they belong at their institution, and to perform less well in their college classes, as measured by their college GPA both in their first term and throughout their first three years. The differences in terms of SAT/ACT scores, calculus course-taking in high school, and a sense of belonging in college are especially pronounced between those who do not change their major and those who switch majors at least twice.
I examine the determinants of major switching more systematically in Table 2, which presents the results as hazard ratios from a series of repeated-event Cox proportional hazards models. Model 1 relates the hazard of switching majors to students’ background and prior academic achievement and preparation. While students’ background (as measured by their gender, race, and first-generation status) does not appear related to students’ hazard of changing majors, their prior achievement does appear to play a role. A one standard deviation increase in a student’s SAT/ACT score corresponds to a statistically significant 21.2-percent decrease in the hazard of major change at any given time. Similarly, a one-point increase in a student’s high school math grade (the equivalent, for instance, of receiving a “B” instead of a “C”) is related to a 14.2-percent decrease in their hazard of choosing a new major. Both of these relationships are quite robust, retaining their statistical significance across most of the models (with the exception of high school math grade in Model 2).
Recurrent Event History Models of Major Switching.
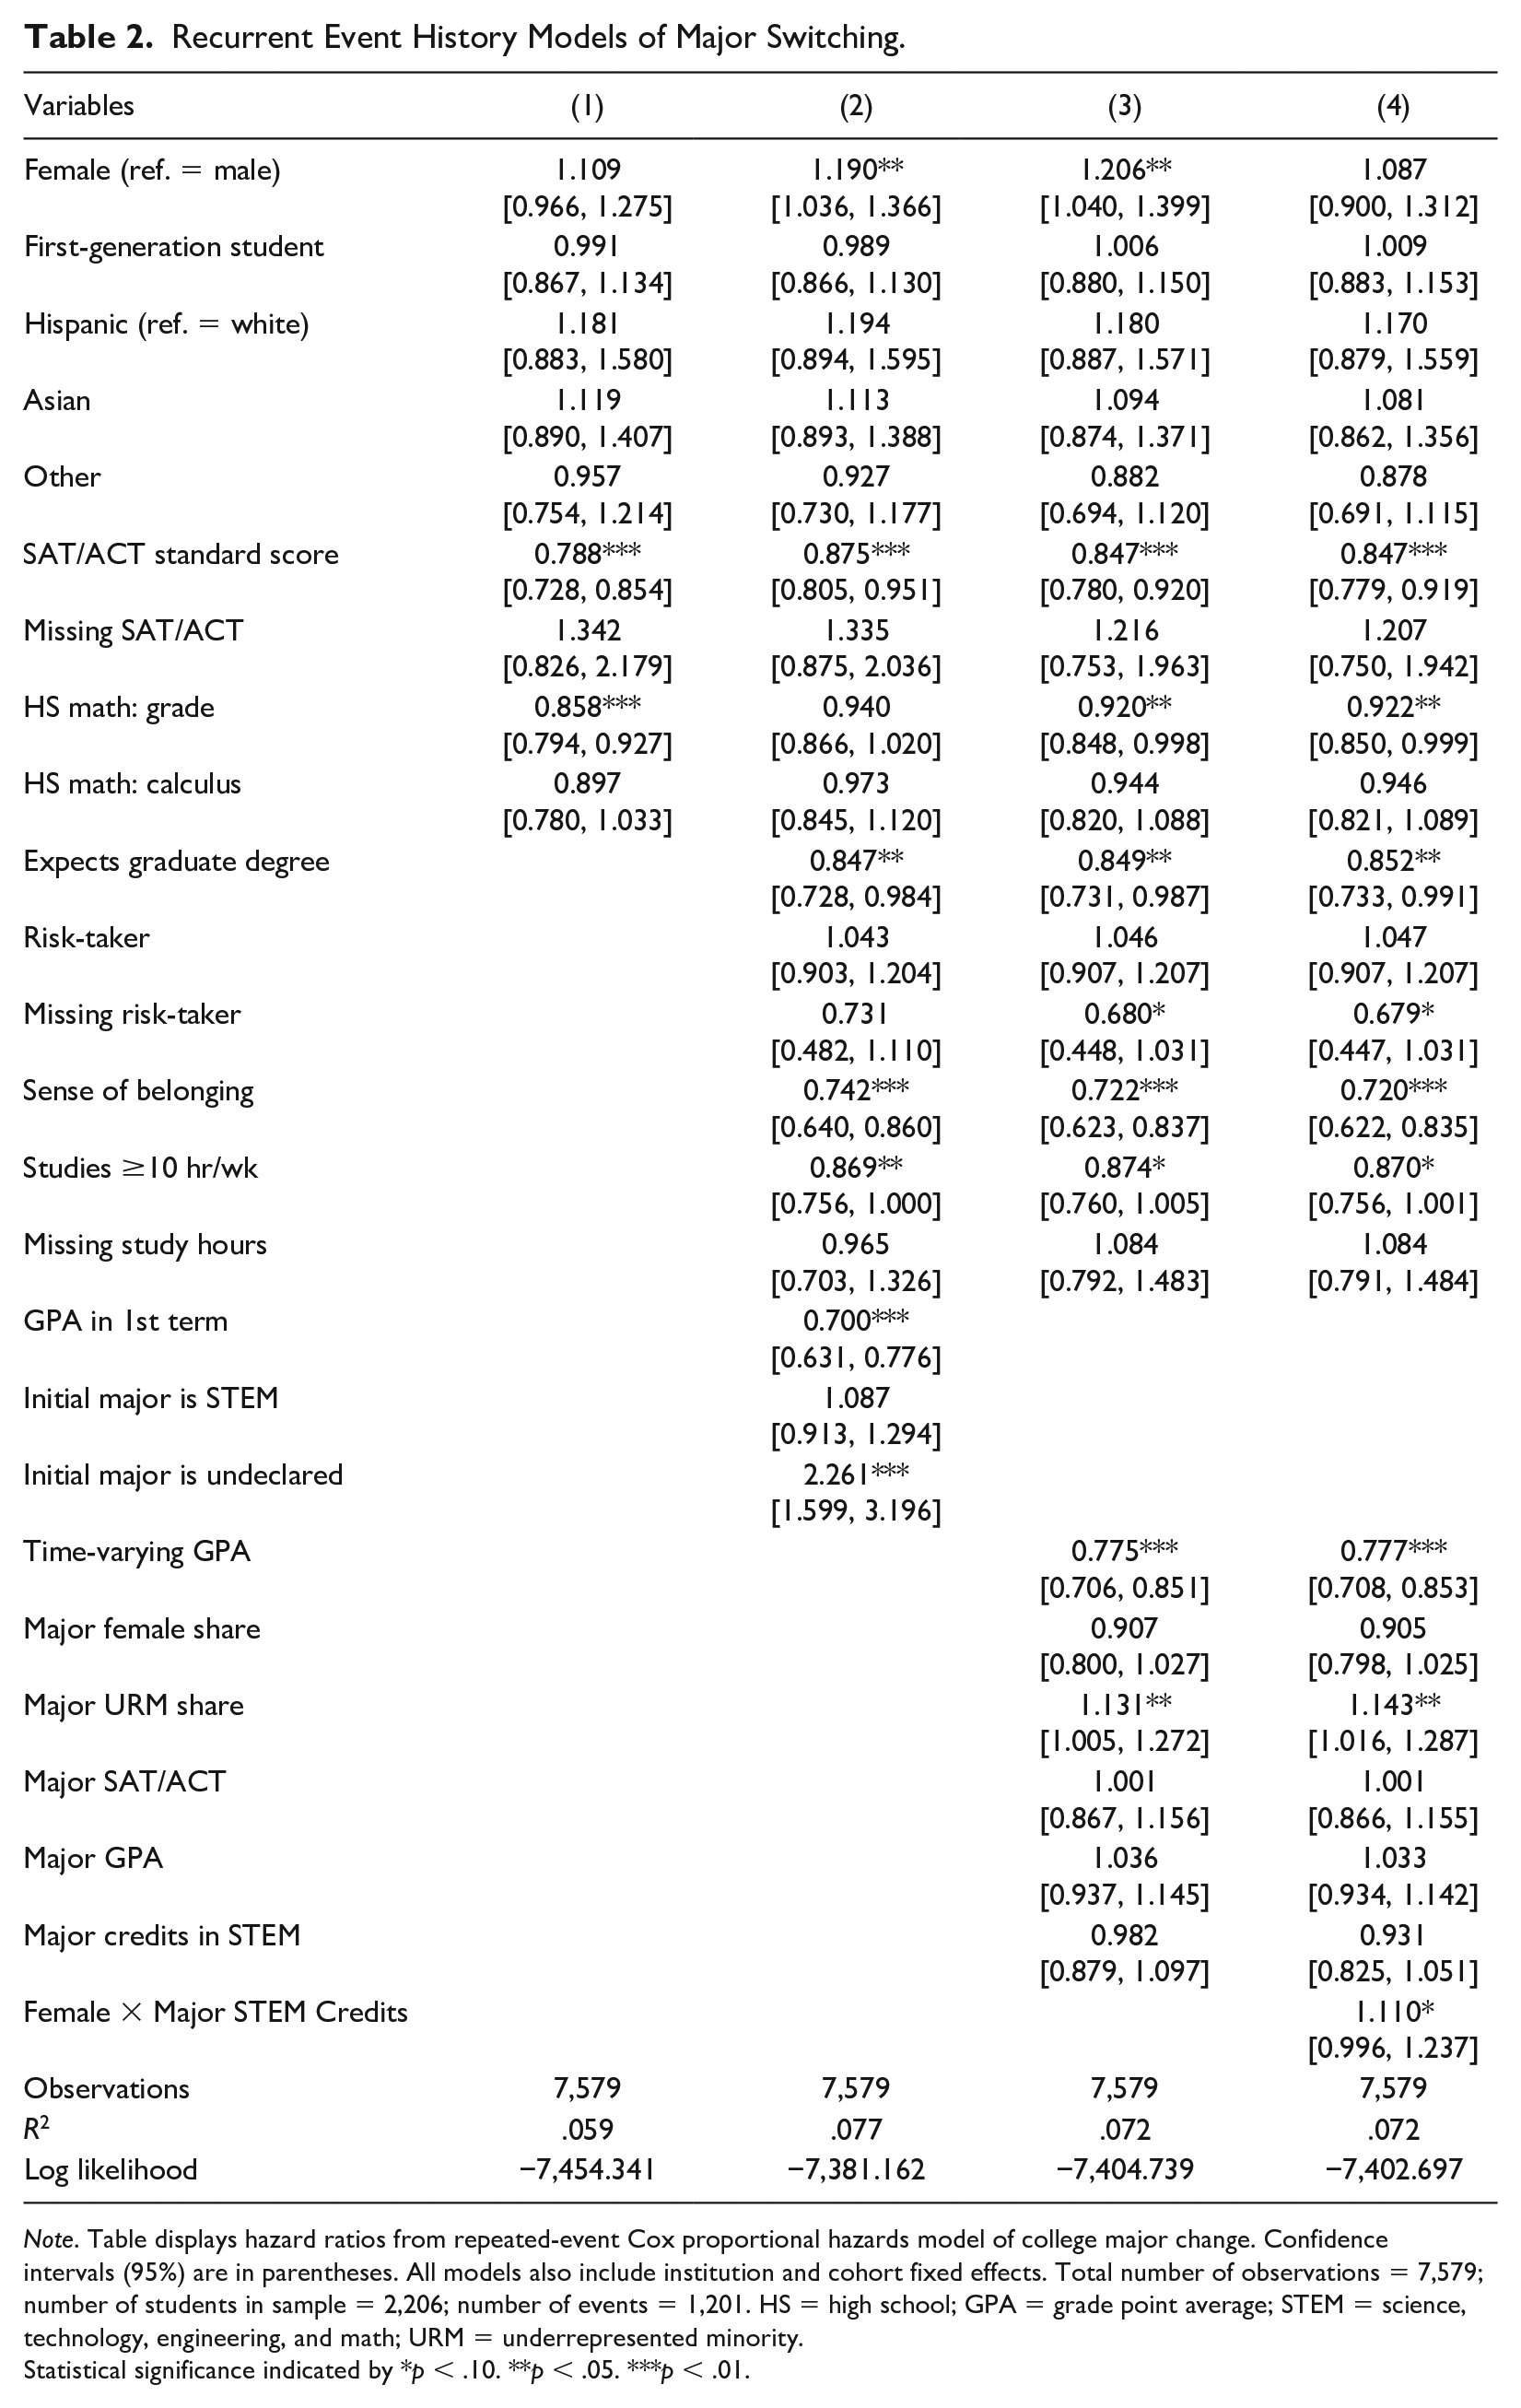
Note. Table displays hazard ratios from repeated-event Cox proportional hazards model of college major change. Confidence intervals (95%) are in parentheses. All models also include institution and cohort fixed effects. Total number of observations = 7,579; number of students in sample = 2,206; number of events = 1,201. HS = high school; GPA = grade point average; STEM = science, technology, engineering, and math; URM = underrepresented minority.
Statistical significance indicated by *p < .10. **p < .05. ***p < .01.
In Model 2, I add covariates measuring a student’s academic orientation and their initial experiences in college. If a student expects that they will eventually continue on in their education and complete a graduate degree, their hazard for switching majors declines by about 15 percent. This suggests that students with a clearer picture of their educational goals may also have a clearer sense of the area in which they would like to focus during their undergraduate studies. Students who feel more connected to and integrated into their academic community—that is, those with a higher sense of belonging—are also less likely to switch majors, as are those who perform better in their first-term classes. Unsurprisingly, students who begin without having declared a field of study are over twice as likely to pick a new major.
Because choosing a major is a process that unfolds over time as students absorb new information about their own performance and their chosen field, Model 3 replaces the static measures of students’ academic experiences in college (i.e., their performance in the first term and their initial choice of major) with time-varying measures. In particular, students’ GPA is measured separately (i.e., non-cumulatively) in each term. Additionally, students’ current majors are characterized by their composition (the proportion of students who are female or who belong to an underrepresented minority), their relative competitiveness (the average SAT/ACT score of students with that major) and difficulty (the average GPA), and their course content (the average number of credit hours taken in STEM by students with a given major). All major-specific measures are standardized to aid with interpretation. After they change their major, these characteristics take on the values of their new major for the next period at which they are at risk for another potential change. A students’ term-specific GPA continues to be significantly related to whether or not they change majors. Students who are struggling academically in their current major have a higher hazard of switching to a new one. Additionally, students appear to be sensitive to the proportion of underrepresented minority students in a given major. Given a one standard deviation in this share, students’ expected hazard to change their major increases by 13.1 percent.
While the average number of credit hours taken in STEM by students with a given major has no statistically significant overall relationship with the hazard of choosing a new major (as in Model 3), women do appear to be sensitive to amount of STEM coursework required by their major. In Model 4, I interact a student’s gender with the relative number of STEM credit hours a student is expected to take as part of their major. To interpret this interaction (statistically significant at
How Different Are Students’ Majors?
The findings thus far indicate important differences among students who do and do not change their majors. In the remaining sections, I examine the implications of changing one’s major in college. When students change their major, how different is their new major compared to their current one? How does major switching contribute to gender field of study segregation? Do major changes lead students to a better fit with their academic program, as indicated by their academic performance (GPA), progress (credit attainment), and persistence (still enrolled at the end of their third year)?
Table 3 provides an initial sense of how different students’ first, second, and third majors are by showing the percentage of switchers who make relatively large changes—that is, switching from a major in one broad category to a major in a different broad group, or switching into or out of a STEM major. Of the 44.2 percent of the sample who changes their major at least once, over half (53.4 percent) make relatively large changes across broad major groups. A larger share of students making their first change choose to leave STEM majors (28.0 percent) than enter a STEM major from a non-STEM field (9.0 percent). When students make their second change—from their second to their third major—nearly two thirds (61.7 percent) switch across broad majors, and about 1 in 5 students either enter or leave a STEM field.
Degree of Change Among Students Who Switch Majors.
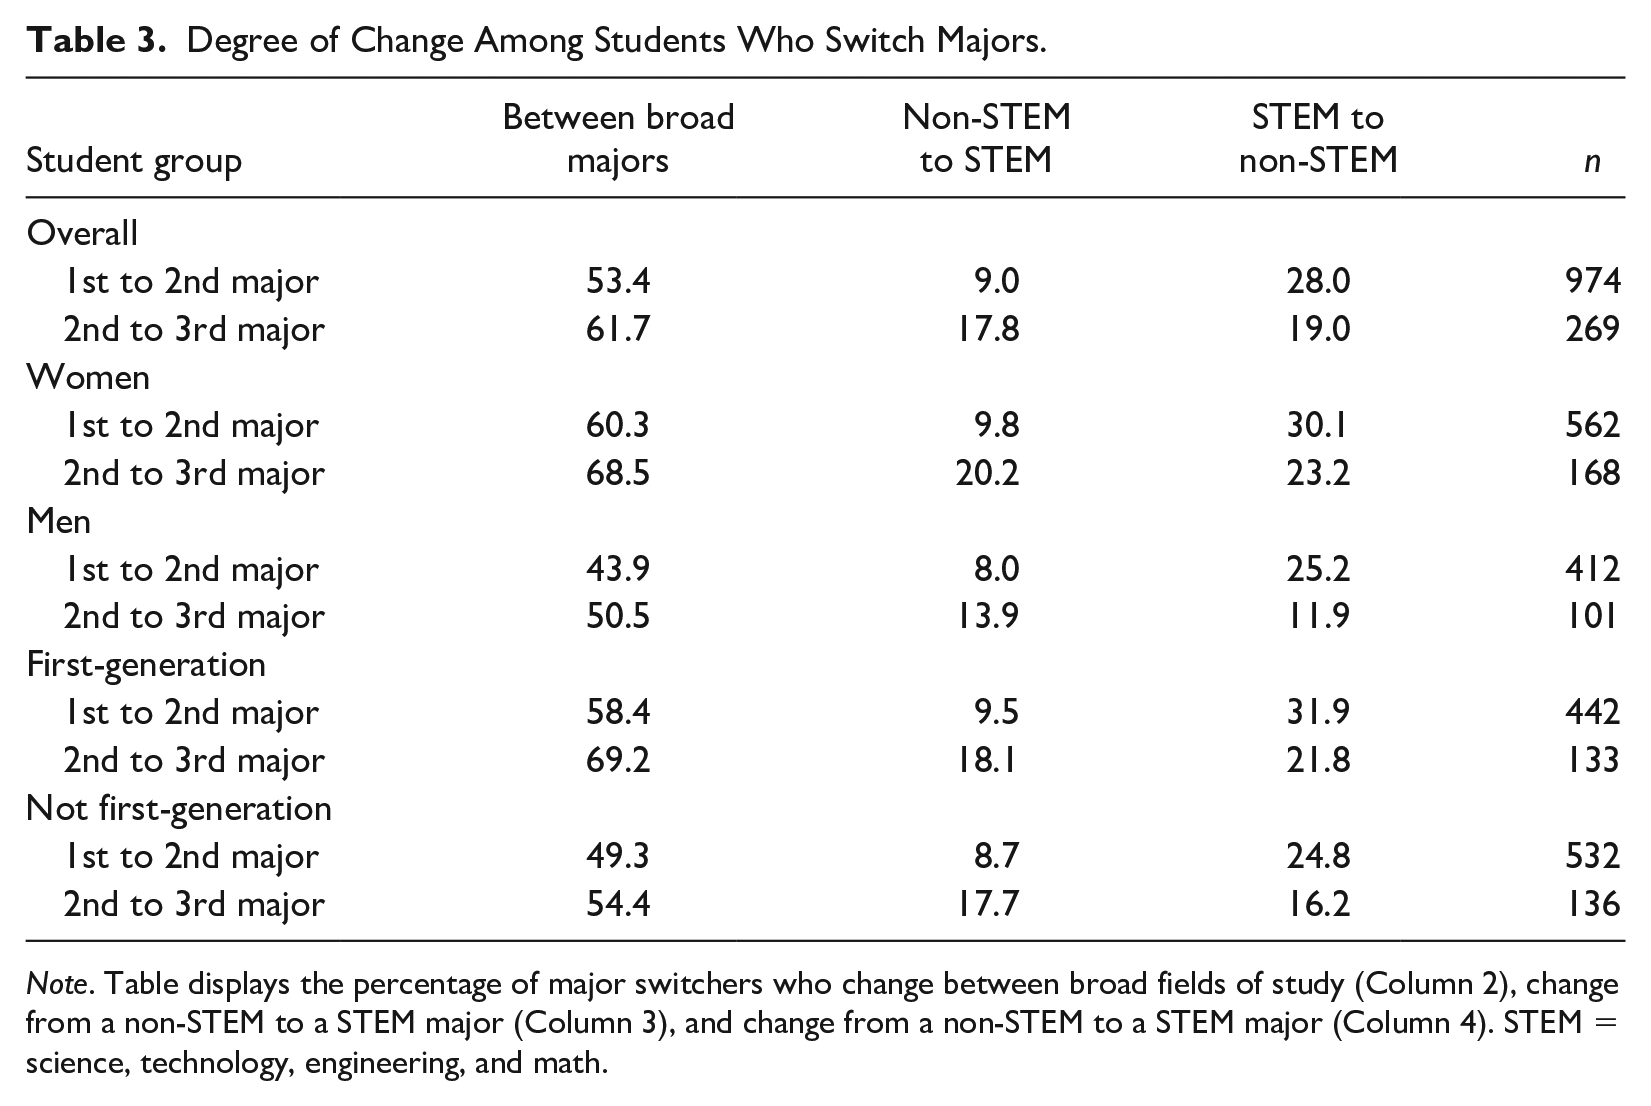
Note. Table displays the percentage of major switchers who change between broad fields of study (Column 2), change from a non-STEM to a STEM major (Column 3), and change from a non-STEM to a STEM major (Column 4). STEM = science, technology, engineering, and math.
Women and men display different patterns of switching behavior in this respect. Whether making their first or second change, a much higher percentage of women than men move between broad major groups. Women are also slightly more likely than men to switch into a STEM field, but these differences do not compensate for the much higher rate at which women leave STEM majors across switches. While a high share of women switchers leave STEM fields both between their first and second majors (30.1 percent) and between their second and third majors (23.2 percent), the share of men switchers leaving STEM between their second and third majors is relatively low (11.9 percent). Although first-generation and non-first-generation students change their majors at similar rates, there are differences in the kinds of changes they make. Among those who change their majors, first-generation students are substantially more likely than their higher social class peers to make relatively large switches between broad fields and to switch out of STEM fields.
For a more in-depth look at how the characteristics of students’ new majors compare to the fields they are leaving, we turn to Table 4. In addition to showing the major characteristics of students’ initial major—both for the overall sample and for the subsample of students who change majors—Table 4 shows the differences between students’ first and second majors and between their second and third majors. Since all major-specific measures are standardized, these differences can be interpreted in terms of standard deviation units.
Comparing Students’ First, Second, and Third Majors.
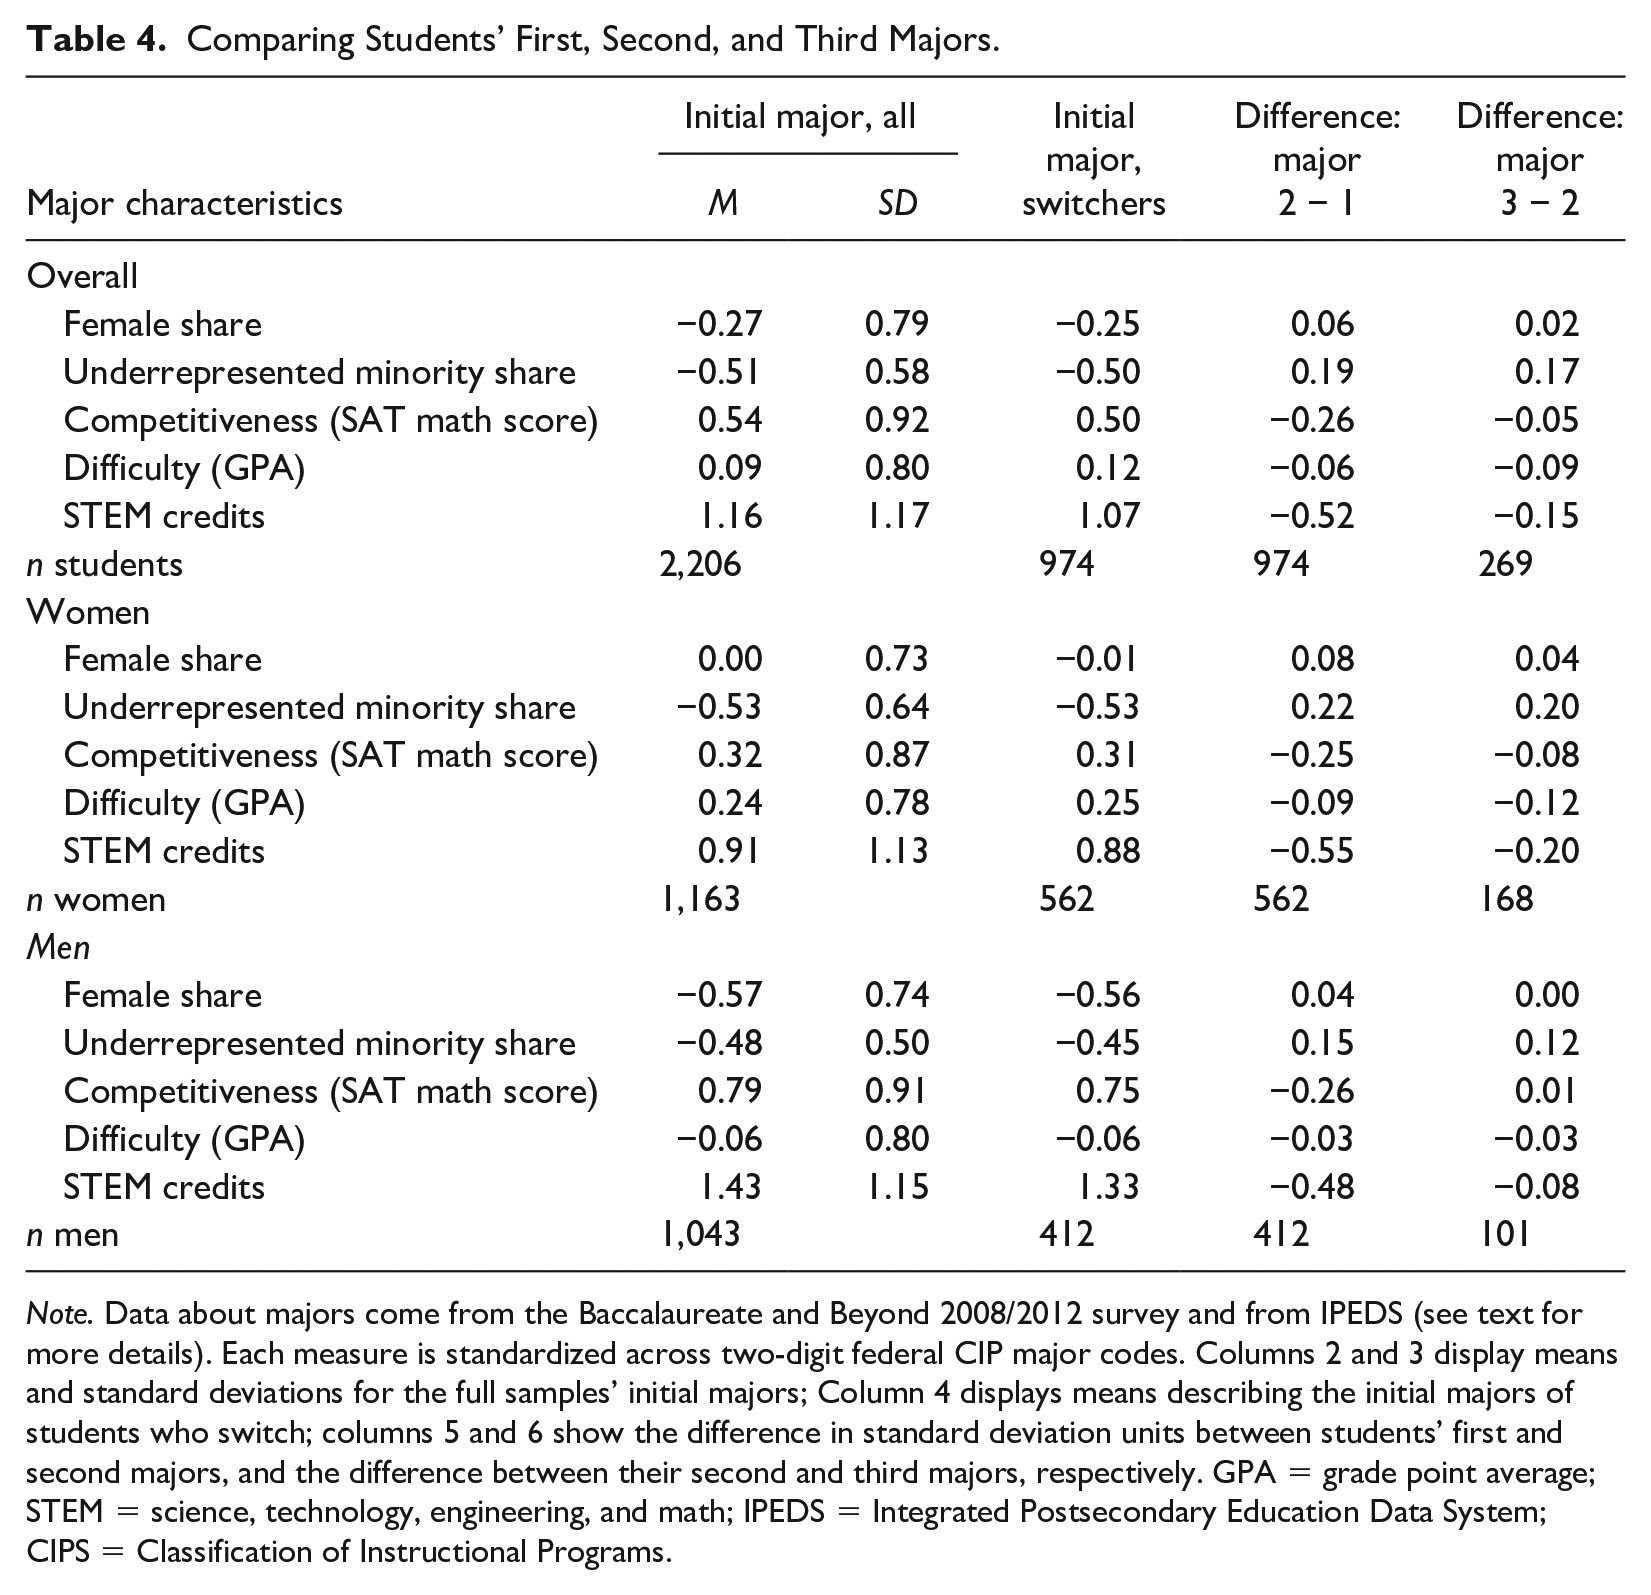
Note. Data about majors come from the Baccalaureate and Beyond 2008/2012 survey and from IPEDS (see text for more details). Each measure is standardized across two-digit federal CIP major codes. Columns 2 and 3 display means and standard deviations for the full samples’ initial majors; Column 4 displays means describing the initial majors of students who switch; columns 5 and 6 show the difference in standard deviation units between students’ first and second majors, and the difference between their second and third majors, respectively. GPA = grade point average; STEM = science, technology, engineering, and math; IPEDS = Integrated Postsecondary Education Data System; CIPS = Classification of Instructional Programs.
Relatively minor differences exist when comparing the initial major characteristics overall to those of the students who go on to change their majors at least once. This is also true when comparing first-generation students to their higher social class peers. Women, however, start in very different majors than their male counterparts. The initial majors selected by women tend to be more difficult (as measured by a major’s standardized average GPA) but less competitive (proxied by a major’s standardized average SAT math score) than those initially selected by men. Women also start out in majors that are more heavily female and require fewer STEM credit hours. These gender differences hold when looking at both the full sample and the subsample of switchers.
As indicated in the last two columns of the top panel in Table 4, students who change their field of study once switch into majors that are, on average, easier, less competitive, and require fewer STEM credit hours. They are also entering majors with a higher relative share of underrepresented minority students than their initial majors. The differences between students’ second and third majors are less pronounced than the differences between their initial major and their second, although students still seem to be seeking out easier and less STEM-intensive majors. Women and men evince similar patterns in their switch from their first to their second majors. Both seek majors that are less competitive, have higher shares of underrepresented minority students, require fewer STEM credit hours, and are similar in terms of their share of female students. Importantly, however, they are switching from initial majors with very different characteristics, as noted above. Furthermore, in making a second change and moving from their second to their third major, women continue to seek out majors that are less competitive, have higher shares of underrepresented minority students, and similar levels of female representation. Women’s third majors also require substantially fewer STEM course credits than their second majors, while the STEM course requirements for men decline more modestly. This is similar to the finding from Table 3, and suggests that the underrepresentation of college women in STEM fields begins at the outset of college and worsens as students continue through the major choice process.
What Are the Consequences of Major Switching?
Given these differing patterns among women and men, how does switching shape gender segregation across fields of study? Table 5 tracks major-specific and overall gender segregation indices as students change their majors. The major-specific indices provide strong evidence that majors become more segregated as students make changes. Among the full sample (shown in the top panel), when students first enter college and make their initial major choices, women are overrepresented in health, education, and agriculture, 7 and they are most underrepresented in science and math fields. Their underrepresentation in science and math worsens as many of the students in the sample select a second and even third major. The overall segregation index (A) ticks upward as well.
Gender Segregation across Fields of Study.
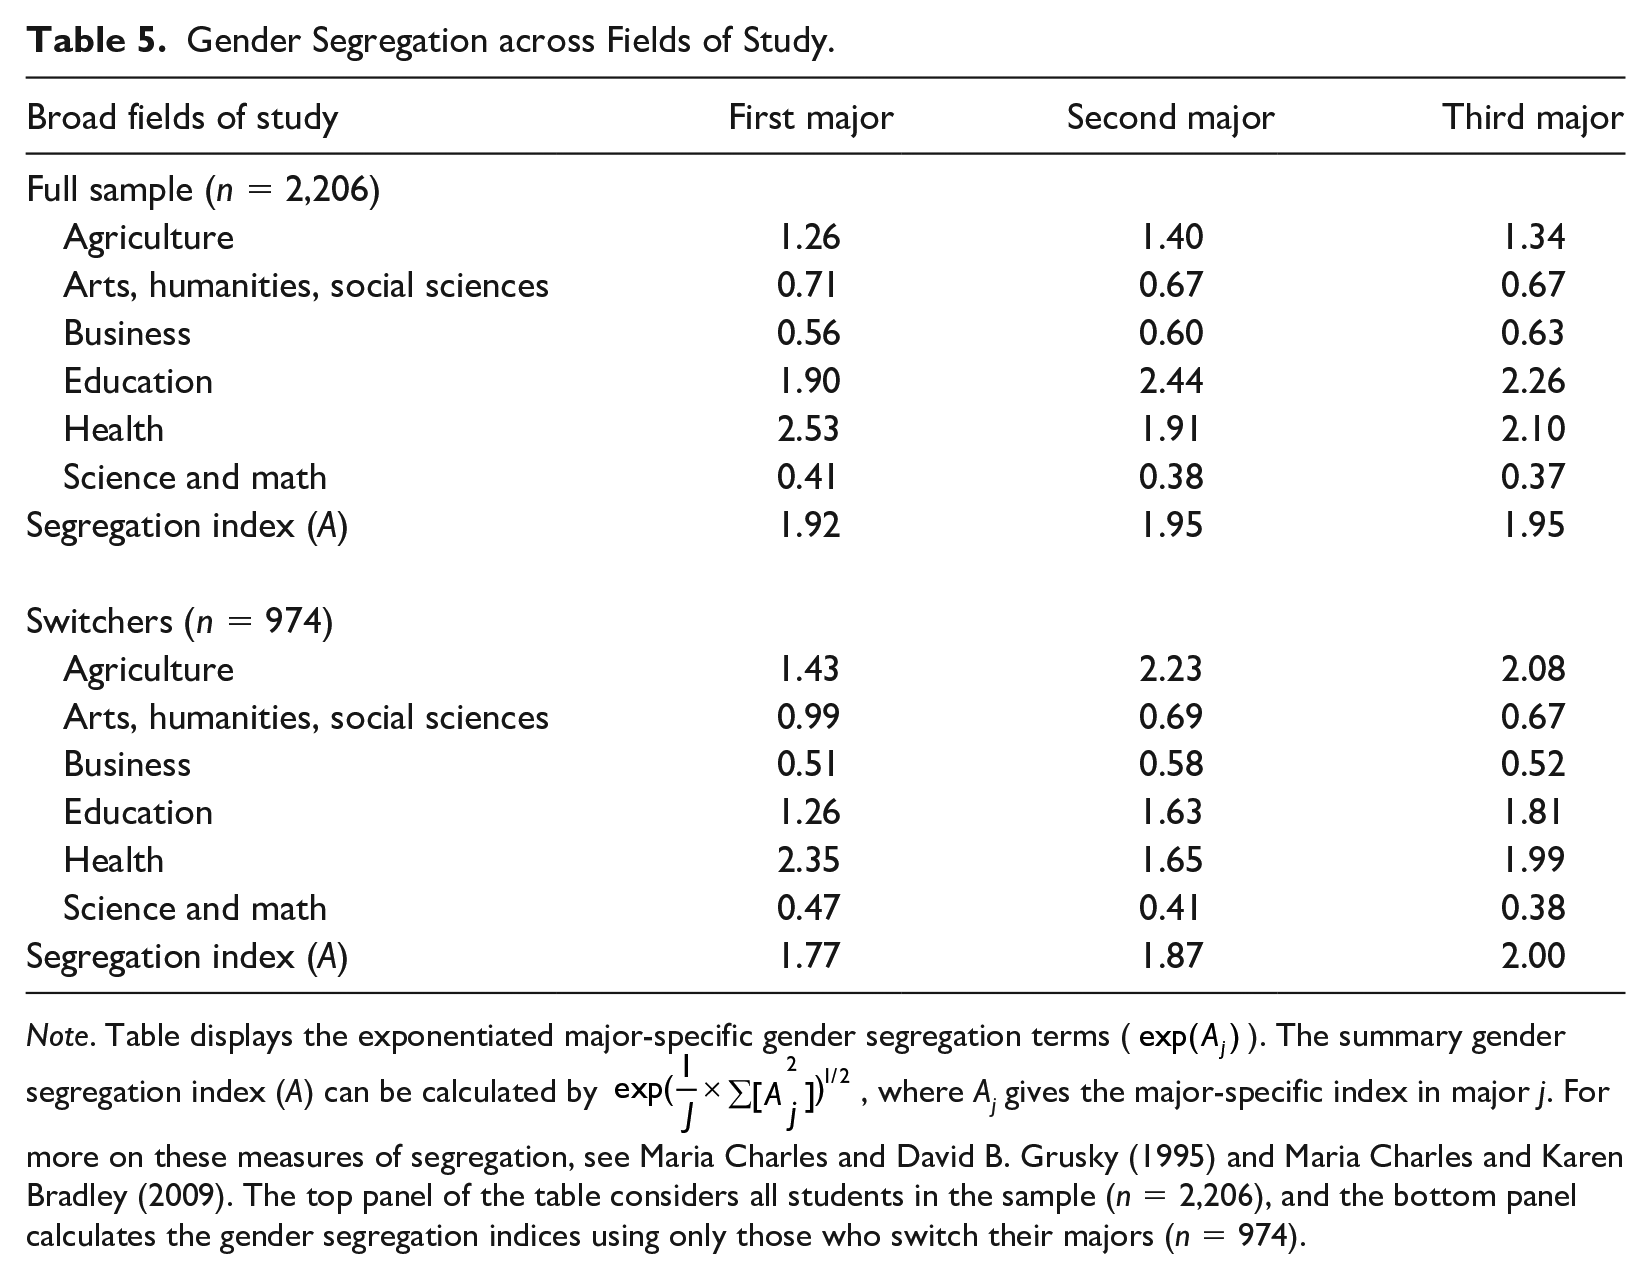
Note. Table displays the exponentiated major-specific gender segregation terms (
These results are especially pronounced when looking just at those who change their majors, as in the bottom panel of Table 5. Women are over twice as likely as men to pursue health fields, an advantage that persists across switches. Among those who make changes to their major, women’s overrepresentation in education grows from an advantage of about 25 percent at the first major to nearly twice that at the third major. Additionally, women are half as likely (47 percent) as men to initially select a science or math major; by the time some of these switchers are on their third major, they are 37 percent as likely to be in a science or math field. The overall segregation index among switchers steadily increases from 1.77 in the first major to 1.87 and 2.00 after students have made their second and third choices, respectively.
Finally, Table 6 considers a number of potential short- and longer-term academic consequences of major switching for individual students. Linear regression models relate major changes to students’ cumulative GPA, the change in their GPA between their first term enrolled in college and their cumulative GPA at the end of their third year, and the number of credits they have earned by the end of their third year. Logistic regression models predict the likelihood of persisting (i.e., remaining enrolled) at the end of students’ third year in college as a function of major changes. For each outcome, I estimate two sets of models: The first is a reduced-form model that includes only the listed independent variables measuring major change as well as institution and cohort fixed effects; the second controls for many of the covariates in Table 2.
Models Predicting the Impact of Major Changes on Postsecondary Outcomes.
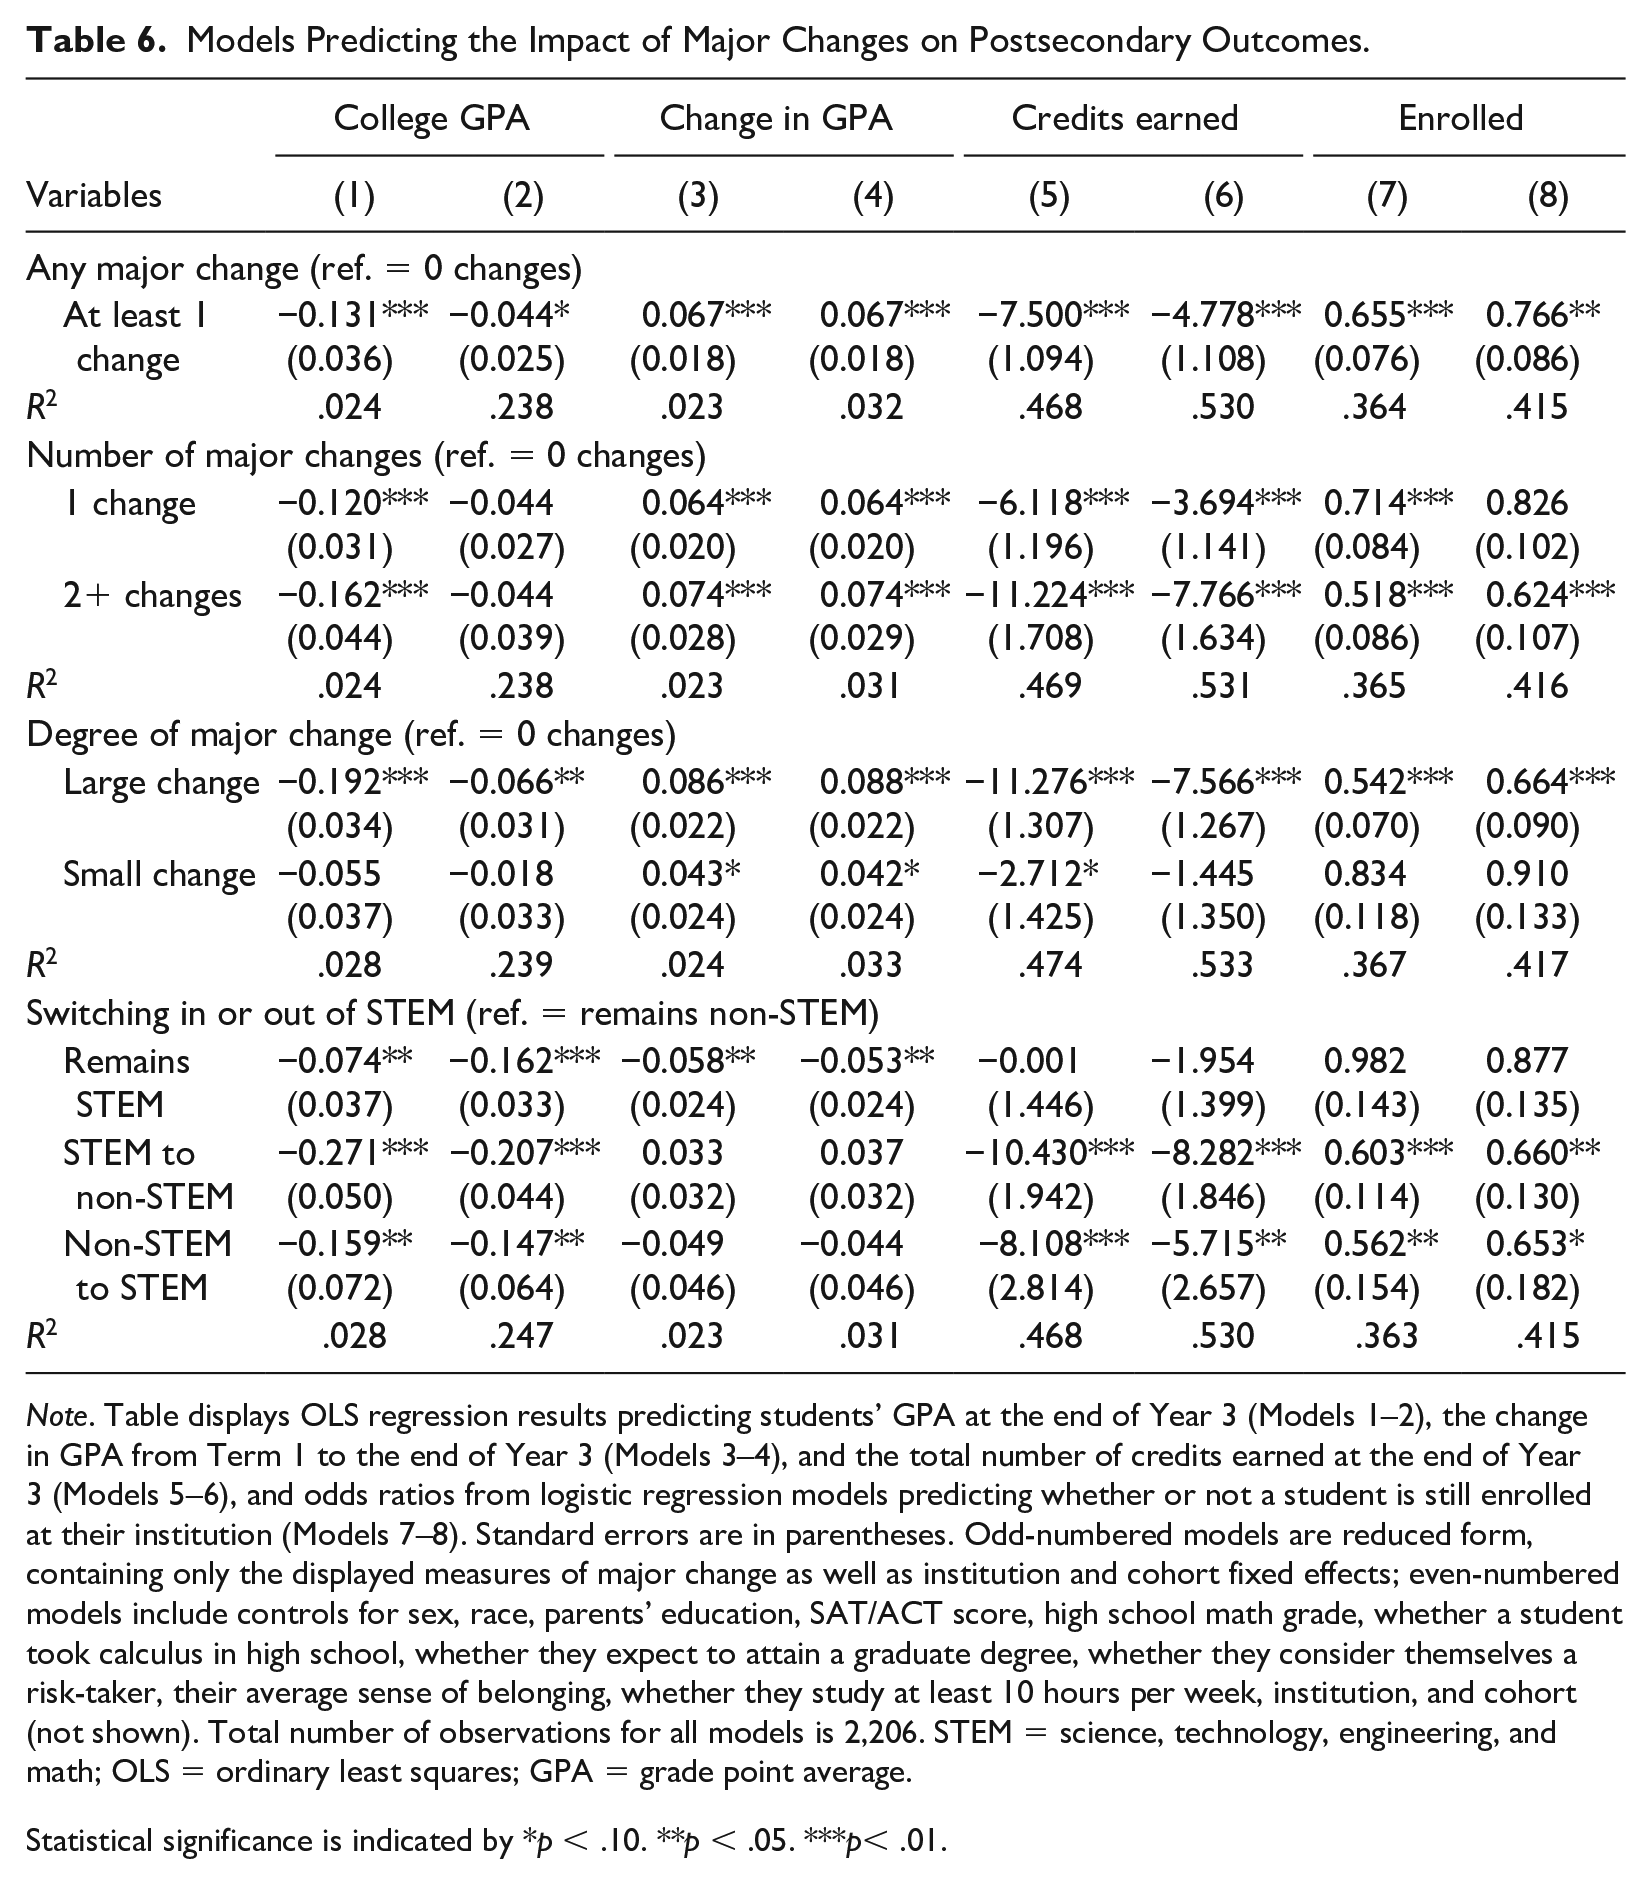
Note. Table displays OLS regression results predicting students’ GPA at the end of Year 3 (Models 1–2), the change in GPA from Term 1 to the end of Year 3 (Models 3–4), and the total number of credits earned at the end of Year 3 (Models 5–6), and odds ratios from logistic regression models predicting whether or not a student is still enrolled at their institution (Models 7–8). Standard errors are in parentheses. Odd-numbered models are reduced form, containing only the displayed measures of major change as well as institution and cohort fixed effects; even-numbered models include controls for sex, race, parents’ education, SAT/ACT score, high school math grade, whether a student took calculus in high school, whether they expect to attain a graduate degree, whether they consider themselves a risk-taker, their average sense of belonging, whether they study at least 10 hours per week, institution, and cohort (not shown). Total number of observations for all models is 2,206. STEM = science, technology, engineering, and math; OLS = ordinary least squares; GPA = grade point average.
Statistical significance is indicated by *p < .10. **p < .05. ***p< .01.
Beginning with the top panel, and focusing for now on the three continuous outcomes (Models 1–6), students who change their majors at least once have lower cumulative GPAs and complete fewer credits at the end of Year 3 than students who do not change their majors. The relationship between major change and cumulative GPA is attenuated in Model 2, suggesting differential selection into the likelihood of switching accounts for much of its relationship with college performance. While major change is negatively associated with cumulative GPA, it is positively associated with the change in students’ GPA. In this way, students who may have been struggling academically in their initial major find a better academic fit when they seek out a new major.
To unpack the relationships between major change and college student outcomes, the next three panels in Table 6 disaggregate the broad category of whether or not students change their major at least once into (a) the number of changes students make, (b) the degree of their major change, and (c) their movement in and out of STEM-related fields. Whether students make just one or at least two major changes, their cumulative GPAs and change in GPA are similar relative to sticking with their initial major. The relationship between changing once or at least twice is explained when controlling for students’ background and other academic experiences. And whether a student changes once or at least twice, they can expect a gain in their GPA of about 0.06–0.07 points. Students who make two or more changes, however, are expected to face a higher penalty in terms of the total number of credits earned by the end of their third year compared to students who make no changes, relative to students who change their major just once. Looking at Model 6, whereas students making one change complete about 3.7 fewer credits as their counterparts who do not switch majors, students who switch at least twice are expected to complete 7.8 fewer credits (more than one full course) on average.
The degree of a student’s change appears to matter for these measures of student achievement as well. While making a relatively large change—that is, switching from a major in one broad category to a major in a different broad group—is negatively related to a student’s cumulative GPA and number of credits earned, and positively related to their change in GPA, making a small change (where a student changes their major within a broad category) is generally not significantly related to these outcomes when accounting for other student characteristics.
The patterns when disaggregating major change by movement in or out of STEM fields are also interesting. Compared to remaining in a non-STEM field (whether or not one switches majors within this broad categorization), remaining in a STEM major, moving from a STEM major to a non-STEM major, or switching from a non-STEM to a STEM major are all associated with declines in a student’s expected cumulative GPA. For students who remain in STEM, they can also expect a decline between their first-term GPA and their cumulative GPA relative to non-STEM stayers, but moving into or out of a STEM-related field has no significant relationship with their predicted change in GPA.
The patterns for credits earned are similar to those found when looking at the degree of change: For students who make relatively large major changes (i.e., those who enter or leave a STEM-related field), their predicted number of earned course credits declines, on average. This negative relationship may indicate that making large major changes—including moving between broad categories and into or out of STEM—necessitates a certain degree of catching up post-change. For instance, students who select a very different major may need to retake courses that are now required by their new major in order to remedy a previously earned poor grade. Students might also make a decision partway through a term to withdraw or not complete a course that may no longer be required by their new major, or to reduce their course-load if they are struggling to meet the demands of a new major. Because students do not earn credit for courses they fail, withdraw from, or retake later (in the sense that they do not count toward their GPA, even if they do count toward their attempted credits for a given term), they are not included in their number of earned credits. Indeed, while the average number of attempted credits among this sample by the end of students’ third year is approximately 90, students average about 85 earned credits.
Finally, students who make at least one major change are less likely persist in their institution through the end of their third year (see Models 7 and 8 in Table 6). This is especially true for students who make at least two major changes, or who make relatively large changes—switching between broad field of study categories or switching between STEM and non-STEM. To the extent that students who feel less of a sense of belonging at their institution are more likely to switch majors (as Table 2 suggests), theories about college student persistence would hint at major change as a symptom of lower academic and/or social integration (Bean 1983; Tinto 1997). At the same time, the increase in the variance explained between Models 7 and 8 suggests that other factors do play an important role in predicting whether students remain enrolled in college or drop out.
Conclusion
Higher education in general can be increasingly characterized by its destandardization, as students have been taking more circuitous routes through college (Denice 2019; Milesi 2010). In a similar way, the selection of a field of study can be thought of as a process that unfolds over time and is shaped by students’ background, precollege achievement and preparation, and their experiences after they arrive on campus. This study contributes to the literature on the correlates and consequences of students’ college major by tracking and characterizing changes in students’ major choices, and by investigating the implications of those changes for students’ academic outcomes and for patterns of gender segregation across fields.
This study presents four main findings. First, switching majors is widespread. Nearly one third of students change their majors once, and another 12 percent change at least twice. Many students change their major for the first time almost immediately upon enrolling in college. By the time students have attempted their first 20 to 35 credit hours, roughly a quarter of students have changed their major. After this initial period, the rate of switching plateaus. As students progress further into the curricular requirements of their current program of study, even if they find their interests and abilities at odds with their major, they may be less willing or able to make a change. The observed rate at which students change their major may actually understate the degree of mismatch or the desire to switch. When asked in an open-ended survey question in the spring semester of their third year what they wish they had known when first entering college, many students responded that they wished they had switched majors. This points to the constraints around being able to change majors as well as the path dependence of students’ initial choices.
Second, students’ prior academic achievement and preparation, their sense of integration at their institution and in their major, and how well they are doing in their current major are related to their propensity to switch majors. Students who have scored higher on the SAT or ACT standardized math test and who received a higher grade in their high school math class have a lower hazard of switching. These are students who, through their more successful completion of coursework in high school, have fuller information prior to college about their initially selected major (Avery et al. 2017). Furthermore, when students are struggling in their courses, they are more likely to change majors—likely in an effort to find a course of study that better matches their interests and abilities. And when students change majors, they typically switch into fields that are easier and less competitive.
Third, the results present a mixed picture of whether switching majors is productive for students. On one hand, students who change majors have lower cumulative college GPAs than non-switchers. However, this likely reflects the struggles these students had in their initial major’s coursework. Switchers appear to be selecting new majors that provide a better fit with their interests and abilities. Students who switch majors—and especially those making relatively large changes across broad major groupings—improve their course performance over time, as evidenced by the positive relationship between switching and the change in students’ college GPA. At the same time, switching majors is associated with fewer earned credits by the end of the third year in college. This is important because, along with better grades, more completed credits facilitate more fluid educational trajectories that, in turn, lead to higher college completion rates (Attewell et al. 2012; Goldrick-Rab et al. 2016). And indeed, major switching is associated with a lower likelihood of remaining enrolled at the end of students’ third year.
Whether or not major switching is productive in the short-term (in terms of students’ grades and credit completion) must be balanced against potential forgone benefits in the longer term. For instance, students who switch into STEM from a non-STEM field earn lower GPAs than those who stick with a non-STEM major. 8 Similarly, remaining in STEM or switching majors within STEM is associated with lower overall GPA, and a decline in GPA over time. But, in both cases, these students are selecting and persisting in a field that is associated with higher earnings and occupational attainment in the labor market (Altonji et al. 2016; Kim et al. 2015; Roksa and Levey 2010).
Fourth, major switching exacerbates field of study gender segregation. Even in this study’s sample—consisting of students recruited in part for their initial interest in STEM and who attend institutions with a STEM-intensive focus—the decision to remain in STEM is gendered. While gender does not appear to be a significant predictor of whether or not an individual changes their major, women are less likely to select science and math majors initially. And when they switch, they switch into majors that are even less STEM-intensive. Women—regardless of whether they subsequently change their major or not—are substantially less likely to enter college majoring in science or math than men. While nontrivial shares of both women and men switch out of their initial science and math majors and into non-STEM fields like business or the arts, humanities, and social sciences, women are more likely to do so than men. They also continue to leave STEM at a higher rate than men with their second major change.
Women’s avoidance of and decision to leave STEM cannot be explained by high school achievement or other background factors (Mann and DiPrete 2013; Riegle-Crumb et al. 2012). The social and academic organization of postsecondary institutions and fields of study matter for patterns of gender segregation. In particular, women are sensitive to the amount of STEM coursework required by their current major. As the number of average STEM course credits for a given major increases, women’s hazard of switching out of that major increases; there is no such relationship for men. This finding highlights the social closure and its consequences of majors like STEM. That STEM fields are associated with higher wages, occupational attainment, and job stability in the labor market raises important concerns about women’s continued underrepresentation in these majors, as well as their higher rates of exit from them (Legewie and DiPrete 2014). Improving the gender balance across fields of study is not simply about access or students’ initial choices. By examining students’ major choices across their first three years in college, this study illustrates the dynamic nature of gender segregation in field of study. Segregation begets more segregation. Women and men begin their postsecondary education in different fields, and then make changes that exacerbate these differences.
There are a few limitations of this study that bear keeping in mind. First, the analysis is based on data from three postsecondary institutions. While these universities are large, regionally representative of the United States, and come from both the public and private sectors, the determinants and consequences of major switching may vary across institutions. Findings reported here may not apply to all other institutions. The focus on three institutions also means that I cannot observe students if they leave to attend another school. Additionally, the survey data follow students only through their first three years of college. Although the panel nature of the data is useful, this necessarily provides a truncated picture of students’ postsecondary careers, particularly given the increasing time students spend pursuing college degrees (Bound et al. 2012). That said, the data do allow for an in-depth look at the prevalence, correlates, and consequences of major switching. The longitudinal surveys and transcripts contain detailed information about students’ background, achievement, and key noncognitive traits (including their sense of themselves as risk-takers and the degree to which they feel like they belong at their institution). Furthermore, colleges and universities do not offer a uniform set of majors; by focusing on just three, it becomes manageable to track students’ changes across highly granular majors, rather than relying solely on broad categories.
The findings also present opportunities for future research. The choice of initial major and, just as importantly, the decision to persist in that major or make a change are highly dimensional. While I have compared the majors students leave to the ones they enter on a number of dimensions (including the share of women, the STEM course requirements, and the average difficulty and competitiveness), one could imagine a host of other attributes that are important to students. Students decisions regarding major switching may also be shaped by the amount of coursework they complete in their major. In a similar way, students may choose what major to switch into based on courses they have already taken. This study treats all credits attempted as equally informative to students, so additional research could examine the ratio of courses taken in a student’s current or future major relative to other courses.
Furthermore, the results of this study highlight the need for postsecondary institutions to better support students following prolonged, discontinuous, or disrupted pathways. The decision to change one’s major field of study represents such a disruption with implications for their educational trajectory. Colleges and universities typically provide lots of support for first-year students, but often assume that students in later years are able to navigate college more successfully on their own (Mabel and Britton 2018). However, a nontrivial share of students continue to make big, consequential changes to their programs of study well into their second and third years. Helping students early on in (and even before they begin) their higher education is certainly important. At the same time, recognizing that many students will make changes as they seek to optimize the match between their majors and their abilities, interests, and aspirations cannot be neglected. This support is especially germane to students who change their majors more than once—that is, students who may be struggling particularly hard with reconciling their abilities and interests with the menu of options on offer at their institution. Indeed, making more than one major change is associated with larger declines in progress (credits earned) and lower likelihoods of persistence.
Just as students follow increasingly winding pathways to and through postsecondary institutions, this study illustrates how the choice of one’s major entails a process that unfolds over time, is responsive to a student’s background as well as their experiences in college, and shapes students’ postsecondary success. Aggregate patterns of students’ decisions to switch majors also exacerbates gender segregation across fields of study. In this way, students’ trajectories of major choice represent an important dimension of the horizontal stratification in postsecondary education.
Footnotes
Appendix
Summary Statistics for Dependent and Independent Variables Used in Table 6.
| Variables | n | M | SD | Minimum | Maximum |
|---|---|---|---|---|---|
| Dependent variables | |||||
| College GPA | 2,206 | 3.039 | 0.649 | 0 | 4 |
| Change in GPA | 2,206 | −0.056 | 0.418 | −2.055 | 1.833 |
| Credits earned | 2,206 | 84.423 | 34.38 | 0 | 174 |
| Enrolled | 2,206 | 0.623 | 0.485 | 0 | 1 |
| Key independent variables | |||||
| No major changes | 2,206 | 0.558 | 0.497 | 0 | 1 |
| At least 1 major change | 2,206 | 0.442 | 0.497 | 0 | 1 |
| Only 1 major change | 2,206 | 0.32 | 0.466 | 0 | 1 |
| At least 2 major changes | 2,206 | 0.122 | 0.327 | 0 | 1 |
| Large change | 2,206 | 0.255 | 0.436 | 0 | 1 |
| Small change | 2,206 | 0.187 | 0.39 | 0 | 1 |
| Remains STEM | 2,206 | 0.613 | 0.487 | 0 | 1 |
| STEM to non-STEM | 2,206 | 0.139 | 0.346 | 0 | 1 |
| Non-STEM to STEM | 2,206 | 0.044 | 0.205 | 0 | 1 |
Note. GPA = grade point average; STEM = science, technology, engineering, and math.
Acknowledgements
I thank two anonymous reviewers and the editors for their helpful comments. Research reported in this study was supported by the Pathways Through College Research Network. I am grateful to the other members of the network, and in particular to Eric Grodsky and Chandra Muller, who provided valuable feedback throughout this paper’s development. An earlier version of the paper was presented at the annual meeting of the American Sociological Association (2020). Any opinions, findings, and conclusions or recommendations expressed in this paper are those of the author and do not necessarily reflect the views of the National Science Foundation. All errors are my own.
Declaration of Conflicting Interests
The author(s) declared no potential conflicts of interest with respect to the research, authorship, and/or publication of this article.
Funding
The author(s) disclosed receipt of the following financial support for the research, authorship and/or publication of this article: This work was supported by the Pathways Through College Research Network funded by the National Science Foundation [DUE 1317196, DUE 1317206].