
Abstract
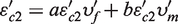
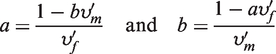
Derivations for the transverse matrix strain magnification and fibre strain reduction, based on the principle of strain energy applied to a representative volume element and using the semi-empirical model of Halpin–Tsai are presented here. The arising values of fibre/matrix strain reductions/magnifications decrease/increase with increasing volume fractions of the reinforcing fibre. Significant differences are seen between the transverse, matrix/fibre strain magnification/reduction for the present case where no assumptions are made about the existence of the iso-stress state and others where the assumption applies. The transverse stresses in the composite, matrix and fibre are shown here to be different, which implies that the assumption of transverse iso-stress that is normally made in the study of composite materials is wrong. The fibre stresses are found to be greater in magnitude than the matrix stresses for all volume fractions and up till 71% reinforcing volume fraction for the hexagonal and square arrays, respectively. The fibre/matrix strain reduction/magnification, fibre and matrix/central sub-region stress ratios are all shown here to be dependent on the fibre geometry for all volume fractions of reinforcing fibre, with the exception of the fibre/central sub-region stress ratio where this characteristic only prevails below 76% reinforcing volume fraction.
Background
The phenomenon of strain magnification in the transverse direction of the matrix in fibre-reinforced composites has been shown variously to be dependent on the volume fraction of the reinforcing fibre and fibre geometry.1–3 The Kies equation for matrix strain magnification as applied to square arrays of reinforcing fibre 1 is the most commonly quoted solution for matrix strain magnification. The equation is presented in literature in different forms as is evident from the work of Paipetis. 4 Hossain et al. 5 in their work presented a different expression for determining strain magnification.
All the foregoing models assume the existence of an iso-stress situation in the transverse direction of the reinforced fibre composite. Various works in literature have shown this assumption to lead to errors in the prediction of the transverse elastic properties of composites.1–3 A numerous number of alternative solutions have been presented instead: semi-empirical, numerical and micromechanical methods geometry.1–3 An error of −18.7% is calculated for Toray T300 carbon fibres and Ciba Geigy 914 epoxy resin composite with a fibre volume fraction of 0.56 based on values given by Harris. 2 An error of −24.93% is calculated for E-glass fibre/epoxy resin composite with a fibre volume fraction of 0.45 based on values by Gibson. 3 Errors of −53.12% to −34.78%, 18.23% to 45.63%, and 44.94% to 124.35% are calculated for E-glass fibre/polyester resin, Type I carbon/epoxy, and Kevlar 49/epoxy resin composites with fibre volume fractions of 0.50 based on by Hull. 1
It stands to reason therefore that the estimates of the transverse strain magnification based on this same assumption will have inherent errors in them. The need does arise therefore, to develop solutions of the transverse matrix strain magnification in fibre-reinforced composites that are independent of the Reuss rule, a task that this paper seeks to address.
Development of analytical solutions for strain magnification
Consider the representative volume element (RVE) shown in the left end diagram of Figure 1, and its derivatives to the right. The thick arrow in Figure 1 shows the direction of transverse deformation.
Representative volume element (RVE).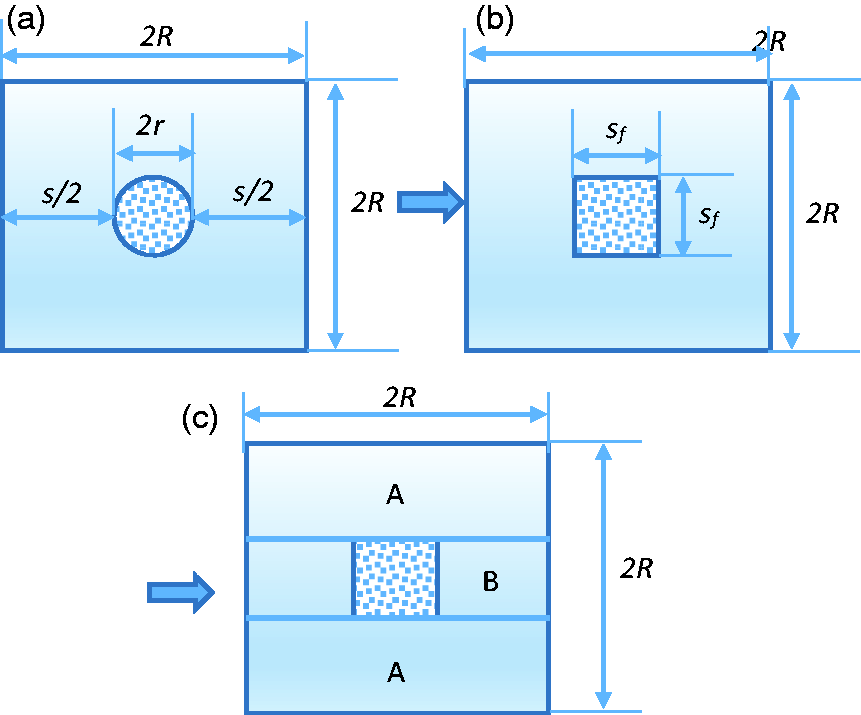
The elastic response of the element shown in Figure 1(c) is determined from the Reuss rule following onto which the elastic response of the entire RVE is determined by use of the Voigt rule. It was shown by Gibson
3
that the reinforcing fibre volume fraction for the central sub-region in Figure 1(b) and (c) was related to the volume fraction of reinforcing fibre for the entire composite as follows
Application of the Halpin–Tsai equations
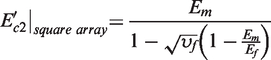
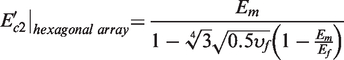
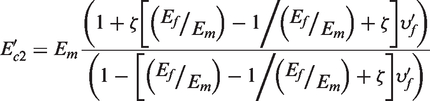
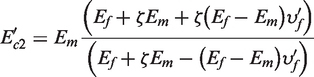
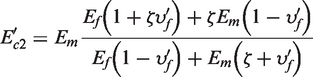
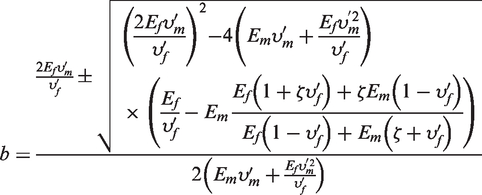
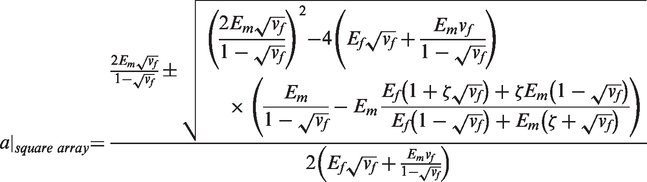
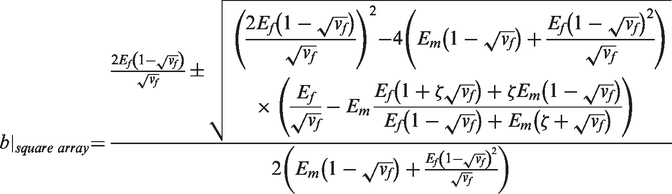
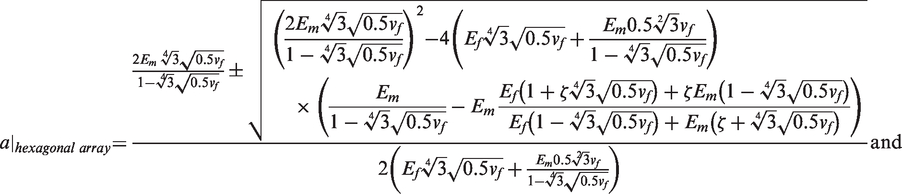
Introducing the stress/strain relationships into equation (3) for isotropic and linear elastic composite constituent materials, equations (2a) and (2b), and assuming the iso-stress state prevails give rise to the following expressions for the elastic modulus of the central sub-region, for square and hexagonal arrays of reinforcing fibres
As stated here previously the iso-stress state in the transverse direction does not exist, which demands the use of methods other than those that are dependent on the assumption. To this end, attention is turned to the most widely used model, the Halpin–Tsai semi-empirical model. The model is not predicated on the iso-stress rule and has been shown to generate results that are good estimates of the experimental values of the transverse elastic properties of fibre-reinforced composites.1–3 Therefore, the model does serve the useful purpose of determining the errors inherent in using the Reuss rule.
The Halpin–Tsai model is given in literature1–3,6,7 as
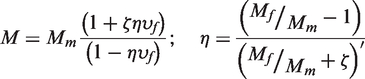
The symbol (ζ) in this model is a curve fitting parameter that is dependent on the characteristics of the reinforcing fibre such as volume fraction, shape, packing geometry, aspect ratio and loading conditions.1–3 The parameter reduces equation (8) to the Reuss and Voigt rules for values of ζ = 0 and ζ = ∞, respectively.1–3 Values of ζ = 2 and ζ = 1 give good estimates of the transverse elastic modulus and shear modulus, respectively.1–3,6,7
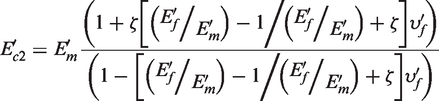
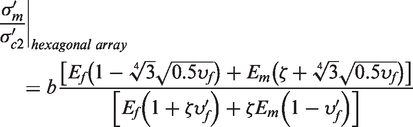
Applying equation (8) to the central sub-region of Figure 1(c) gives rise to the following expression for the transverse elastic modulus
Results and discussion – 1
The variation of fibre strain reduction and matrix strain magnification with the volume fraction of reinforcing fibre for square and hexagonal arrays reinforcing fibre geometries is shown in Figures 2 to 9.
Variation of the reduction of strain in the fibre with reinforcing fibre volume fraction of a square array – first and second roots.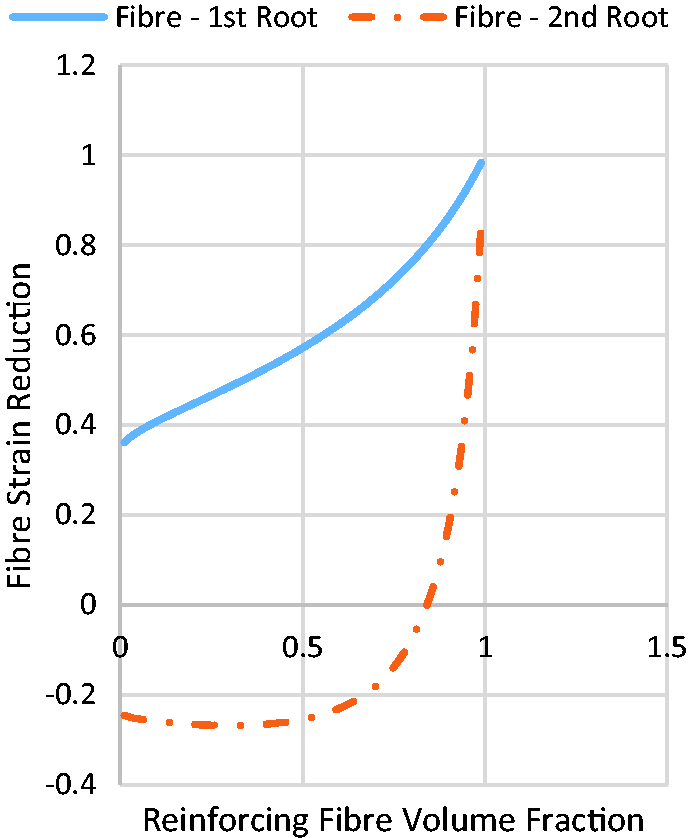
The negative values of strain reduction exhibited by the second root in Figure 2 for applied positive strain in the fibre is physically not feasible. The results of the second root are therefore wrong and may be ignored. The first root shows a positive strain reduction that decreases at a more or less constant rate over most of the reinforcing fibre volume fraction range. The rate of decrease is seen to pick up at higher volume fractions of the reinforcing fibre, higher than the practical limit of reinforcement (78.5%) for square arrays. Both the trend noted in the fibre strain with increasing volume fraction of the reinforcing fibre is consistent with the fact of reducing volume fraction of the more ductile matrix. Values of strain magnification of 0.3112 (1% υf), 0.5221(39% υf), and 0.7456 (78% υf) and are noted for the first root.
As was noted for the case of strain in the reinforcing fibre, the negative values of strain reduction in the matrix exhibited by the second root in Figure 3 against applied positive strain are inconsistent with the physical reality and may therefore be ignored. The first root in the figure shows a strain magnification that increases at a more or less constant rate for reinforcing fibre volume fractions within the practical limit of 78.5%. Values of strain magnification of 2.6718 (1% υf), 1.210 (39% υf), and 16.8704 (78% υf) are registered. The curve for the first root shows a sharp increase in the rate of strain magnification at higher volume fractions of the reinforcing fibre. The trend of rising strain magnification is consistent with expectations as the more ductile matrix volume fraction decreases.
Variation of the magnification of strain in the matrix with reinforcing fibre volume fraction of a square array – first and second roots.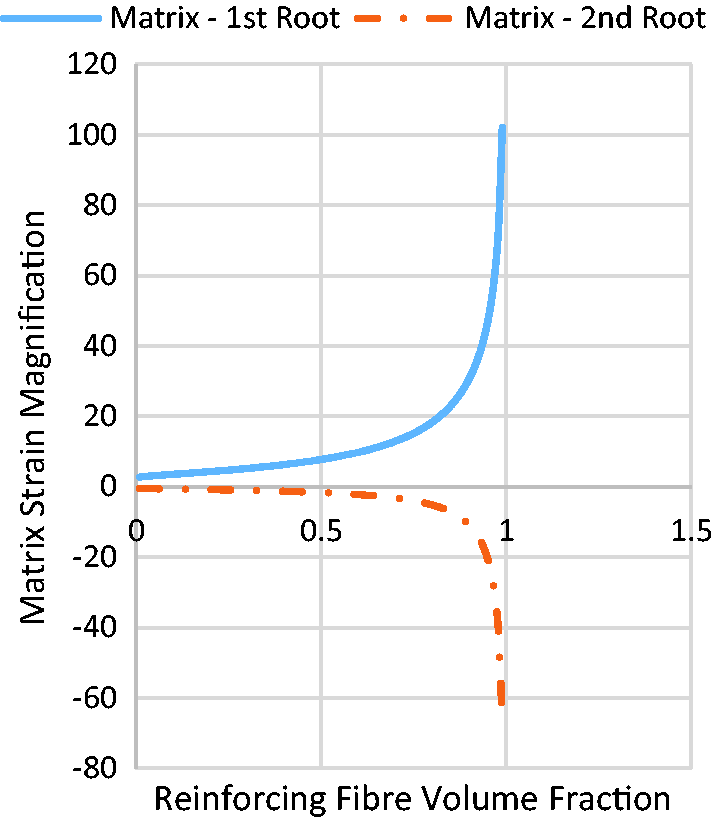
The second root in Figure 4 shows negative values of fibre strain reduction against imposed positive strain which is inconsistent with the physical reality. The values of strain reduction given by the second root are therefore ignored. The first root in the figure shows values of strain reduction that decrease at an almost constant rate for all volume fractions of reinforcing fibre shown in the figure, varying between 0.3492 (1% υf), 0.4853 (39% υf), and 0.7284 (91% υf). This trend as discussed in the case of square arrays is consistent with the fact of attendant reducing volume fraction of the more ductile matrix.
Variation of the reduction of strain in the fibre with reinforcing fibre volume fraction of a hexagonal array – first and second roots.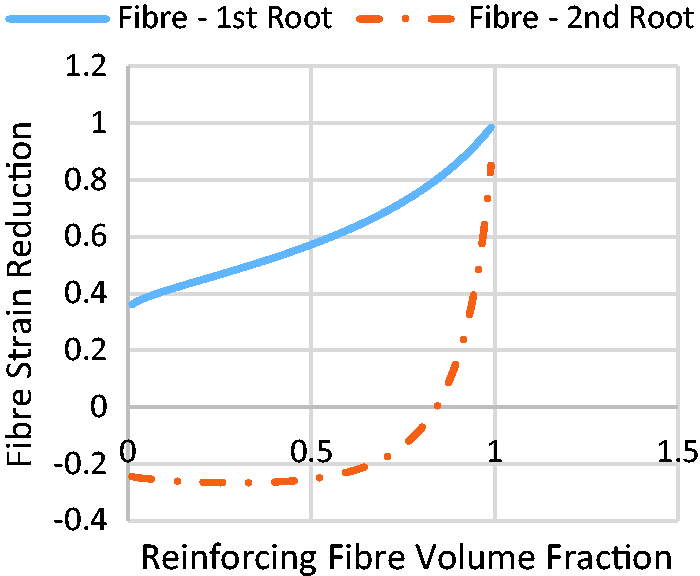
The strain magnification for the second root in Figure 5 shows increasing values at a more or less constant rate for all volume fractions of reinforcing fibre. The strain magnification for the first root on the other hand shows increasing values at an increasing rate. Values of 1.1278 (1% υf), 2.7588 (39% υf), and 2.9587 (91% υf) for the first root, and 1.0657 (1% υf), 1.6929 (39% υf), and 9.3217 (91% υf) for the second root are registered. The values for the first root are seen to be higher than those for the second root for all volume fractions of the reinforcing fibre. The basis of choice between these two roots is not evident.
Variation of the magnification of strain in the matrix with reinforcing fibre volume fraction of a hexagonal array – first and second roots.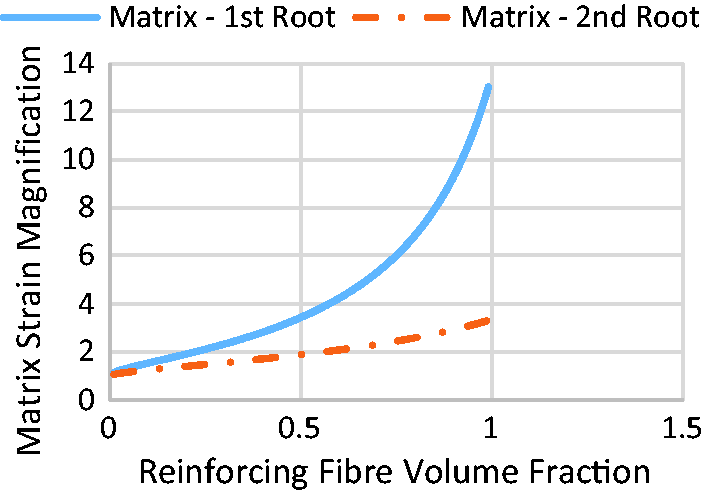
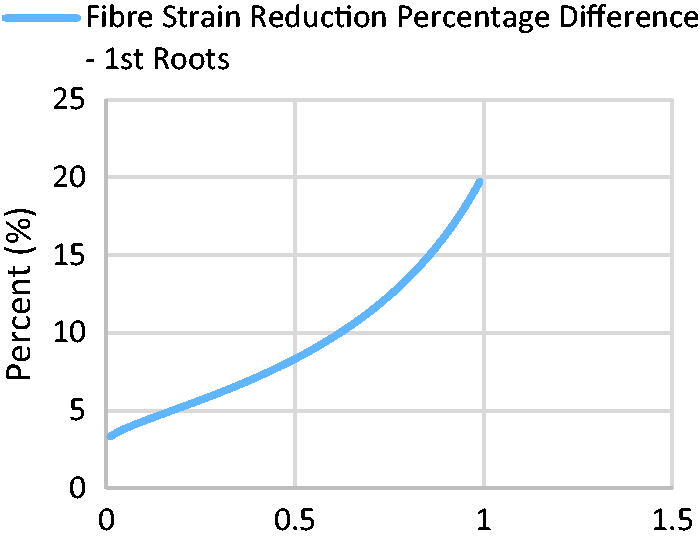
The values of fibre strain magnification for the two reinforcing fibre geometries is seen in Figure 6 to differ by amounts that increase with increasing volume fraction of the reinforcing fibre. The percentage difference between these two curves is seen from Figure 7 to exceed 10% above a reinforcing fibre volume fraction of 62%. Taking the value of 10% percentage strain difference to be the critical value above which the difference becomes significant. With this in mind, it is reasonable to state then that below and above the reinforcing fibre volume fraction of 62% fibre strain reduction is independent and dependent on the fibre geometry. The trend and profiles of the two curves are similar with higher values of strain reduction and rates of increase for the square array.
Variation of the reduction of strain in the fibre with reinforcing fibre volume fraction of square and hexagonal arrays – first roots. Variation of the percent fibre strain reduction difference between square and hexagonal fibre geometries with the reinforcing fibre volume fraction – first roots.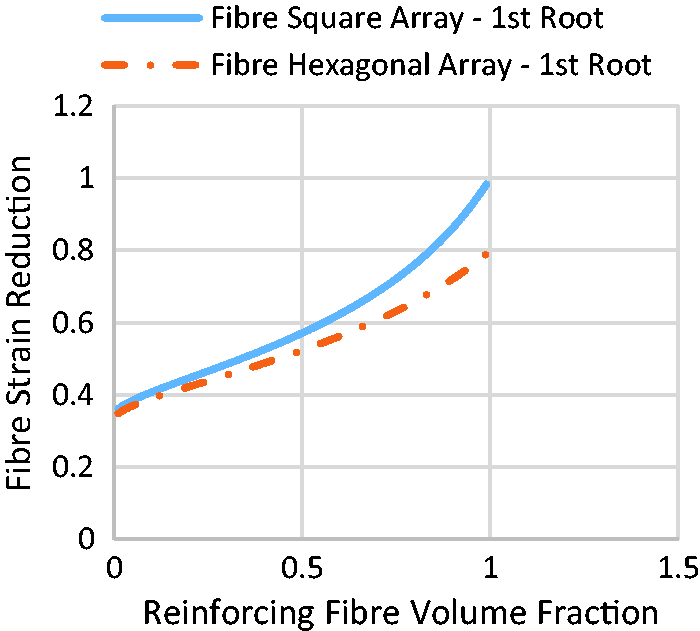
Though the curve profiles are similar for all of the three curves shown in Figure 8, the values of strain magnification and rates of increase in strain magnification with increasing volume fraction of the reinforcing fibre differ. They are highest for the first root of the square array and lowest for the second root for the hexagonal array. The values for the first root for the hexagonal array lie in between. The variation in the matrix strain magnification percentage difference with the volume fraction of reinforcing fibre for the two fibre geometries shown in Figure 9 indicate values that are all in excess of 54.9% for all volume fractions of the reinforcing fibre. This value is well in excess of the 10% cut-off used for the case of the fibre strain reductions, and implies that fibre strain reductions are dependent on the reinforcing fibre geometry. The trend and profiles of the two curves are similar with higher values of strain magnification and rates of increase for the square array. This observation and the similar one relating fibre strain reduction both denote a greater effect in square arrays of the introduction of fibres in a matrix in the transverse direction. This is supported by the fact that the (r/R) ratio is higher for square arrays than for hexagonal arrays at any volume fraction of reinforcing fibres.
Variation of the magnification of strain in the matrix with reinforcing fibre volume fraction of square and hexagonal arrays – first root and first and second roots, respectively.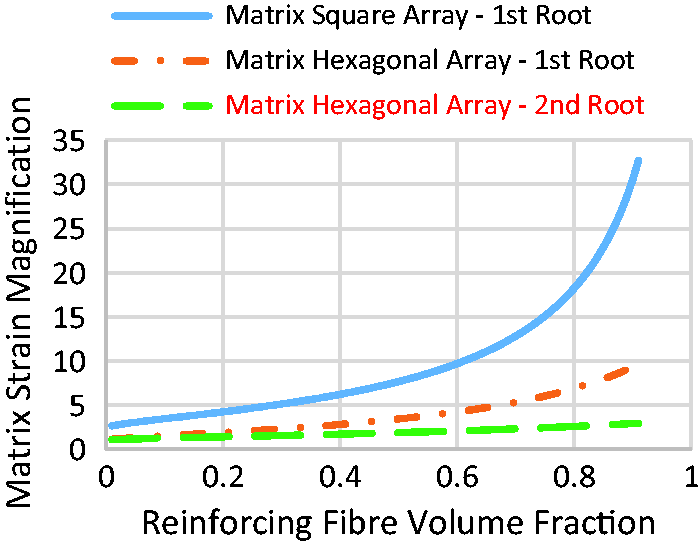
Extension of the Halpin–Tsai equations to matrix and fibre stress ratios
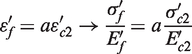
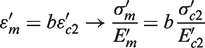
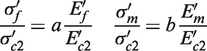
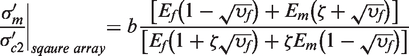
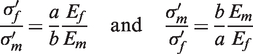
It is evident from the relationships, 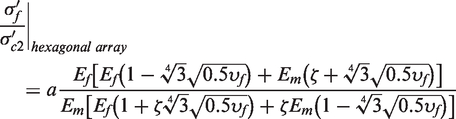

Results and discussion – 2
Curve plots of stress magnification represented by the ratios shown in the expressions in equations (20) to (24), with respect to the volume fraction of the reinforcing fibre, are shown in Figures 10 to 13 for both square and hexagonal arrays of reinforcing fibre.
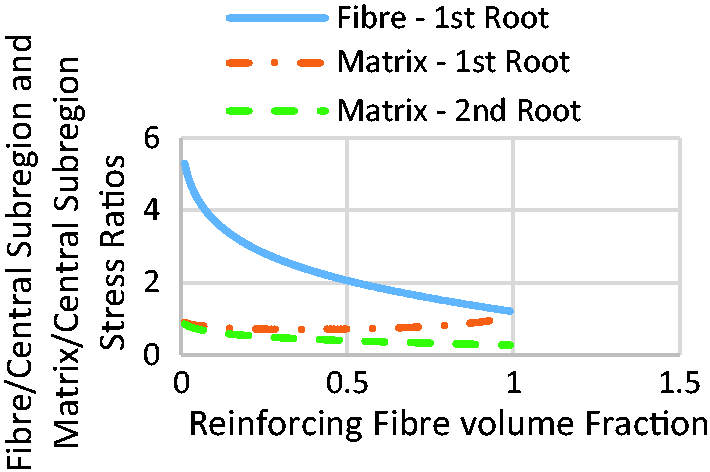
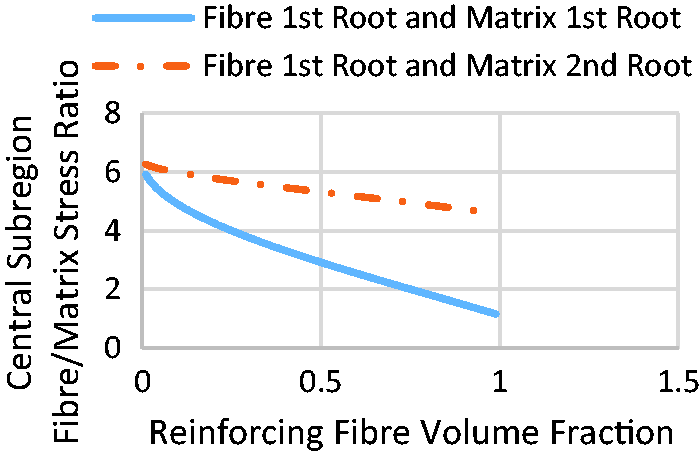
Variation of the percent matrix strain magnification difference between square and hexagonal fibre geometries with the reinforcing fibre volume fraction – first roots. Variation of the fibre/central sub-region and matrix/central sub-region stress ratios with reinforcing fibre volume fraction of a square array. Variation of the central sub-region fibre/matrix stress ratio with the reinforcing fibre volume fraction for a square array. Variation of the fibre/central sub-region and matrix/central sub-region stress ratios with reinforcing fibre volume fraction of a hexagonal array. Variation of the central sub-region fibre/matrix stress ratio with the reinforcing fibre volume fraction for a hexagonal array.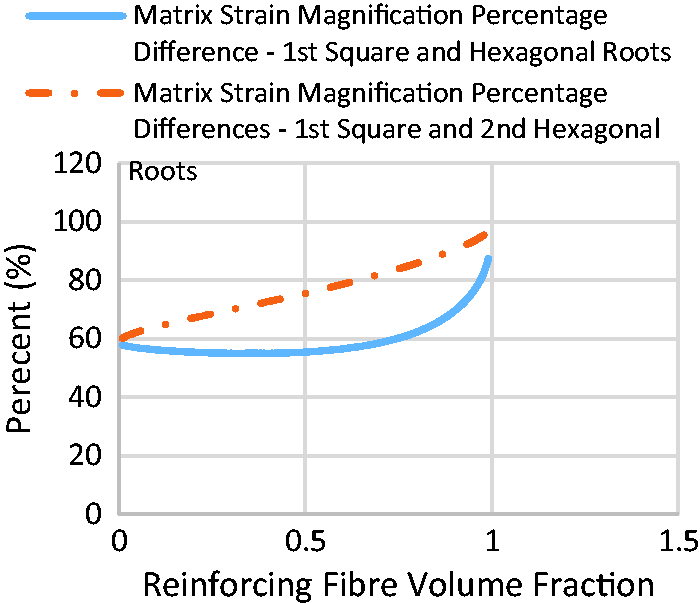
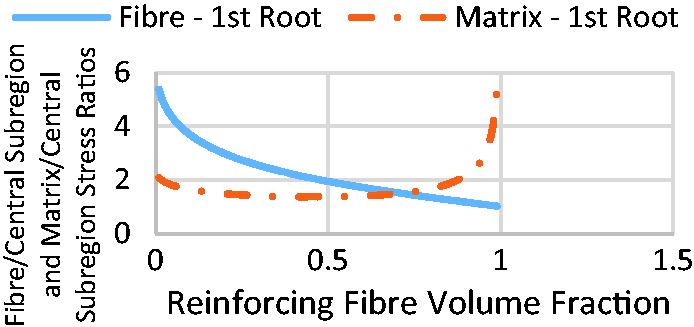
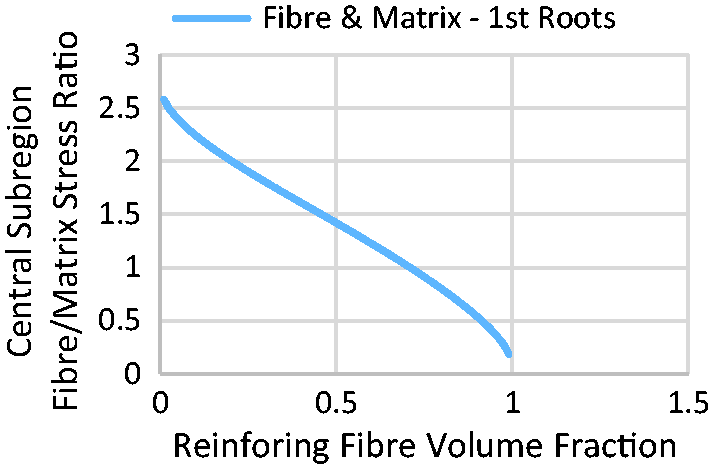
It is evident from Figures 10 and 11 that the matrix/central sub-region composite stress ratio remains more or less constant with varying volume fraction of the reinforcing fibre. The fibre/central sub-region composite stress ratio on the other hand decreases continuously at a decreasing rate, becoming lower than the former at a reinforcing fibre volume fraction of 71%. The curves in Figure 10 show the stresses in both the matrix and reinforcing fibre to be higher than those of the central sub-region composite for all volume fractions of reinforcing fibre. Figure 11 shows the central sub-region fibre/matrix stress ratio to decrease continuously from a value of 2.5853 (1% υf), 1.0000 (71% υf), through to 0.1840 (99% υf). The stress ratio further exhibits a constant rate of decrease over the reinforcing fibre volume fraction range of 20–71%. This decline is consistent with the fact of reducing/increasing cross-section area for the matrix/reinforcing fibre with increasing volume fraction of the reinforcing fibre. It is further evident from both Figures 10 and 11 that coincidence of stress in the central sub-region matrix and fibre only occurs at 71% υf. At this point the ratios of fibre/central sub-region and matrix/central sub-region stresses are both equal to 1.5.
Figure 20, for hexagonal arrays of reinforcing fibre, shows trends that are similar to those seen in Figure 18 for the square array of reinforcing fibre. These are: a reduction in the fibre/central sub-region stress ratios and a more or less constant matrix/central sub-region matrix stress ratios – first matrix root. The matrix/central sub-region stress ratio for the second root decreases by small amounts at a more or less constant rate of decrease with increasing volume fraction of the reinforcing fibre though. The curves in Figure 12 show the iso-stress state to exist only at a volume fraction of 97% for the first root of the matrix/central sub-region ratio only. This is above the practical limit of reinforcement for the hexagonal fibre array. It implies that the assumption of iso-stress in the transverse direction that is normally made for composite materials is incorrect. The central sub-region fibre/matrix stress ratio is seen in Figure 13 to exhibit a decrease with increasing volume fraction of reinforcing fibre. The ratio exhibits higher values and a higher rate of decrease for the first matrix root compared to those for the second matrix root. Between volume fractions of the reinforcing fibre of 34–76% and above a volume fraction of the reinforcing fibre of 9% for the first and second matrix roots, respectively, the rate of decrease of the central sub-region fibre/matrix stress ratio remains constant. It is evident from the curves shown in Figure 13 that the fibre stress is higher than the matrix stress for all volume fractions of the reinforcing fibre.
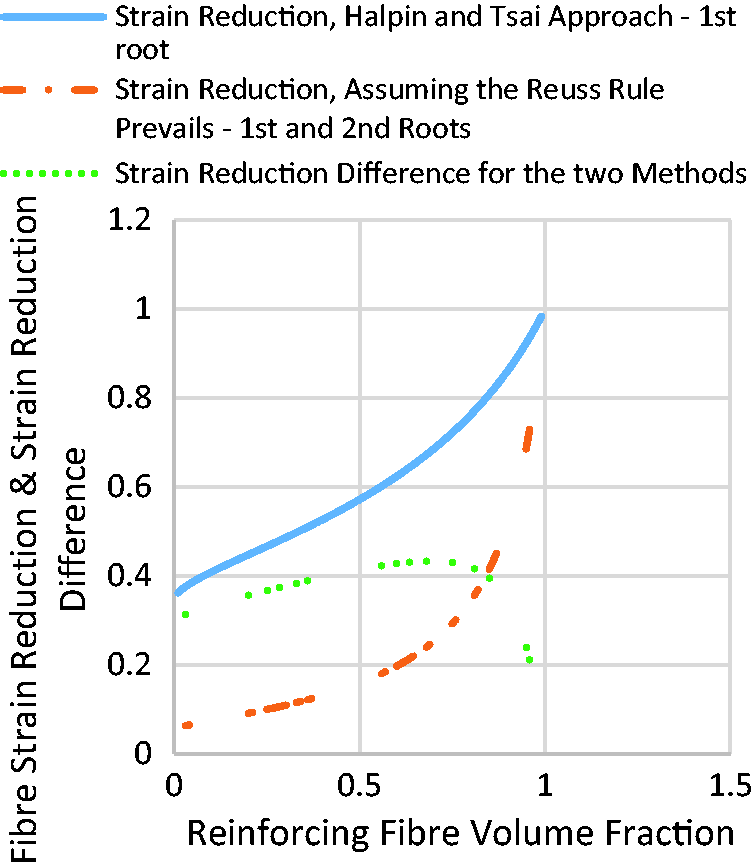
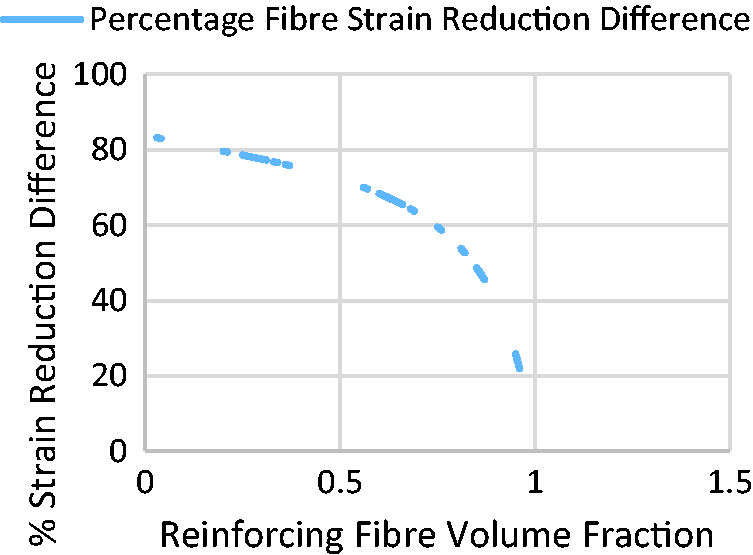
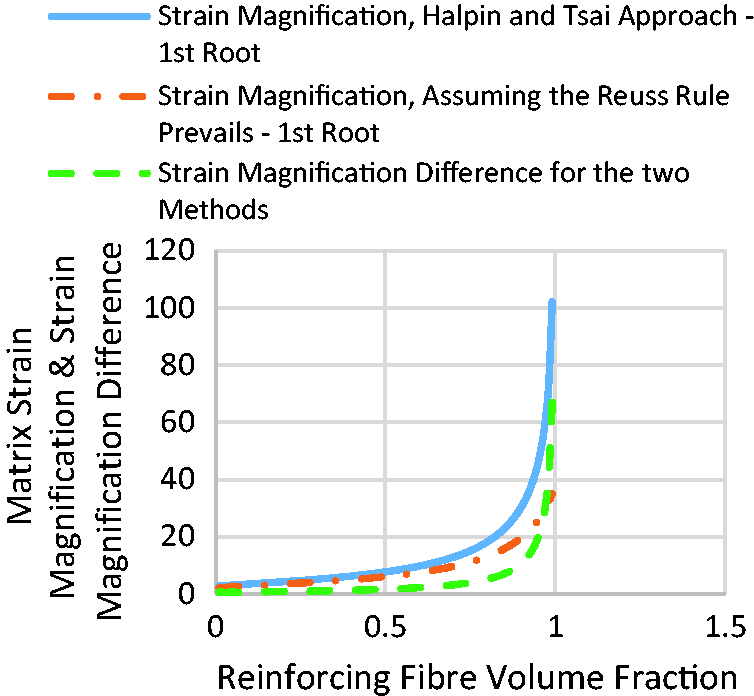
Variation of the fibre/ central sub-region composite stress ratio with the reinforcing fibre volume fraction – first roots of the square and hexagonal arrays. Variation of the central sub-region matrix/central sub-region composite stress ratio with the reinforcing fibre volume fraction for square and hexagonal arrays of reinforcing fibre volume fraction. Variation of the fibre/central sub-region composite stress ratio percentage difference with the reinforcing fibre volume fraction – first roots of the square and hexagonal arrays. Variation of the matrix/central sub-region composite stress ratio percentage difference with the reinforcing fibre volume fraction – first roots of the square and hexagonal arrays, and first root of the square array and second root of the hexagonal array. Variation of the reduction of strain in the fibre with reinforcing fibre volume fraction of square arrays – first roots for the Halpin–Tsai approach and first and second roots assuming the Reuss rule prevails. Variation of the percentage fibre strain reduction difference of the Halpin–Tsai approach first root and assuming the Reuss rule prevails – first and second roots with the reinforcing fibre volume fraction for square arrays. Variation of the magnification of strain in the matrix with reinforcing fibre volume fraction of square arrays – first roots for both the Halpin–Tsai approach and assuming the Reuss rule prevails.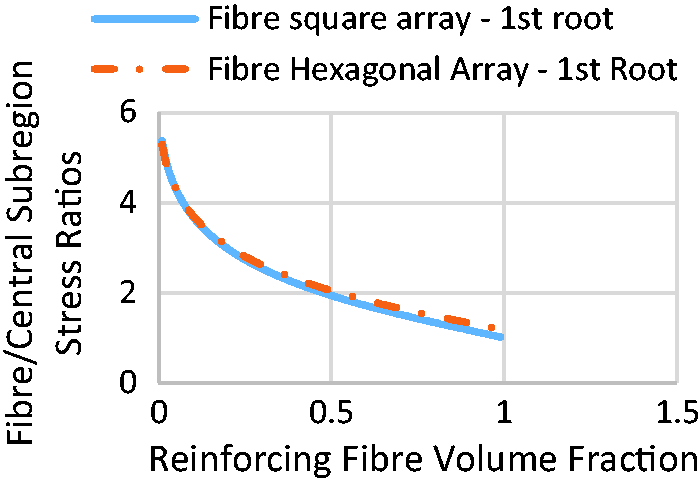
Plots of the values of fibre/composite central sub-region and matrix/central sub-region stress ratios for the two reinforcing fibre geometries are shown in Figures 14 and 15.
The fibre/central sub-region composite stress ratios for the two geometries of reinforcing fibre are seen from Figure 14 to decrease with increasing volume fraction of reinforcing fibre. The values of fibre stress are greater than those of the central sub-region composite for all volume fractions of reinforcing fibre. Values of fibre/central sub-region composite stress ratios of 5.3840 (1% υf), 2.2355 (39% υf), and 1.3725 (78% υf) are recorded for the square array of reinforcing fibre, and 5.2936 (1% υf), 2.3280 (39% υf), 1.5158 (78% υf), and 1.3151 (91% υf). The values for the square array are seen from the curves in Figure 14 to be initially higher than those for the hexagonal array but become less with increasing volume fraction of the reinforcing fibre.
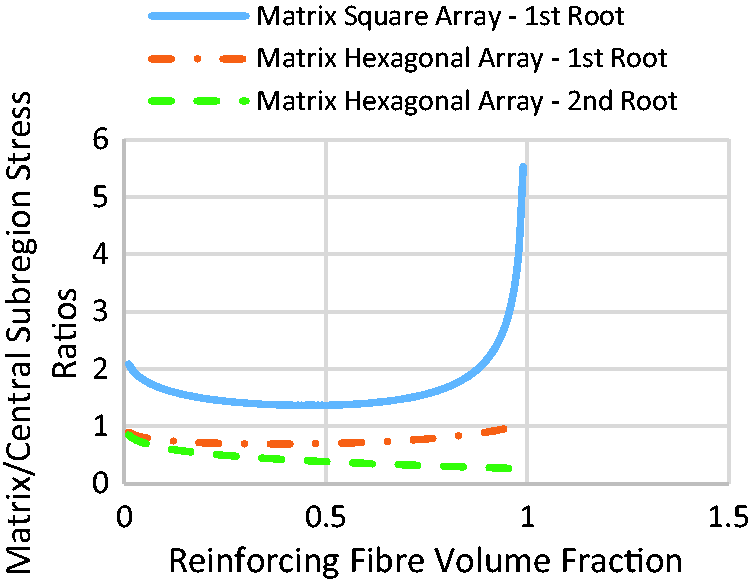
The curves in Figure 15 show the matrix/central sub-region composite stress ratios for both reinforcing fibre geometries to exhibit small variations in magnitude for the different volume fractions of the reinforcing fibre. Starting from a ratio of 2.08 (1% υf), to a minimum of 1.36 (46% υf), and increasing gradually to a value of 1.63 (78% υf) for the square array. Starting from a ratio of 0.89 (1% υf), to a minimum value of 0.69 (37 and 38 % υf), and increasing gradually to a value of 0.91 (91% υf) for the first root of the hexagonal array. The figure exhibits gradually decreasing ratios of 0.85 (1% υf), 0.43 (39 % υf), and 0.28 (91% υf) for the second root of the hexagonal array.
It is evident from the curves in this figure that the matrix for the hexagonal reinforcing fibre geometry has lower stresses than the central sub-region composite over almost all the reinforcing fibre volume fraction. The converse is true for the square reinforcing fibre geometry for all volume fractions of the reinforcing fibre.
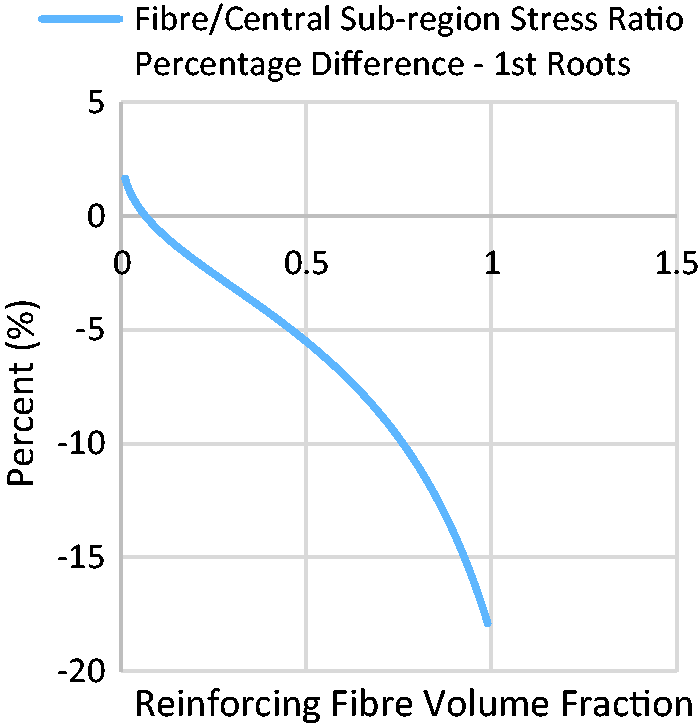
The fibre/central sub-region stress ratio percentage difference for the two curves in Figure 14 is shown in Figure 16 to exceed an absolute value of 10% at a volume fraction of the reinforcing fibre of 76%. Using this as a cut-off value, it may be concluded that the reinforcing fibre/central sub-region composite stress ratio is dependent and independent of the reinforcing fibre geometry below and above a reinforcing fibre volume fraction of 76%, respectively.
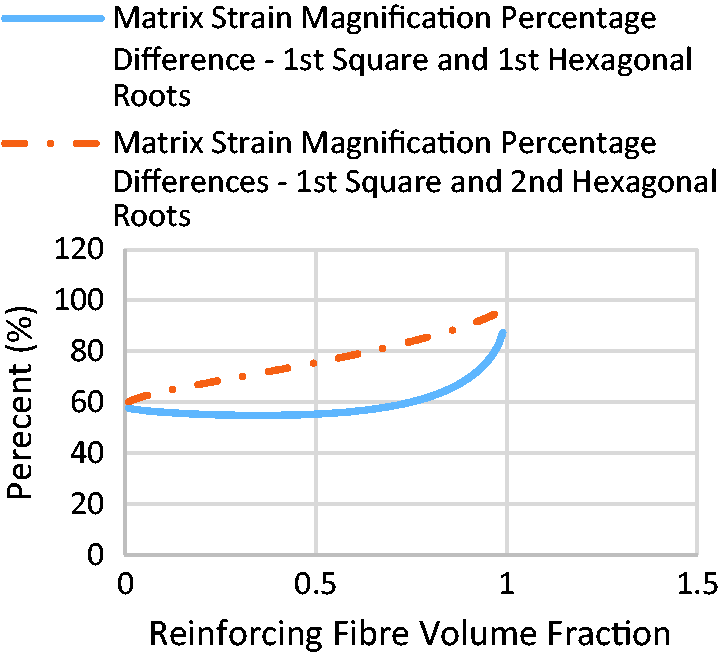
The matrix/central sub-region composite stress ratio percentage difference for the two reinforcing fibre geometries is seen from Figure 17 to be above 48% for all volume fractions of the reinforcing fibre. Again going by the cut-off of 10%, this implies that the matrix/central sub-region composite stress ratios are dependent on the geometry of the reinforcing fibre.The curves in Figures 10 to 17 all show the transverse stresses in the central sub-region composite, fibre and matrix to be different for all but two volume fractions of the reinforcing fibre. These are: 71% for the matrix and fibre in the square array, and 97% for the matrix and central sub-region composite in the hexagonal array. It is safe therefore to state that the iso-stress or Reuss rule does not apply for these two fibre geometries.
Comparison of results from the Halpin–Tsai equations and the iso-stress rule
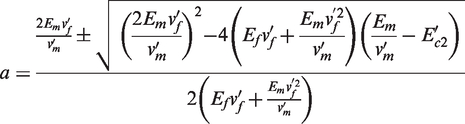
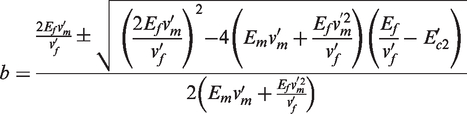
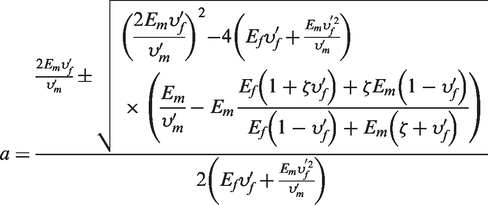
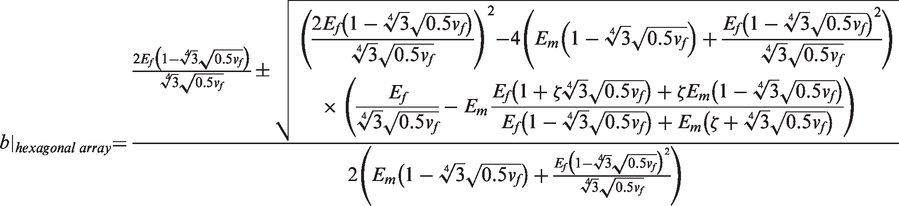
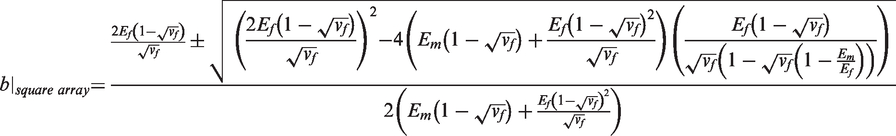
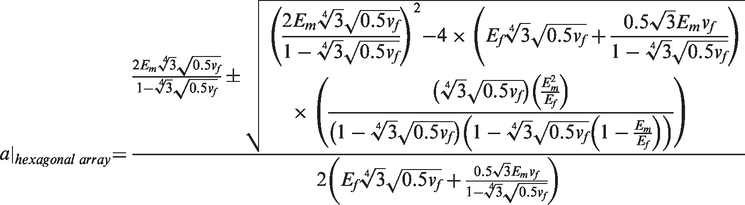
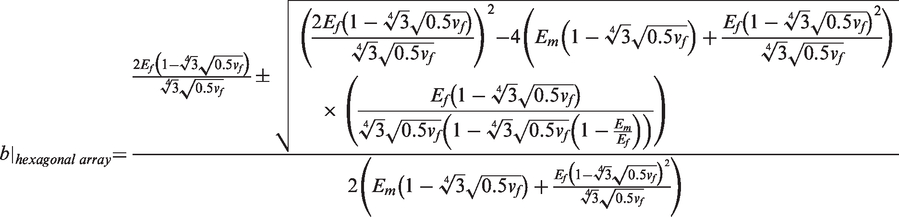
The variation with the volume fraction of reinforcing fibre of parameters (a and b) obtained from equations (15) and (16) for square arrays and equations (17) and (18) for hexagonal arrays is now compared with that for the same parameters obtained from corresponding equations based on the iso-stress rule. These latter equations are reproduced below as equations (25) and (26) for square arrays and equations (27) and (28) for hexagonal arrays in order to study the error arising from assuming that the Reuss rule does apply.
Results and discussion
It is noted from the relationships,
The absolute difference in the values of fibre strain reduction for the two approaches is small in magnitude as is evident in Figure 18. The percentage difference, however, is high and diminishes non-linearly from a value of 83.32% (3% υf) to 56.94% (78% υf) as shown in Figure 19. This is also a measure of the error arising from assuming the Reuss rule applies for estimating the reinforcing fibre strain reduction for square arrays. The errors up to and beyond the practical limit of fibre reinforcement for the square array of fibres are so high as to obviate use of calculations based on this assumption to predict the strain reduction in the reinforcing fibres.
The matrix strain magnification difference is seen in Figure 20 to be small rising from 0.66 (1% υf) to 4.63 (78% υf). The percentage difference is seen in Figure 21 to largely lie between 19.82 (15% υf) and 30.36 (84% υf). The percentage errors arising from assuming that the Reuss rule prevails for matrix strain magnification is smaller than in the case of strain reductions in the reinforcing fibre. It cannot nevertheless be ignored, being more than the set threshold value of 10%. The assumption of iso-stress in the transverse direction of fibre reinforcement may not therefore be used to determine the values of matrix strain magnification for square arrays of reinforcing fibre composites.
Variation of the percentage strain magnification difference ratio – first roots for both the Halpin–Tsai approach and assuming the Reuss rule prevails with the reinforcing fibre volume fraction for square arrays.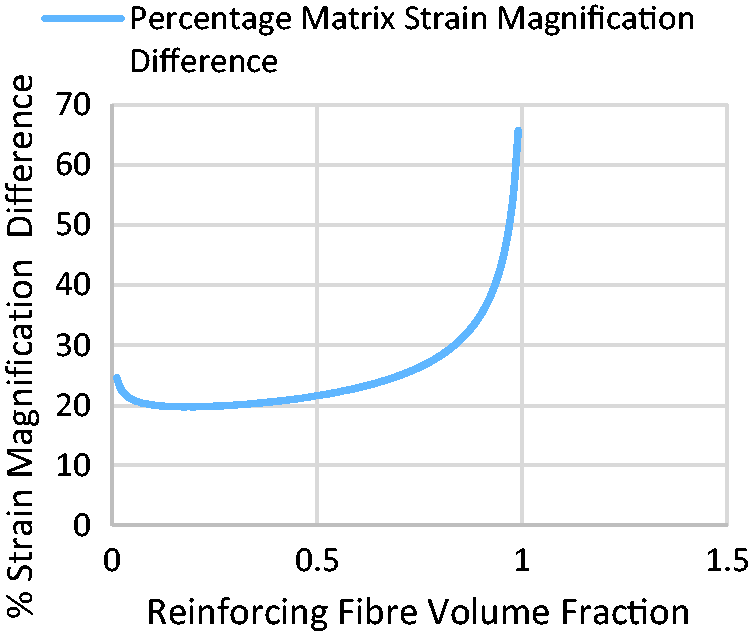
The fibre strain differences are seen in Figure 22 to be small being below 0.52. Below a volume fraction of 0.90%, the percentage differences are seen in Figure 23 to be high, however, lying between 74.67 (78% υf) and 84.68 (1% υf), 61.22% (78% υf) and 13.62% (1% υf), for the upper and lower curves shown in the figure, respectively. The percentage errors arising from assuming that the Reuss rule prevails cannot therefore be ignored.
Variation of the reduction and reduction difference of strain in the fibre with the reinforcing fibre volume fraction of hexagonal arrays – first and second roots for the Halpin–Tsai approach and first root assuming the Reuss rule prevails. Variation of the percentage fibre strain reduction (Halpin–Tsai approach – first and second roots/ assuming the Reuss rule prevails – first root) with reinforcing fibre volume fraction of hexagonal arrays.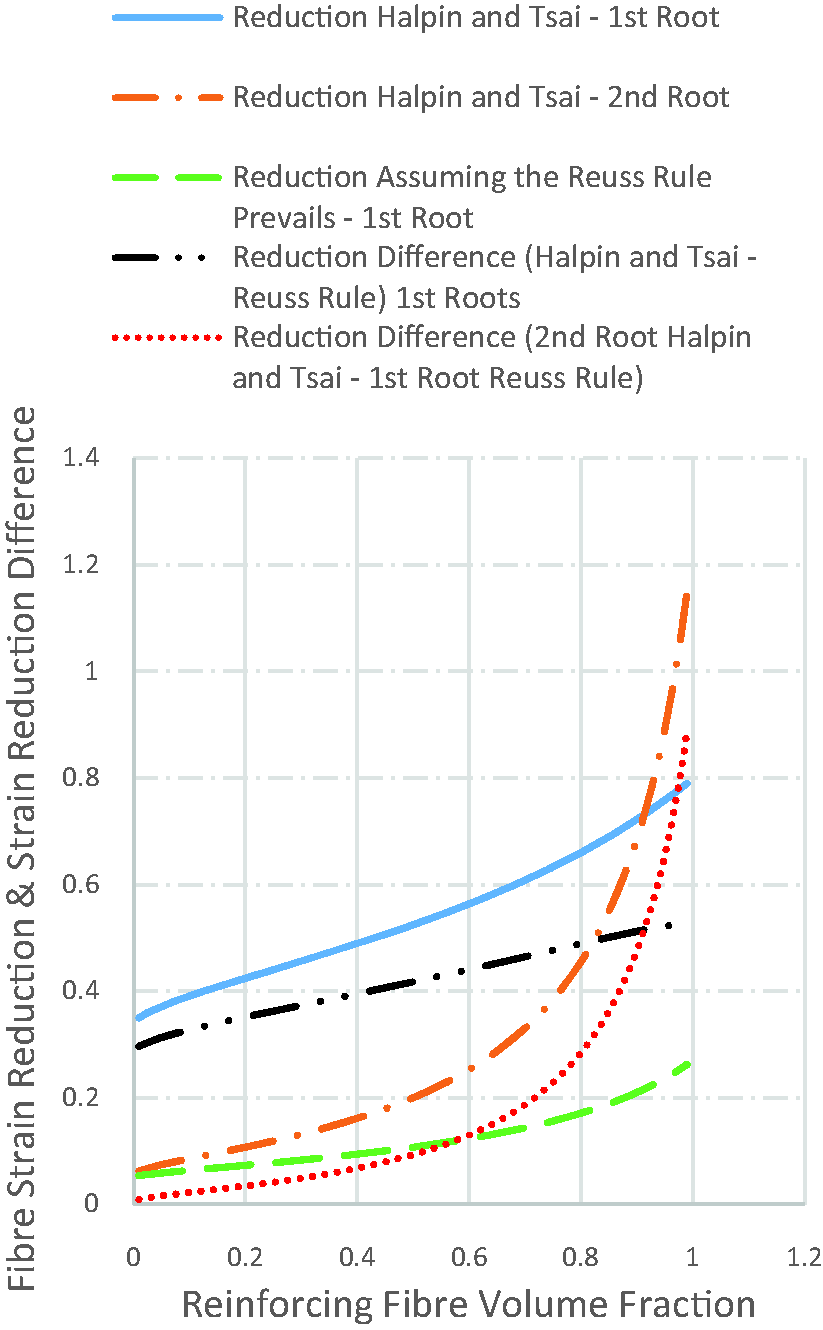
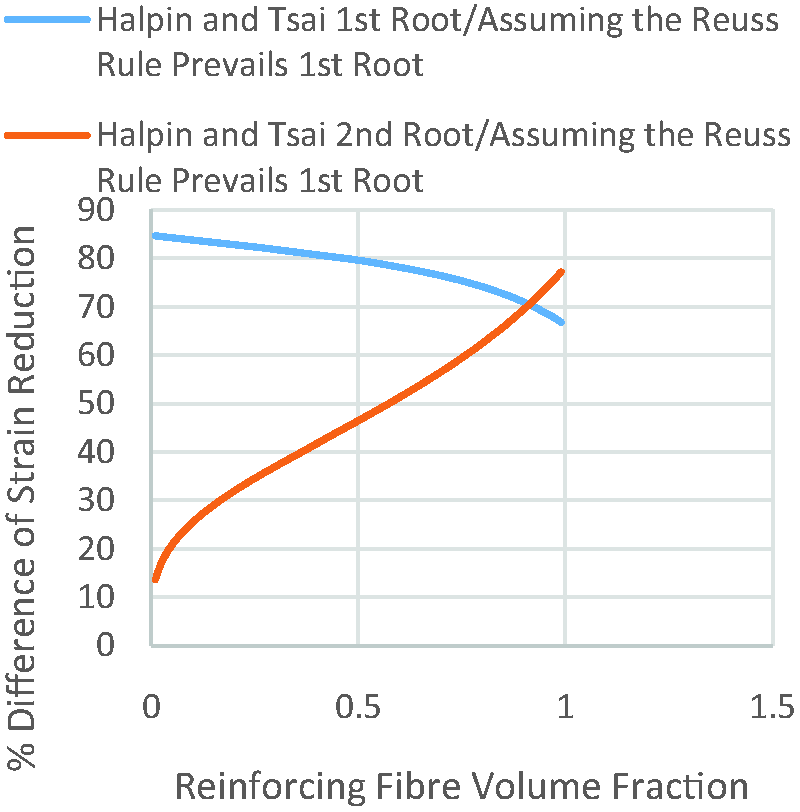
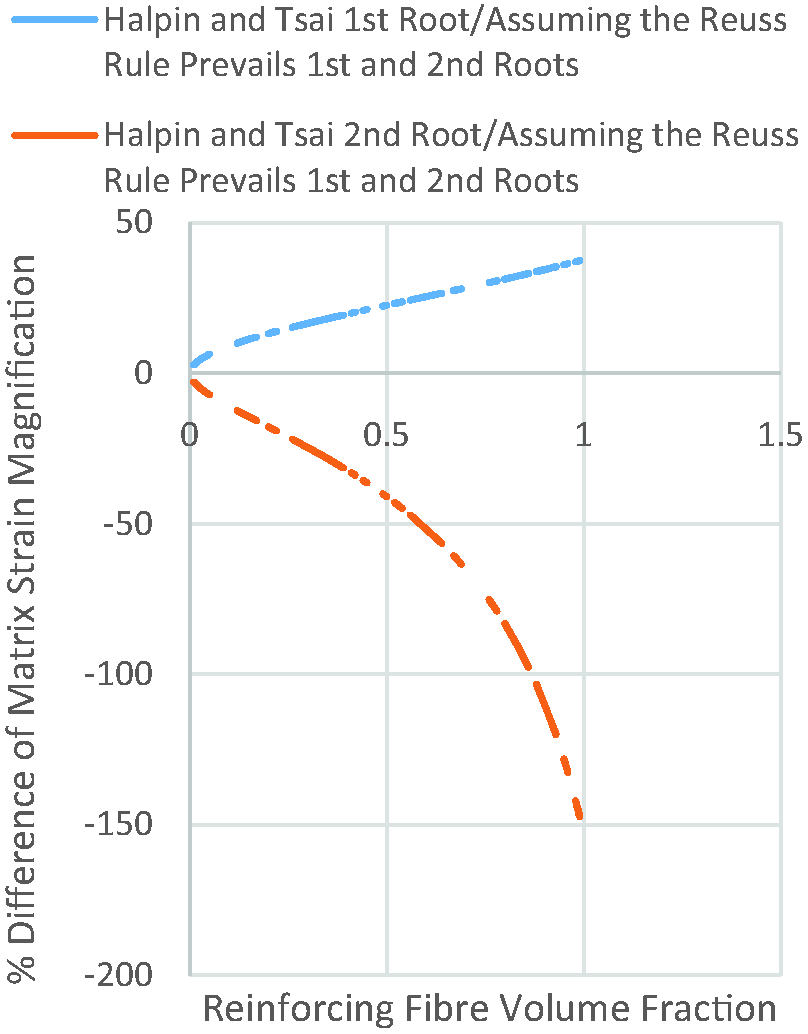
The matrix strain magnification differences are small and are seen in Figure 24 to vary from 2.00 (78% υf) and −2.00 (78% υf) to 0.03 (1% υf) and −0.03 (1% υf) for the first and second roots of the Halpin–Tsai approach, respectively, with relation to the first and second roots assuming the Reuss rule prevails. The matrix strain magnification percentage differences are seen, in Figure 25, to vary from and 2.75 (1% υf) and 10.39 (13% υf) to 30.63 (78% υf) for the Halpin–Tsai first root/assuming the Reuss rules prevail – first and second roots. And further −2.91 (1% υf) to −13.12 (13% vf) and −79.05 (78% υf), and for the Halpin–Tsai second root/assuming the Reuss rules prevail – first and second roots. The percentage errors arising from assuming that the Reuss rule prevails are therefore significant being greater than the set cut-off of 10% over most of the reinforcing fibre volume fraction range, and cannot therefore be ignored.
Variation of the magnification and magnification difference of strain in the matrix with reinforcing fibre volume fraction of hexagonal arrays – first and second roots for the Halpin–Tsai approach and assuming the Reuss rule prevails. Variation of the percentage matrix strain magnification (first and second roots for the Halpin–Tsai approach and assuming the Reuss rule prevails) with reinforcing fibre volume fraction for hexagonal arrays.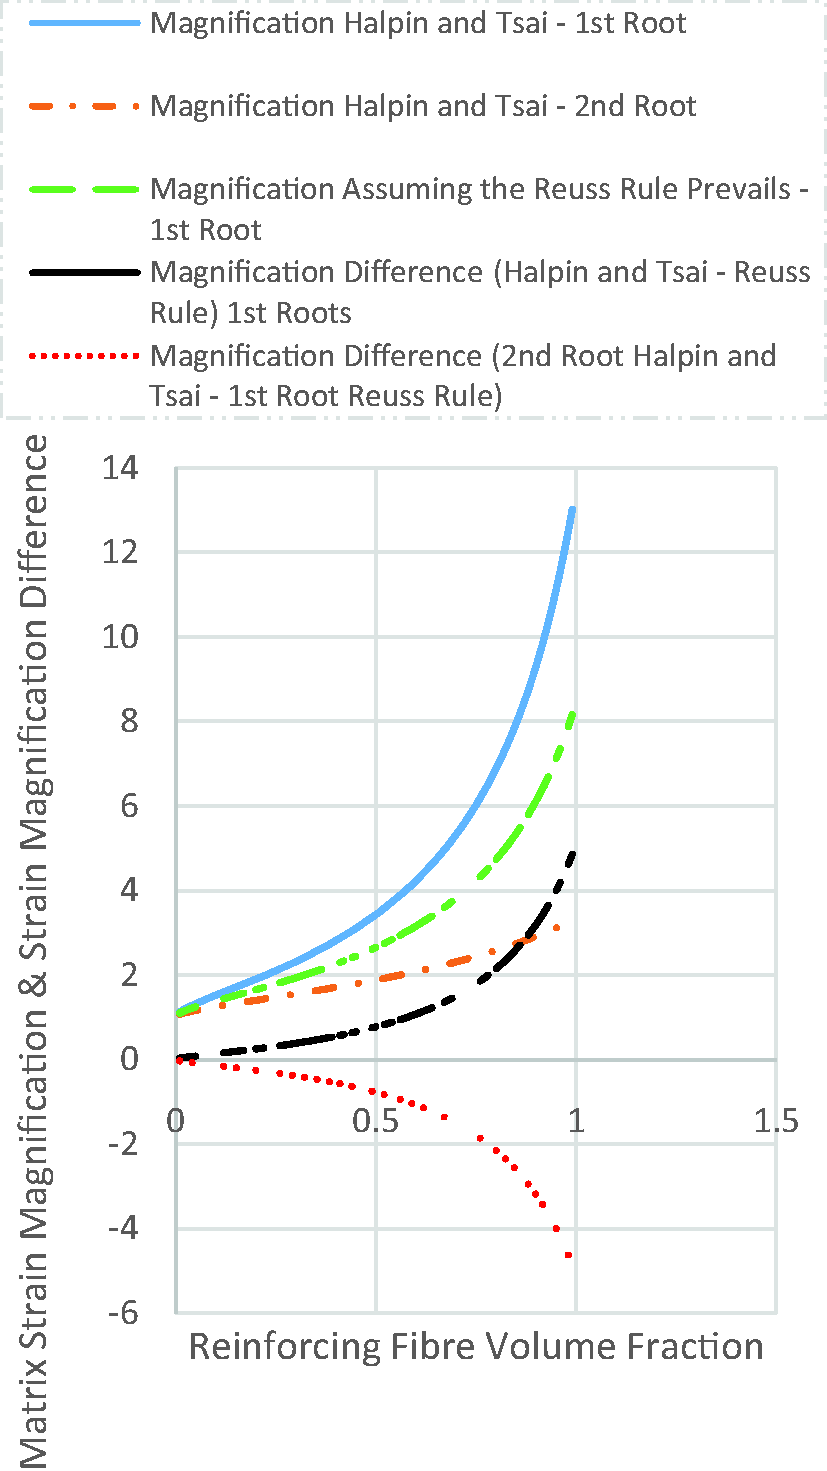
Conclusions
The following has been demonstrated in the transverse direction of fibre-reinforced composites:
Fibre strain reduction is higher for square arrays at all fibre volume fractions. Dependence and independence of fibre strain reduction on fibre geometry is evident above and below 62% volume fraction, respectively. Matrix strain magnification difference for the two fibre geometries increases predominantly with increasing volume fraction at a more or less constant rate. Dependence of matrix strain magnification on the reinforcing fibre geometry is evident. For the square array of reinforcing fibres, the fibre stress is higher and lower than the matrix stress below and above a volume fraction of 71%, respectively, therefore denoting no iso-stress. The fibre stress is higher than the matrix stress for the hexagonal array, for all volume fractions, thus denoting no iso-stress, and decreases at a more or less constant rate with increasing volume fraction. The fibre/central sub-region stress ratios are dependent and independent of the reinforcing fibre geometry below and above a volume fraction of 76%, respectively. The matrix/central sub-region stress ratio for the square array is higher than for the hexagonal array for all volume fractions, thus denoting a dependence of the stress ratio on fibre geometry. The differences between these ratios for the two arrays are higher than those for the fibre/central sub-region stresses. The differences of strain and stress ratios arising from assumption of the Reuss rule for square and hexagonal arrays observed here, are too large to be ignored.
Footnotes
Conflict of interest
None declared.
Funding
This research received no specific grant from any funding agency in the public, commercial, or not-for-profit sectors.