
Abstract
While Automated Fiber Placement (AFP) of thermoset matrix composites are widely used in the aviation industry, there is little conclusive research on the relationship between the physical model of bonding interface formation process and the actual bonding strength between prepreg layers formed in AFP process. Although massive amounts of experimental data on prepreg tack have been achieved from existing research, engineers are unable to use these data as a decisive criterion in choosing process parameters. In this research, a prepreg layup physical model based on reptation model and viscoelastic mechanical model is built, in which the bonding interface formation process is divided into two stages, namely, diffusion and viscous stage. Layup-peeling experiments are conducted via a special designed high-speed layup experimental platform so that practical AFP process parameters can be imitated, and a logarithmic curve of layup velocity-peeling energy under different layup pressure is achieved. The slope of the logarithmic curve and the surface morphology of the sample after peeling prove the correctness of the established model. Simultaneously, the experimental data proves that when prepreg is peeled off, the transition from the cohesive failure mode to the interface failure mode occurs at the laying speed between 100 mm/s and 200 mm/s. These results can be used as a reference for choosing AFP process parameters to realize the balance between good bonding quality and harmless separation of adjacent prepreg layers.
Keywords
Introduction
Carbon fiber composites are widely used in the aviation industry as they are superior to conventional materials in some aspects of performance, such as strength-to-weight ratio. The high cost of manufacturing, however, limits its application in other industries. Automated Material Placement (AMP) processes, in which machinery applies prepreg to tool surfaces to form a laminate, are commonly used in the aviation industry to replace manual layup processes, and therefore, improve productivity. Automated Material Placement technology usually includes ATL (Automated Tape Laying) and AFP (Automated Fiber Placement). Both processes use prepreg as raw material, which is unidirectional epoxy preimpregnated carbon fibers in the form of tape.
1
Among them, ATL equipment lays a single prepreg tape with a width of 150 mm or more, while AFP equipment lays multiple (usually 8 or 16) slit prepreg fibers, the width of which is usually 1/8”, 1/4”, or 1/2”. Due to its higher production flexibility and less waste rate, AFP technology is gradually replacing ATL technology and becoming the mainstream of AMP technology. The AFP equipment is mainly composed of a laying head, the core component that realizes the laying function, and a robot/gantry device, which realizes the kinematics function. See Figure 1 for the basic principle of AFP laying head. Schematic diagram of Automated Fiber Placement laying head.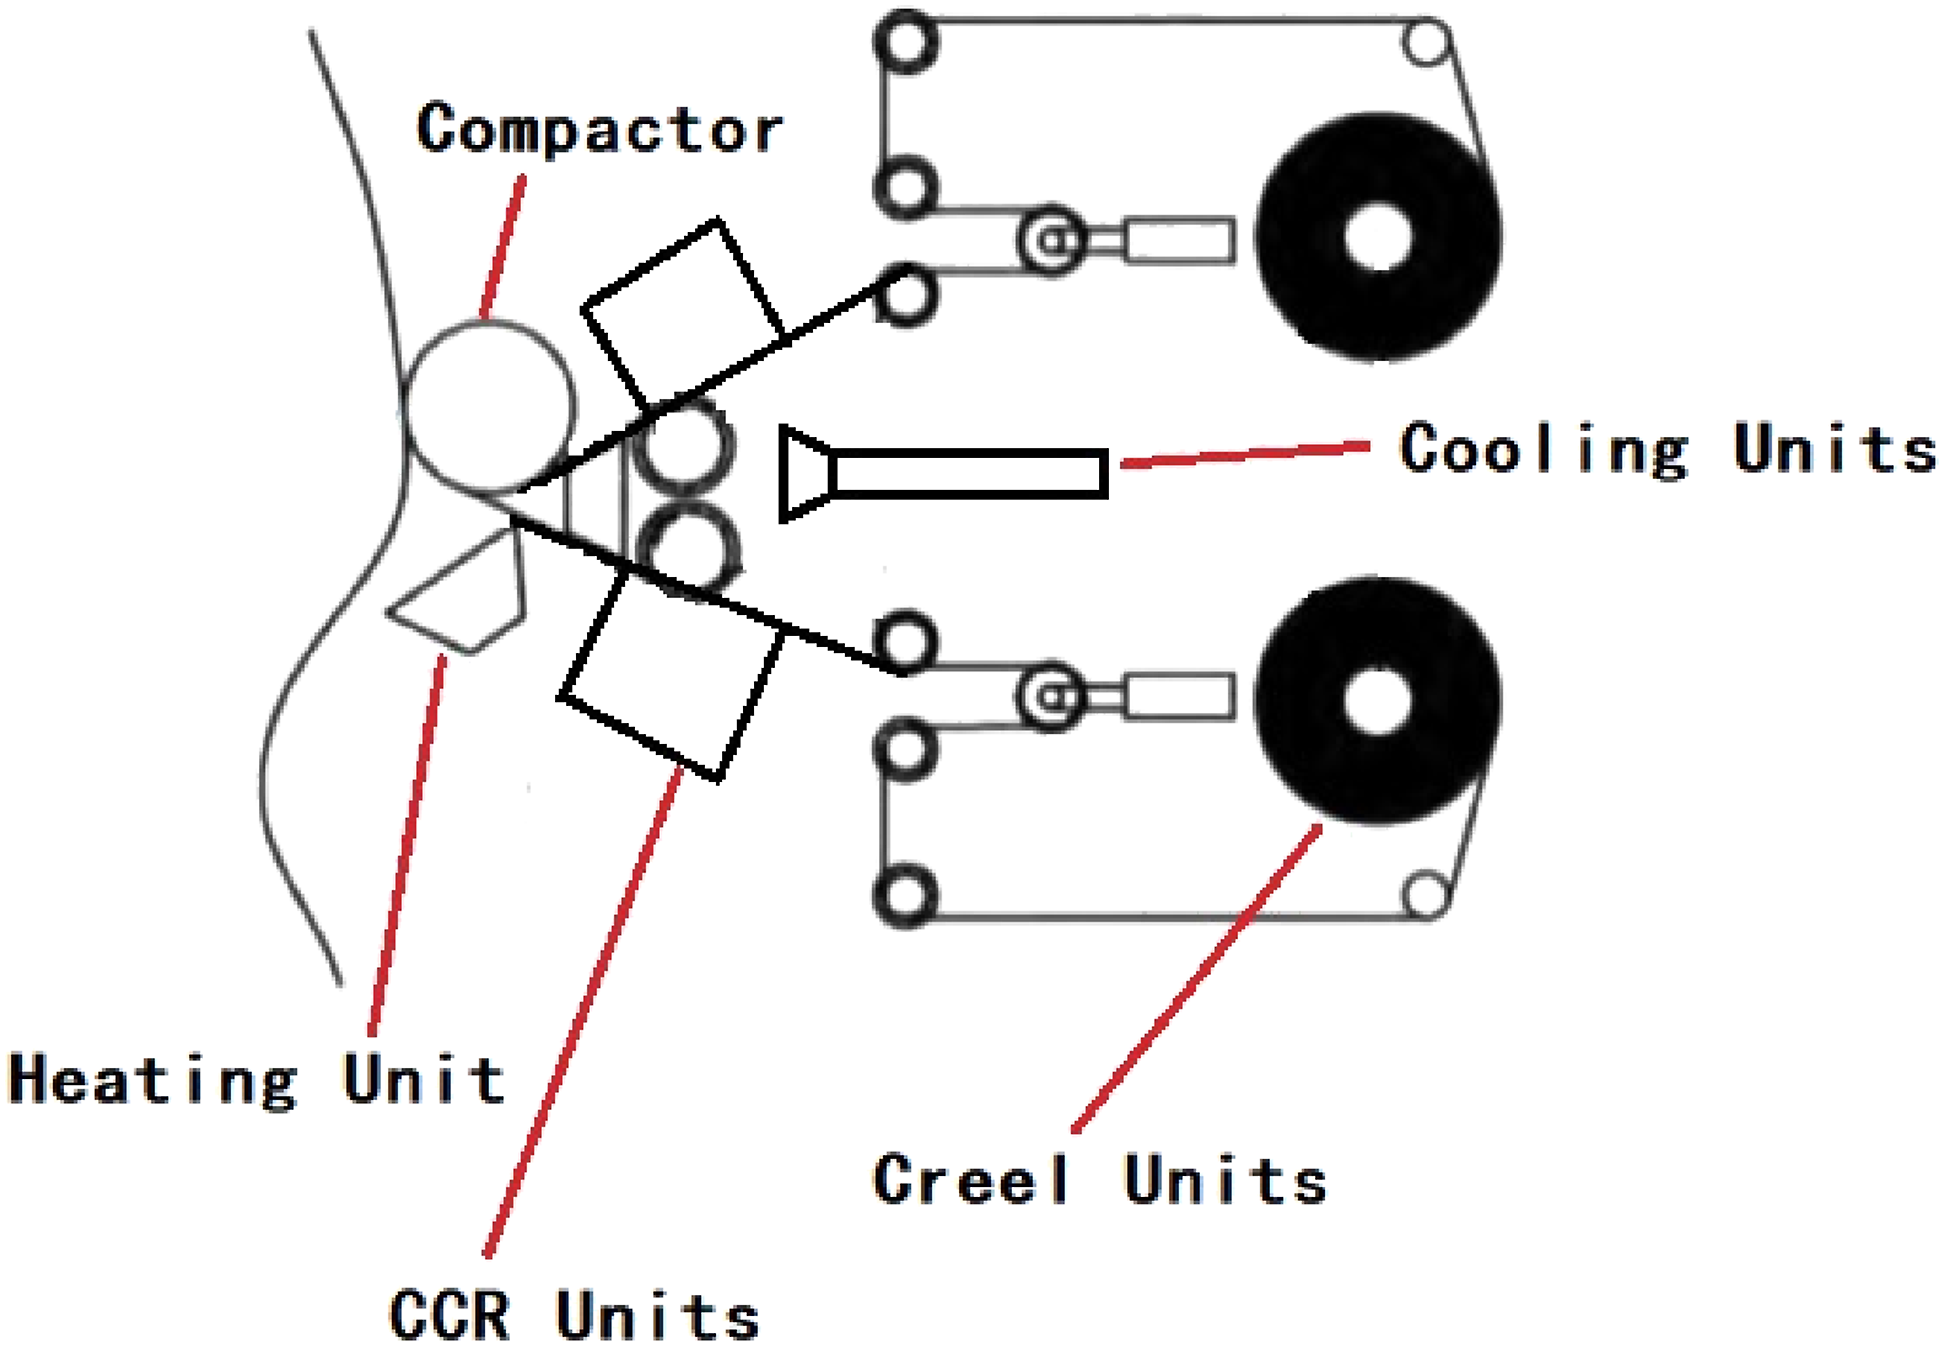
As shown, the laying head is equipped with CCR units, that is, a mechanism that realizes the function of cutting fibers (CUT), clamping fibers and restarting fibers. The fibers are sent to the surface of the mold by the restarting units and pressed on the surface of the mold by the flexible compactor. When a fiber tow comes to the end, the cutting unit cuts the prepreg, and the clamp unit stops the movement of the remaining prepreg drawn from the spool. During the laying process of fibers, a certain tension is required to maintain the stability of the fiber path. This tension is maintained by the tension control mechanism. The temperature control device consists of a heating device and a cooling device. The heating device increases the surface temperature of the ply to increase the fluidity of the prepreg resin. This way, the prepreg can be bonded to the previous layer or mold surface. The cooling device lowers the temperature of the prepreg inside the AFP head, reduces its viscosity, and prevents blockages. The compactor applies a controlled forming pressure to the plies to ensure bonding between the layers. Figure 2 shows an 8 × 1/4” AFP machine designed by the author: Example of an Automated Fiber Placement machine.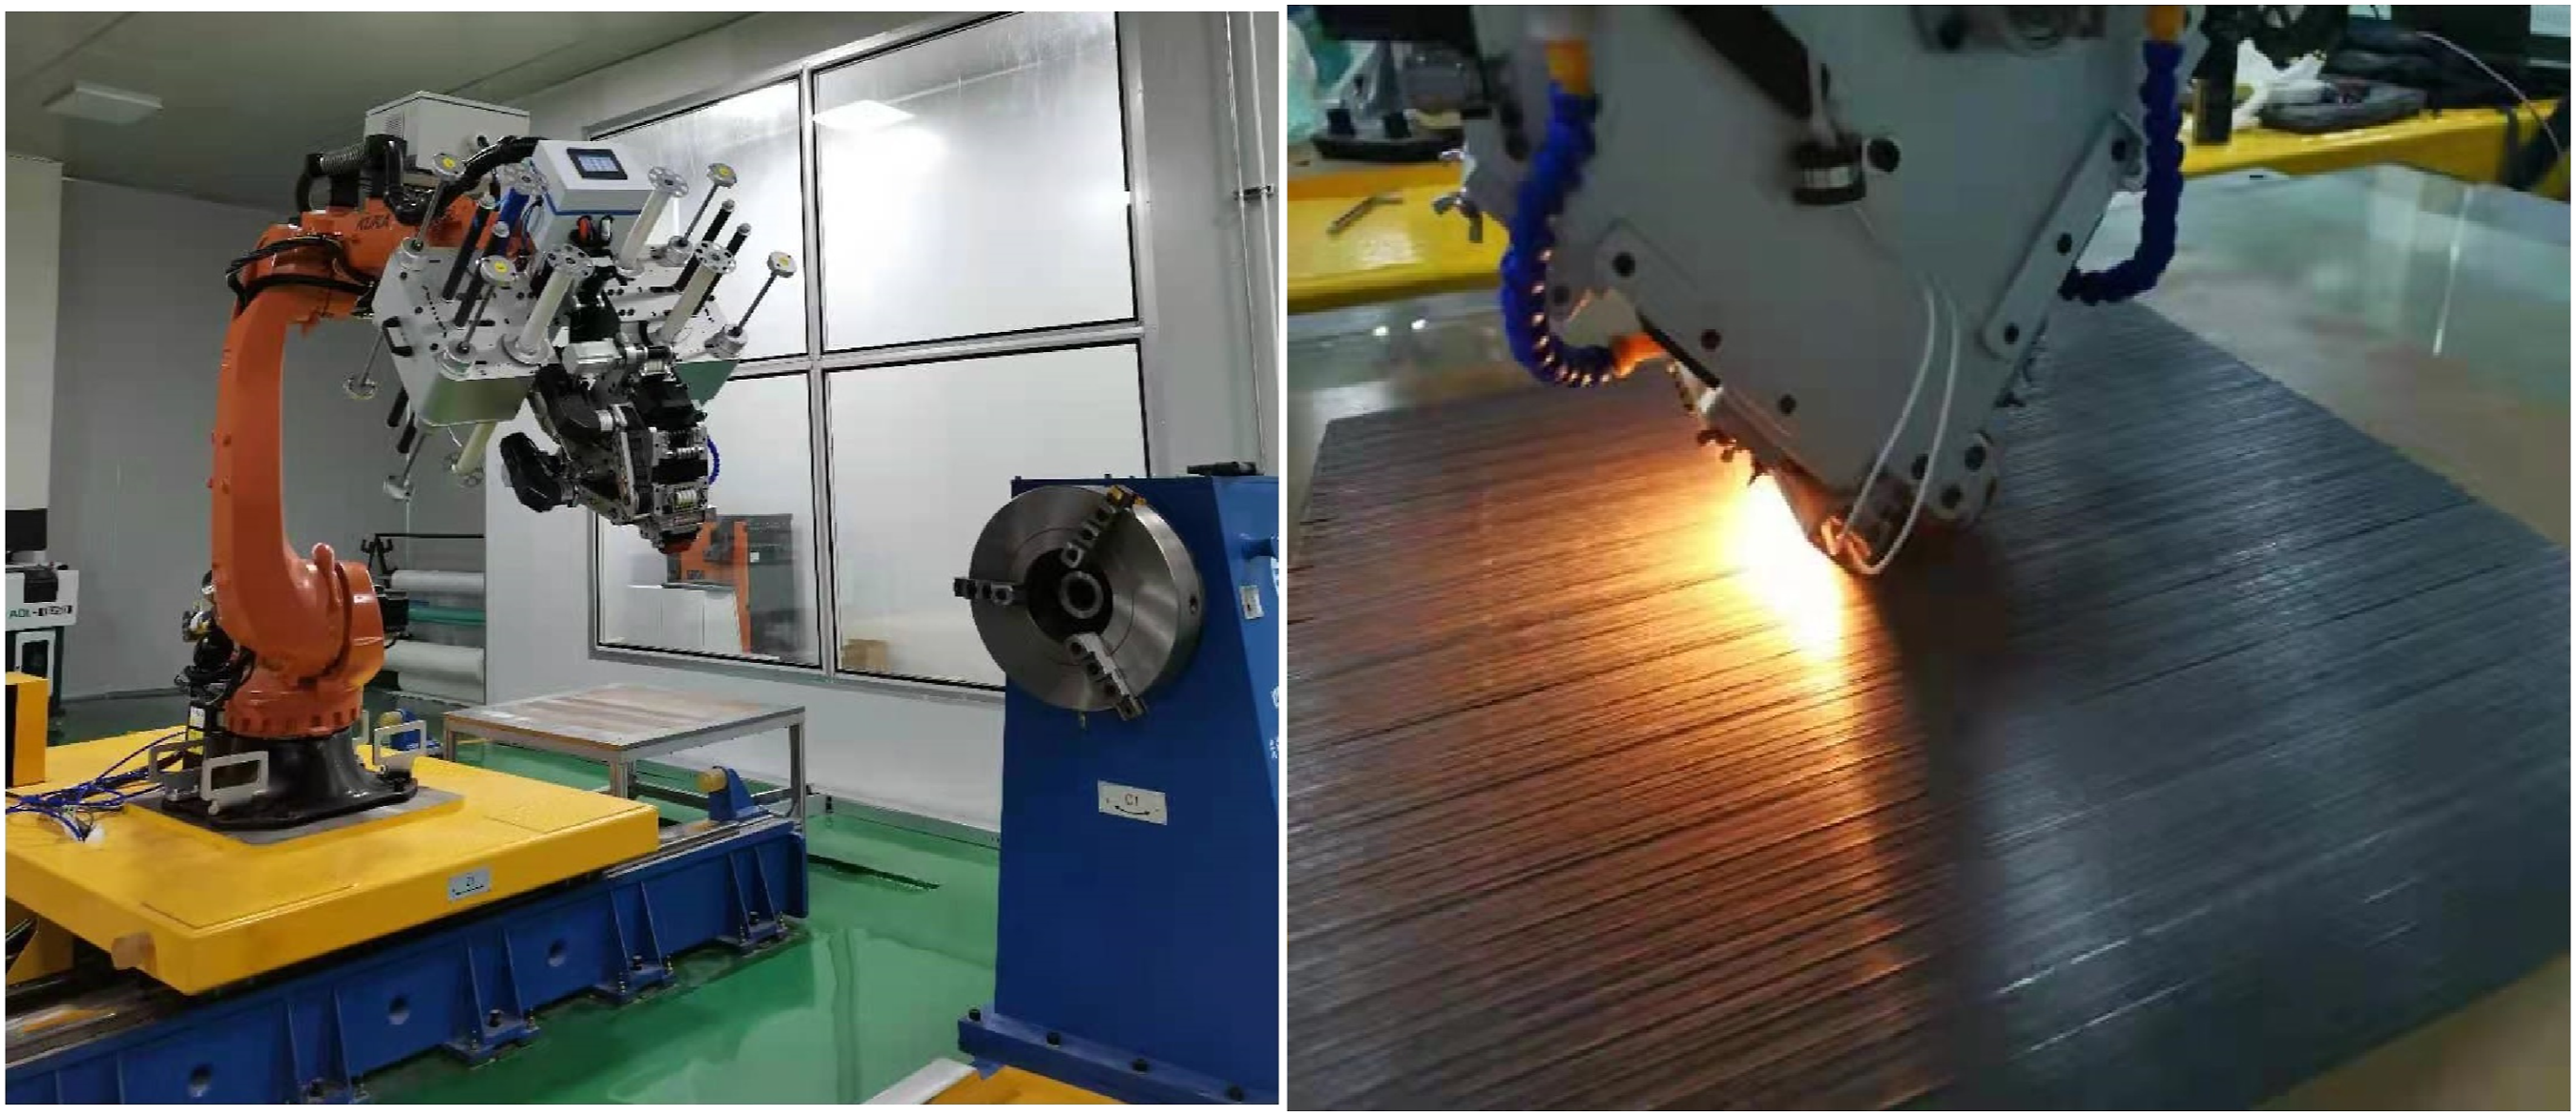
Since the essence of the AFP process is the bonding process of the prepreg on the mold or itself, it is necessary to study the bonding process model of the prepreg to optimize the process parameters.
Tack requirements of prepreg for AFP
Phenomenologically, prepreg tack is not an effect of the epoxy cure reaction forming covalent bonds to a substrate but rather is an intrinsic stickiness in the absence of any chemical reactions or solvent evaporation. 1 The unique automated placement process requires specific process parameters and material properties. The reasons for this special requirements are as follows:
The lower limit of the prepreg tack must meet the basic bonding reliability requirement. The fiber placement speed in AFP process can reach 1 m/s, and the diameter of flexible compactors used to apply pressure on prepreg ply is usually around 60 mm. This results in a very short time for the compactor to sweep across the ply to apply pressure to bond adjacent plies together (around 100
Of course, if the laying temperature and laying pressure are increased, it is possible to increase the bonding strength without reducing the laying efficiency, but both of these measures have limitations. From the perspective of laying pressure, the laying force allowed by the manufacturer of the AFP machine is usually measured by the force applied to the plies per millimeter of the compactor length, usually the value is 0–10 N/mm. For example, for an 8” × ¼” AFP machine with a total tow width of 50.8 mm, the maximum allowable laying force is about 500 N. When the compactor is pressed, it must be deformed enough to fit the surface of the mold. In practice, such a flexible compactor has a Shore hardness of 30A. For such a compactor, the maximum allowed laying force of 10 N/mm in actual production is close to strength limit. If the laying pressure continues to increase, it will likely cause damage to the compactor during long-term use. Figure 3 shows a silicone rubber compactor that is damaged under a laying pressure of 12 N/mm. Compactor cracked under excessively high laying pressure.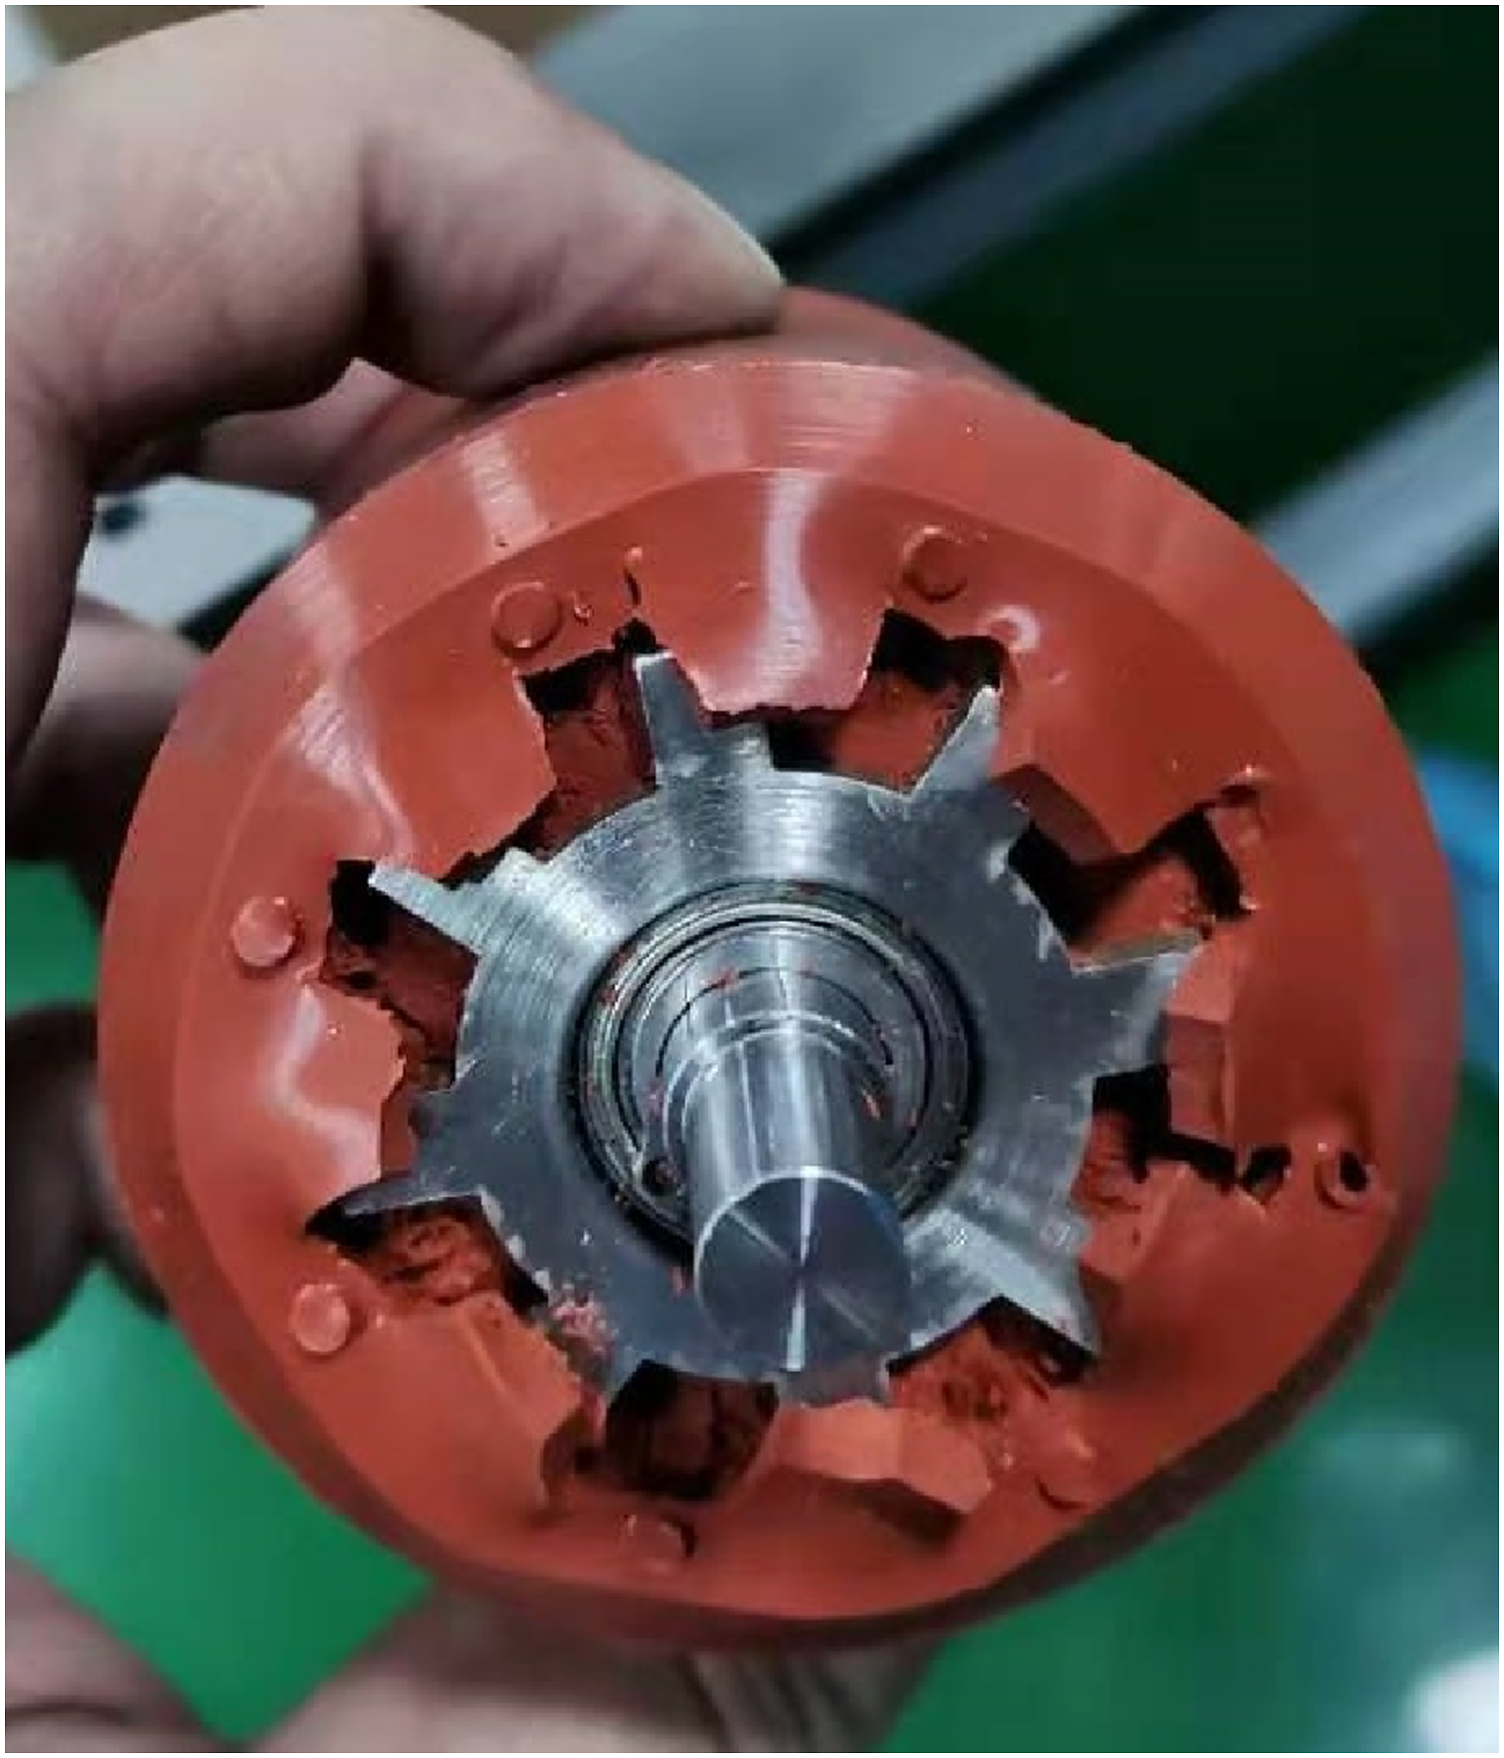
On the other hand, if the laying temperature is increased at the same laying speed, the power of the heating device is bound to increase, thereby increasing the volume of heating device. For details, see Figure 4. The green component in the picture is the heating device, and the arc is a simulated concave surface laying mold (R = 155 mm). Since the heating device needs to be placed close to the nipping point (the point at which fibers meet the mold, as shown in the green circle in Figure 4) to improve heating efficiency, the increase of the heating device volume will seriously affect the outer contour of the AFP head, thereby limiting the accessibility of the equipment when laying on concave surface. To make matters worse, laying on a concave surface is usually the occasion where it is most necessary to increase the bonding strength between layers. Therefore, the practical value of this method is limited. The spatial position of the heating device.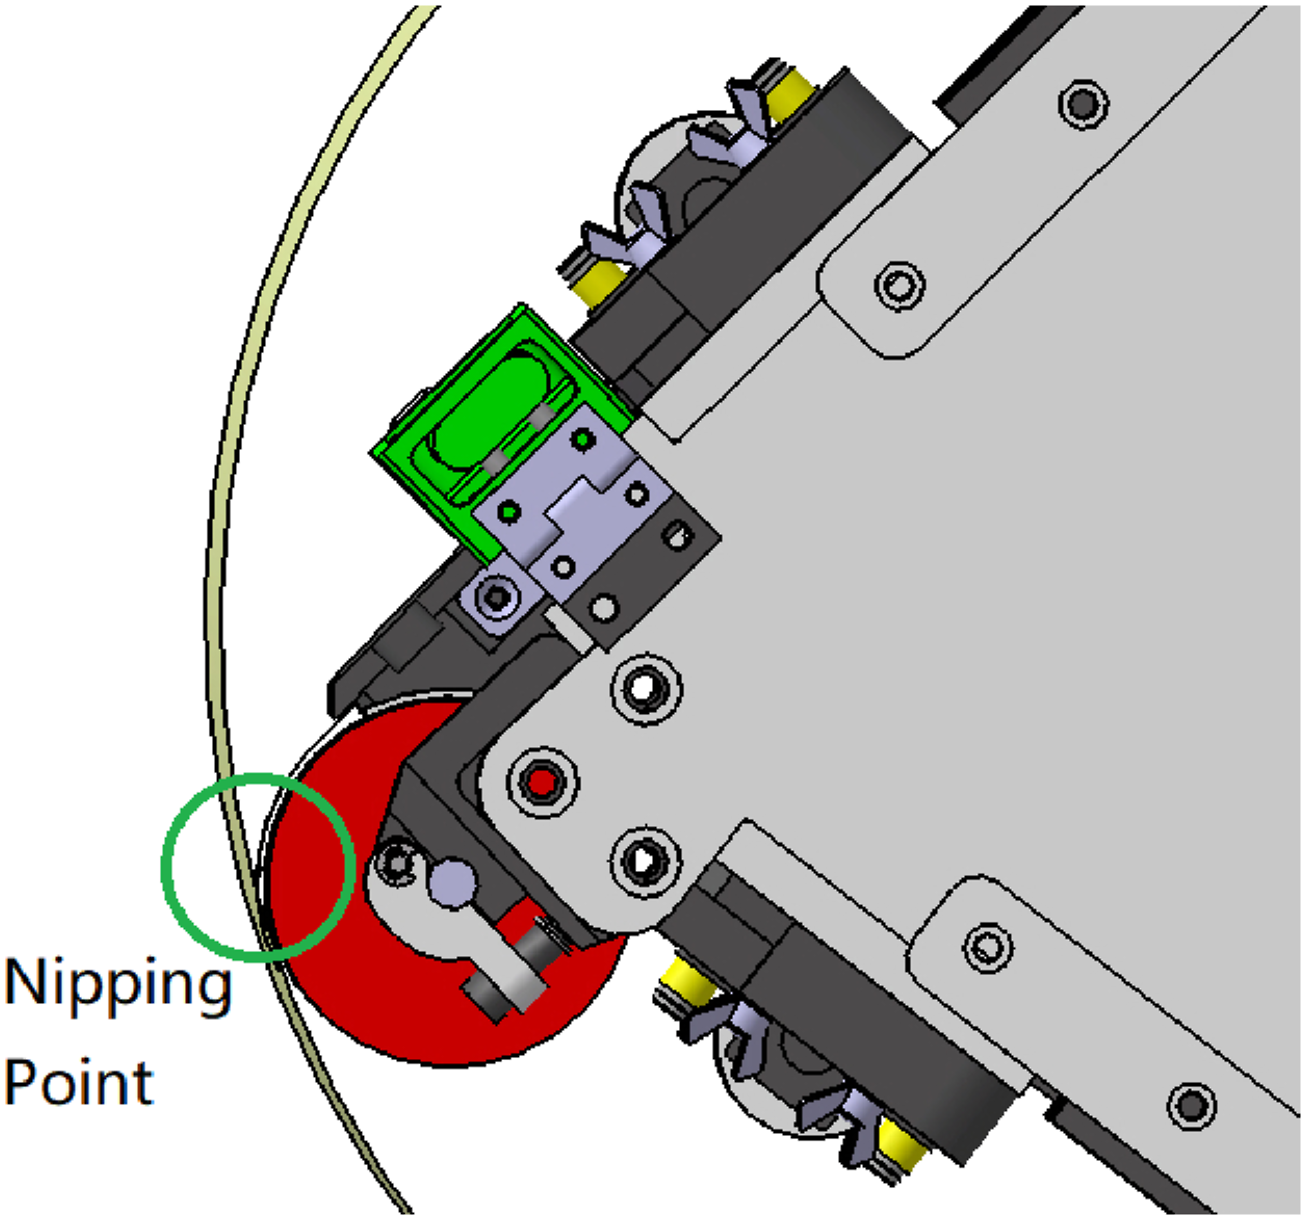
There are two main factors that determine the upper limit of the prepreg tack. First, due to machine failure or program bug, misplaced ply is common in industrial production that most AFP machines usually include an automated in-process monitoring system. 3 Under such circumstance, wrong ply must be removed without doing harm to correct ply, which indicates that the tack of prepreg cannot be too high. In addition, since the prepreg undergoes complicated operations in the AFP machine, if the tack of the prepreg is too high, prepreg blockage is very likely to occur, resulting in a significant decrease in equipment reliability. When M21C prepreg (specially designed for AFP) is processed by the equipment shown in Figure 2, equipment reliability is good. When the prepreg for manual layup (which has a much higher tackness than that of M21C) is used, the prepreg tapes get stuck on AFP head rollers and blocks the equipment’s fiber paths. The high tackness of prepreg will seriously affect the production efficiency of AFP machine and deteriorate the process adaptability.
Thus, the tack of prepreg must be large enough so that it can adhere to the mold and the laminate after heating/pressing. At the same time, it should be small enough so that the finished layer can be easily torn off, and the fibers do not stick to the parts of in the laying head.
To date, there is no common quantitative criteria on prepreg tack in the aviation industry. One commonly used qualitative test method includes three steps: (1). Bond two pieces of prepreg together with a rubber compactor. (2). Separate the two pieces of prepreg described earlier and observe if they remain unharmed. (3). Press a piece of prepreg on a polished stainless steel plate with a rubber roller, flip the plate upside down, and observe whether the prepreg remains in the same place after 1 hour. Only first-class prepreg can meet the unharmed separation criterion in step two. This qualitative criterion provides a good description on AMP prepreg tack requirement, that is, obtaining as high interlaminar strength as possible while realizing laminates harmless separation. However, the testing conditions in this test method are not quantitatively described and far away from actual AMP process parameter. Therefore, it cannot be used directly in choosing process parameters.
It can be seen from the above demonstration that the requirements for prepregs in AFP process are relatively harsh. Therefore, this study uses a typical commercial AFP prepreg, M21C prepregs manufactured by Hexcel, to conduct experiments to maximize the guidance of actual production.
The influence of AFP process parameters on laminate bonding strength
The bonding strength between layers of prepreg formed by AFP is related not only to resin viscosity but also process parameters such as placement speed, temperature, and pressure. For industrial AFP machines, common process parameters are as follows: laying speed is 10–60 m/min, tension of single fiber is 3–5 N, laying pressure is 1–10 N/mm, and laying temperature is 37°C–40°C.
In published studies, multiple experiments have been conducted to quantitatively describe tack between adjacent layers of prepreg laminates. Probe and peeling tests are the two most common prepreg tack test methods. Probe test is usually used in pressure-sensitive adhesive (PSA) field. Its basic method is fixing one piece of prepreg on a probe and another on a fixed base below the probe. The two pieces are clamped until they are bonded, and then the probe is moved upward at a fixed speed while the probe’s displacement and force are recorded. 4 Interlaminar bonding strength can be achieved from this method in form of normal stress or interlaminar separation energy. On the other hand, multiple types of peeling tests are used to measure the strength of adhesive joints, such as mandrel and T peeling. Crossley, Schubel and Warrior 5 developed a special apparatus to conduct peel testing, which reflects AMP process. Williams and Kauzlarich 6 found that the peeling force recorded per unit width of prepreg laminate actually represents the separation energy in between layers per unit size. This indicates that the forces measured in probe and peeling tests are different in a physical sense.
There have been many studies on the relationship between prepreg viscosity and laying process parameters. The tack of prepreg is determined by both adhesion between contact surfaces and cohesion within prepreg resin matrix. 7 By studying the tack of prepreg on metal surfaces, Crossley et al. 8 found that by transposing the measured data using a Williams-Landel-Ferry equation and constants determined from rheology, time temperature superposition was demonstrated for both prepreg tack and dynamic stiffness. By using this conclusion, low-temperature and low-speed experiments can be used to simulate the actual high-temperature and high-speed AFP process to a certain extent. Recently, Smith et al. 9 and Endruweit et al. 10 used this principle to extrapolate the simulated laying speed to a maximum of about 2500 mm/min, and studied the relationship between the out time of the prepreg and the bonding strength between layers. It is found that there is a trend for maximum tack to decrease with increasing out time. 10 Gillanders et al. 11 found that tack between adjacent prepreg layers increases with compaction time. Through probe experiments, Dubois 14 and Budelmann et al. 12 discovered that the bonding force between the prepreg layers increases with the increase in compression force. Crossley, Schubel and Warrior 5 found that the tack of the prepreg will reach a peak as laying temperature increases, and then gradually decrease. Lukaszewicz, Potter and Eales13,14 found that as the laying temperature increases, the voidage of test samples falls, indicating that the real contact area between the prepreg layers is larger when the temperature increases. Rao et al. 15 designed two-level, full factorial experiments for the influence of compaction load, layup speed and temperature to understand their effects on the peeling force, both individually and synergistically, and the experimental tests carried out at the predicted factor settings agree well with the analysis.
Research objectives
Although the above studies have greatly increased the understanding of the interlayer problems of prepregs in AFP, these studies still share common problems.
First, the laying speed simulated by the existing research is too slow, which is inconsistent with the actual speed of AFP and reduces the practical significance of the obtained results. For example, take the Boeing 787 head component. To meet the monthly production rate requirements, the equipment needs to lay more than 9 kg of prepreg per hour. Taking into account the existence of the idle stroke and the operation time of threading and cleaning, the actual laying speed of the equipment must be at least 200 mm/s. In addition, the frequent acceleration and deceleration of the AFP equipment is one of the factors that most affect the efficiency of work. Therefore, AFP machines today have the function of cut-on-the-fly and feed-on-the-fly, so that the cutting/feeding operation can be realized at a laying speed greater than 200 mm/s. In other words, even at the beginning and end region of the tow, the laying speed is still greater than 200 mm/s. However, none of the foregoing studies directly tested samples made at a laying speed greater than 100 mm/s. Even if the time-temperature equivalence principle is used to extrapolate the experimental results obtained from slow speed, the maximum laying speed obtained is only 2.51 m/min, which is 41.9 mm/s 9 ; this is outside the working range of the industrial AFP machine. Therefore, the problem of interlayer bonding strength of prepregs in the actual AFP speed range must be studied.
Second, the existing research has not thoroughly studied the process of bonding formation. This has led to unclear conditions for the occurrence of certain phenomena, and the experimental results therefore cannot be directly used to guide actual production. As mentioned earlier, adjacent prepreg layers should be able to be separated without damage to meet the error correction requirements. According to Crossley, Schubel and Warrior 5 and Endruweit et al., 10 researchers discovered that there are two failure modes for the peeling of prepreg laminates, namely interface and cohesive failure. When interface failure occurs, the prepreg can be separated without damage. When cohesive failure occurs, resin threads can be observed between adjacent plies, which destroy the integrity of the prepreg resin film. Therefore, this connection mode should be avoided in actual production. Dubois et al. 4 found that resin threads drawing mainly occurs when the laying speed is slow. However, existing research on the physical model of prepreg interface formation in the automatic placement process is insufficient. Thus, it can neither clearly explain the causes of the two failure modes nor determine the transition between the two failure modes.
Third, the time-temperature equivalent method currently used to obtain the bonding strength between layers at different speeds has not been proven effective for laying speeds higher than the existing research range. The interface fusion of polymer resins is a process of interpenetrating resin molecules on both sides of the interface. This process takes a certain amount of time, and the interface strength increases with degree of molecular interpenetration. Since this process does not exist between prepreg resin and metal surface, the bonding strength of prepreg-metal interface mainly depends on the viscoelastic behavior of the resin, which is in accordance with the time-temperature equivalent relationship. Crossley 8 proved that when the prepreg is laid on the metal surface at a laying speed less than 1000 mm/min, the time-temperature equivalent method can be applied. However, molecular diffusion is not a viscoelastic behavior, and it is not yet proven that time-temperature equivalent effect is accurate in calculation of molecular diffusion. For this reason, the best choice is to make samples with actual industrial laying speed and study the bonding properties between layers.
In view of the problems of the existing research, the peeling samples in this research will be manufactured at the industrial laying speed. The formation model of bonding between prepreg layers is established, and the model is verified by the results from three experiments. On this basis, the occurrence conditions of interface and cohesive failure is analyzed, and references for the selection of process parameters are provided.
AFP prepreg interface formation model
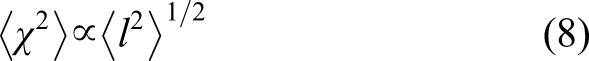
In the field of PSAs and thermoplastic resin welding, the formation of resin bonding interface is usually described as a contact and autohesion process of polymer asperities. This process is a combination of resin deformation and interface diffusion. Wool and O’Connor
16
described the process and believed that if
Figure 5 is a cloud map of the surface topography of the M21C prepreg studied in experiments of this study taken with Leica DVM 6A 3D profilometer. M21C prepreg surface morphology cloud map and resin asperities section view.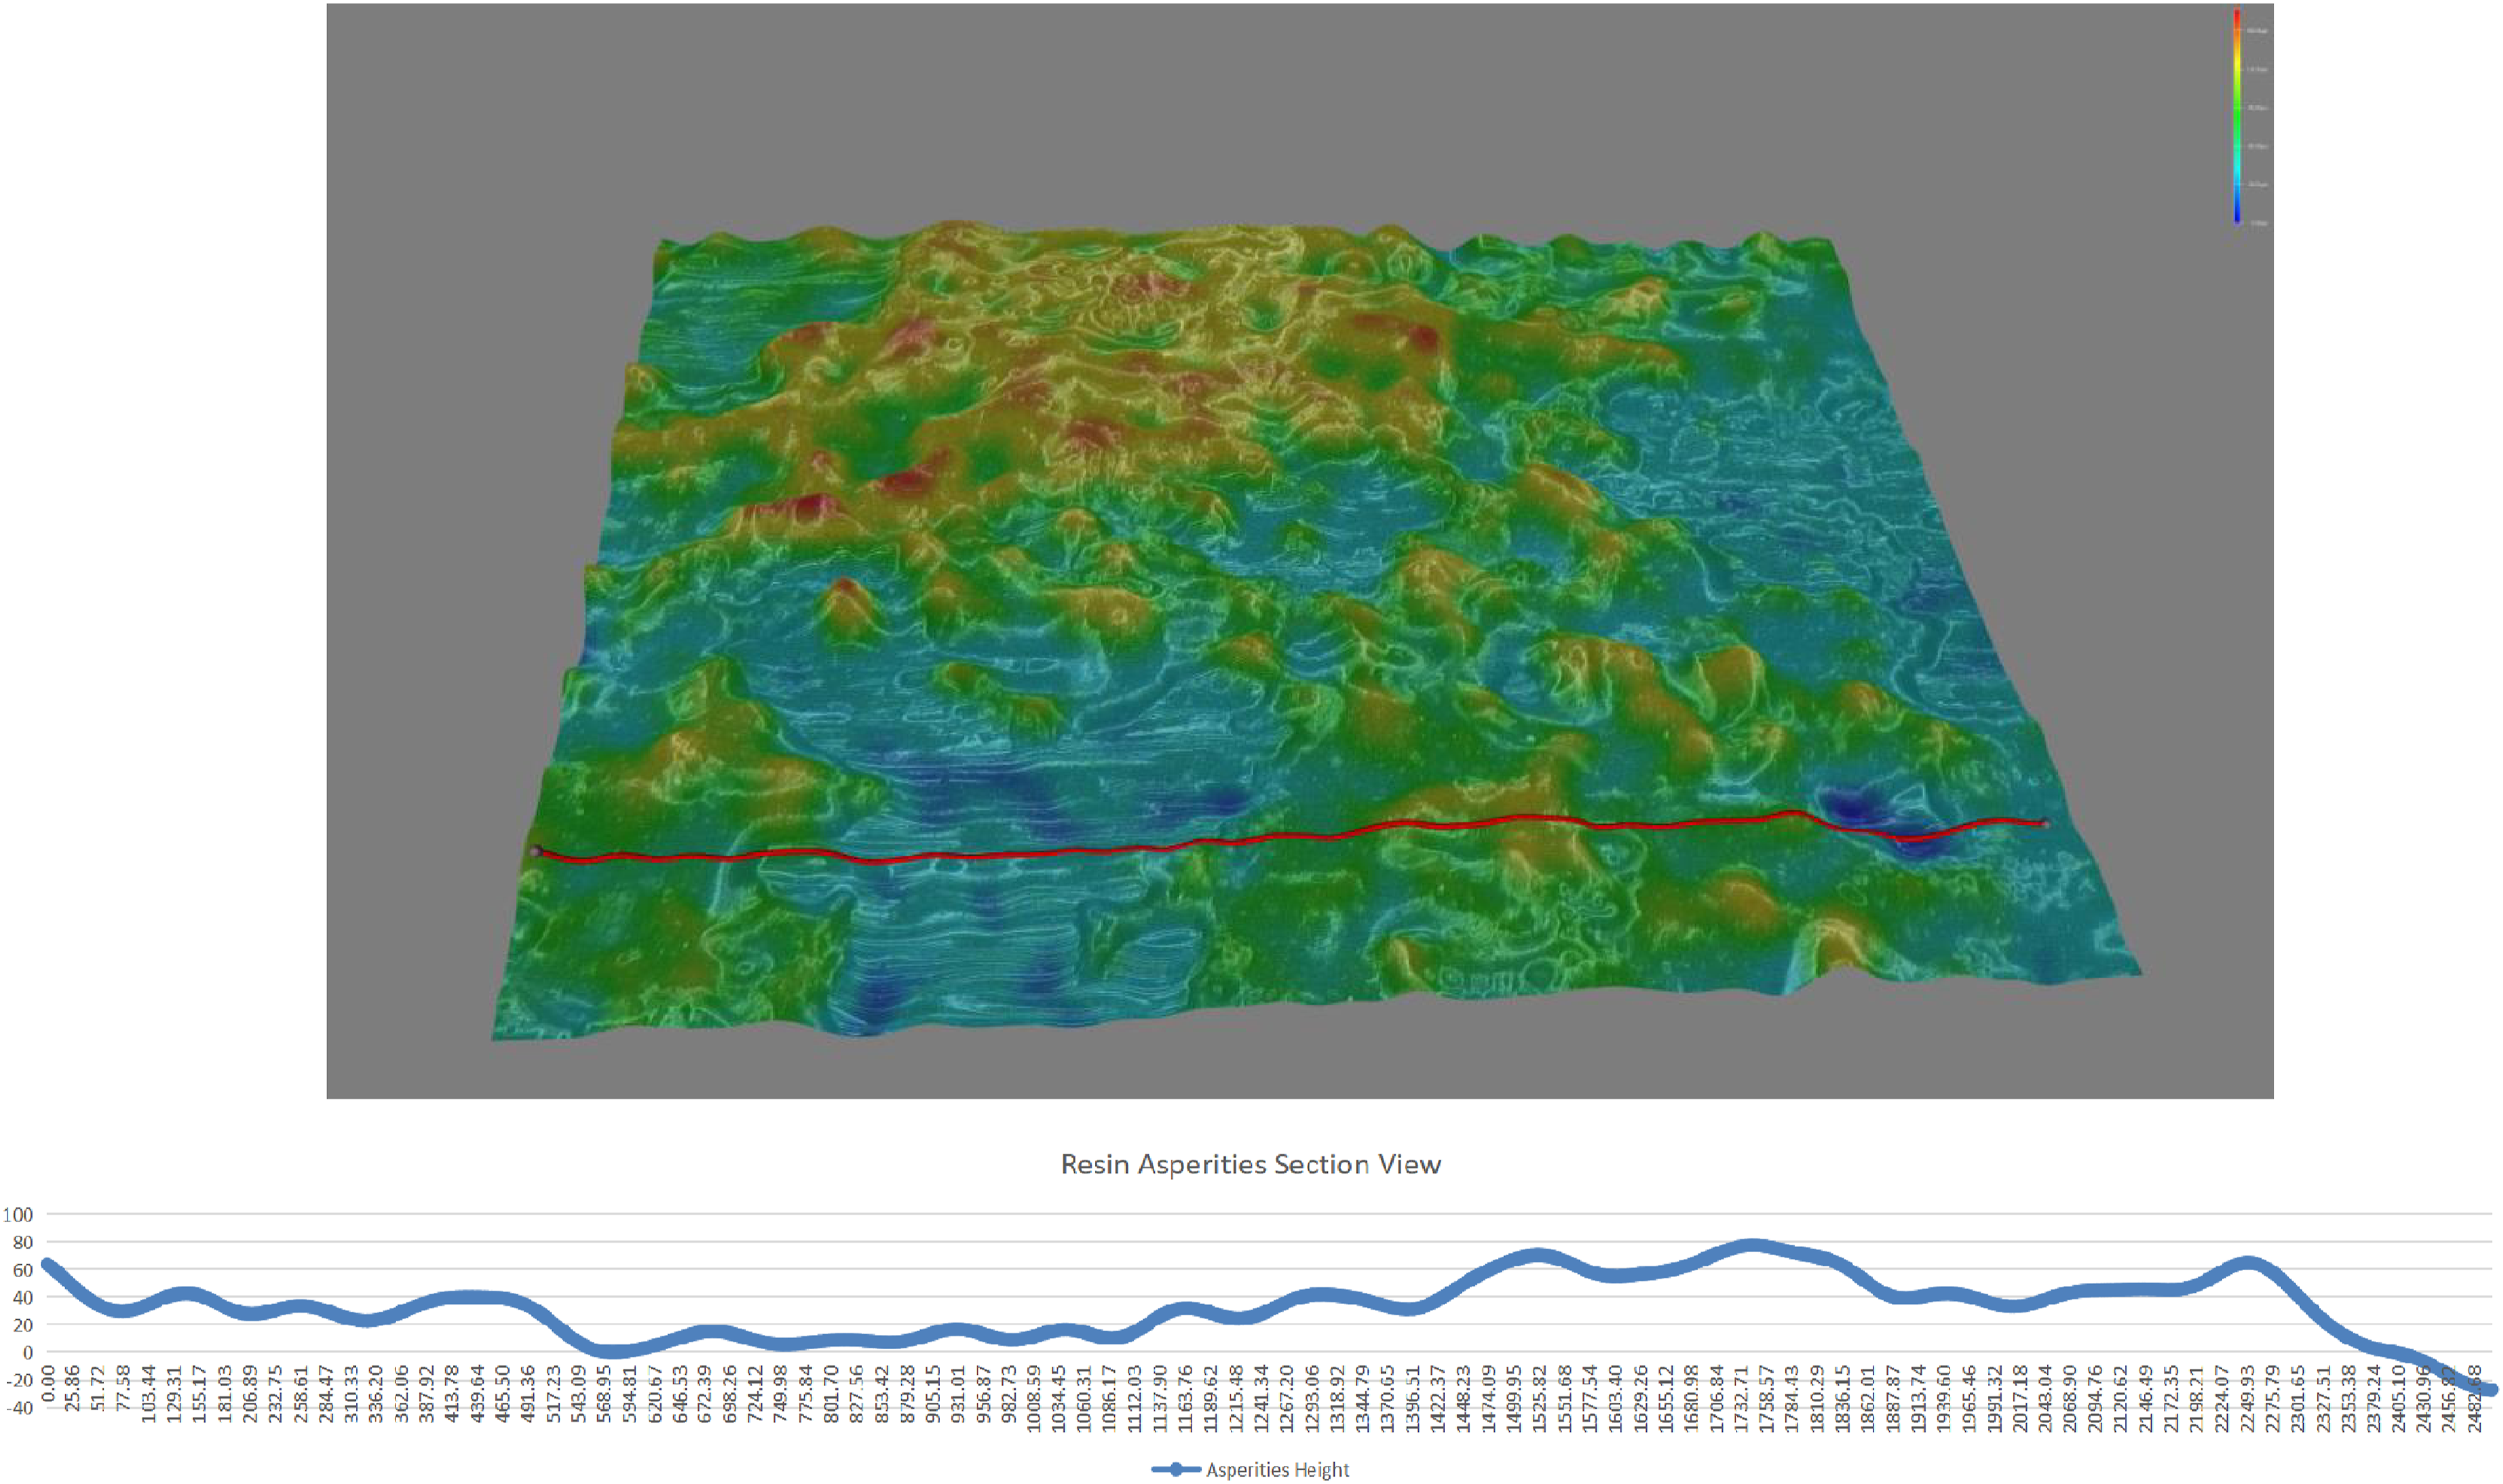
It can be seen that there are a series of resin asperities with small height-diameter ratio on the surface of the prepreg. In Figure 5, the two resin asperities passing through the red cross-section have diameters of 579.14 μm and 1492.12 μm, and their average heights are 41.66 μm and 44.41 μm, respectively. From the energy point of view, during the automatic placement process, the flexible compactor does work on the prepreg, causing the resin asperities to undergo elastic deformation and viscous flow, thereby creating a contact surface between the resin asperities on the two layers of prepreg. The resin molecular chains on both sides of the contact surface interpenetrate through diffusion. Part of the work done by the flexible compactor is converted into the interfacial energy between adjacent prepreg layers. Yang
17
studied the relationship between resin-based PSA peeling energy and resin interface energy, namely
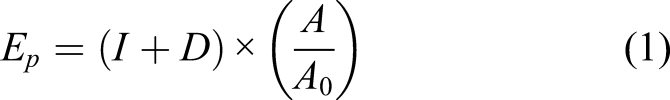

Among them,

From the above, the peeling energy of the prepreg is proportional to the product of the interface energy per unit area and the actual contact area of the interface. The interface energy per unit area is determined by the degree of diffusion of resin molecules, and the actual contact area of the interface is determined by the viscoelastic behavior of the resin. The degree of diffusion of resin molecules and the actual contact area of the interface are both functions of the interface contact time. In automatic placement, the interface contact time
Let

Therefore, the slopes of
Resin viscoelastic behavior
Generally speaking, the processing temperature of the automatic placement process is relatively fixed. Calawa and Nancarrow
18
found that the best laying temperature is 35°C, and Ann et al.
19
believe that the best laying temperature is 20–25°C above the glass transition temperature of the resin. It can be seen that during AFP process, the prepreg resin is in a rubbery state and has significant viscoelastic characteristics. Therefore, under the pressure of the flexible compactor, the change in height of the resin element ΔL will behave as a typical amorphous polymer creep curve with time t, as shown in Figure 6. Time-viscoelastic deformation curve of resin asperities.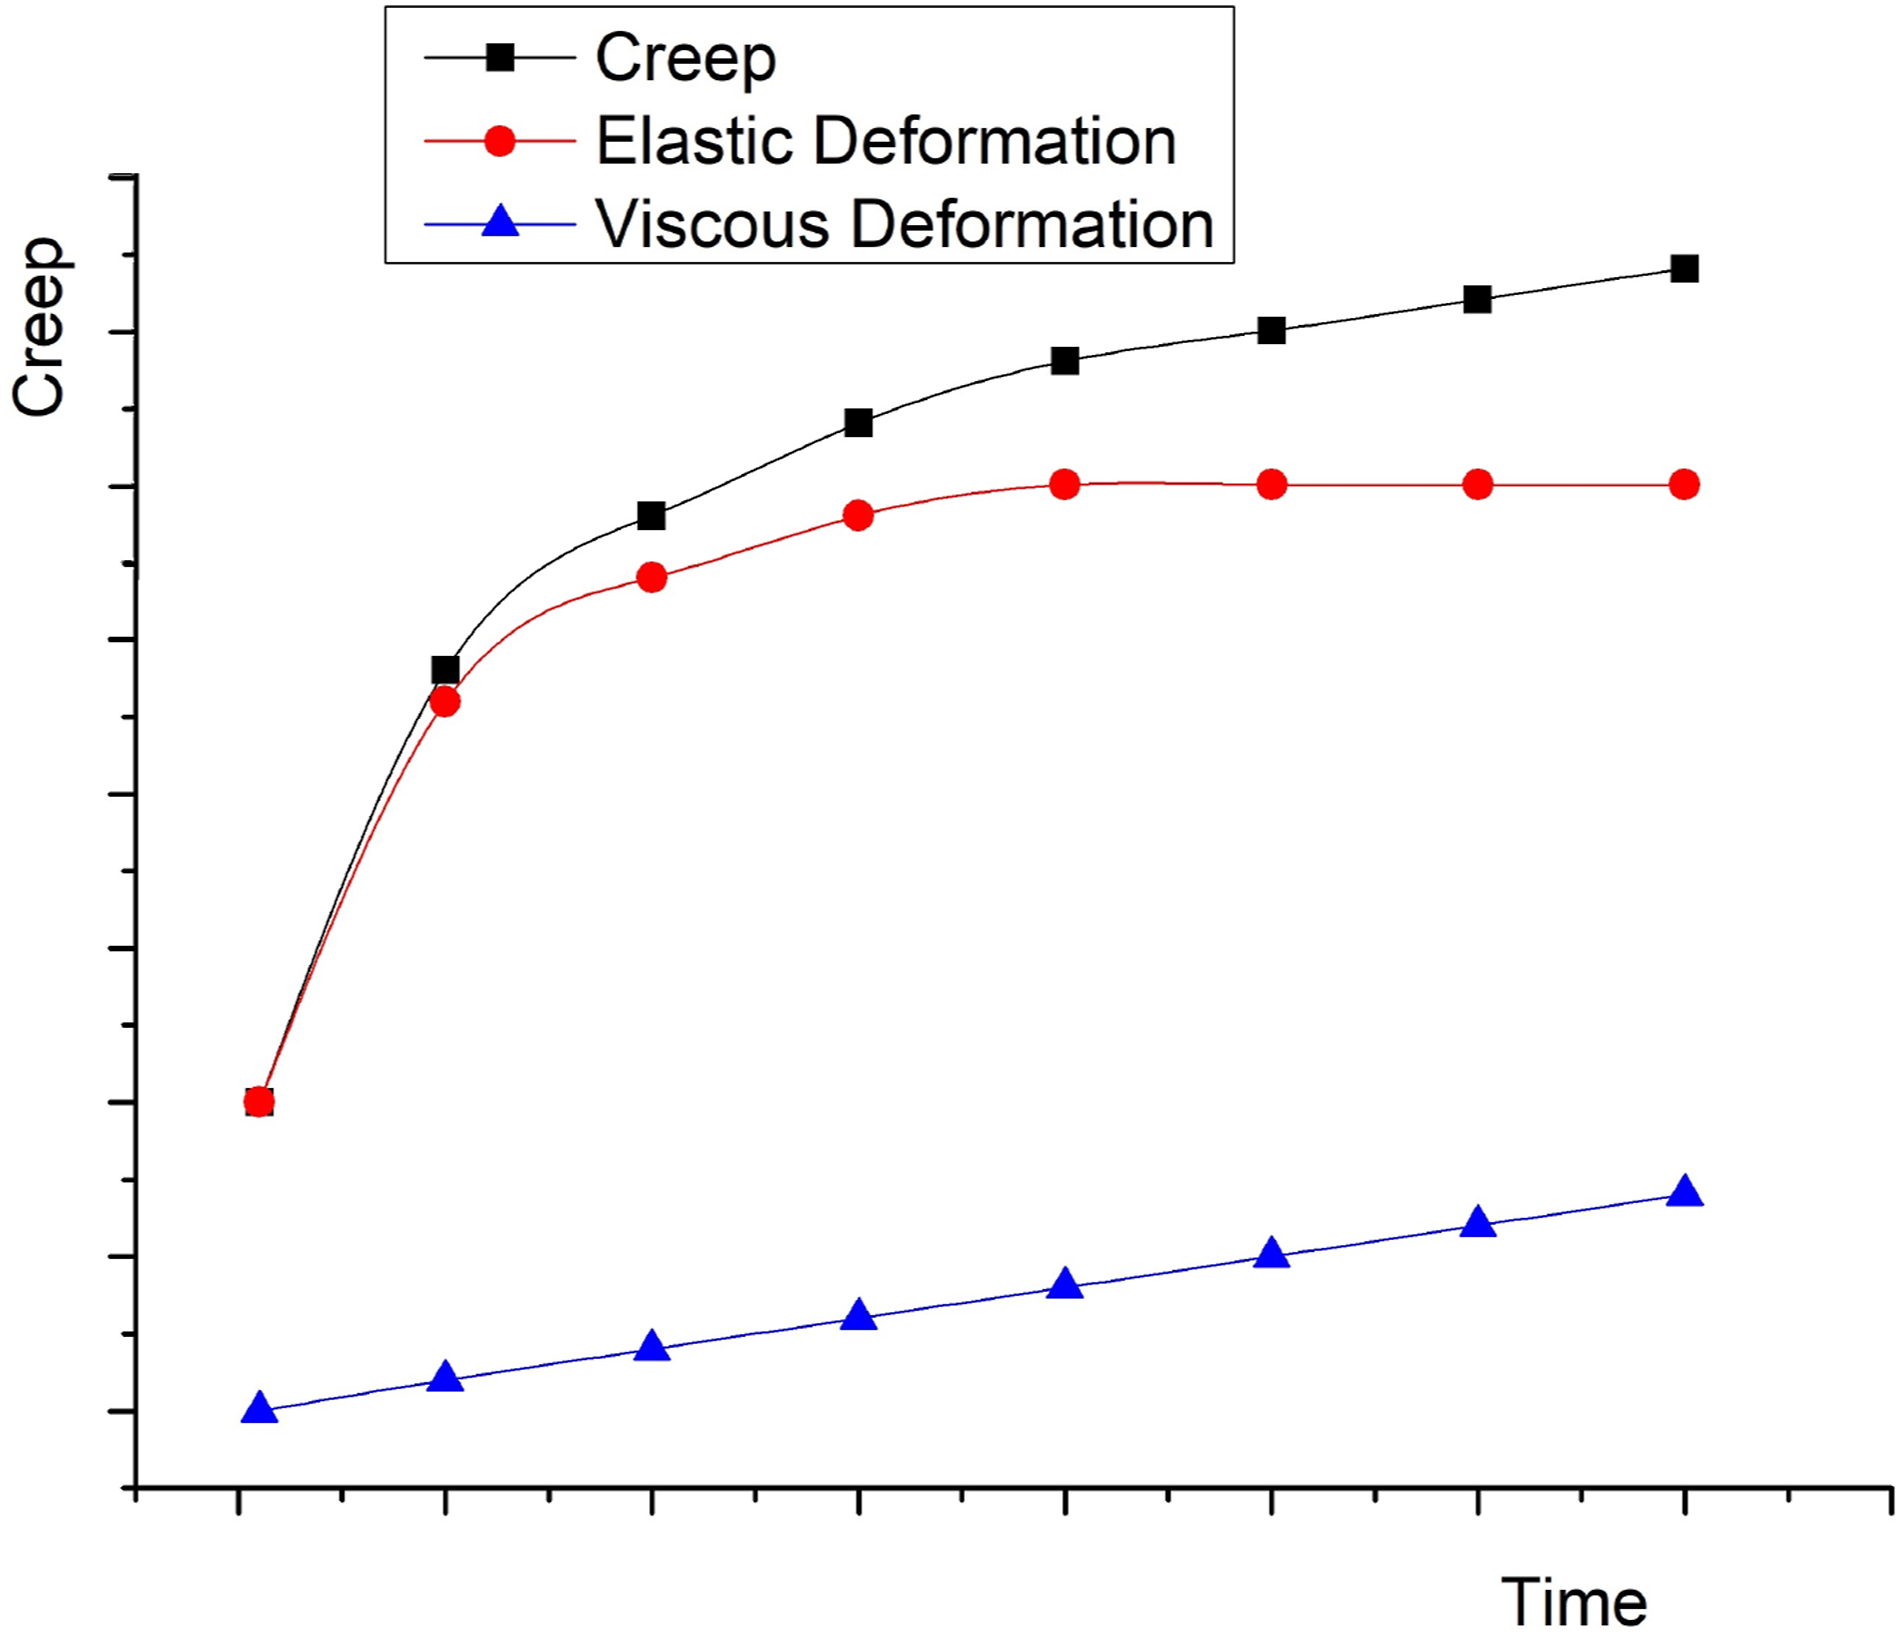
The creep of the resin asperities is composed of two parts: elastic deformation and viscous flow. Elastic deformation can be restored, but viscous flow cannot be restored. The rate of elastic deformation is much higher than that of viscous flow. In the initial stage of compaction, an initial contact surface is formed between the corresponding resin asperities of upper and lower layers. At the same time, the resin asperities undergo rapid elastic deformation in height direction, and most of the deformation recovers after external force is removed. According to the law of constant volume of plastic deformation, the volume of the resin asperities is conserved before and after compaction operation. Suppose the volume of the resin asperity is

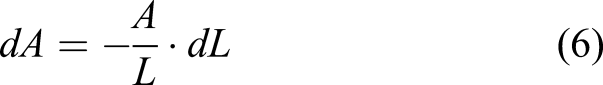
It is proved in the Analysis of Prepreg Deformation Curve section of this article that under the laying speed of industrial AFP machine, after compaction operation, for the resin asperities with a height of 44 μm, the inelastic part of the height change will not exceed 1.5 μm. Figure 7 is a detailed view of the resin asperity. The area inside the red circle in the upper part of Figure 7 shows the shape of a typical edge of resin asperity. The middle chart of Figure 7 shows the detailed dimension of this area. According to the 3D measurement data, a 1.5 μm difference in the height of the resin asperity means that the cross-sectional radius of the resin asperity increases by 3 μm. The lower part of Figure 7 is a picture of the prepreg surface peeled off after the formation of the interlayer bond taken by Leica DVM 6A, and the gray area is the surface of the resin asperity that has been in contact. It can be seen that the equivalent radius of the contact area is about 100 μm. Therefore, the radius change of 3 μm is small compared to the original equivalent radius. In this case, neither the contact area of the resin asperities nor the height of the resin asperities will change drastically with plastic deformation. That is, the fluctuation of Details of the size of the resin asperities (from top to bottom, the cross-sectional of the resin asperities, the edge dimension sample of the resin asperities and picture of resin contact area).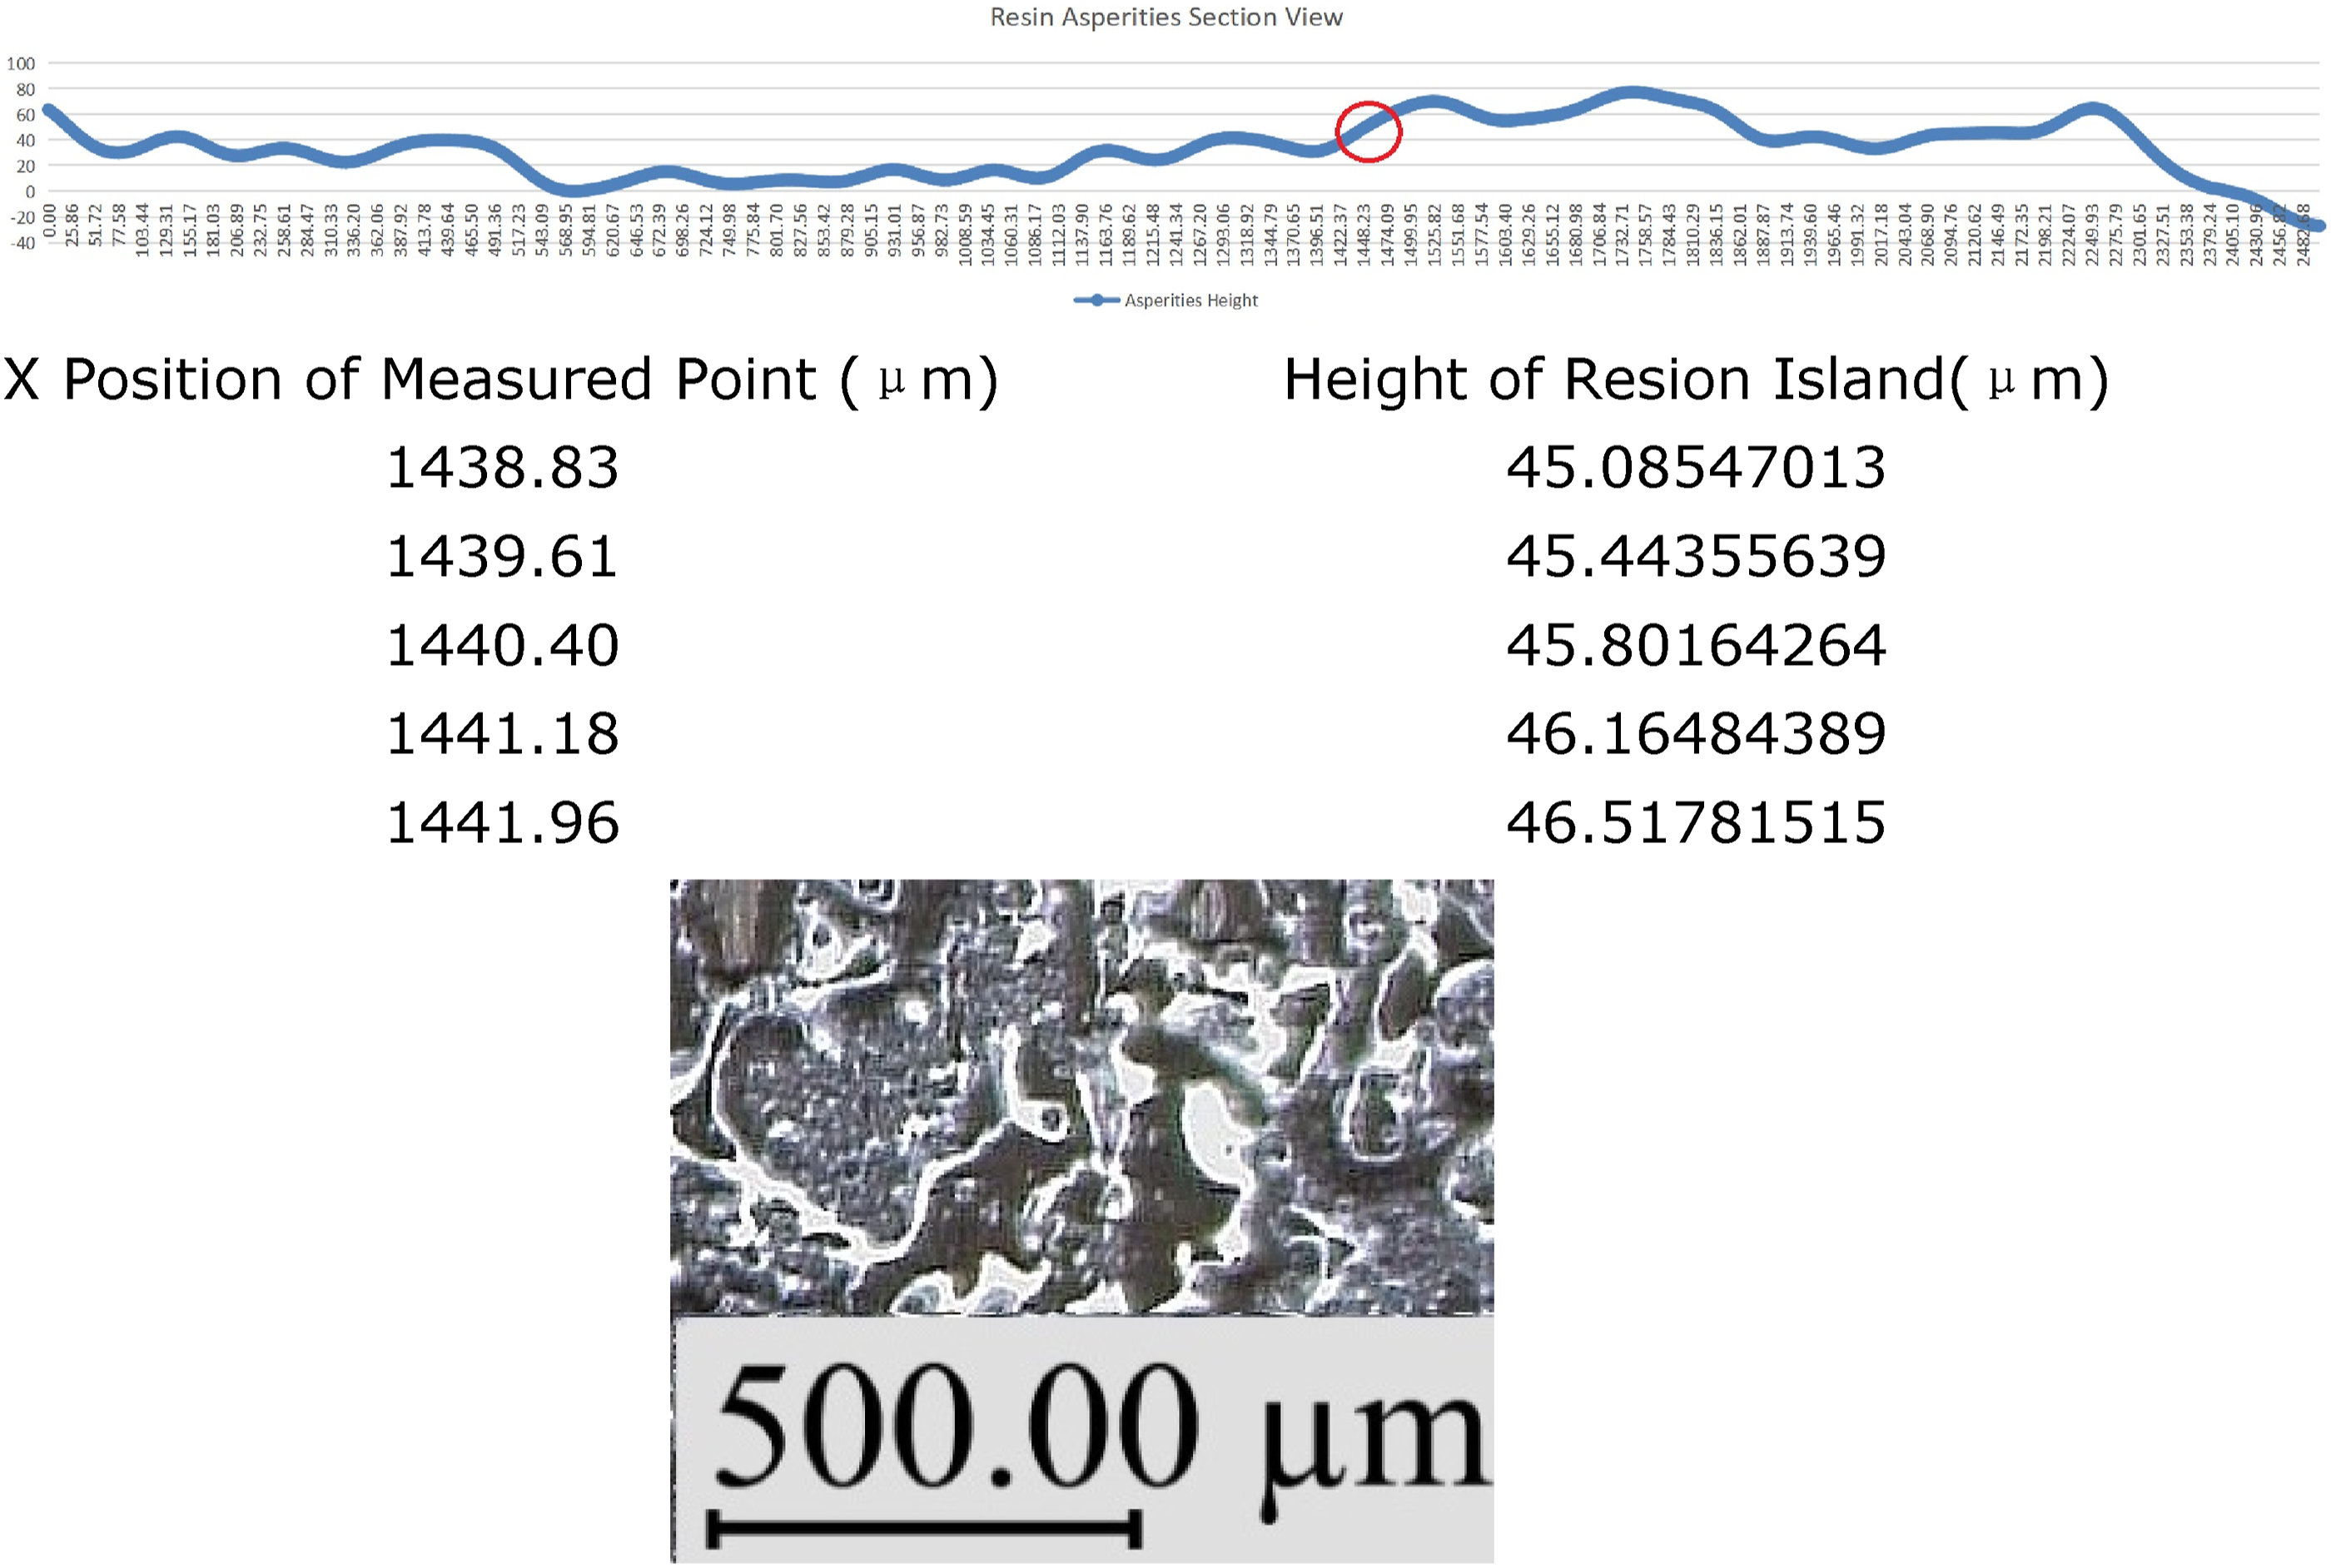
Interface diffusion
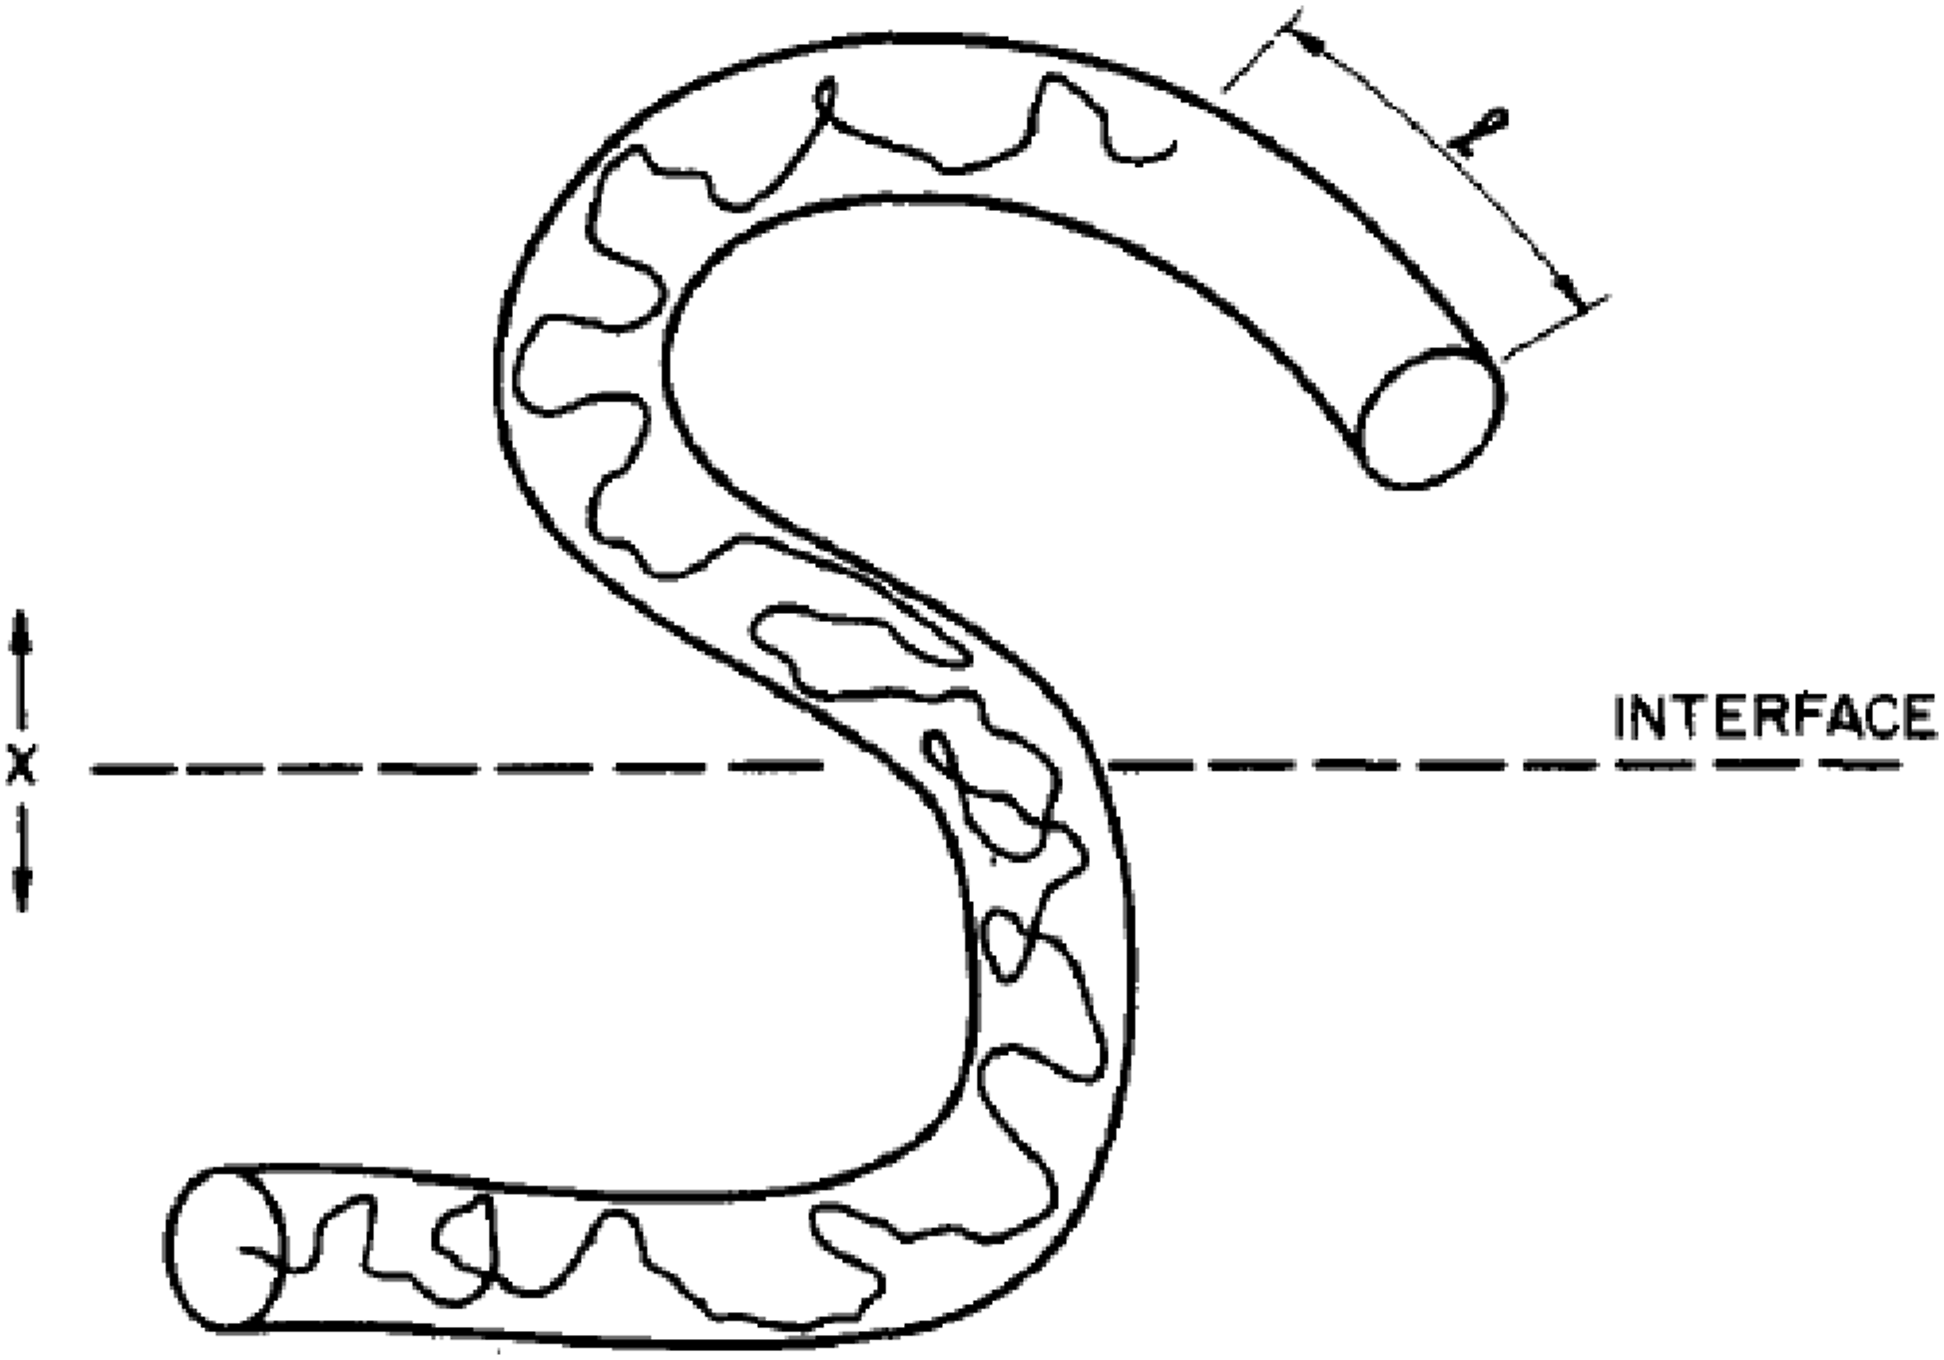
Since the automatic placement process temperature is above the glass transition temperature of the prepreg resin matrix, the process of resin interface fusion can be described by a reptation model.15,16 Diffusion of polymer chains through interface can be described as a chain moving in a tube in reptation model. According to the Einstein equation, the diffusion time has the following relationship with the curvilinear distance

Among them
The schematic diagram of interface molecular interpenetration is as follows (Figure 8): Reptation model for polymer crack healing: random chain walk diffusing in a tube.
16
Wool and O’Connor
16
inferred that since the tube contour in which the chain traveled represents another random walk with respect to the interpenetration distance

According to Wool and O’Connor,
16
it is assumed that the strength of the resin interface connection

Among them,

According to Hooke’s law, when

When
Therefore, the curve of Logarithmic curve of reciprocal time-interface energy per unit area.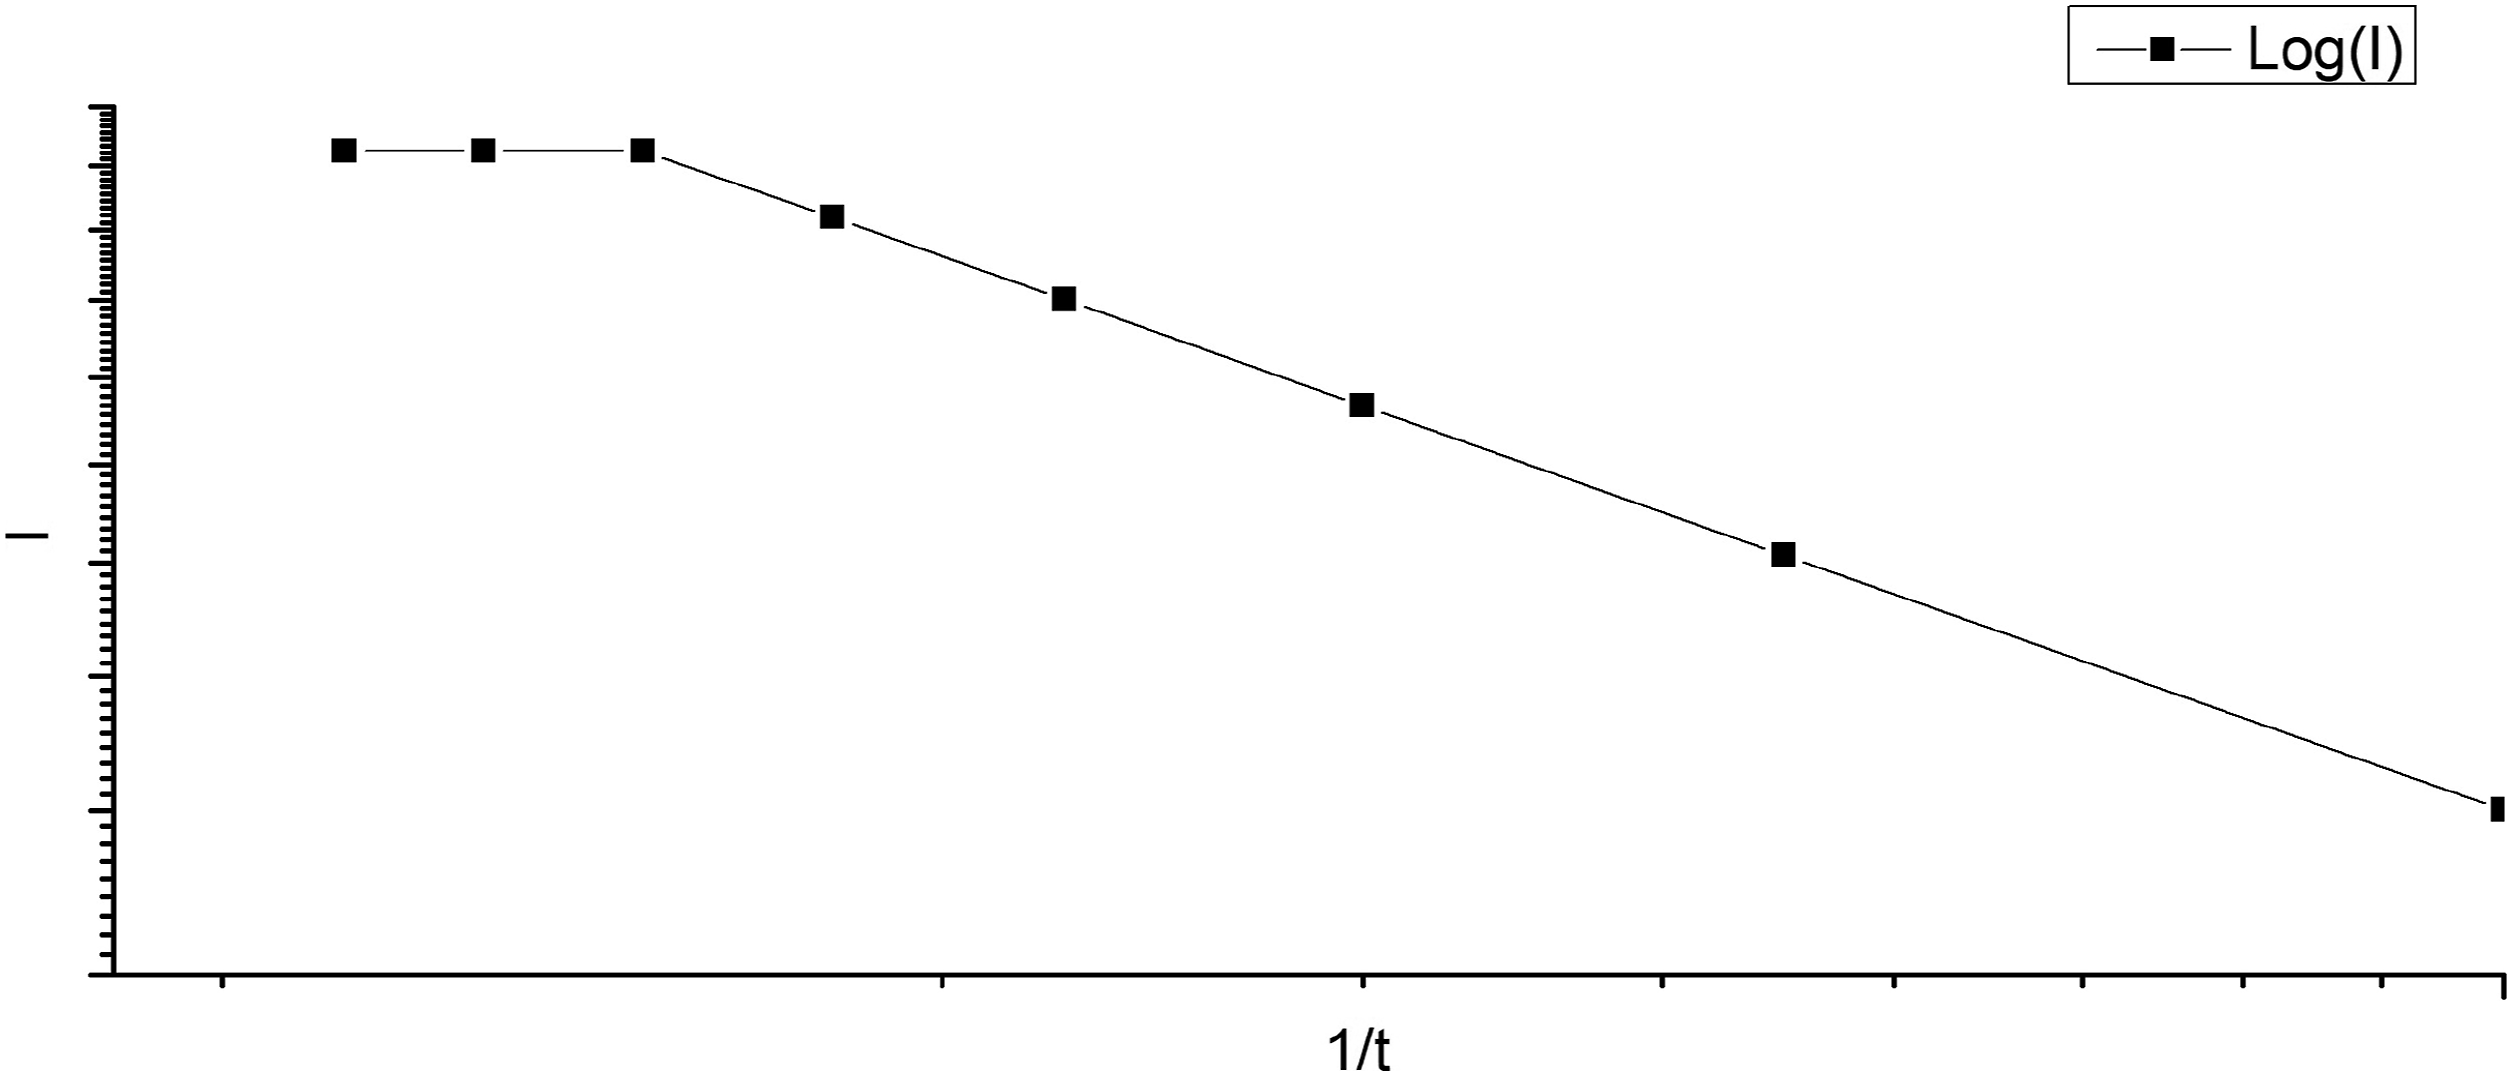
Establishment of
model
From the foregoing, it can be seen that the interlayer peeling energy of the prepreg
Experiments
This study will research the interface bonding model through the following three experimental methods: 1. Measure the creep curve of the prepreg under compression, and establish the laying speed-resin asperities deformation curve. 2. Carry out laying-peeling experiment, establish laying speed-peeling energy curve, and compare with laying speed-resin asperities deformation curve to study the influence of interface molecular diffusion. 3. For a set of experiments with the same laying pressure in experiment 2, study the impact of peeling speed to further prove the validity of the model.
In the above experiments, experiments 1 and 3 used the same batch of prepregs, and experiment 2 used another batch of prepregs.
Measurement experiment of prepreg creep curve
Since the compaction time of prepreg is short during the automatic placement process, it is difficult to measure the creep curve in actual process. It is known that the temperature of the prepreg during automatic placement is about
In order to make the measured creep curve close to the actual laying process, it is necessary to measure the average pressure applied by the compactor to the prepreg during the actual laying process. The measuring method is to coat an actual compactor with paint and press it onto the paper under a pressure of 1 N/mm. By measuring the width of the indentation on the paper, contact length The contact length of compactor.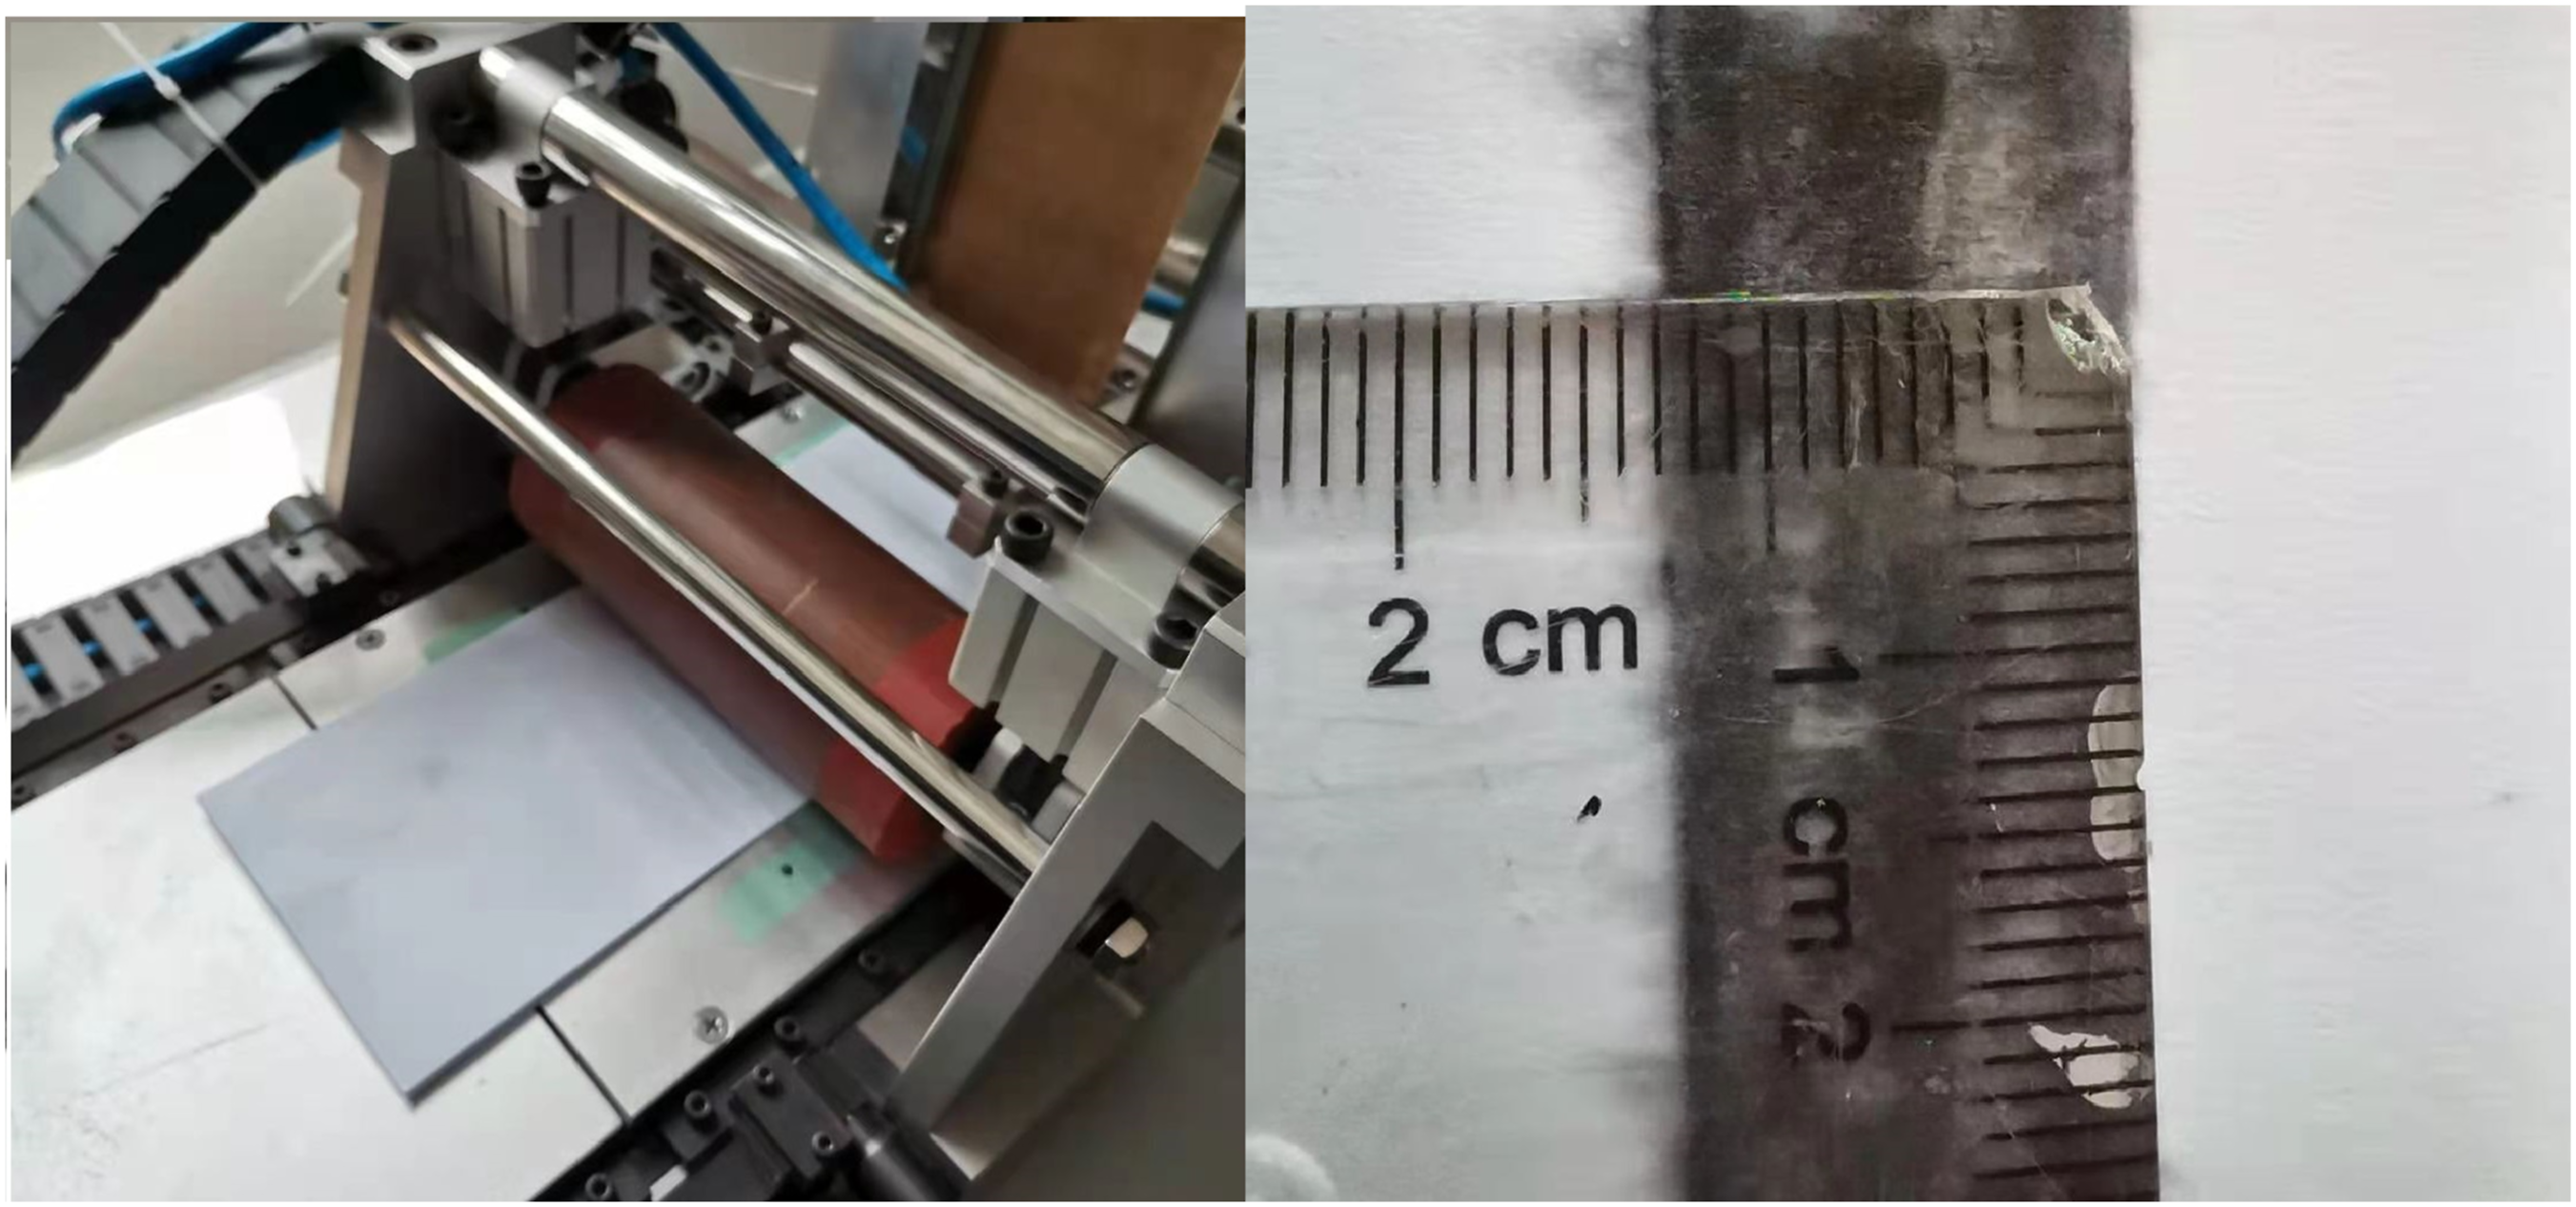
It can be seen that when the laying pressure is 1 N/mm, the contact length Experimental device for measuring creep curve of prepreg.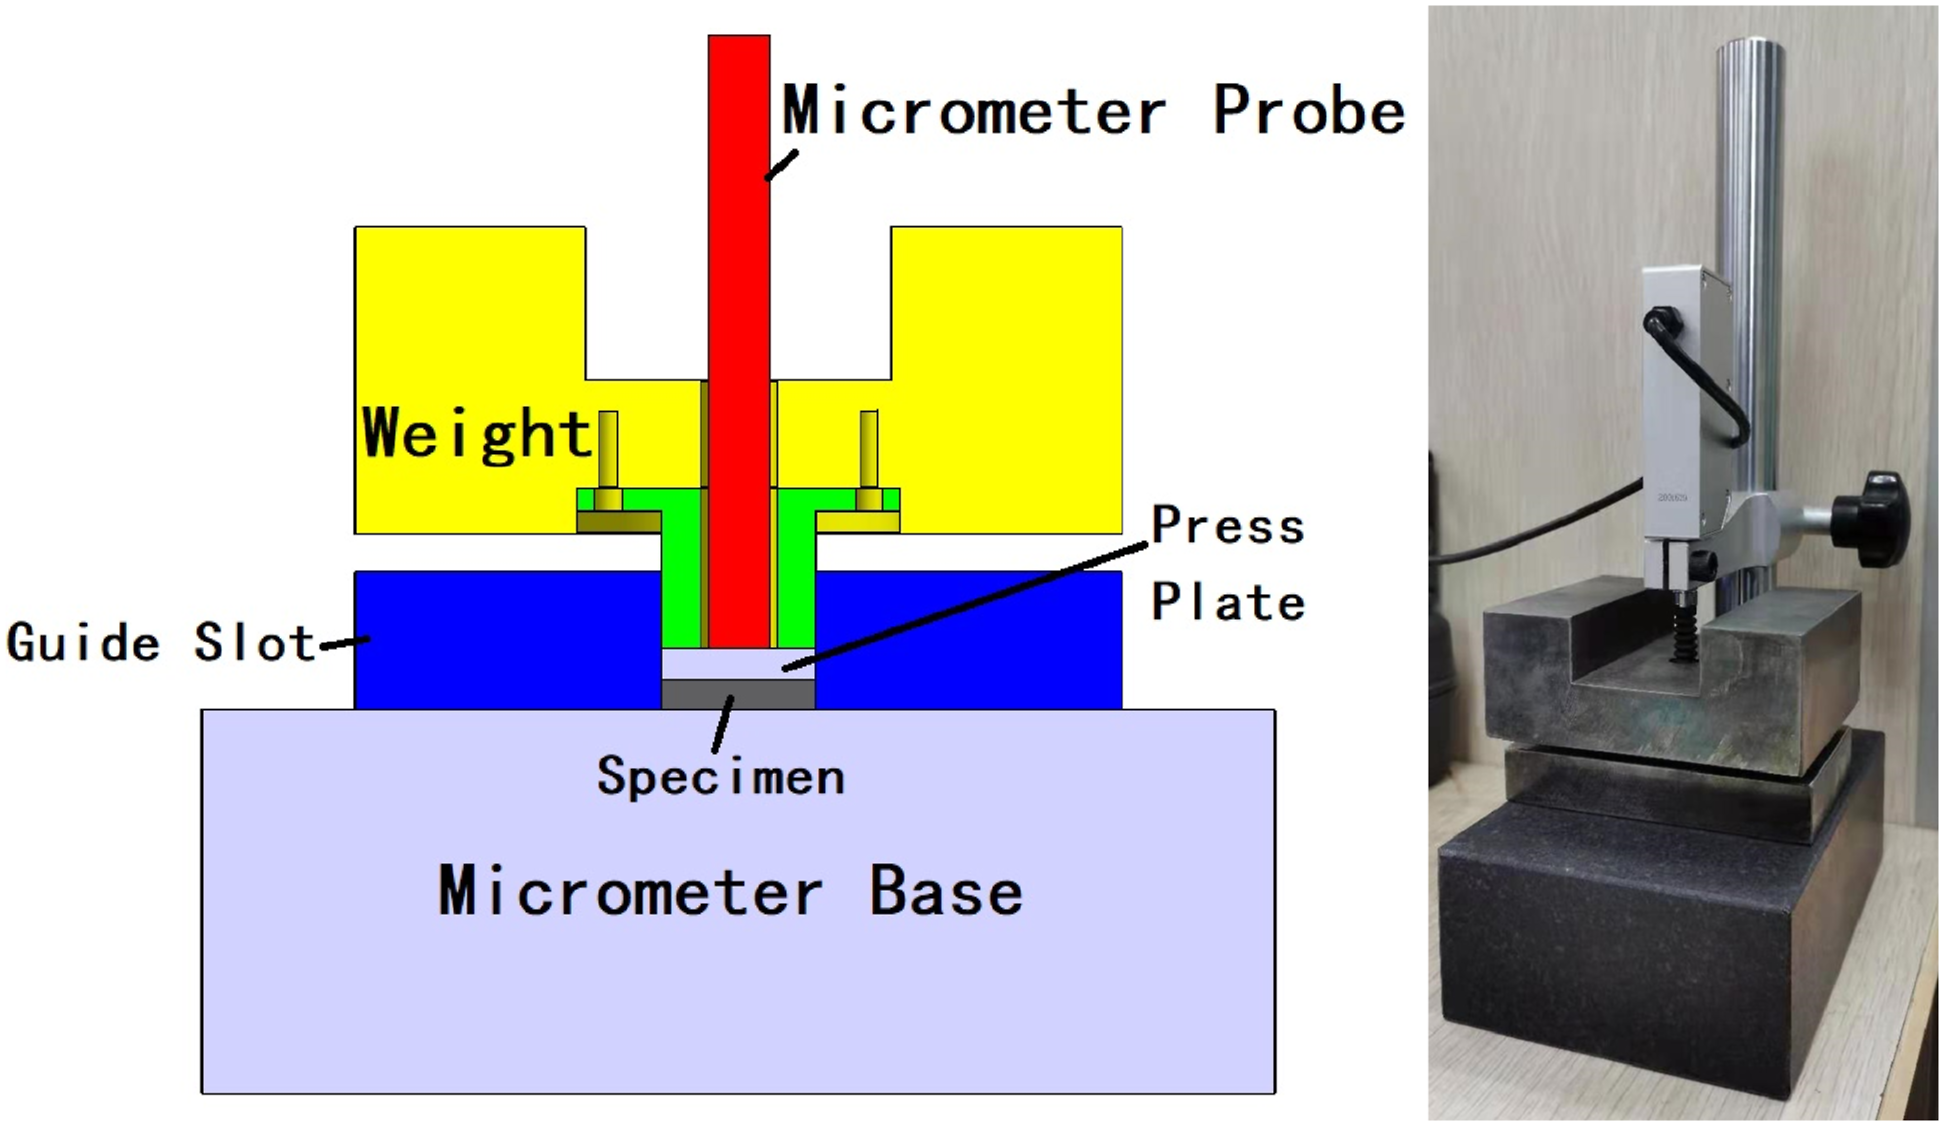
This experimental device uses a micrometer to record the creep curve of the prepreg under pressure. The prepreg sample size is 20 mm × 20 mm and placed in a guide groove with a square hole of the same size (depending on the experimental plan, the number of layers is different). A press plate is placed above the sample, and the probe of the micrometer is pressed against the press plate. A weight with a through hole is used to apply the simulated laying pressure, and the weight indenter is slidingly matched with the square hole of the guide groove to ensure that the pressure is uniformly applied. During the experiment, first load the prepreg samples and the press plate into the square hole of the guide groove. Then slide the weight into the square hole but hang above the press plate without contacting it. Then insert the micrometer probe into the through hole of the weight until it makes contact with the press plate; then begin sampling displacement data. Finally, the weight is released, and the creep curve is recorded. A 3 kg weight is used in the experiment so that the pressure on the sample is almost the same as the average pressure during AFP process. Since the weight of the press plate is 4 g and the reaction force of the micrometer probe is less than 1 N, it can be considered that their interference is negligible relative to the pressure of the weight.
In the experiment of measuring the temperature equivalent coefficient, in order to eliminate the influence of uneven distribution of prepreg resin, the prepreg samples were made with 10 layers of prepregs with the same direction, placed in a 40°C environmental chamber and compressed with the weight in the experimental device for 10 min. Six samples were made using this method, and 3 experiments were carried out in an environmental chamber at room temperature (22°C) and 40°C, respectively. The average creep curve of this sample at room temperature and 40°C are then obtained, and the time-temperature equivalent coefficient is calculated according to the method inRef. 22.
In the second part of this experiment, when simulating actual AFP compaction operation, the sample is composed of two layers of prepreg with the same direction, and the two layers of prepreg are not compressed before being put into the guide groove. Five experiments were performed at room temperature and the average creep curve was obtained. Then the time-temperature conversion coefficient measured in the previous step can be used to move the curve to 40°C to reflect the viscoelastic behavior of the prepreg resin during actual fiber placement.
Laying-peeling test
According to Williams and Kauzlarich 6 and Ahn et al., 19 the peeling force per unit width measured in peeling experiments represents the peeling energy per unit area. Therefore, this study will take the peeling force of the ply as the main measurement value to verify the aforementioned model through a laying-peeling experiment.
The prepreg peeling samples were prepared on a dedicated AFP simulation equipment. The equipment can be regarded as a simplified AFP machine, consisting of linear motion system, compactor system, prepreg guiding system, heating system, and control system. Its laying speed range is 0–500 High-speed Automated Fiber Placement simulation experiment equipment.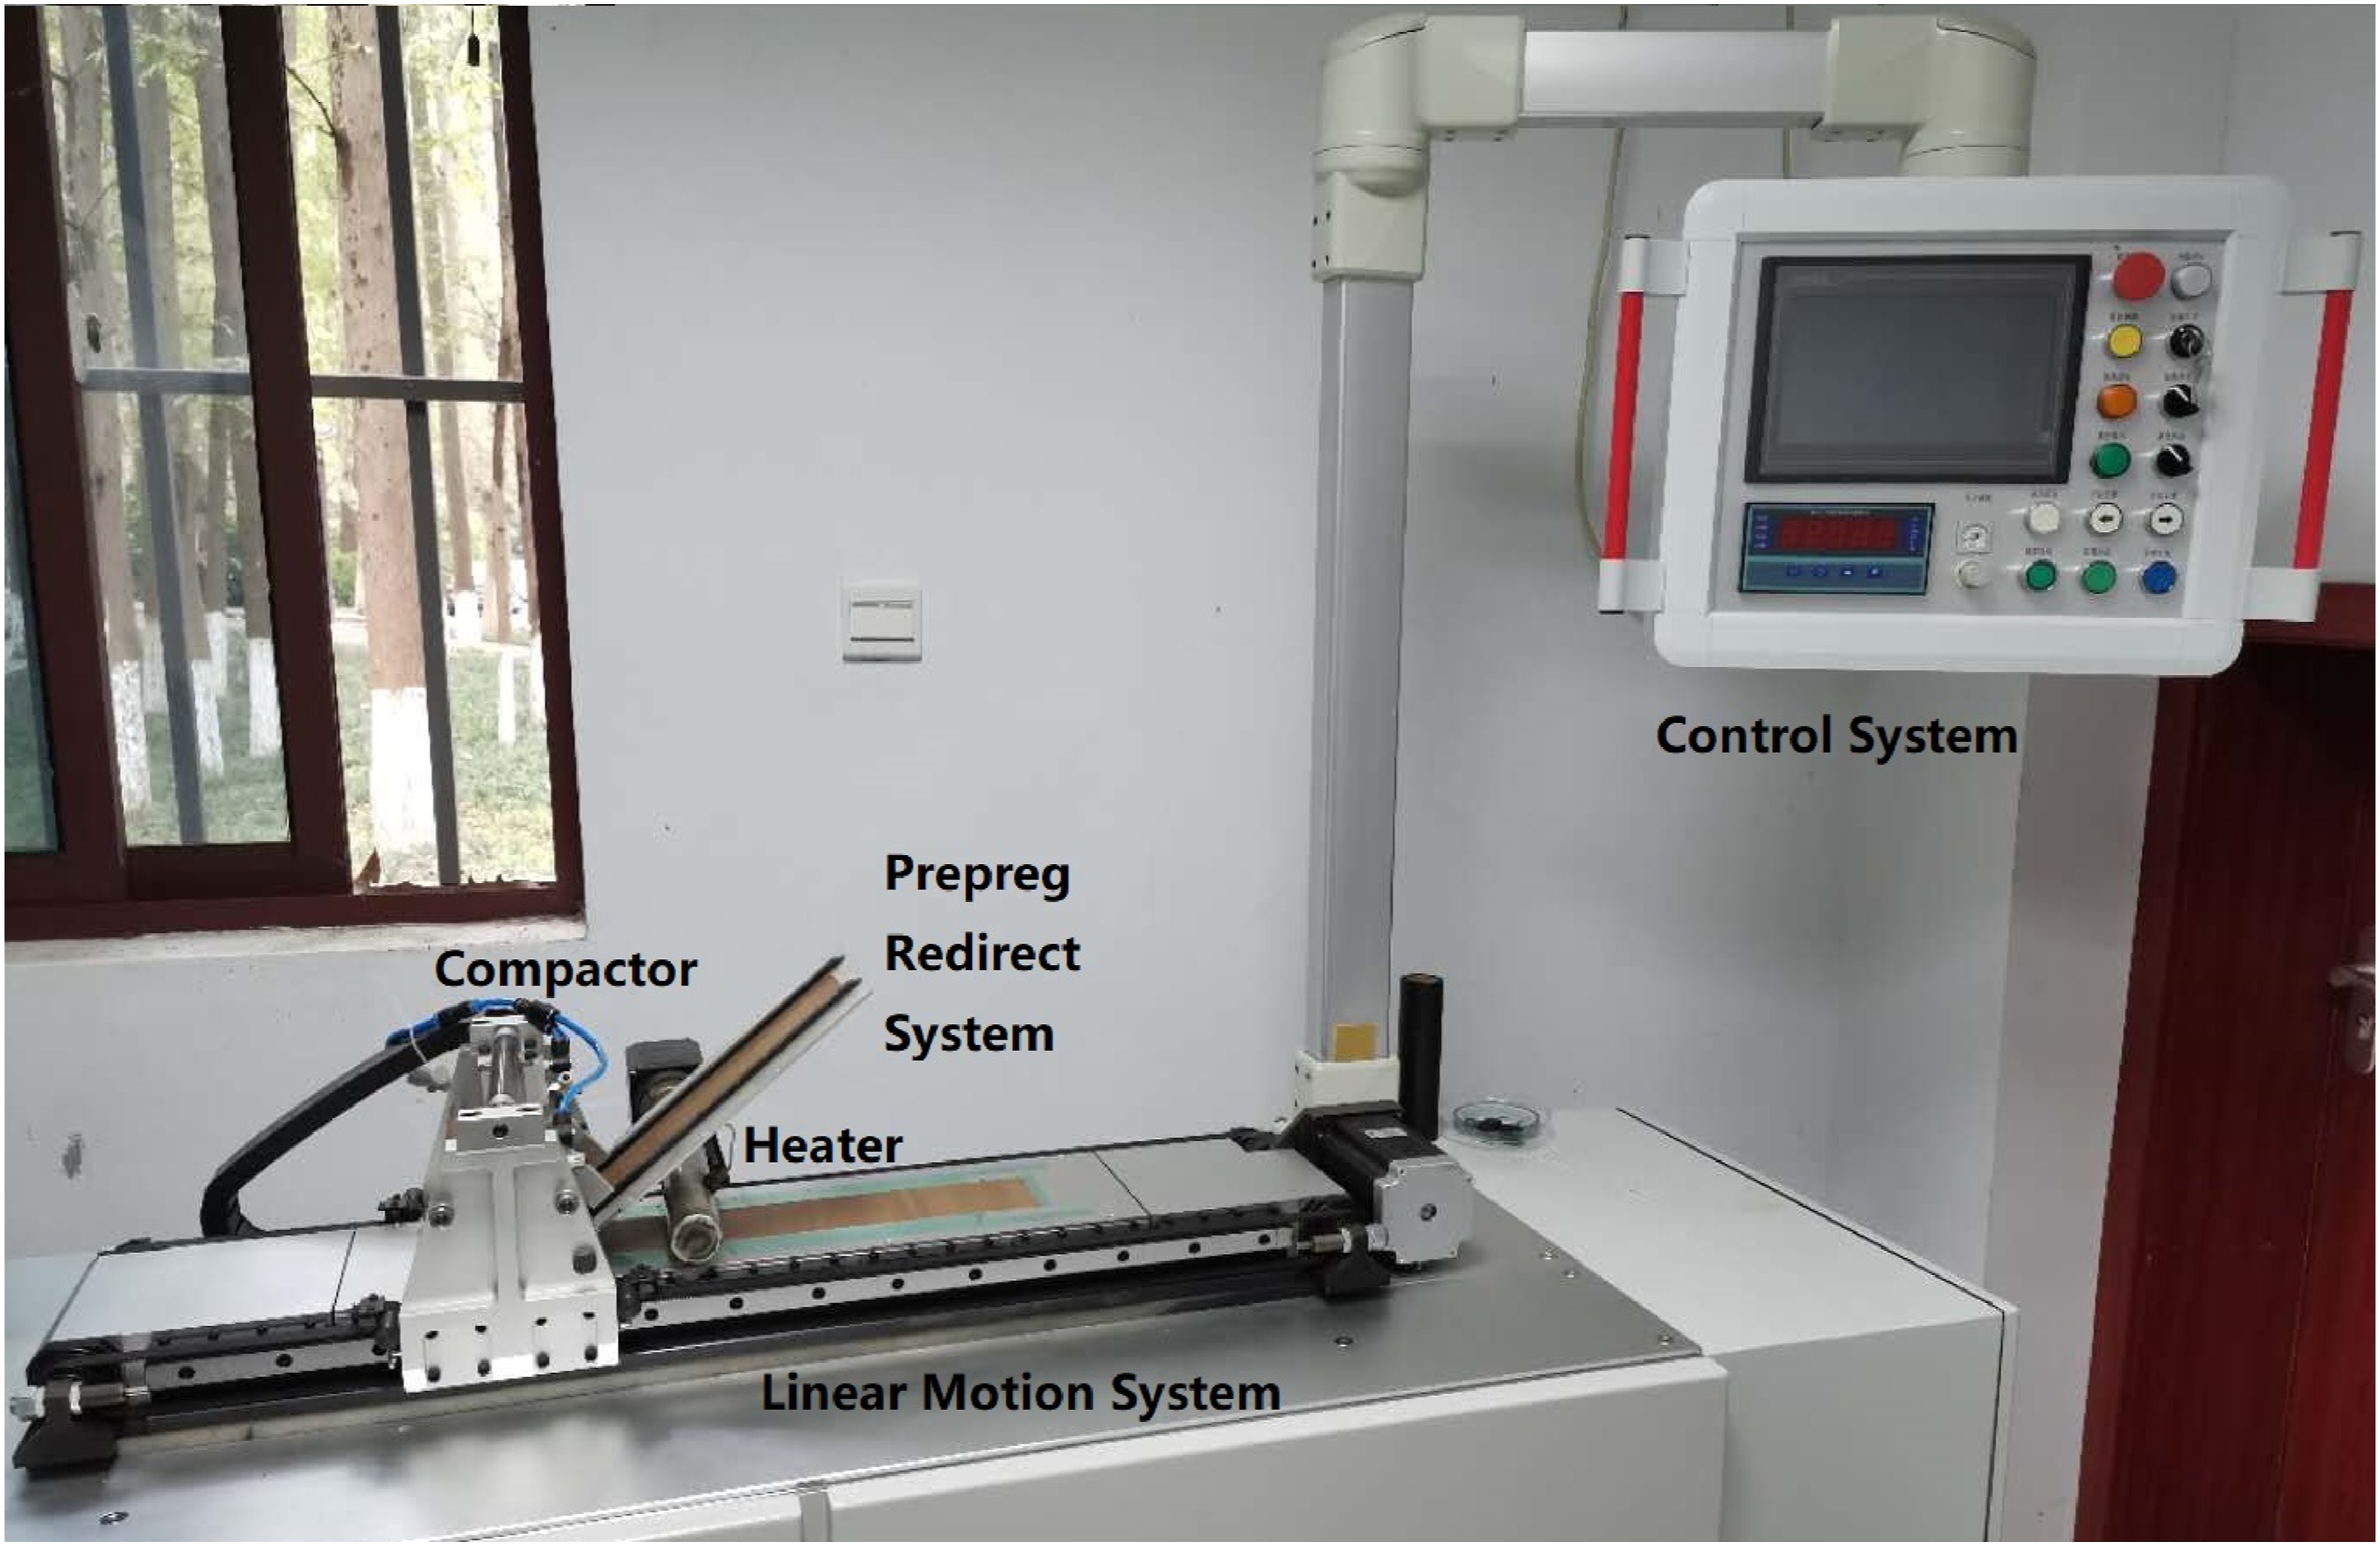
The schematic diagram of the testing rig is shown in Figure 13. Schematic diagram of high-speed Automated Material Placement simulation equipment.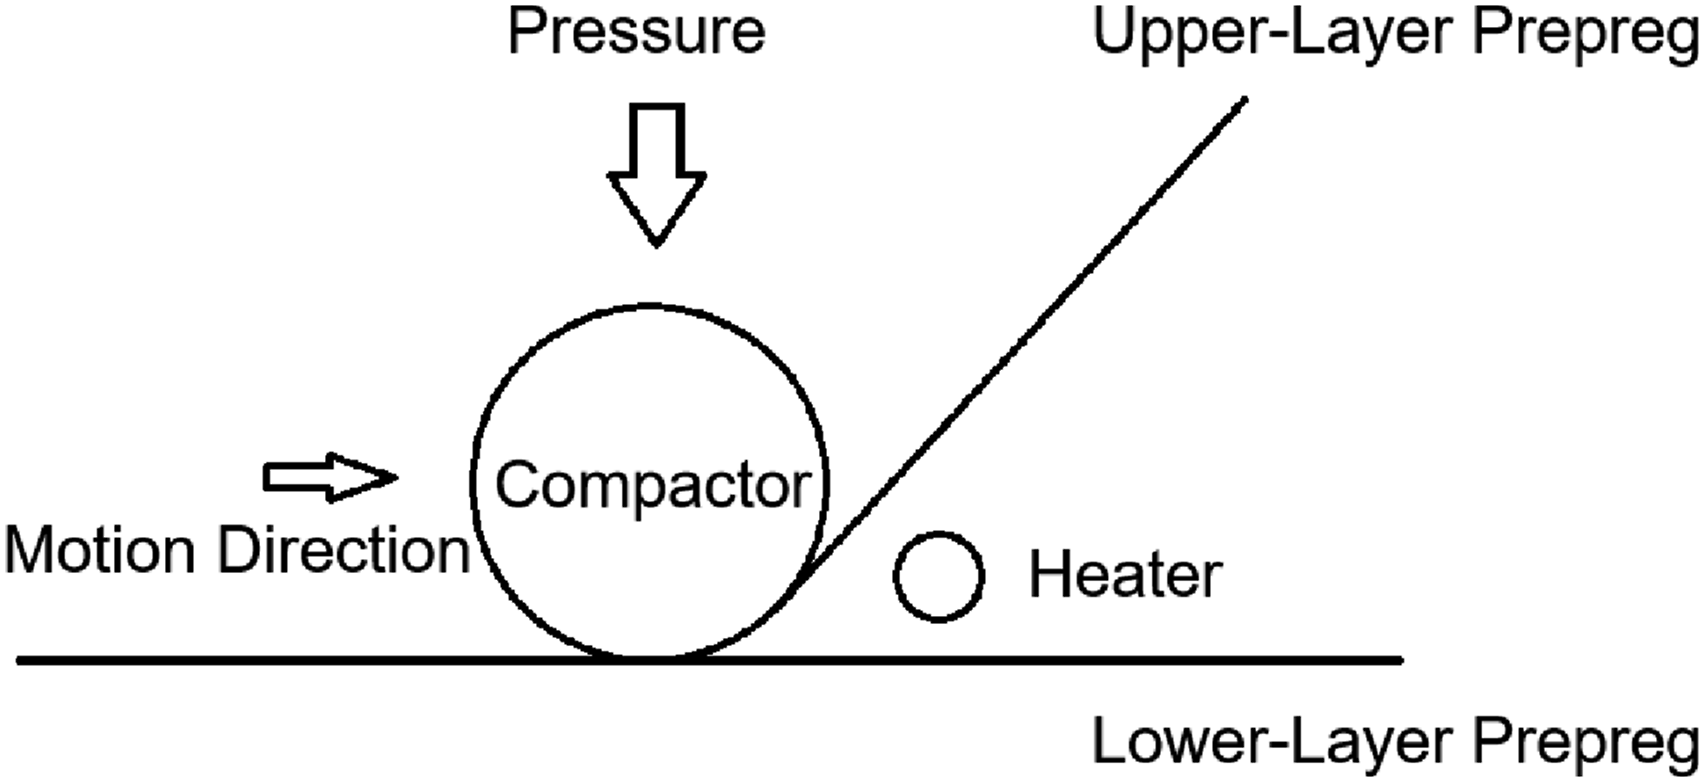
In this testing rig, the upper and lower layers of prepreg are placed on the guiding system and the platform, respectively. Driven by a cylinder, a silicone rubber pressure roller compacts the two layers of prepreg together. The air pressure of the compactor cylinder is controlled by an electromagnetic proportional valve, and a pressure sensor is placed underneath the lower platform of the testing rig to measure the laying pressure. Temperature sensors and heating devices are installed on the lower platform to control the laying temperature. The compactor is installed on linear rails and driven forward by a step motor controlled by programmable logic controller, so that the laying speed can be precisely adjusted. In this laying experiment, 75 mm wide M21 prepreg is processed in preparation for peeling test samples. In the initial section of the sample, a layer of poly tetra fluoroethylene (PTFE) cloth is placed between the upper and lower layers of the prepreg to ensure they do not adhere, and the influence of the acceleration section of the motor on the bonding strength between layers is avoided.
Peeling test is conducted on a universal testing machine. In order to accurately measure the peeling force, a special tooling was designed and manufactured. When loading the peeling sample into the tooling, the upper and lower layers of prepregs in the initial section should be winded around the two redirect rollers at the bottom of the tooling and fixed on two sliding blocks respectively. The sliding blocks are mounted on guiding shafts, and their movement direction is consistent with the pulling force direction of the universal testing machine. When the universal testing machine pulls the sliding blocks, recorded force is regarded as the sample peeling force. The principle of peeling experiment tooling is shown in Figure14. Schematic diagram of peeling experiment tooling.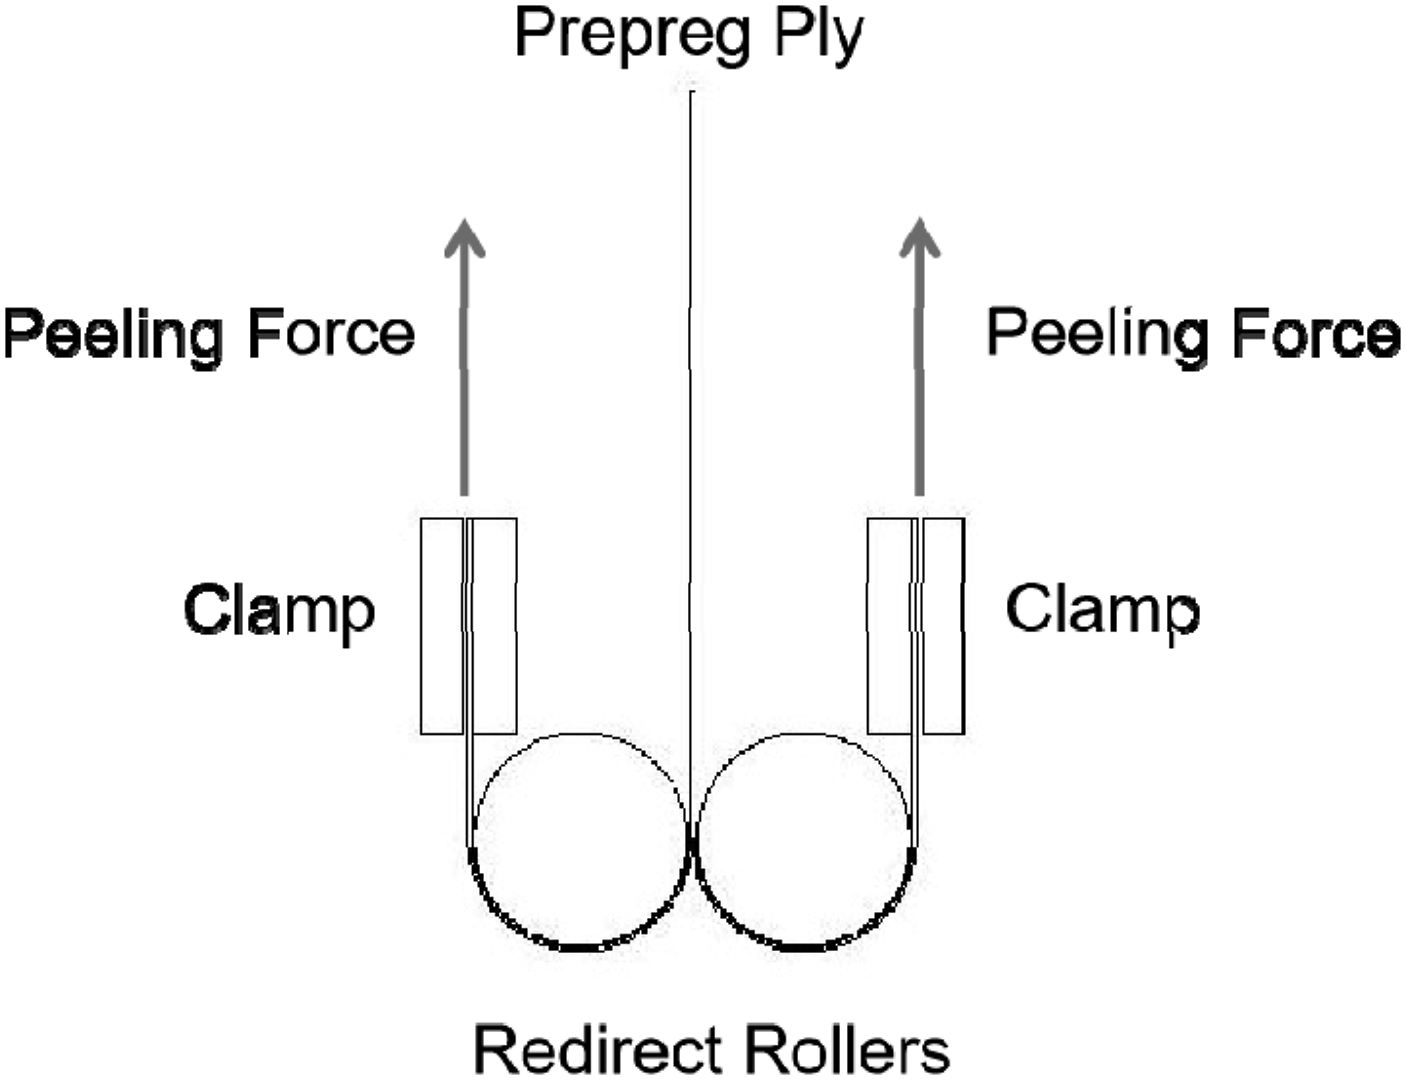
The actual peeling experiment device is shown in Figure 15. Peeling experiment device.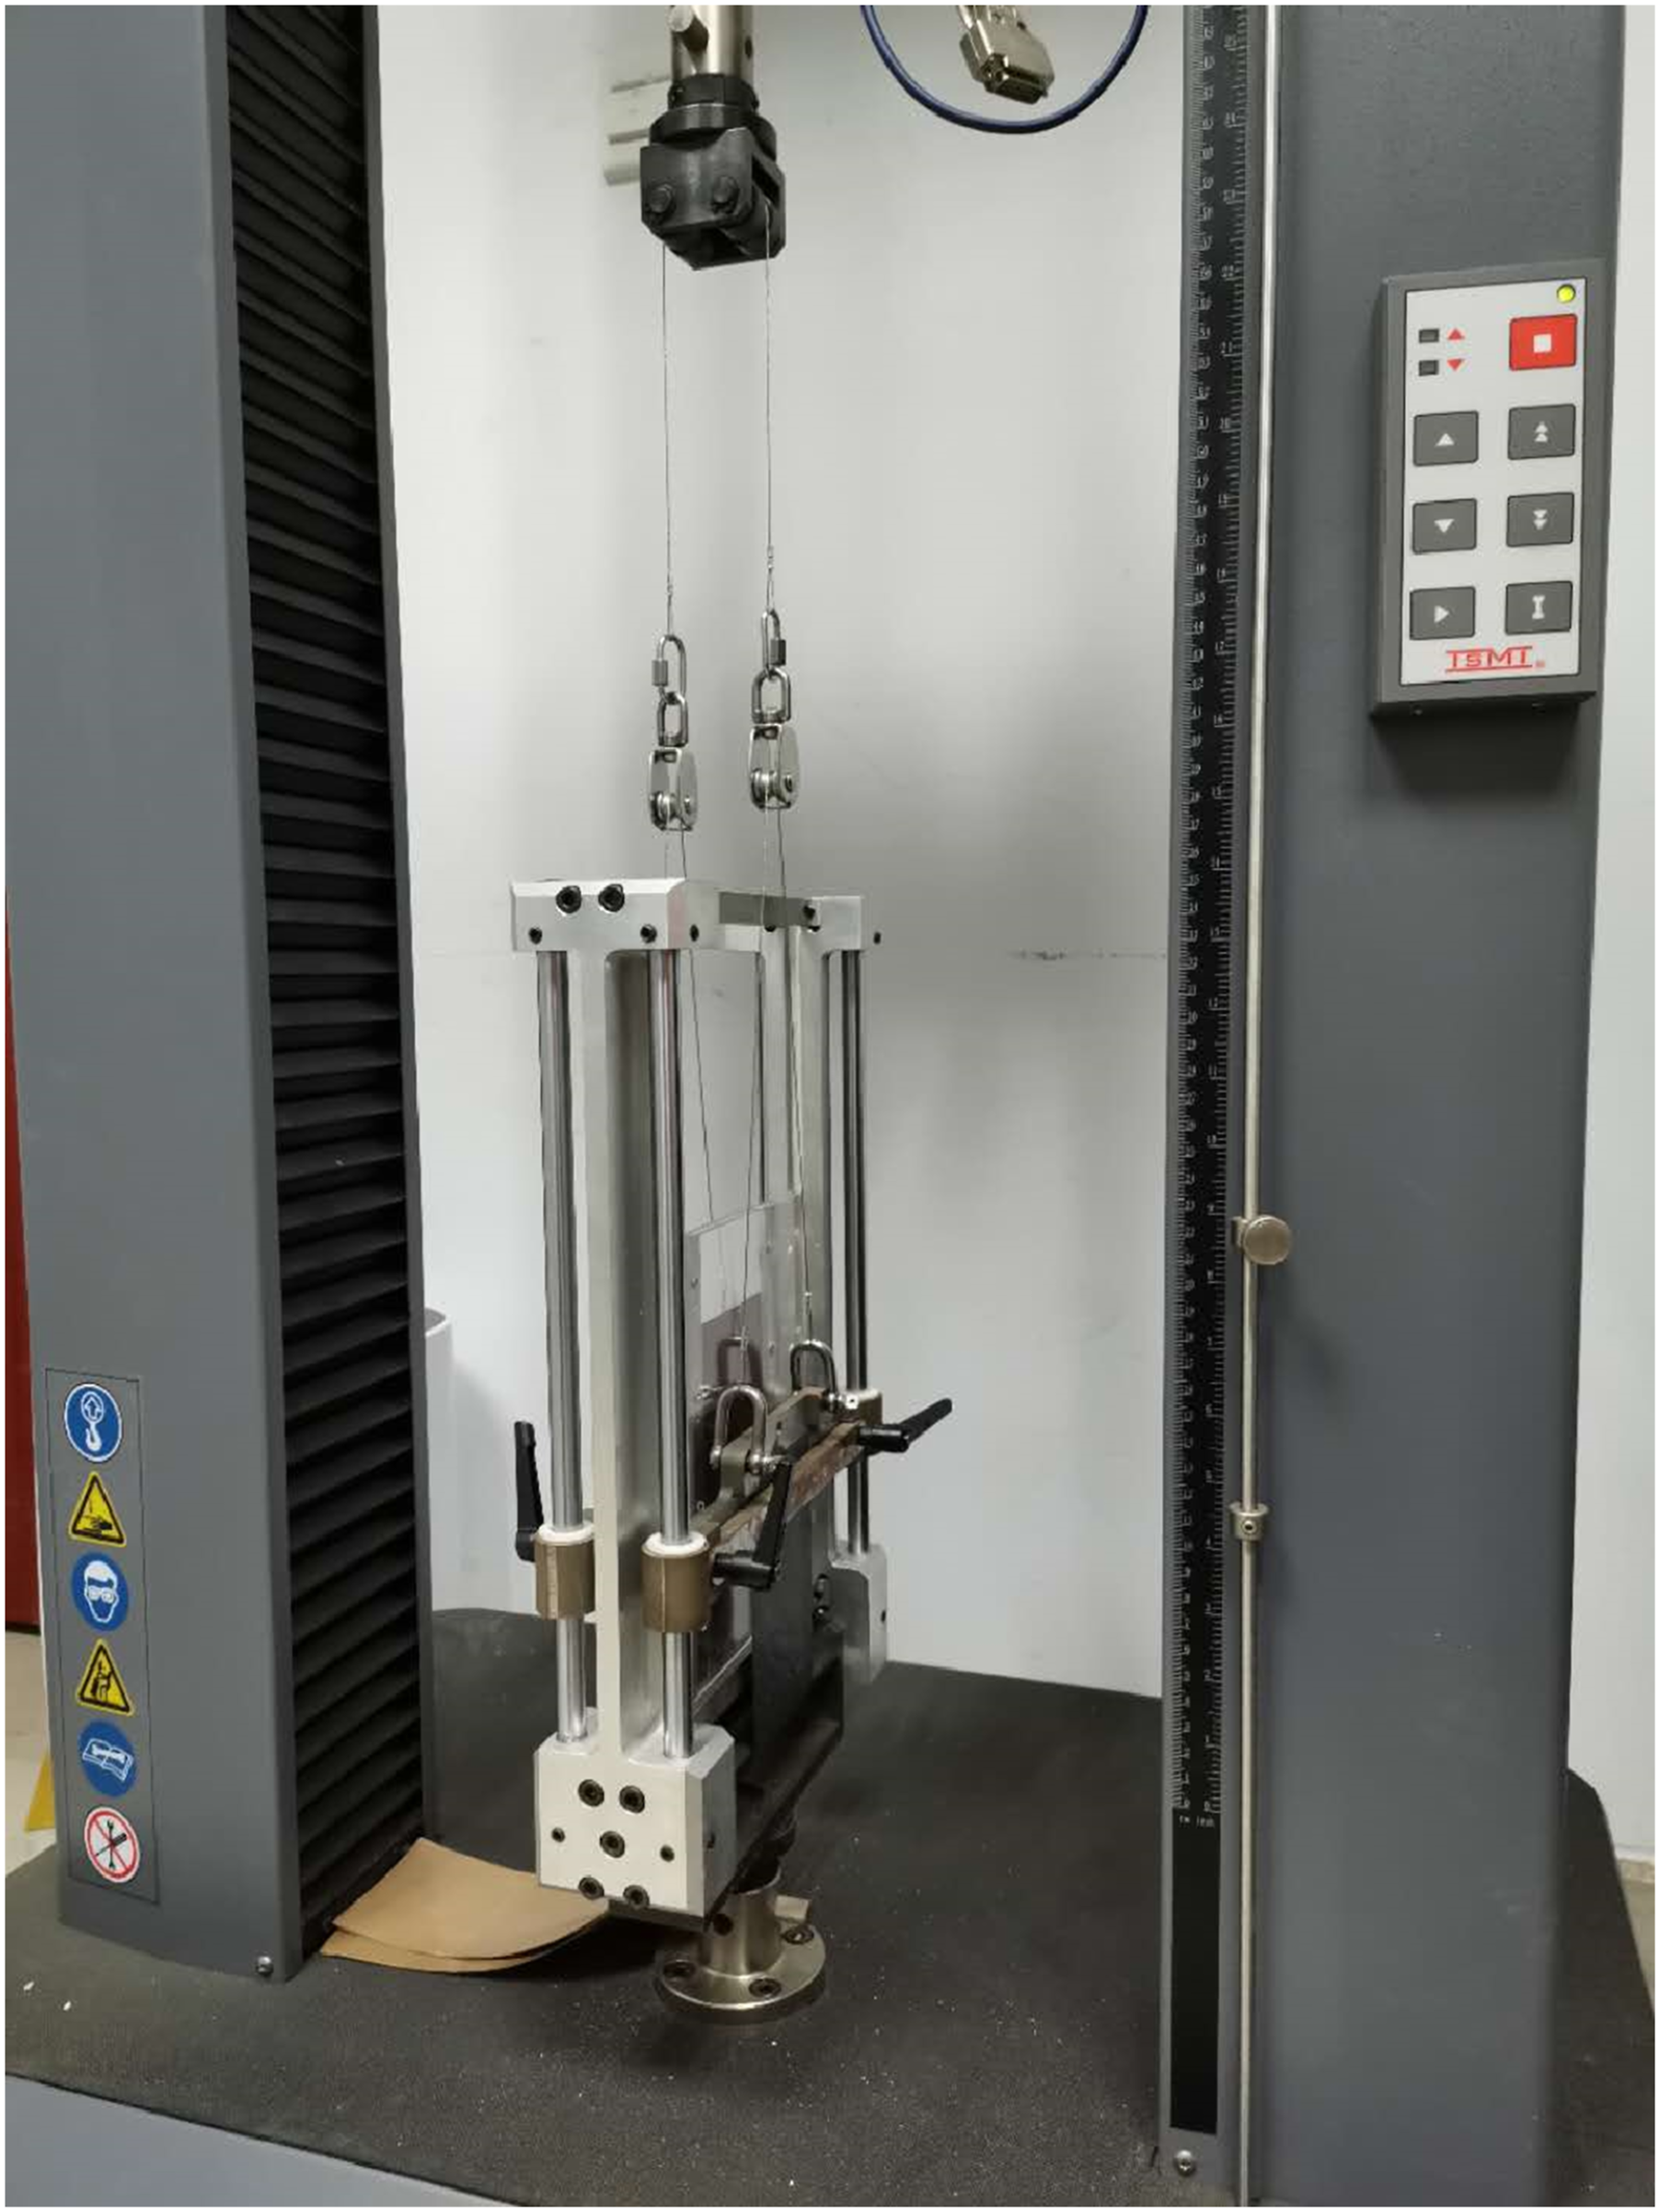
In this experiment, the universal testing machine with a force and a position sensor is used to pull the prepreg sample at a constant speed to obtain the peeling force-displacement curve. Figure 16 shows the curve obtained from one experiment. Obviously, the curve consists of two plateau stages. In the initial section of the sample, the two layers of prepreg are not bonded. The tensile force measured at this time is the basic tensile force formed by the stiffness and frictional resistance of the prepreg. In the second stage, the upper and lower layers of the sample are bonded, and the obtained tensile force is the sum of the basic tensile and the peeling force. Therefore, the actual peeling force of the sample is the difference between the average value of the two plateau stages in the curve. Example of displacement-peeling force curve.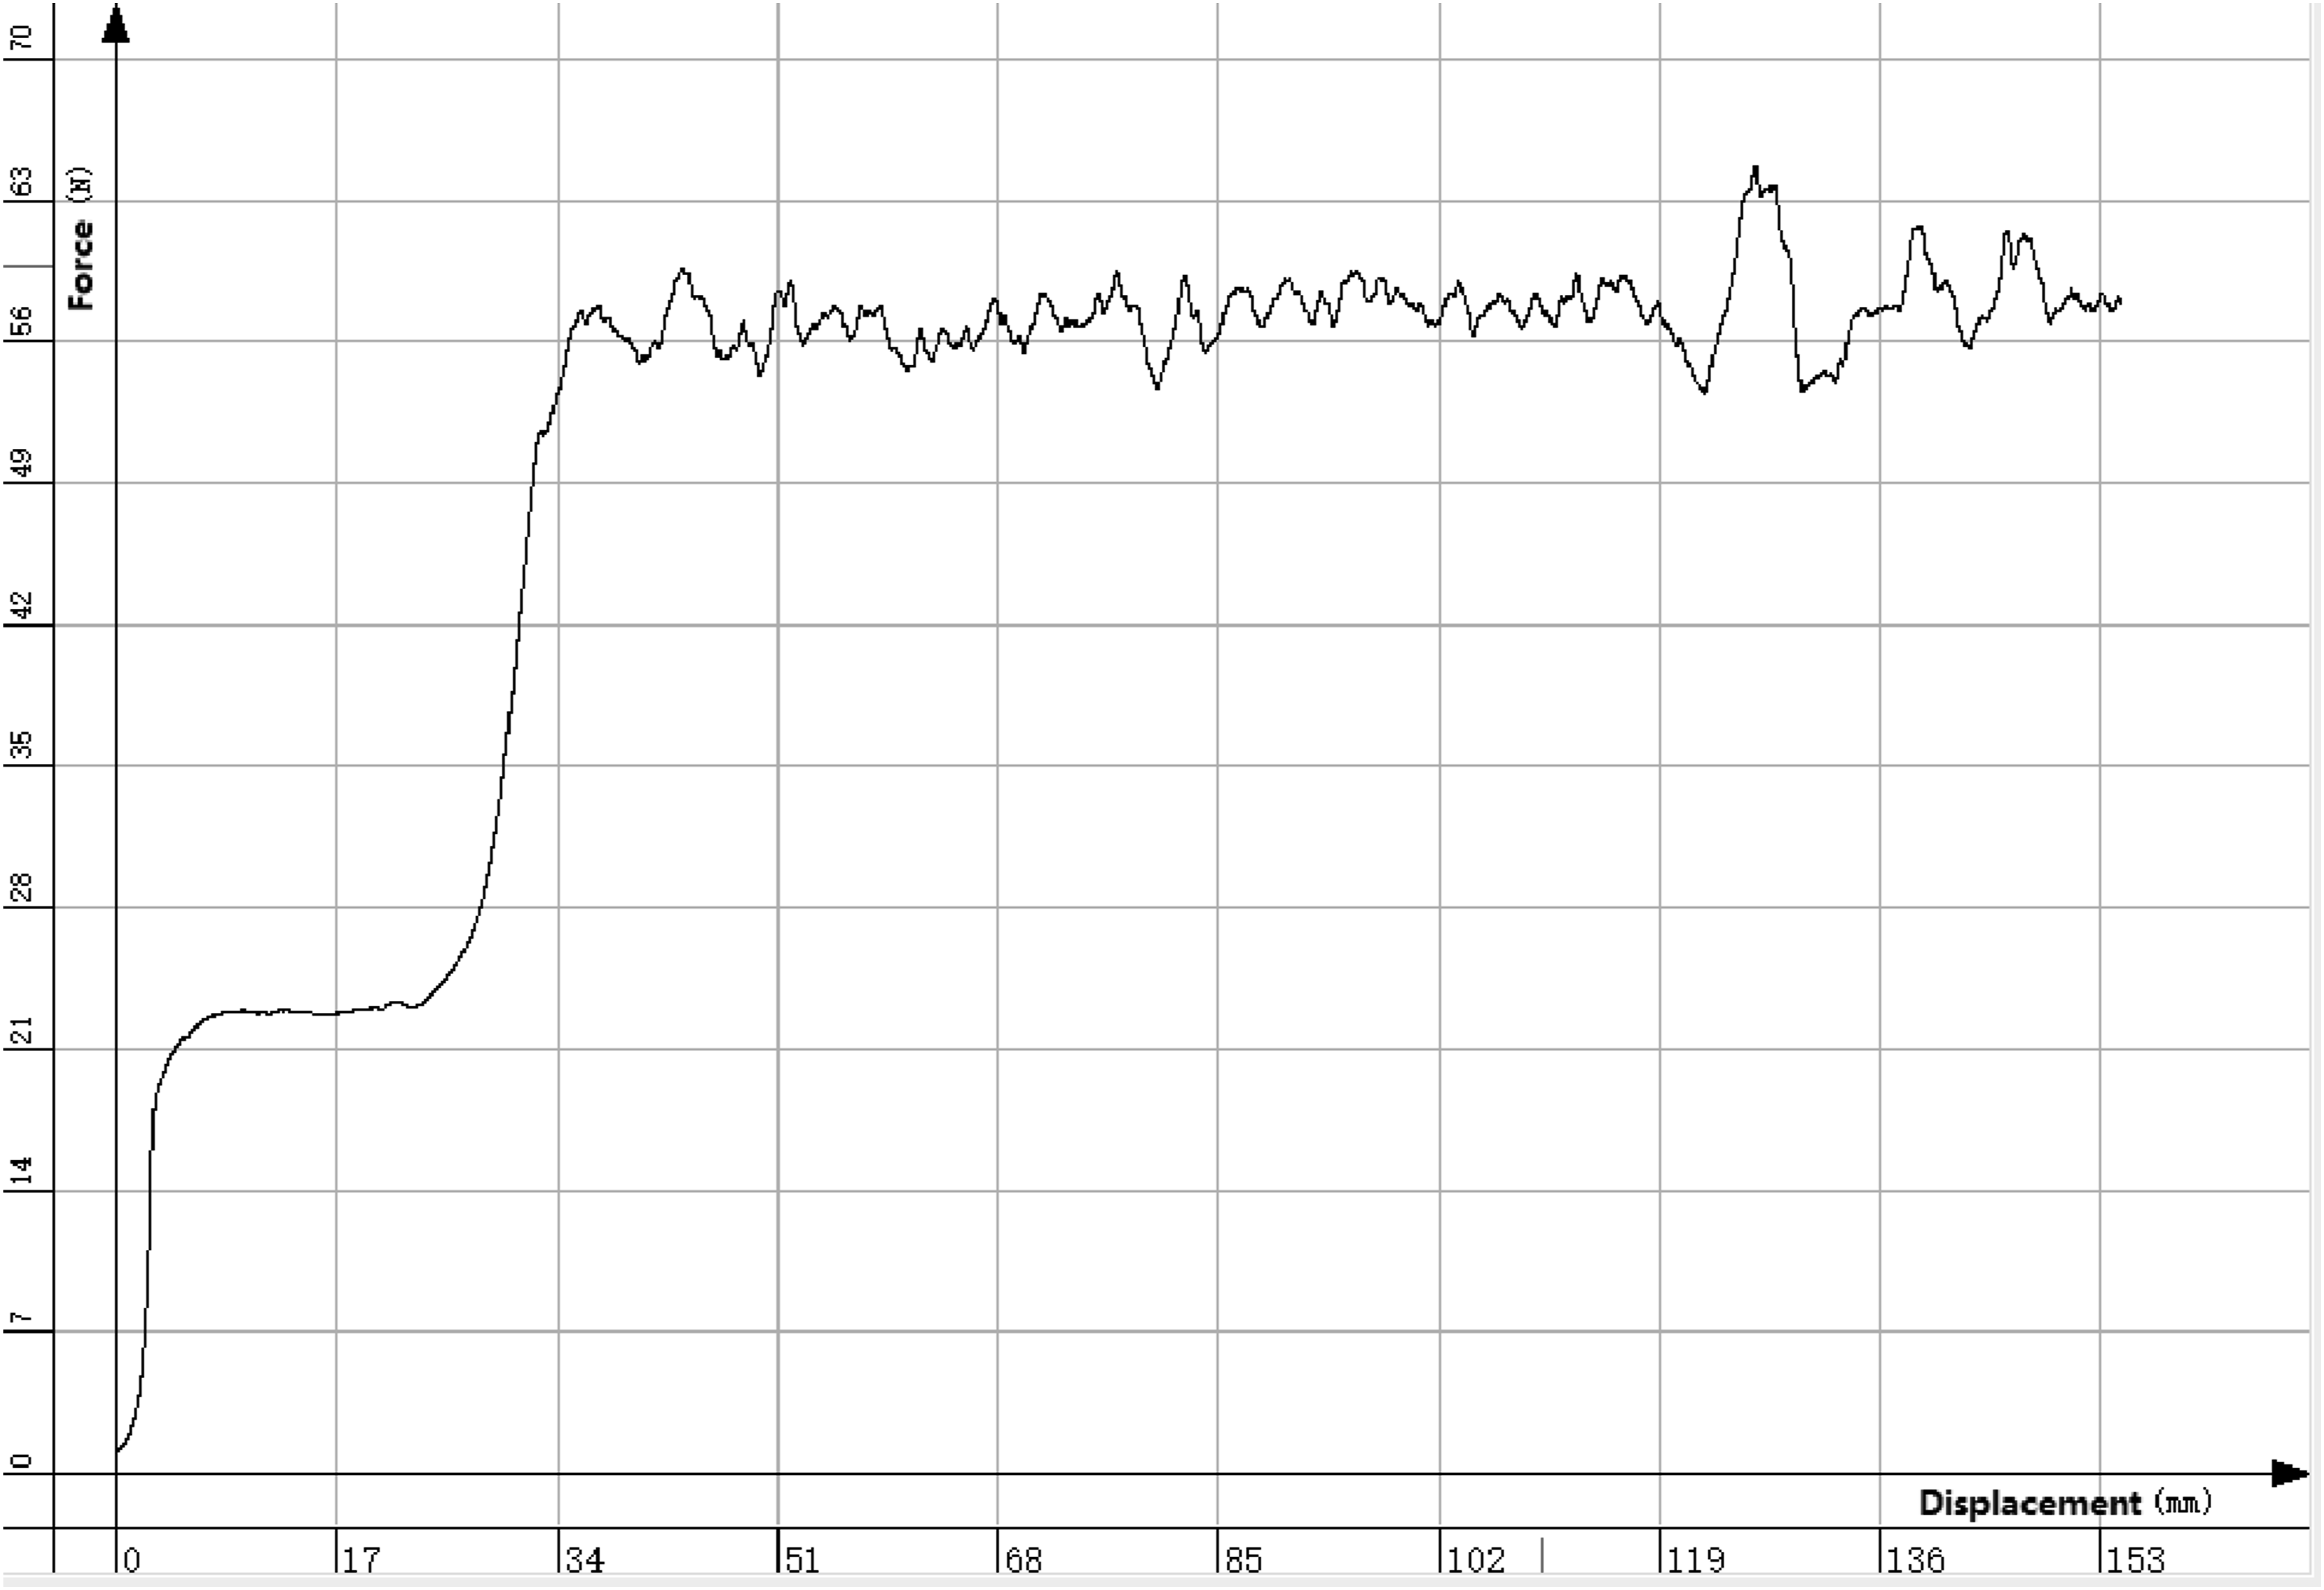
In Williams and Kauzlarich,
6
force analysis during a peeling test was performed. Assuming that in the peeling experiment, the width of the sample is

In this study, both
In order to explore the influence of the two interface formation mechanisms under different laying speeds, it is necessary to draw a logarithmic curve of laying speed and peeling force under different laying pressures. Therefore, the experimental program is: The AFP simulation equipment and the peeling experiment device are in the same room and the room temperature is maintained at
Peeling speed-peeling energy experiment
In different stages of bonding, the above two different bonding effects will not only cause the difference in peeling force, but also may cause the difference in failure mode. For the samples in the dominant phase of molecular diffusion, since the interpenetration of the molecular segments on both sides of the interface has not been completed, the strength of this region is less than the resin asperities matrix, and interface failure may occur during separation. If the interpenetration of molecular segments has been completed, the interface in the sense of strength no longer exists, and cohesive failure will occur during separation. For the prepreg-metal interface, cohesive failure and interface failure can be distinguished by visual observation; that is, if cohesive failure occurs, there will be residual resin on the metal, and resin threading can be seen during separation. However, this article studies the prepreg-prepreg interface, so it is not easy to directly observe whether resin transfer occurs between the two layers of prepreg. Therefore, it is necessary to use other methods to further confirm the transition of the two failure modes.
According to Dubois et al.,
4
as the separation speed of the prepreg sample is different, the failure mode will also change. Generally speaking, the sample undergoes cohesive failure during low-speed separation, and interface failure occurs during high-speed separation; an increase in the separation speed will result in an increase in the separation force, but when the sample enters the interface failure zone, the increase will be smaller. Therefore, in order to further prove the formation mechanism of the interface, peeling experiment with a variety of peeling speeds can be performed near the transition of the two failure mechanisms. The laying speed-peeling energy curves formed at different peeling speeds are then compared to determine the transition of interface failure and cohesive failure. Therefore, the experimental program is: the AFP simulation equipment and the peeling experiment device are in the same room and kept at a room temperature of 22°C. The laying temperature is fixed at
Results analysis
Analysis of prepreg deformation curve
The 10-layer prepreg compacted sample as mentioned above has a compressive creep curve at 22°C as shown in Figure 17. The 22°C compressive creep curve of 10-layer compact prepreg samples.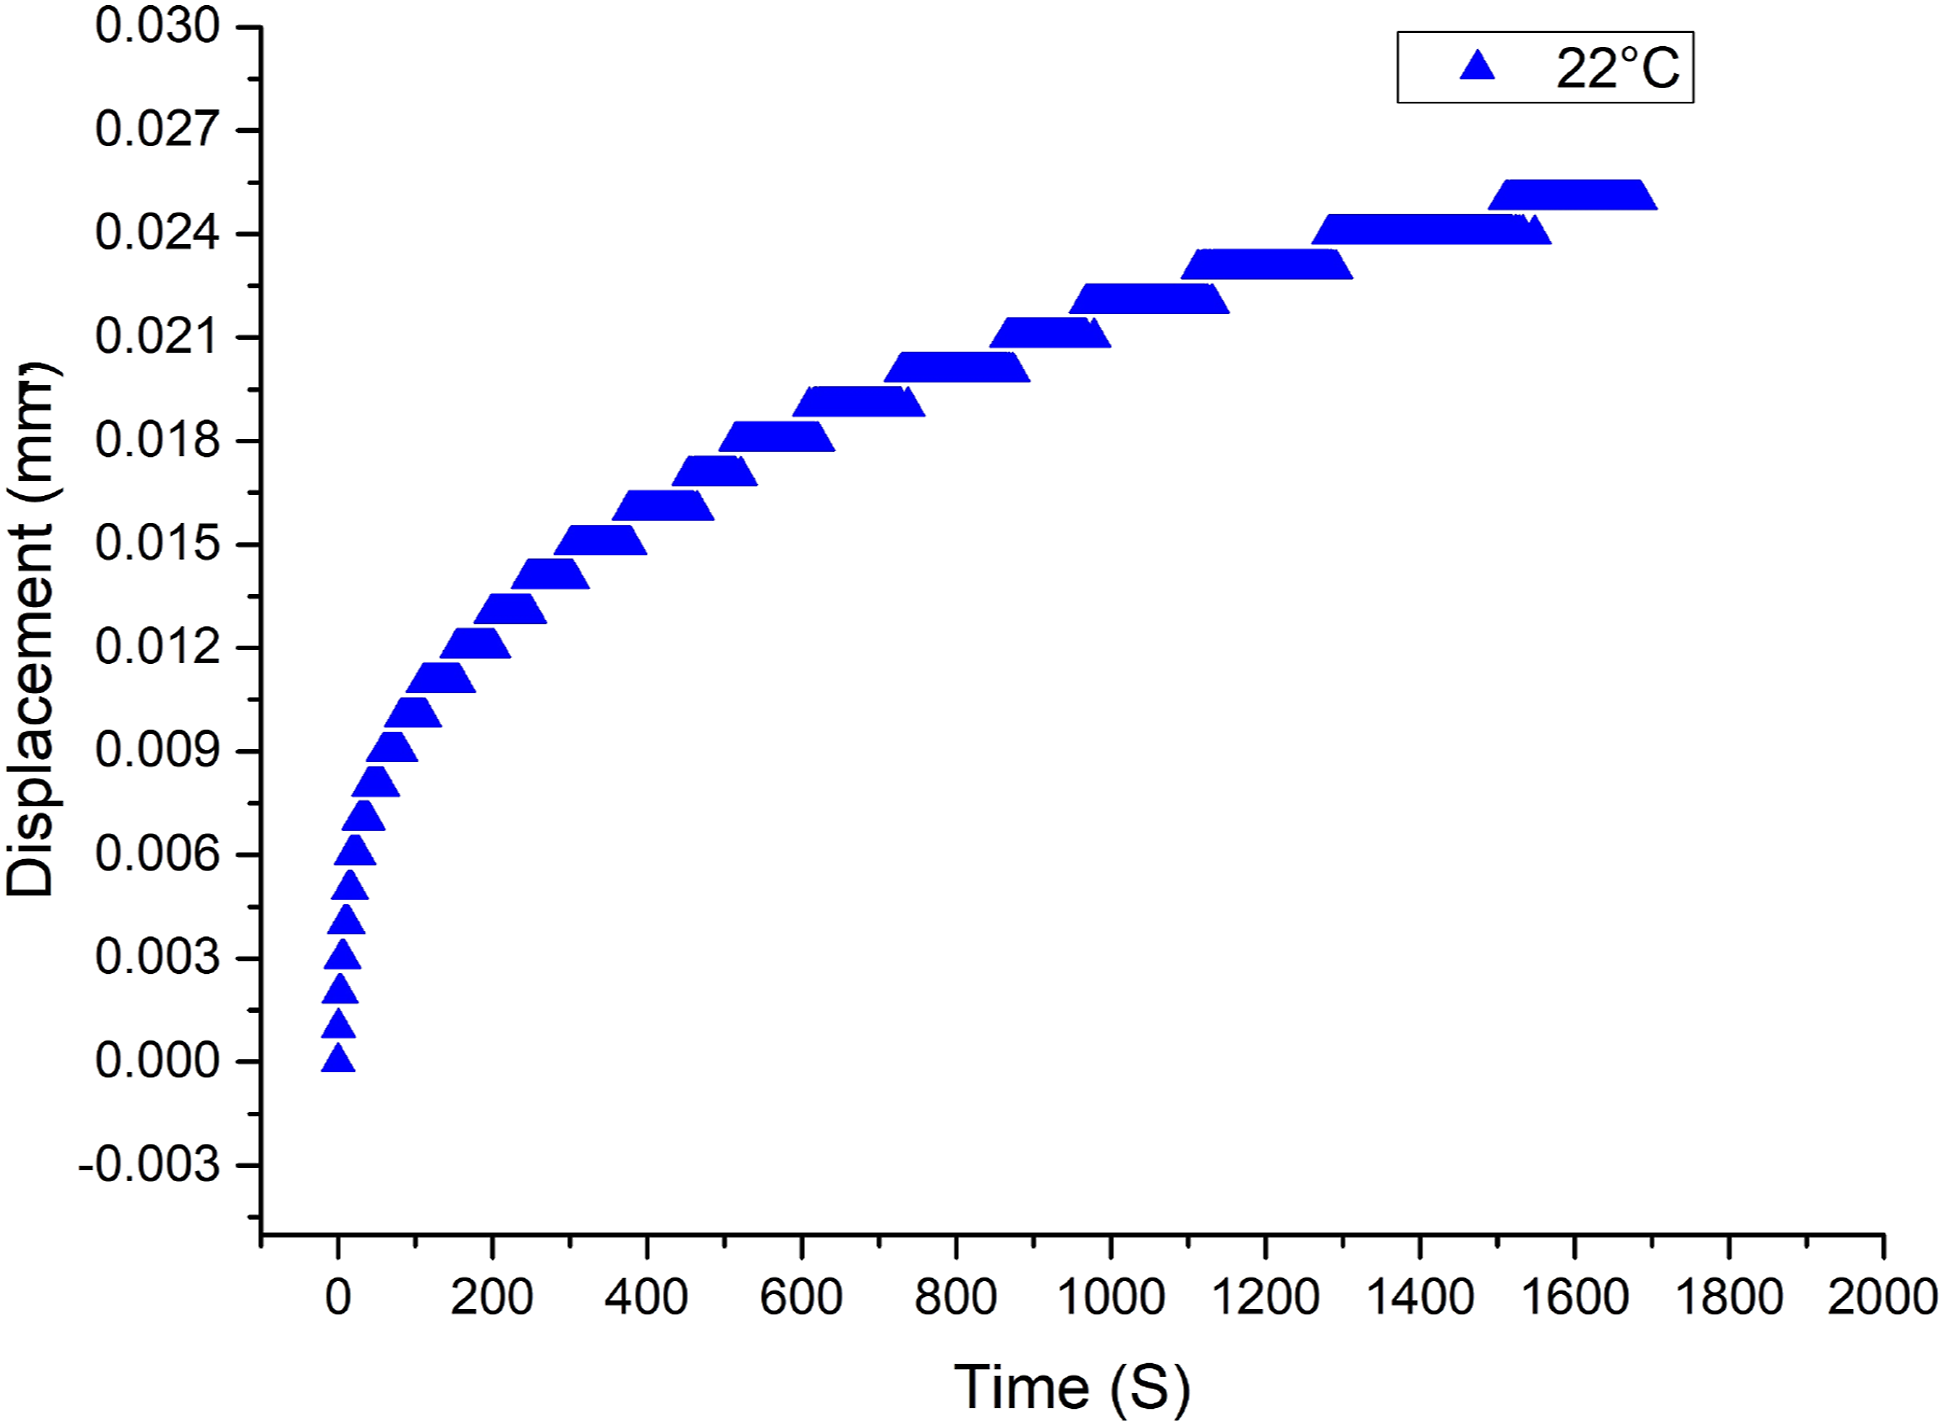
The 10-layer prepreg compacted sample as mentioned above has a compressive creep curve at 40°C as shown in Figure 18. The 40°C compressive creep curve of 10-layer compact prepreg samples.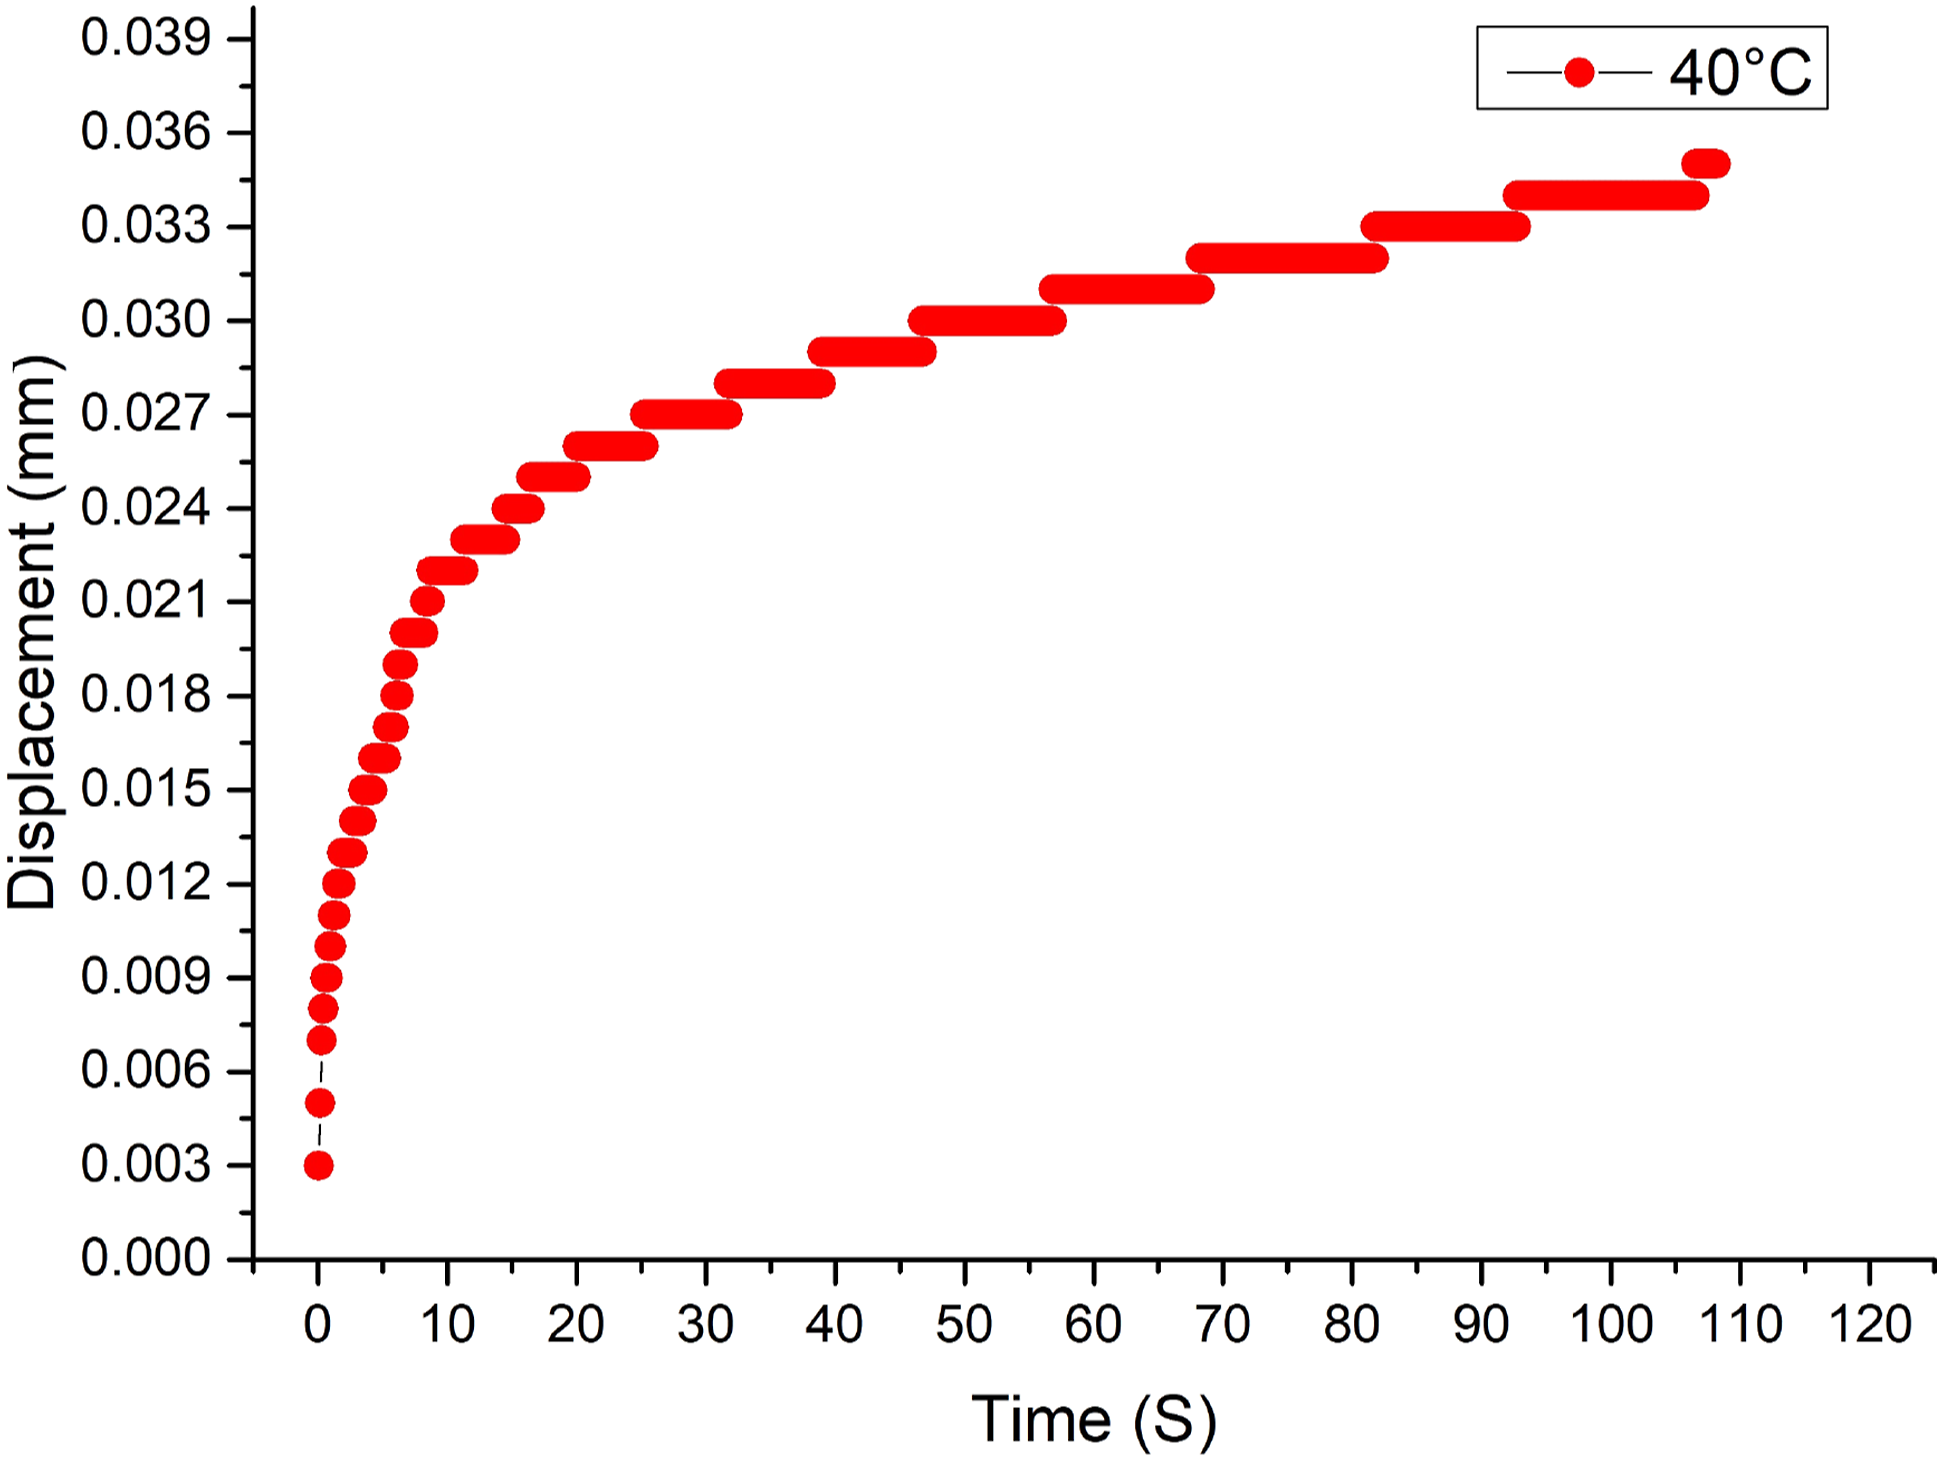
Let the creep displacement of the prepreg be D, the pressing time of the compactor be t, and the experimental temperature be T. The time-temperature equivalent coefficient
As mentioned earlier, a 2-layer prepreg sample is tested at 22°C to simulate the deformation of the prepreg resin asperities during the actual laying process. The creep curve obtained from the experiment is shown in Figure 19. The 22°C compressive creep curve of 2-layer prepreg samples.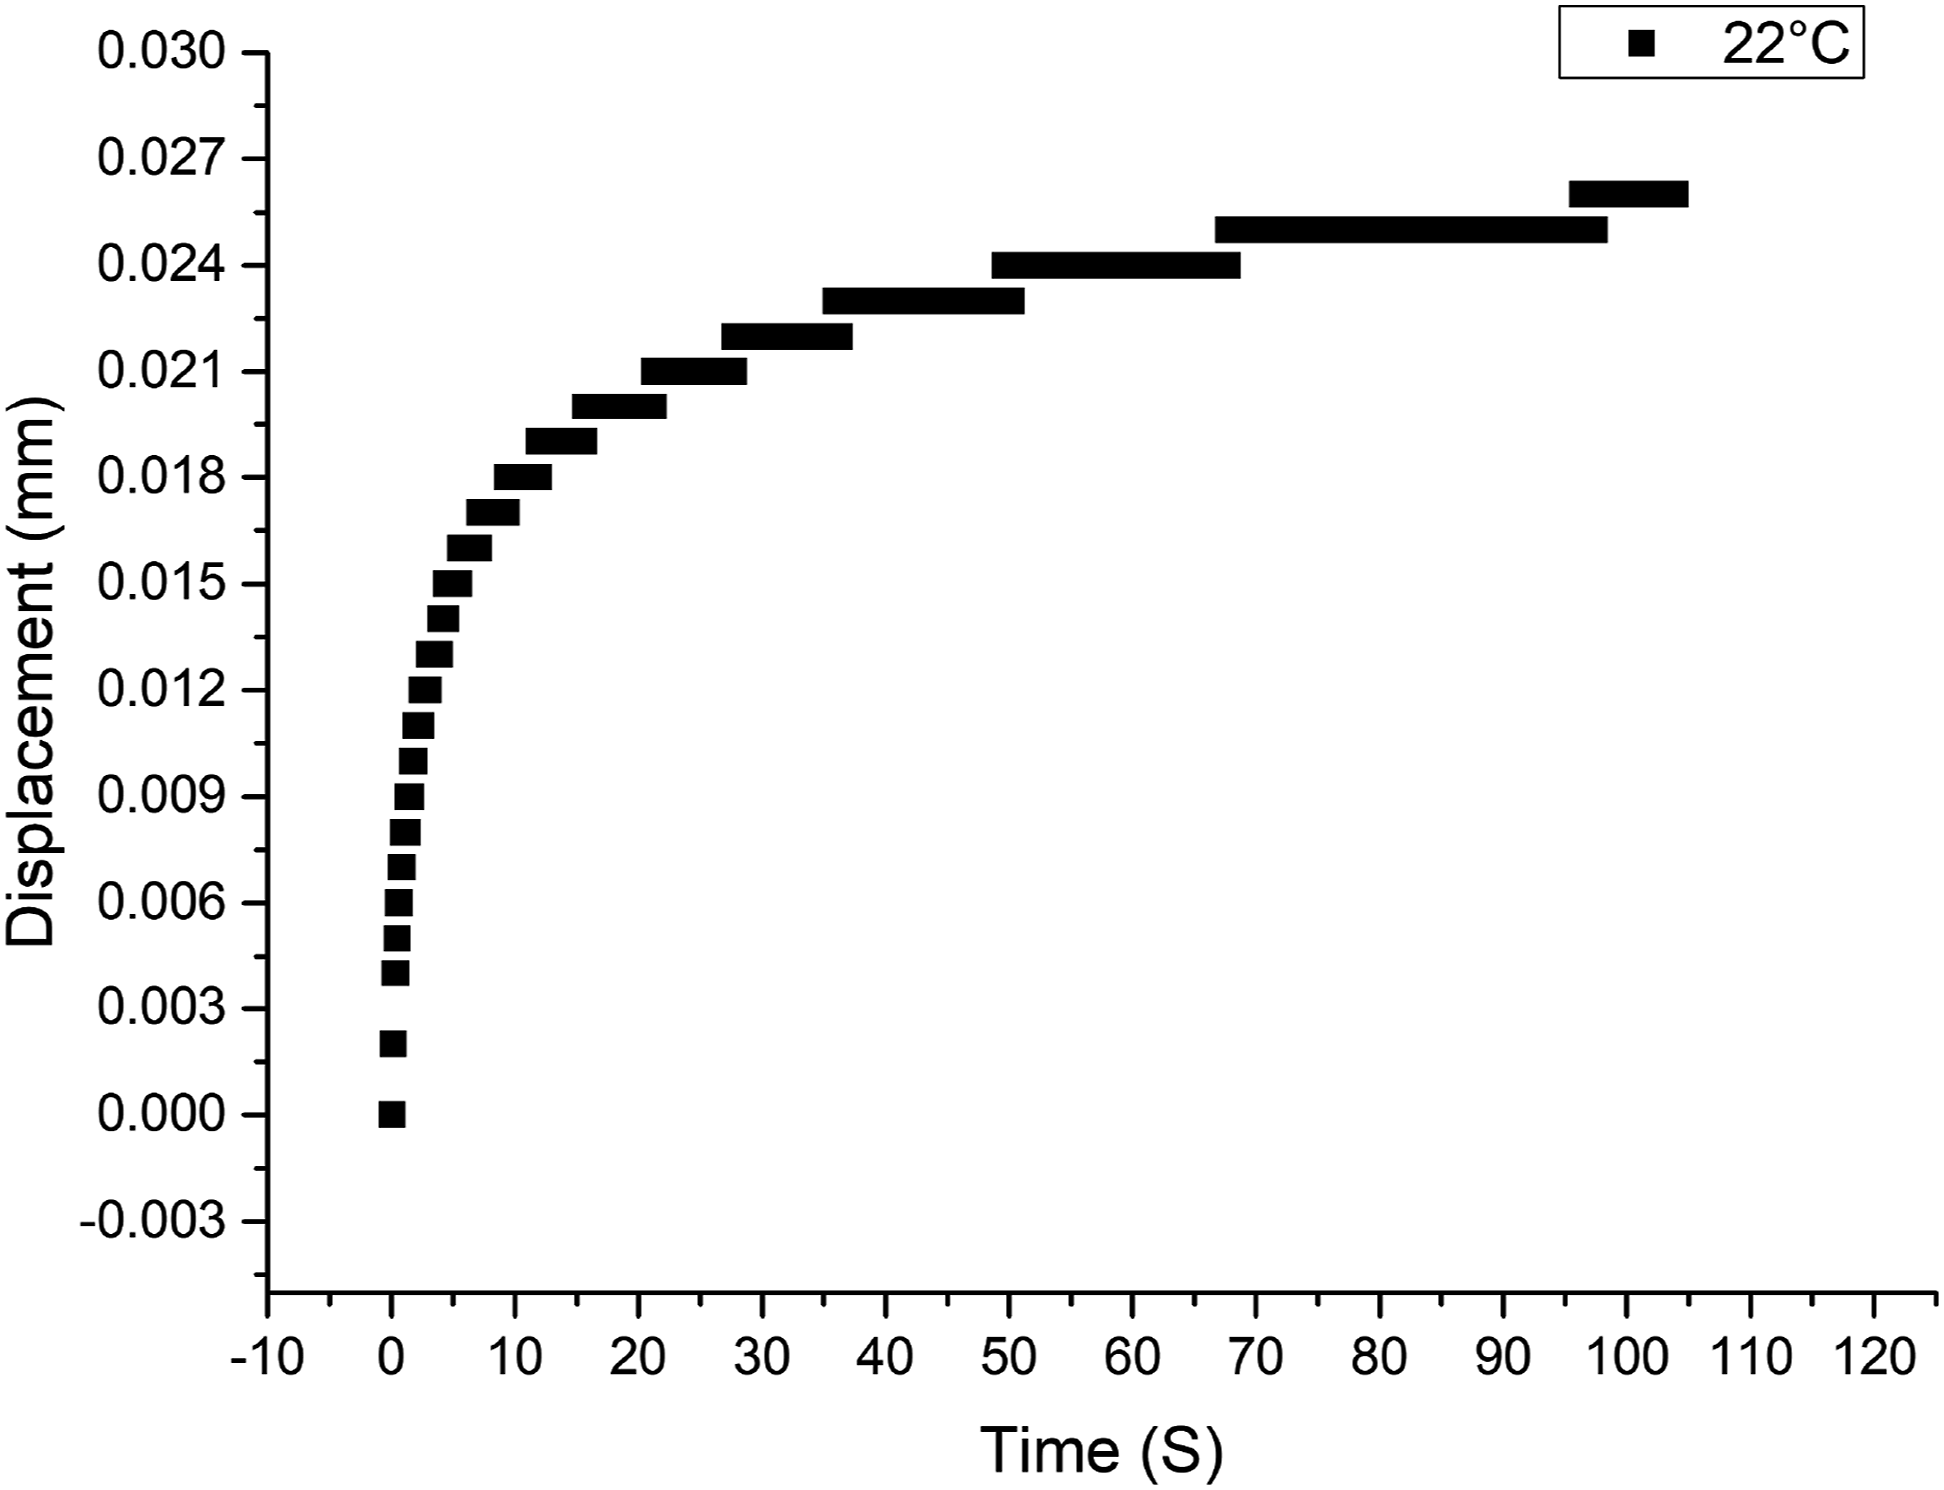
It can be seen that the curve presents obvious characteristics of rubber creep. This experiment reflects the compression deformation of a total of four layers of resin asperities with two layers of prepreg. It can be seen that within the experimental time range, the height of each layer of resin asperities changes by about 6 μm. If the elastic deformation displacement in the curve is assumed to be 18 μm, the permanent deformation of the single-layer resin asperities height during the experiment is 1.5 μm. As mentioned earlier, the height of the resin asperities on the surface of the M21C prepreg is about 44 μm. Therefore, for equation (12), the change in the height L of the resin asperities caused by the different pressing time will not exceed 4.6%, and its effect on peeling energy is not significant.
According to the time-temperature conversion coefficient obtained in the previous experiment and the measured contact length of the compactor, the curve in Figure 19 can be transformed into a laying speed-resin asperities deformation curve at 40°C. Take the logarithm of the laying speed-resin asperities deformation curve, and make the horizontal and vertical coordinates consistent, the following curve can be obtained.
Analyzing the curve shows that when the laying speed is between 200 mm/s and 500 mm/s, the slope of the curve changes between −0.3 and −0.35; when the laying speed is between 100 mm/s and 200 mm/s, the slope of the curve changes between −0.2 and −0.3; when the laying speed is between 12 mm/s and 100 mm/s, the slope of the curve changes between −0.15 and −0.2. Ageorges et al.
20
simplified the viscous flow part of the resin asperities as a liquid squeezing flow between two plates, and deduced Logarithmic curve of laying speed-resin asperities deformation.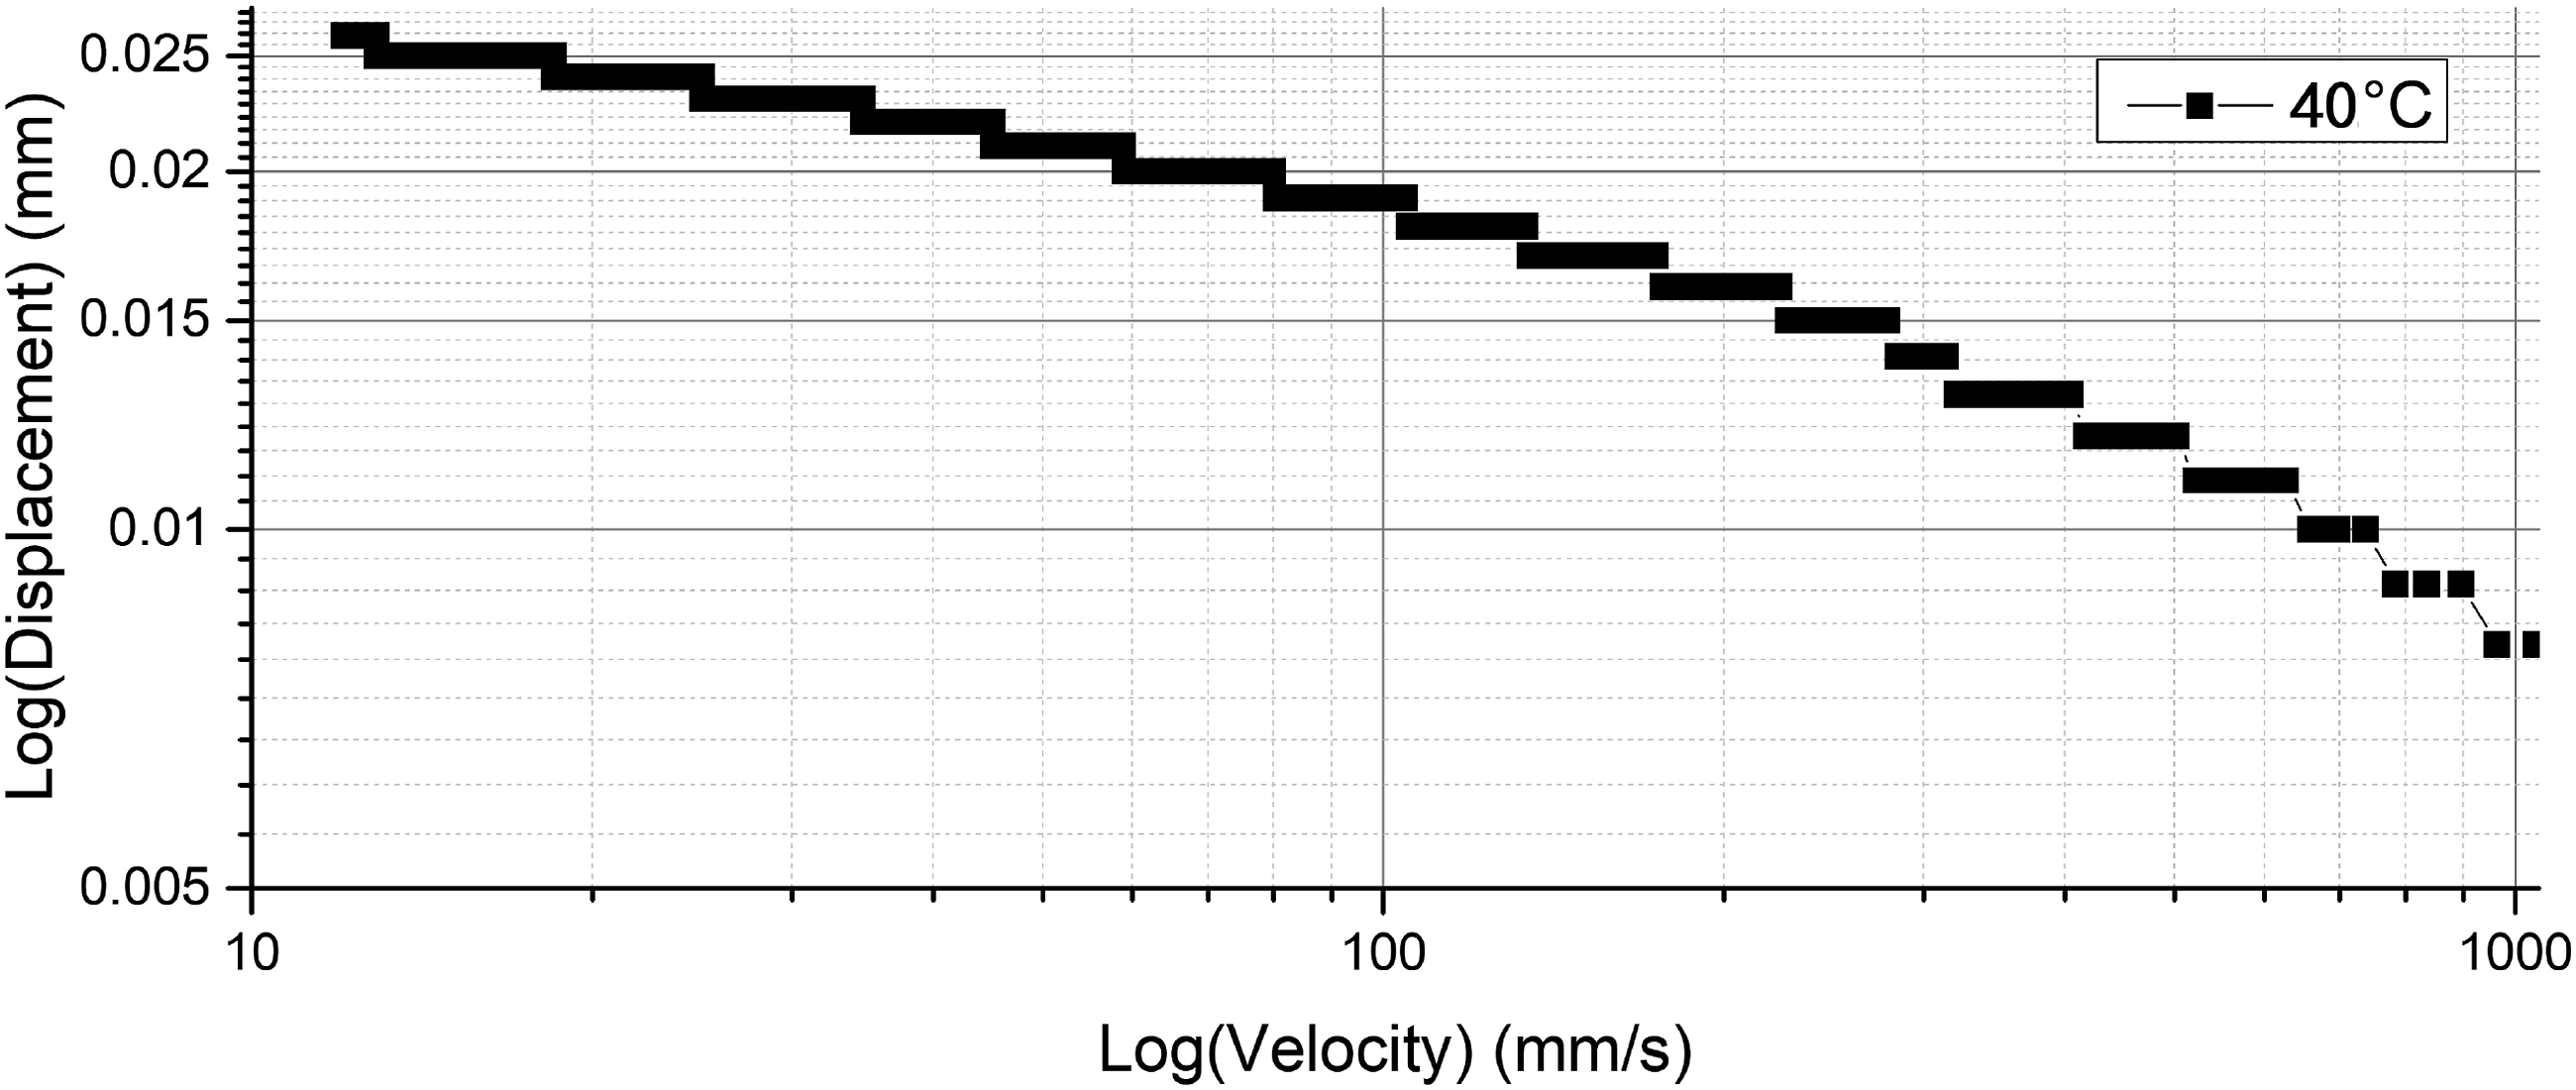
Analysis of laying-peeling test
Through the above laying test, the following Laying speed-peeling energy logarithmic curve.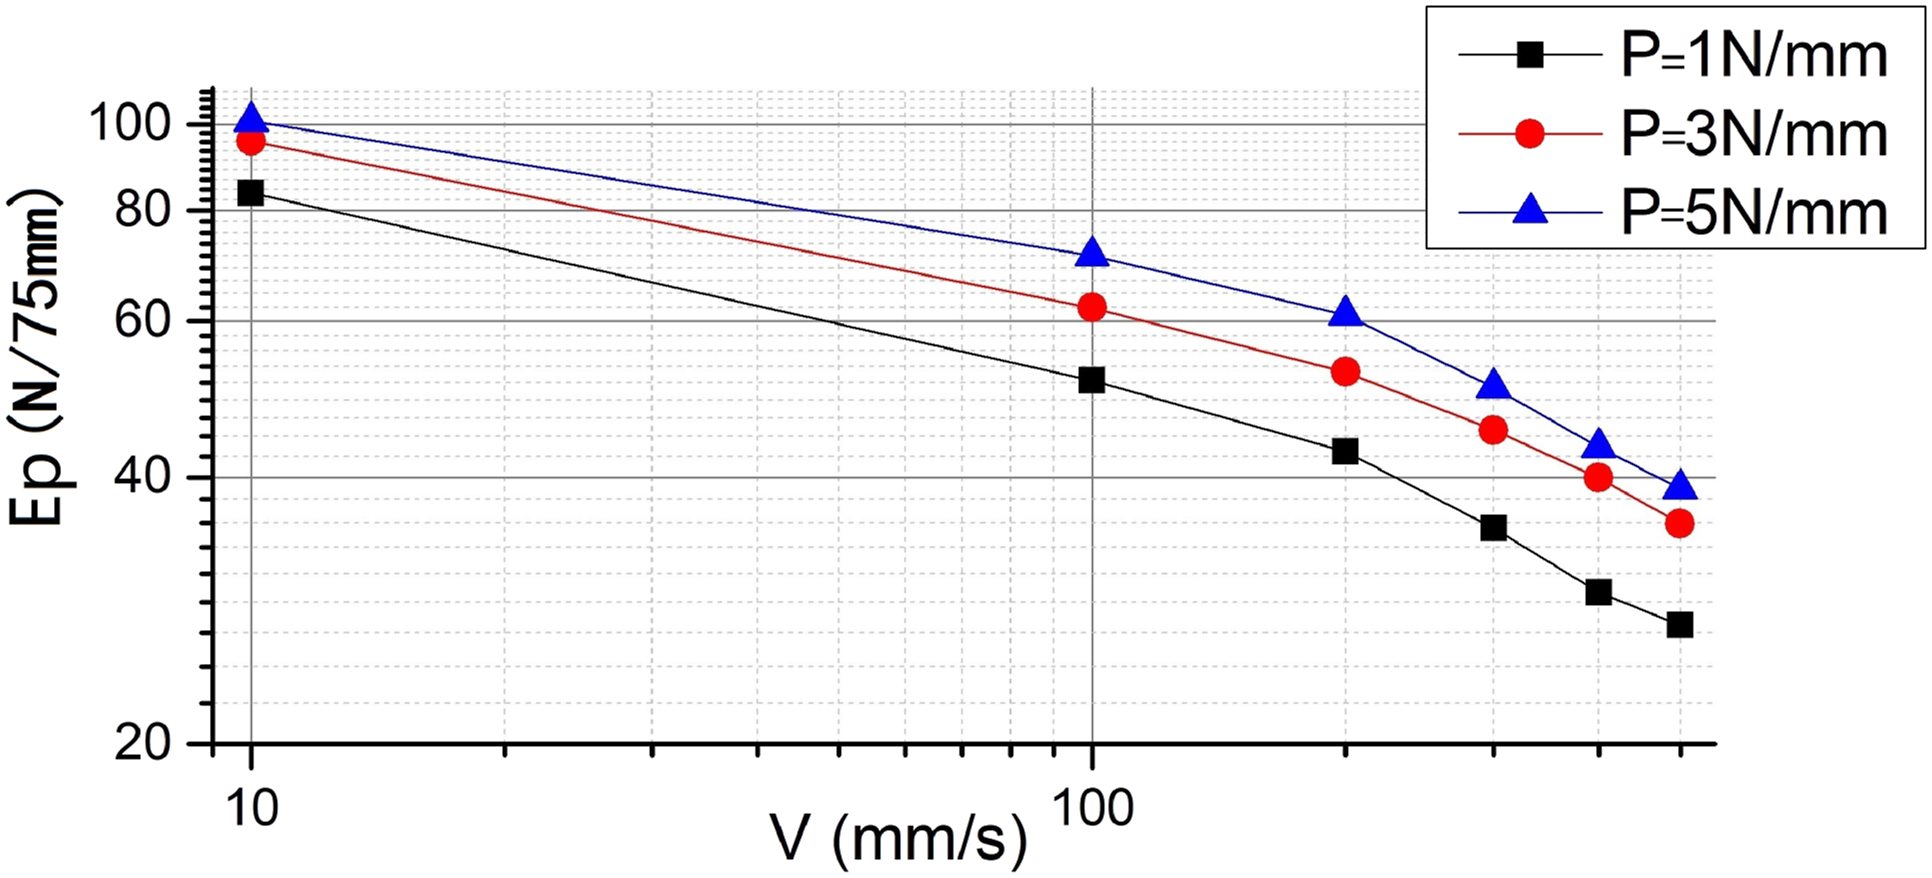
As clearly seen, although the peeling energy of the sample increases with the increase of the laying pressure at the same speed, the change trend of the peeling energy with the speed is similar under the three different laying pressures. When the speed is less than 200 mm/s, the peeling energy decays slowly with the increase of the speed. But when the speed is greater than 200 mm/s, the slope of the curve becomes obviously larger. Although the placement pressure is different, when the laying speed is high, the slopes of the three curves are all close to Comparison of peeling conditions of state laid at high and low speeds.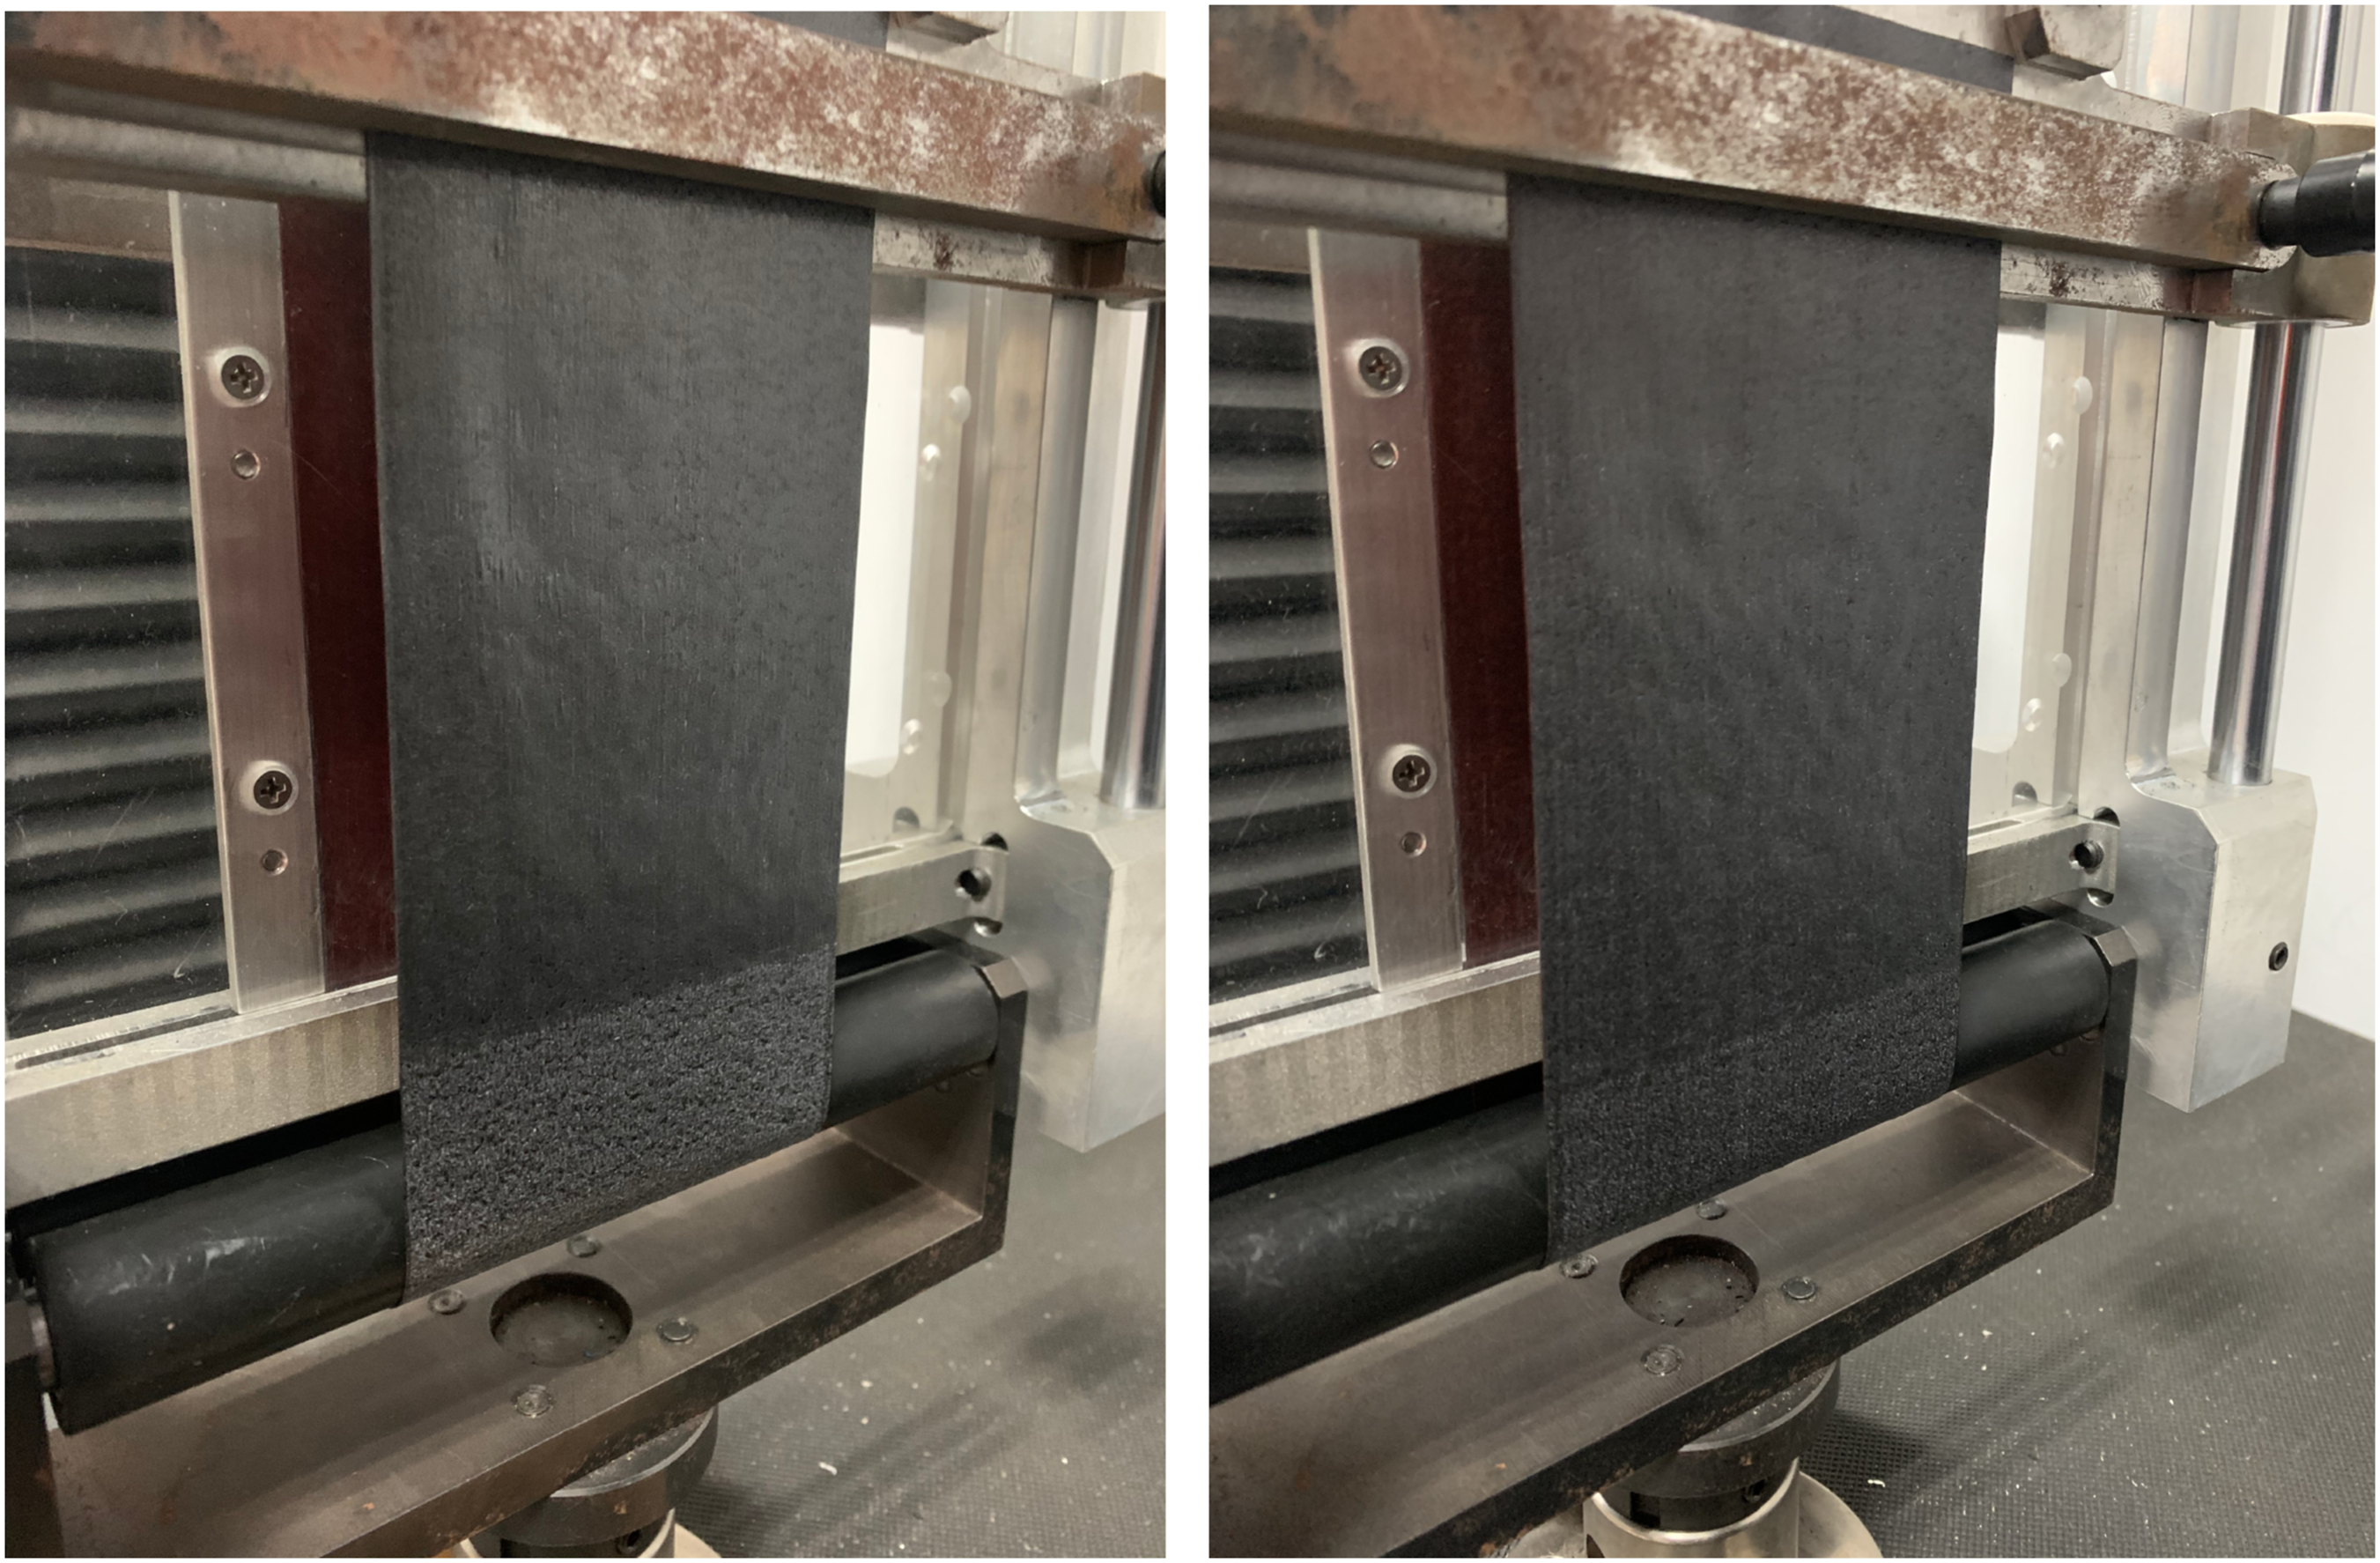
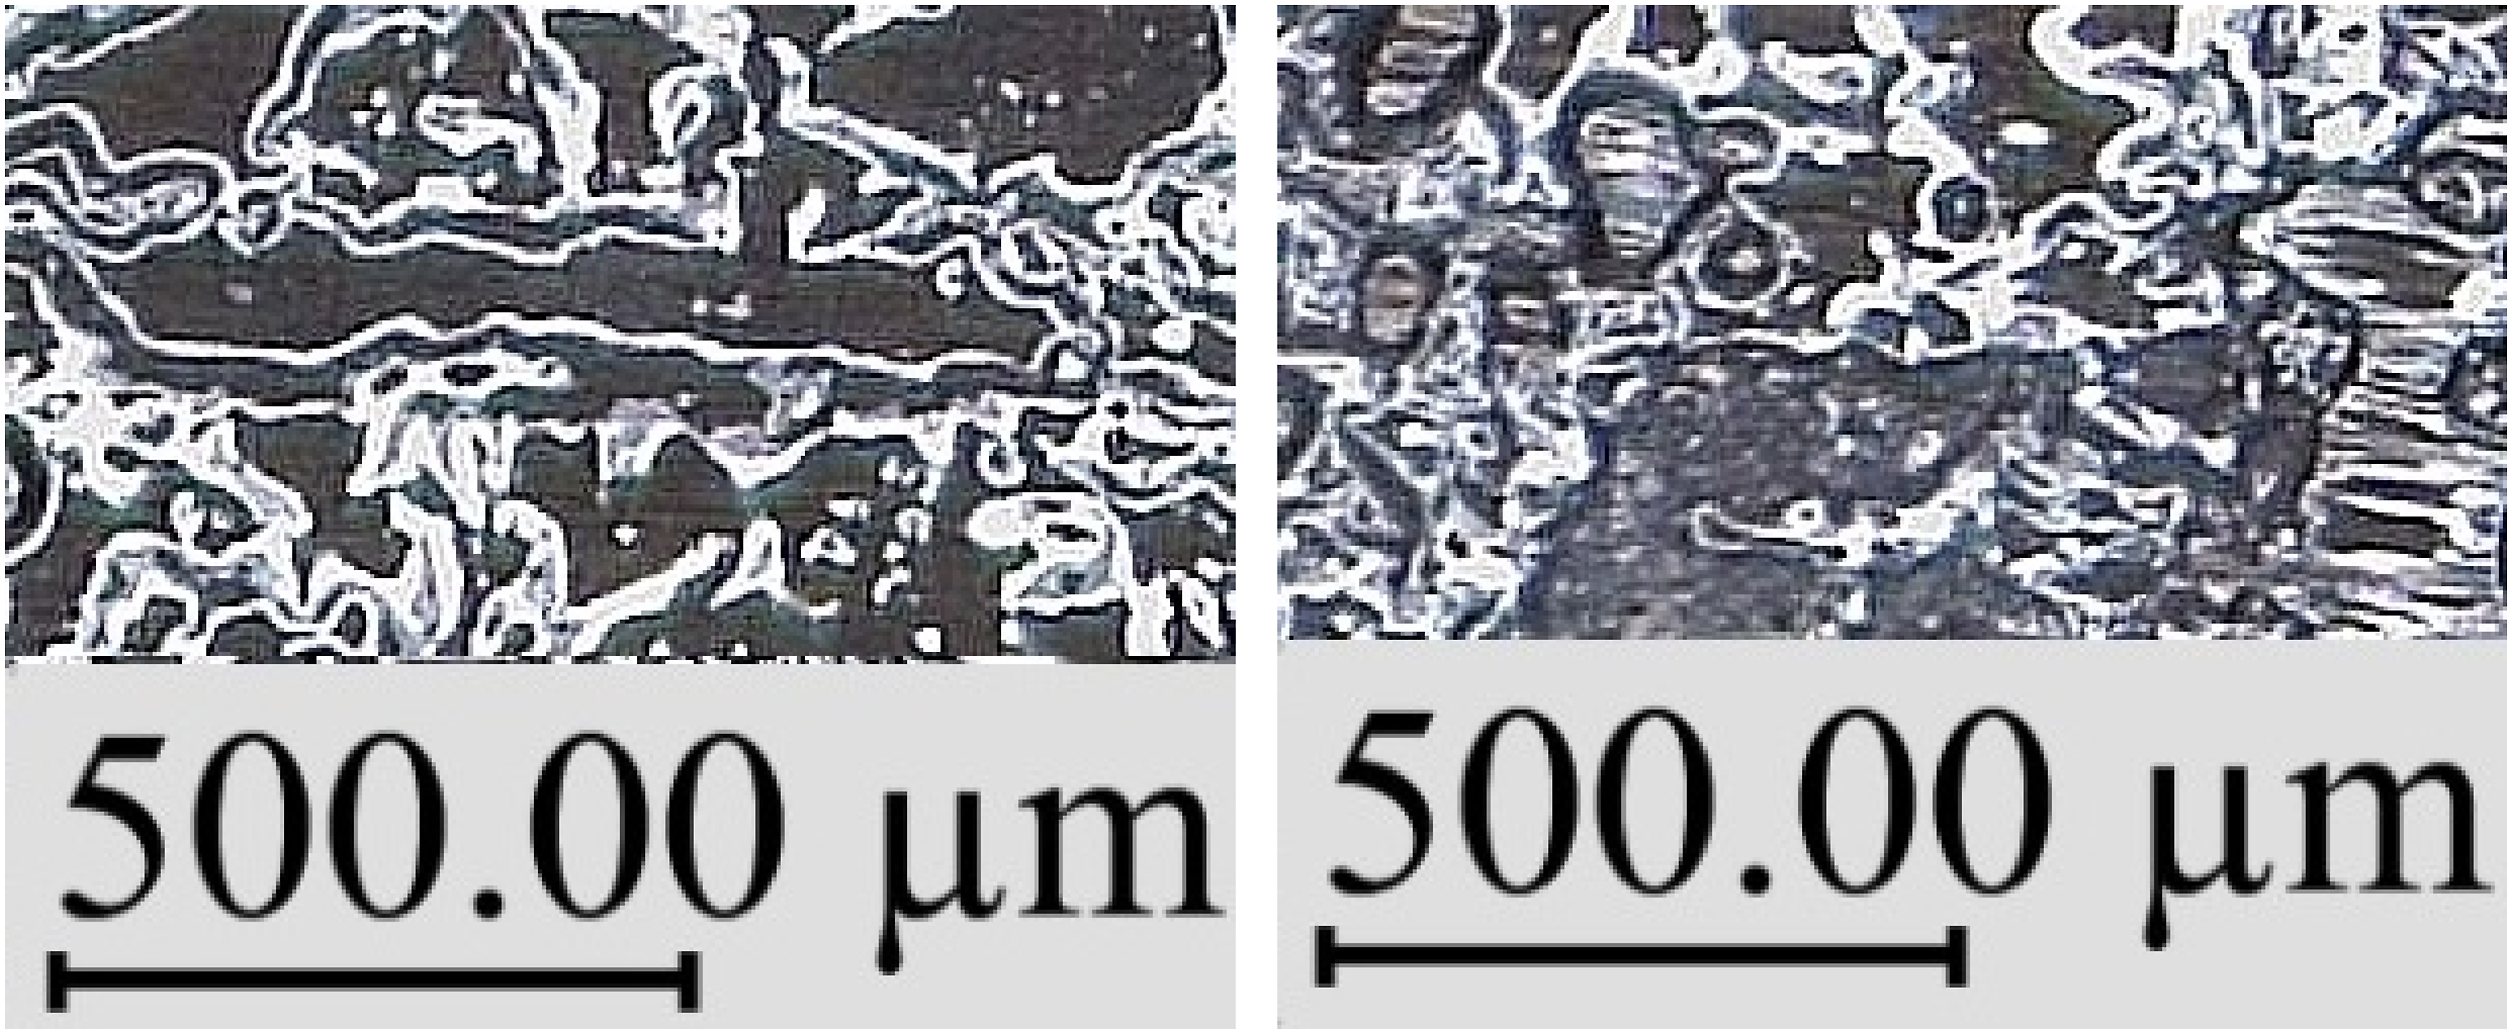
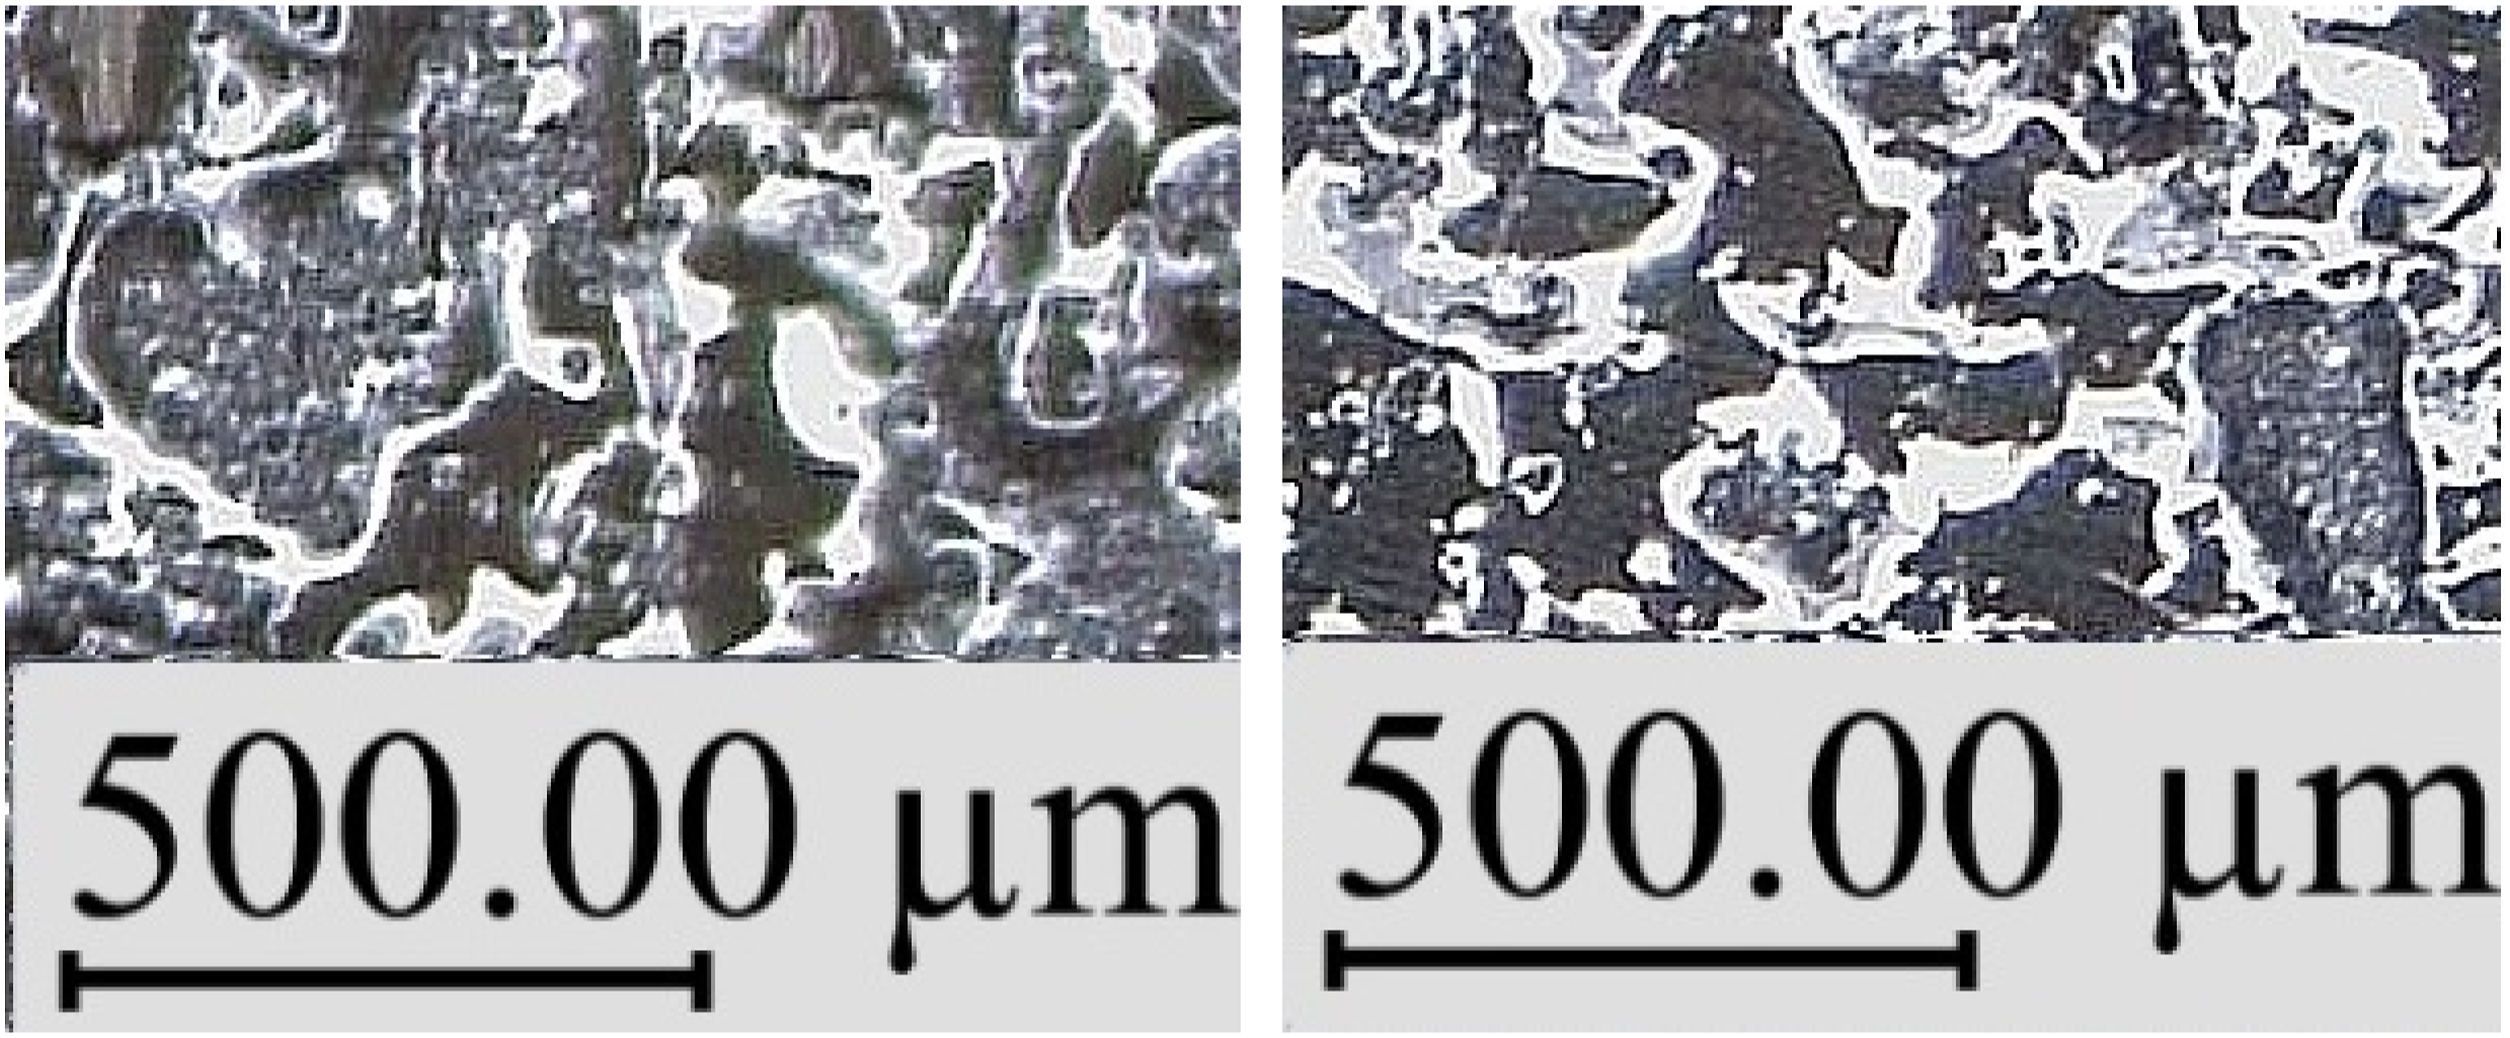
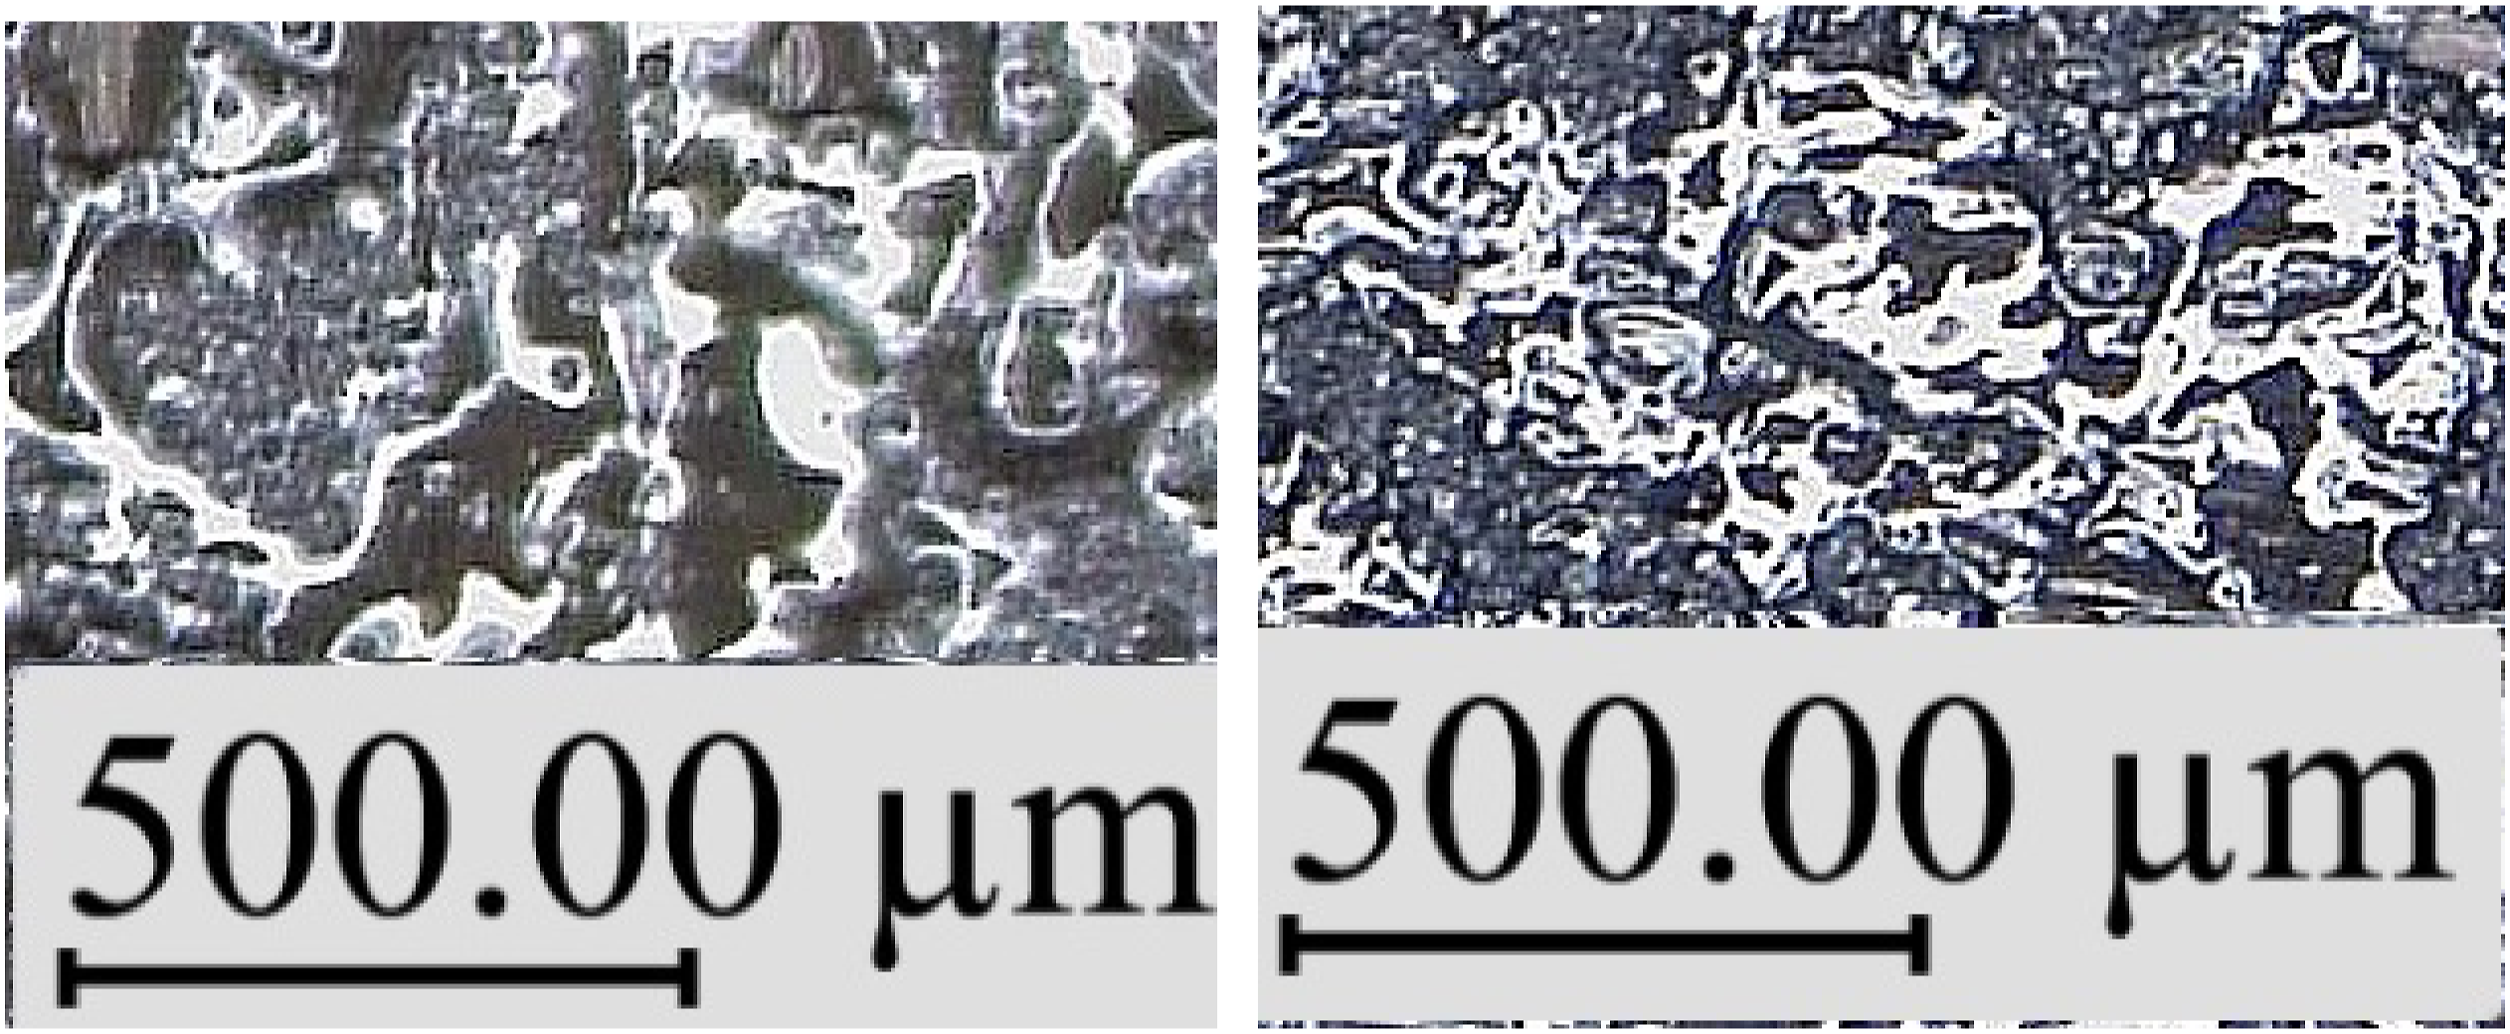
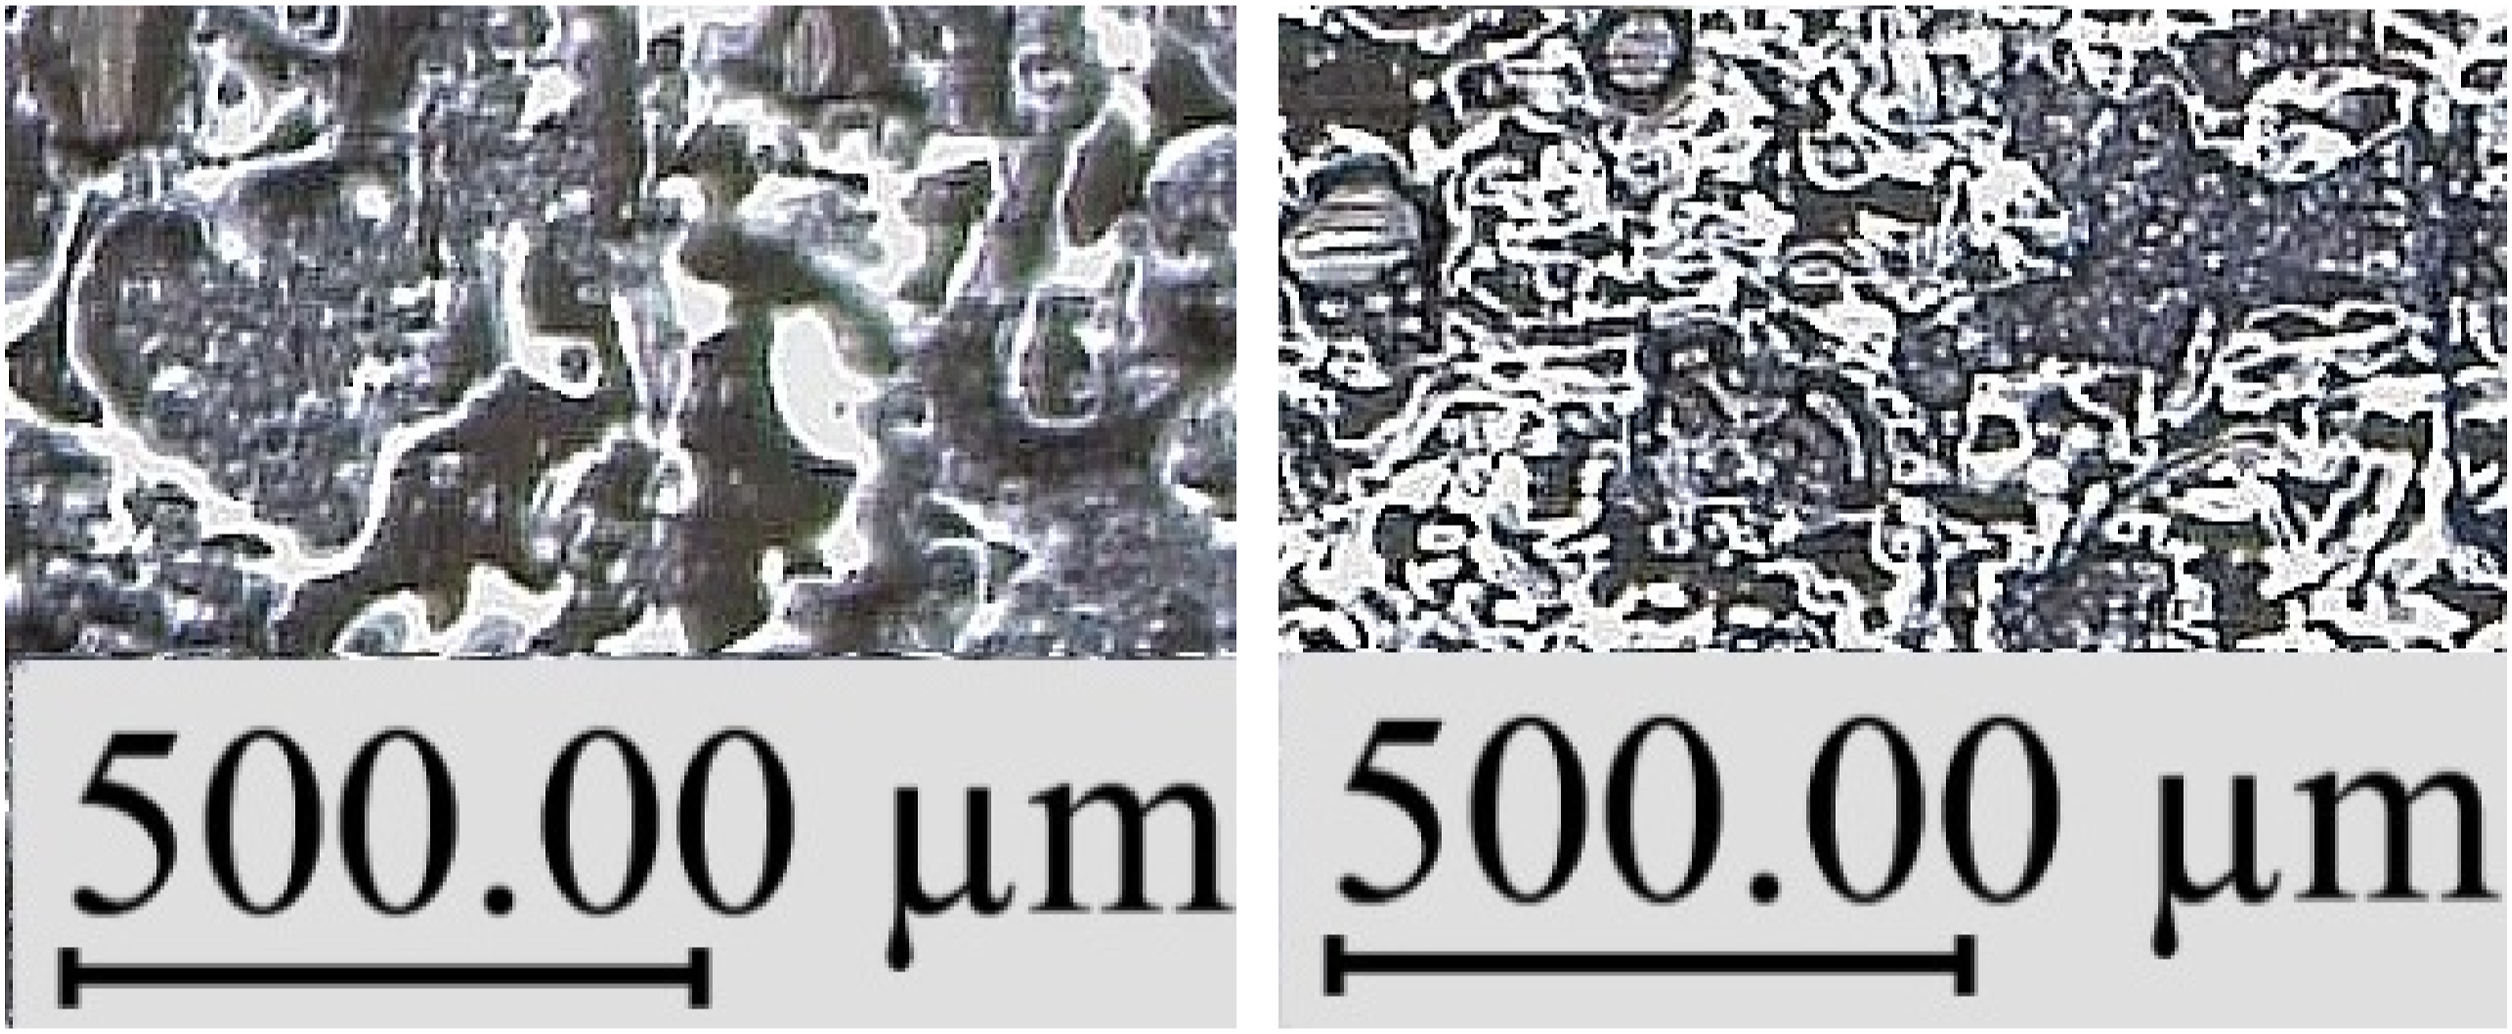
In order to further analyze the cause of this phenomenon, we used a Leica DVM-6A 3D profilometer to photograph the surface morphology of the peeled samples, which will be explained separately below. (a) The two samples in Figure 23 were all compacted at a laying pressure of 3 N/mm and a laying speed of 10 mm/s. The difference of these two samples is that the left side is the prepreg-PTFE cloth contact section in which the resin is not bonded, and the right side is the surface formed by peeling off the two layers of prepreg after bonding. The large black areas in the picture are resin asperities, and the white lines are the edges. As can be seen from Figure 23, the resin distribution on the two surfaces is similar, but part of the black area in the left picture is replaced by the gray area in the right picture. Since the pressure and processing time of the prepreg in the two pictures are the same, the resin asperities deformation is similar. However, in the picture on the right, part of the resin asperities is bonded to the resin asperities on the other layer of prepreg, and the resin surface is damaged when peeling off and it appears gray. (b) The two samples in Figure 24 were made with a laying pressure of 1 N/mm. The laying speed on the left was 100 mm/s, and the laying speed on the right was 200 mm/s. As can be seen in Figure 24, the size and distribution of the resin asperities of the two are similar, but the gray area of the resin asperities on the left is obviously larger than that on the right. Under the same pressure, the differences in laying speeds do not result in obvious differences in the morphology of the resin asperities, which is also consistent with the creep characteristics; that is, the viscous flow is relatively slow. However, as the processing time increases, the degree of interpenetration of molecular chains on both sides of the interface increases, and the resin interface between the two layers of prepreg becomes less obvious. Therefore, the peeling force of the sample produced by slow laying is large, but the peeling damage is also serious. (c) The two samples in Figure 25 were made at a laying speed of 100 mm/s. The laying pressure on the left was 1 N/mm and the pressure on the right was 3 N/mm. As can be seen in Figure 25, the sizes and distribution of the resin asperities of the two are significantly different. The resin asperities on the right seems to have more wrinkles and a larger contact area under greater pressure, and the edge of the resin island has become more blurred relative to the left side. The impact of laying pressure on interlayer adhesion mainly occurs in the surface rearrangement stage. The increase in the pressure applied to the prepreg leads to expansion of the resin asperities, and this expansion should be caused by closer contact; that is, an increase in the laying pressure will result in a larger actual contact area of the resin asperities (d) The left and right samples in Figure 26 were made at 3 N/mm pressure, 100 mm/s speed and 5 N/mm pressure, 200 mm/s speed. The processing conditions of the two are different, and the resulting surface morphology is also different, but the average peel force is 59.57 N and 59.37 N, respectively, which are almost the same. As can be seen from Figure 26, the actual contact area between the prepreg layers Comparison of the original surface of the prepreg and the bonding surface. Comparison of the surface of samples laid at high and low speeds. Comparison of the surface of high- and low-pressure laying samples. Comparison of the surface of the samples laid at low pressure and low speed, high pressure and high speed.
In the above analysis, there is a question that needs to be answered, which is: Why does the degree of molecular chain interpenetration increase with processing time? If the contact surface formed by the deformation of the resin asperities after pressure is irreversible, the time of molecular chain diffusion should be independent of the pressure time, and the molecular chain will diffuse freely until the interface disappears Schematic diagram of elastic deformation recovery of resin asperities.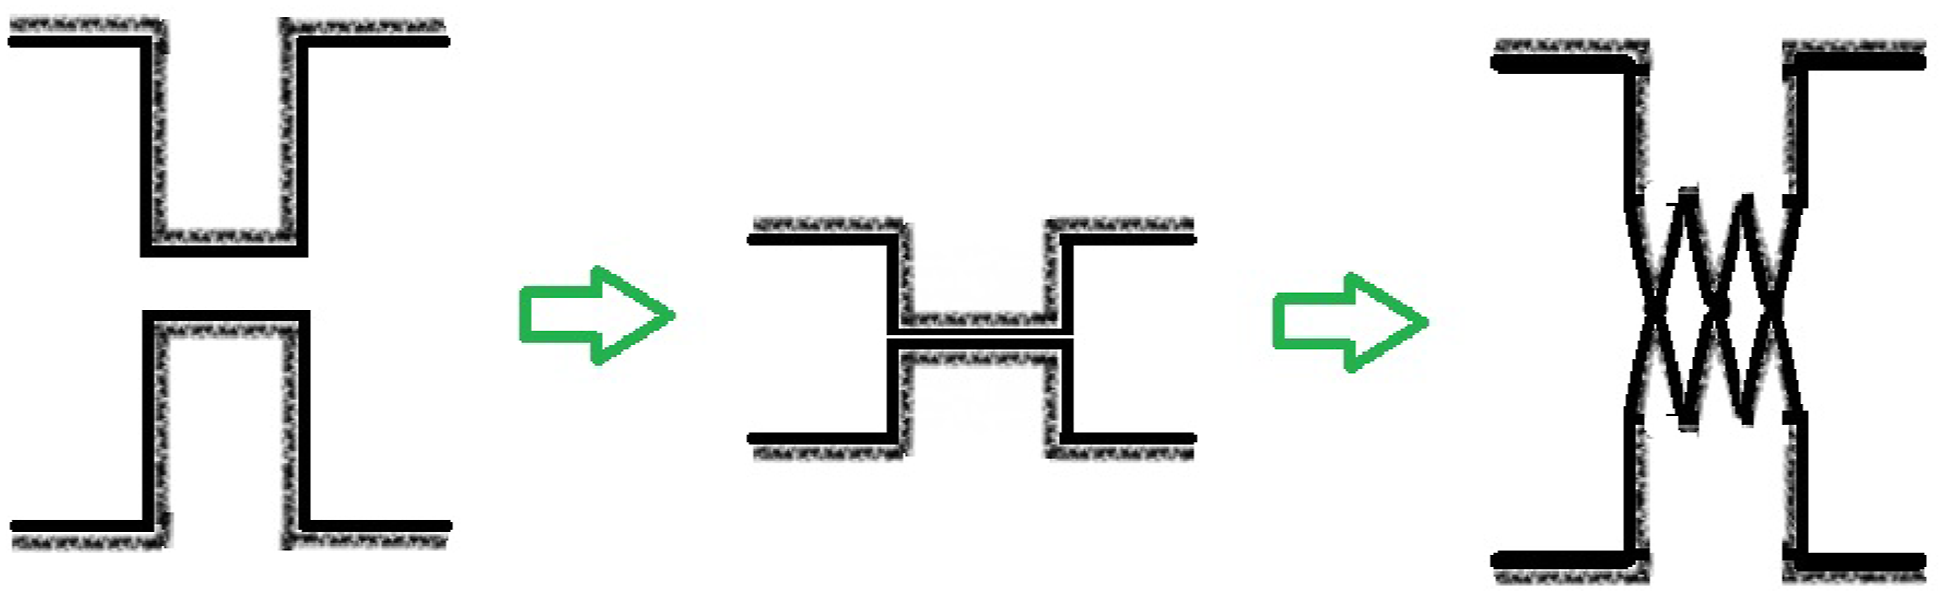
Analysis of the results of the peeling speed experiment
Through the above laying test, the following Laying speed-peeling energy logarithmic curve under different peeling speed.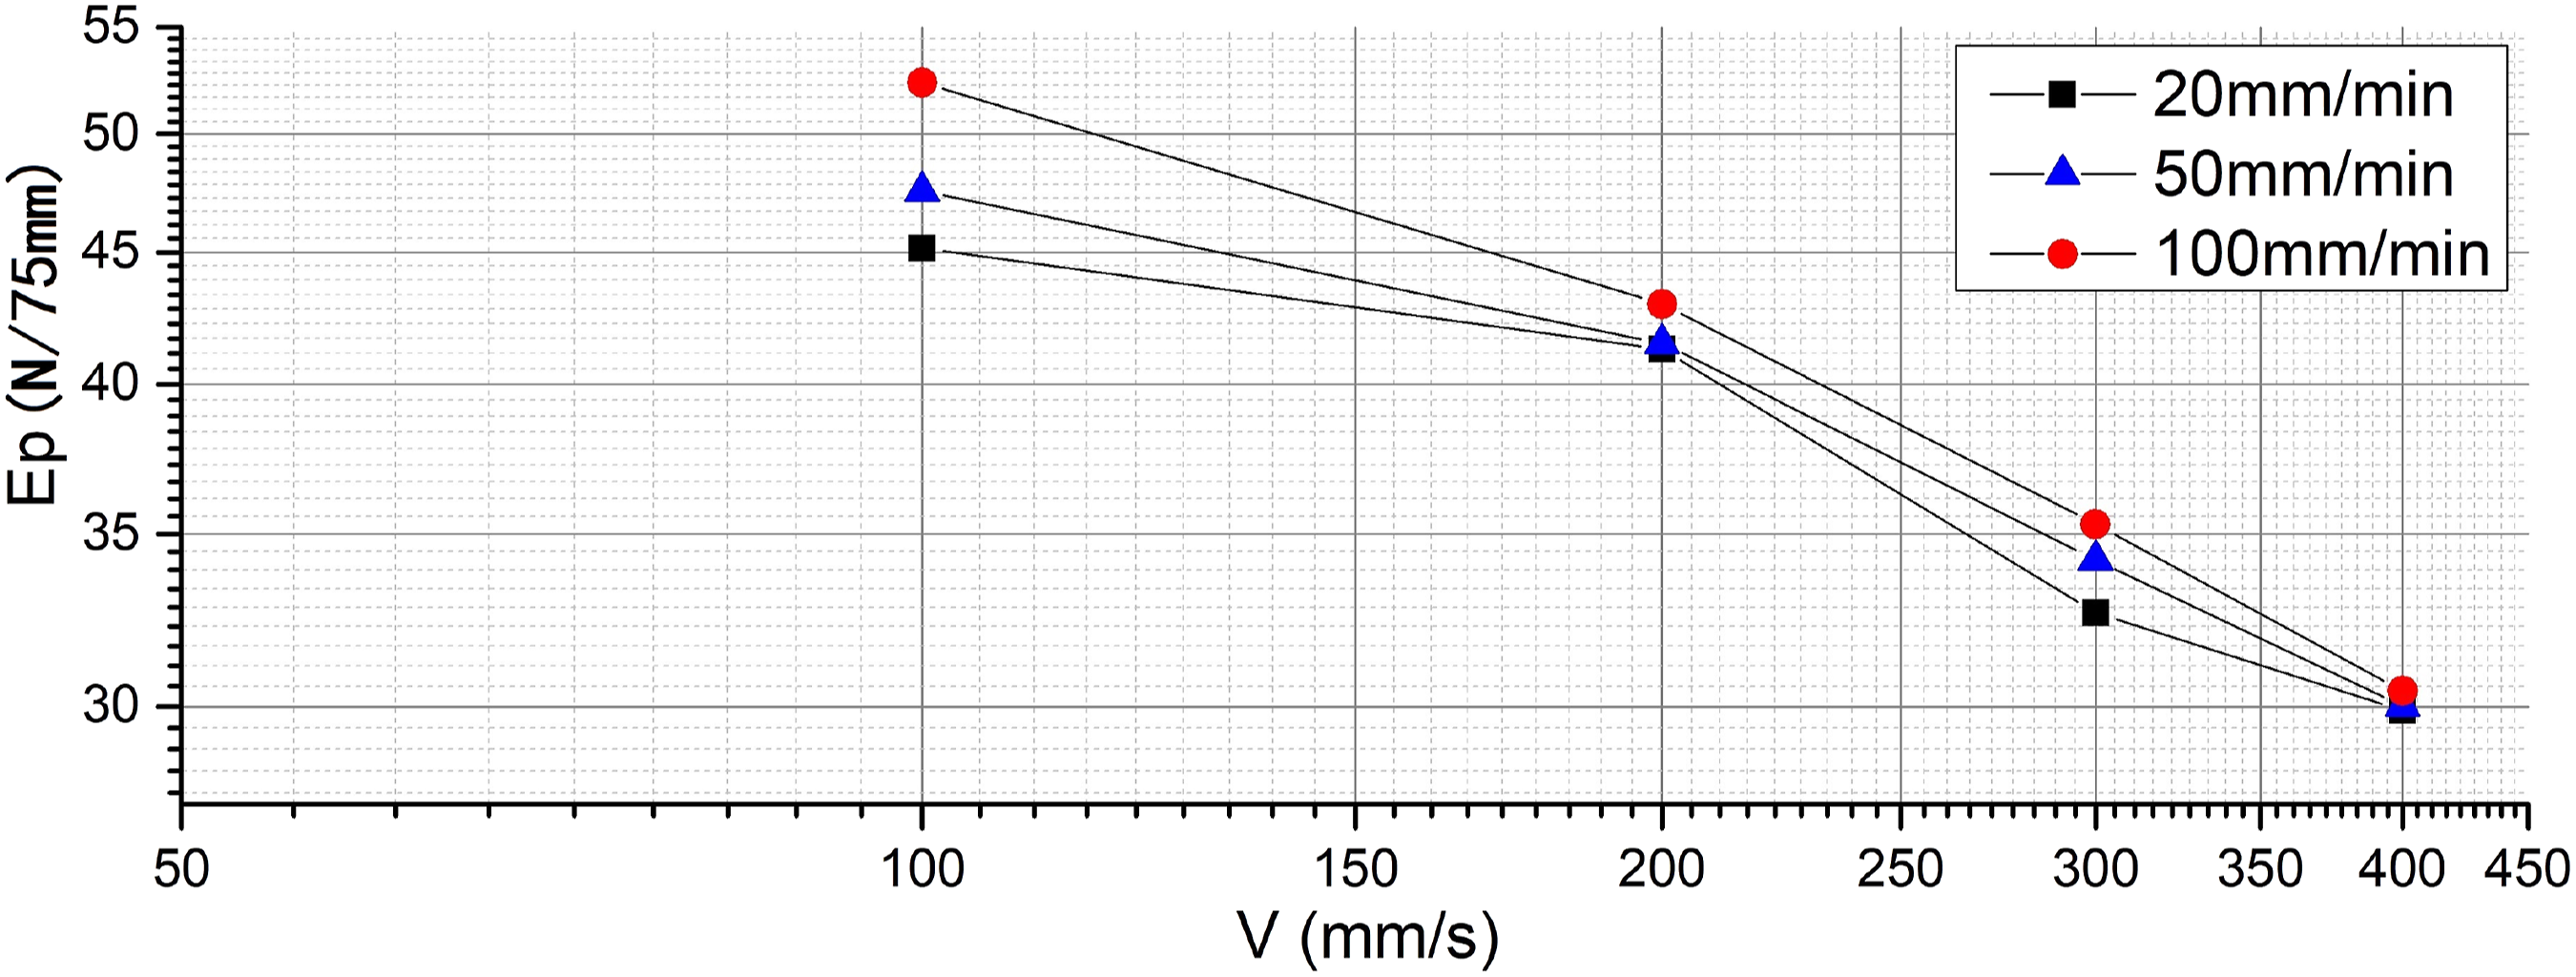
It can be seen from the above curve that, as a whole, when the peeling speed increases, the peeling force measured by the experiment shows an increasing trend. This effect is obvious when the laying speed is less than 200 mm/s, but it is not obvious when the laying speed is greater than 200 mm/s. In the high-speed stage, the difference in the peel force measured at the three peeling speeds is very small, and the slope of the three
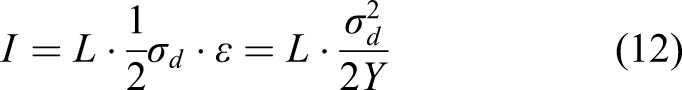
The reason for the above situation is that as the peeling speed increases, the resin shear force increases, and the energy of viscous flow loss increases; that is, the dissipation energy D in the formula
The results of the peeling speed experiment further prove that there are two stages of bonding between the prepreg layers, and the turning point of the two stages occurs between the laying speed of 100 mm/s to 200 mm/s.
Experiment summary
Based on the above three experiments, we divide the interlayer bonding process of prepreg into two stages, namely: 1) Diffusion stage during high-speed laying. In stage of 2) Viscous stage during low-speed laying. When
Based on the above discussion, the phase diagram of the interface formation when M21 prepreg is laid at 40°C is given, as shown in Figure 29. Phase diagram of M21 prepreg laying interface formation.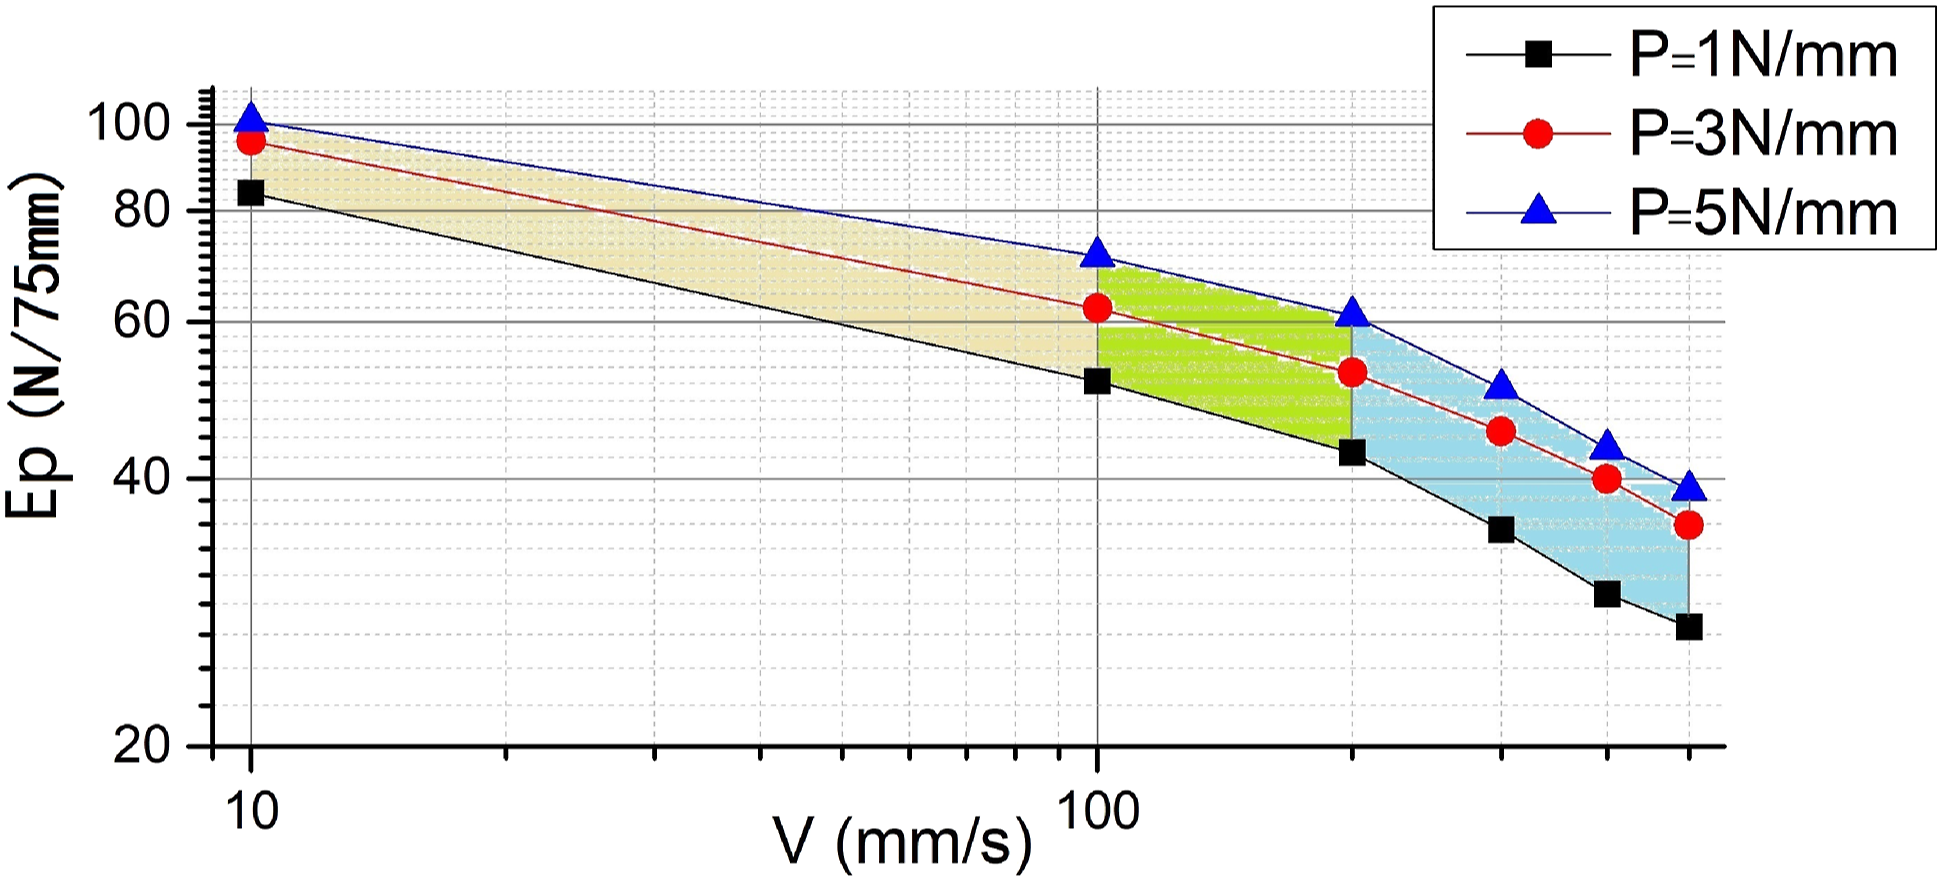
The left area in Figure 29 is the dominant stage of viscous deformation; the main form of peeling failure is cohesive failure. In the right area, the dominant effect is diffusion, and the main form of peeling failure is interface failure. The middle area is the transition stage.
Conclusion
During AFP process, the bonding strength of the prepreg and the form of failure during peeling depend on the placement speed and placement pressure and other process conditions, such as laying temperature and humidity. In this study, by conducting laying-peeling experiment on a special high-speed laying experiment platform, the laying speed-peeling energy curve under different laying pressures/peeling speeds was given. According to experiment results, the interlayer bonding process of prepreg is divided into two stages: the diffusion-dominated phase during high-speed laying and the viscous deformation-dominated phase during low-speed laying. The experimental results prove that the dividing point of the two stages is between 100 mm/s and 200 mm/s of laying speed. In the viscous deformation-dominated phase, the main reason for the increase of peeling energy is the viscous flow of the resin. The relationship between peeling energy and laying speed is close to
When the laying temperature is determined, the methods to improve the bonding strength between the prepreg layers mainly include slowing down the laying speed and increasing the laying pressure. From the conclusion above, it can be seen that slowing down the laying speed may cause the prepreg to be unable to separate without damage, and will also reduce productivity. Therefore, in the case of the same bonding strength requirements, high pressure and fast laying should be selected as far as possible.
Although the above experiment proves the existence of the two stages of diffusion and viscosity, the maximum speed of the laying experiment platform is only 500 mm/s. Thus, this study did not explore the mechanism of adhesion between prepreg layers when the laying speed is further increased. In fact, due to the viscous nature of the prepreg resin asperities, its initial deformation under compaction is not a complete step change, but should still have an observable slope. In other words, when the laying speed is further increased, it is possible to observe the third stage, the elastic deformation stage, where the slope of the
Footnotes
Declaration of conflicting interests
The author(s) declared no potential conflicts of interest with respect to the research, authorship, and/or publication of this article.
Funding
The author(s) received no financial support for the research, authorship, and/or publication of this article.